a genome-wide association study of malting quality across
TRANSCRIPT
A genome-wide association study of malting quality across eight US barley breeding programs
Mohammadi, M., Blake, T. K., Budde, A. D., Chao, S., Hayes, P. M., Horsley, R. D., ... & Smith, K. P. (2015). A genome-wide association study of malting quality across eight US barley breeding programs. Theoretical and Applied Genetics, 128(4), 705-721. doi: 10.1007/s00122-015-2465-5
10.1007/s00122-015-2465-5
Springer
Version of Record
http://cdss.library.oregonstate.edu/sa-termsofuse
1 3
Theor Appl Genet (2015) 128:705–721DOI 10.1007/s00122-015-2465-5
ORIGINAL PAPER
A genome‑wide association study of malting quality across eight U.S. barley breeding programs
Mohsen Mohammadi · Thomas K. Blake · Allen D. Budde · Shiaoman Chao · Patrick M. Hayes · Richard D. Horsley · Donald E. Obert · Steven E. Ullrich · Kevin P. Smith
Received: 3 October 2014 / Accepted: 17 January 2015 / Published online: 10 February 2015 © Springer-Verlag Berlin Heidelberg 2015
distributed throughout the genome. Association mapping was performed for individual breeding populations and for combined six-row and two-row populations. Only 16 % of the QTL we report here had been detected in prior bi-parental mapping studies. Comparison of the analyses of the combined two-row and six-row panels identified only two QTL regions that were common to both. In total, 108 and 107 significant marker-trait associations were iden-tified in all six-row and all two-row breeding programs, respectively. A total of 102 and 65 marker-trait associations were specific to individual six-row and two-row breeding programs, respectively indicating that most marker-trait associations were breeding population specific. Combining datasets from different breeding program resulted in both the loss of some QTL that were apparent in the analyses of individual programs and the discovery of new QTL not identified in individual programs. This suggests that simply increasing sample size by pooling samples with different breeding history does not necessarily increase the power to detect associations. The genetic architecture of malting
Abstract Key message We report malt quality QTLs relevant to breeding with greater precision than previous mapping studies. The distribution of favorable alleles suggests strategies for marker‑assisted breeding and germplasm exchange.Abstract This study leverages the breeding data of 1,862 barley breeding lines evaluated in 97 field trials for genome-wide association study of malting quality traits in barley. The mapping panel consisted of six-row and two-row advanced breeding lines from eight breeding popula-tions established at six public breeding programs across the United States. A total of 4,976 grain samples were subjected to micro-malting analysis and mapping of nine quality traits was conducted with 3,072 SNP markers
Communicated by P. Langridge.
Electronic supplementary material The online version of this article (doi:10.1007/s00122-015-2465-5) contains supplementary material, which is available to authorized users.
M. Mohammadi · K. P. Smith (*) Department of Agronomy and Plant Genetics, University of Minnesota, 411 Borlaug Hall, 1991 Upper Buford Circle, St. Paul, MN 55108-6026, USAe-mail: [email protected]
T. K. Blake Department of Plant Sciences and Plant Pathology, Montana State University, Bozeman, MT 59717, USA
A. D. Budde USA Cereal Crop Research Unit, USDA-ARS, 502 Walnut St., Madison, WI 53726, USA
S. Chao USDA-ARS-BRL, 1605 Albrecht Blvd. N, Fargo, ND 58102, USA
P. M. Hayes Department of Crop and Soil Science, Oregon State University, Corvallis, OR 97331, USA
R. D. Horsley Department of Plant Sciences, North Dakota State University, Fargo, ND 58108, USA
D. E. Obert Limagrain Cereal Seeds, 2040 SE Frontage Road, Fort Collins, CO 80525, USA
S. E. Ullrich Department of Crop and Soil Sciences, Washington State University, Pullman, WA 99164, USA

706 Theor Appl Genet (2015) 128:705–721
1 3
quality and the distribution of favorable alleles suggest strategies for marker-assisted selection and germplasm exchange.
Introduction
Malting quality in barley (Hordeum vulgare L.) is deter-mined by a complex suite of traits (Fox et al. 2003). For some of these traits, there is consensus among the end-users for a target value while for other traits the specific tar-get will depend on the market class (two-row or six-row), beer style, and brewing process. In the U.S., brewers who are members of the American Malting Barley Associa-tion (AMBA; http://ambainc.org) have defined acceptable ranges and desired target values for 18 barley and malting quality traits. Barley producers that grow industry-endorsed cultivars that meet these standards will generally receive a premium price that is higher than that for feed barley. Developing malting barley cultivars through breeding requires evaluation of large numbers of lines for these malt-ing quality traits. Measuring some of the more important quality traits involves malting individual grain samples and subjecting them to the first stages of brewing to make wort. While this process has been scaled down to accommodate research samples, it is laborious and expensive and, thus, a limiting step for breeders desiring to improve malt quality (Schmitt and Budde 2010). From such analyses, selection can be imposed for multiple traits including but not limited to kernel weight, kernel plumpness, malt extract, barley protein, wort protein, soluble/total ratio (Kolbach index), diastatic power, α-amylase, and β-glucan (Clancy and Ull-rich 1988). Characterizing the genetic architecture of these quality traits would facilitate marker-assisted breeding methods, which could both increase the speed and decrease the cost of breeding malting barley cultivars.
Several bi-parental mapping studies have been con-ducted to identify quantitative trait loci (QTL) for malt-ing quality traits. Within North American breeding germ-plasm, these studies have used the six-row cultivar Morex and two-row cultivar Harrington, which were the industry standards for malting quality in the 1980’s and 90’s (Ras-musson and Wilcoxon 1979; Harvey and Rossnagel 1984). To generate ample molecular markers for mapping and sufficient phenotypic variation for quality traits, these par-ents were used in wide crosses. A two-row (Harrington) by six-row (Morex) population was generated by Marquez-Cedillo et al. (2000). Morex was also crossed with a feed barley parent to generate the Steptoe × Morex population (Kleinhofs et al. 1993; Hayes et al. 1993) and with Dick-too to generate the winter by spring habit cross of Dick-too × Morex (Oziel et al. 1996). QTL studies conducted with these mapping populations have identified 70 QTL
associated with a suite of malting quality traits (Fig. 1). Several QTL of note that have received additional study are located on the short arm of chromosome 7H and are asso-ciated with malt extract, α-amylase, and diastatic power (Han et al. 1997, 2004). Another QTL region associated with malt extract, diastatic power, β-glucan, and α-amylase initially identified in the Steptoe × Morex population was fine-mapped on the short arm of chromosome 4H near the telomere (Gao et al. 2004).
Despite the wealth of genetic information accumulat-ing for malting quality in barley and plant traits in general, translation to crop improvement has been limited (Bernardo 2008). This barrier to application of markers in breeding is due, in part, to population specificity of QTL and QTL by environment interactions (Podlich et al. 2004; Holland 2007; Sneller et al. 2009). One particular challenge in breeding is that QTL identified in wide-cross mapping pop-ulations may not be segregating in breeding program popu-lations. This is the case for the two malting quality QTL on 4H and 7H described above within the breeding program at the University of Minnesota (Condon et al. 2008). To generate QTL information on malting quality that will be more useful in breeding applications, it would be desirable to study the genetic architecture of quality in elite breed-ing germplasm. Association mapping can be used to iden-tify QTL using mapping panels that are designed for a specific context and that may be segregating for more than two alleles at a locus (Jannink et al. 2001). Panels designed from locally adapted breeding material tested over several years and environments can be used to identify QTL that are more relevant to breeding and effective in the target breeding environment (Pozniak et al. 2012).
The success and the power of genome-wide association studies (GWAS) to detect QTL depends, in part, on suffi-cient polymorphic markers distributed across the genome to ensure adequate linkage disequilibrium (LD) between markers and QTL (Arbelbide et al. 2006). Powerful gen-otyping technologies are now available to provide the desired level of marker density at increasingly affordable costs. Currently, single nucleotide polymorphism (SNP) Oligo Pool Assay (OPA) and iSelect genotyping in barley provide over 7,000 mapped SNP loci, which can be used in a high-throughput genotyping format (Close et al. 2009; Comadran et al. 2012). In barley, this SNP platform has been used with elite breeding panels to conduct associa-tion mapping for several disease resistance traits (Massman et al. 2011; Zhou and Steffenson 2013) and food quality traits (Mohammadi et al. 2014).
To effectively leverage current marker technologies to conduct GWAS, researchers have utilized historic data from long-term breeding trials thereby substantially reducing the cost of genetic studies (Podlich et al. 2004; Sneller et al. 2009; Crossa et al. 2007). Mapping with such unbalanced
707Theor Appl Genet (2015) 128:705–721
1 3
datasets requires methods to estimate breeding line values that account for experimental design effects such as year, location, and trial. These estimates can be acquired by extracting trial effects in a mixed-model and subsequently using trial effects to adjust phenotypic values in a two-step process (Stich et al. 2008). Alternatively, mixed-models can be used to extract the best unbiased linear estimates (BLUEs) for entries included in the association panel in one step (Pozniak et al. 2012). In addition to adjusting for
trial effects to obtain accurate genetic estimates of breed-ing lines, it is also necessary to account for population structure existing in association panels (Zhao et al. 2007). Population structure is defined by differential relatedness among subgroups and is mainly caused by breeding his-tory. Relatedness among individuals that is not accounted for in models used to detect QTL can result in false posi-tive marker-trait associations (Pritchard et al. 2000). In bar-ley, major subpopulation structure has been associated with
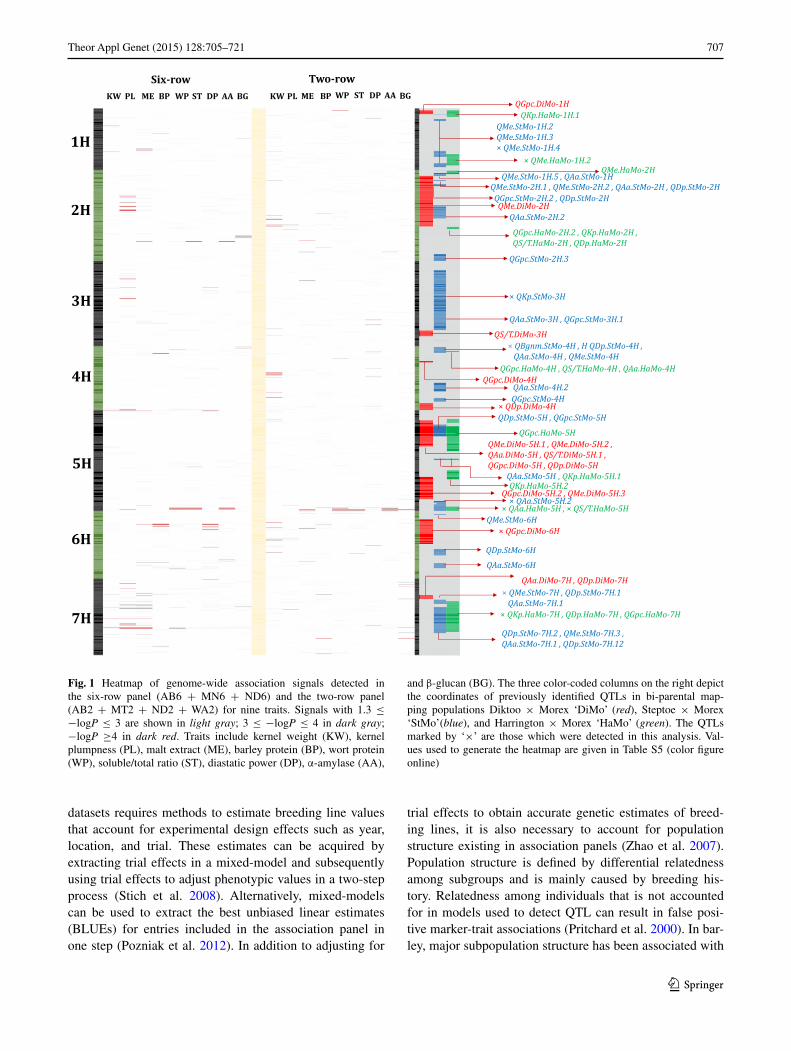
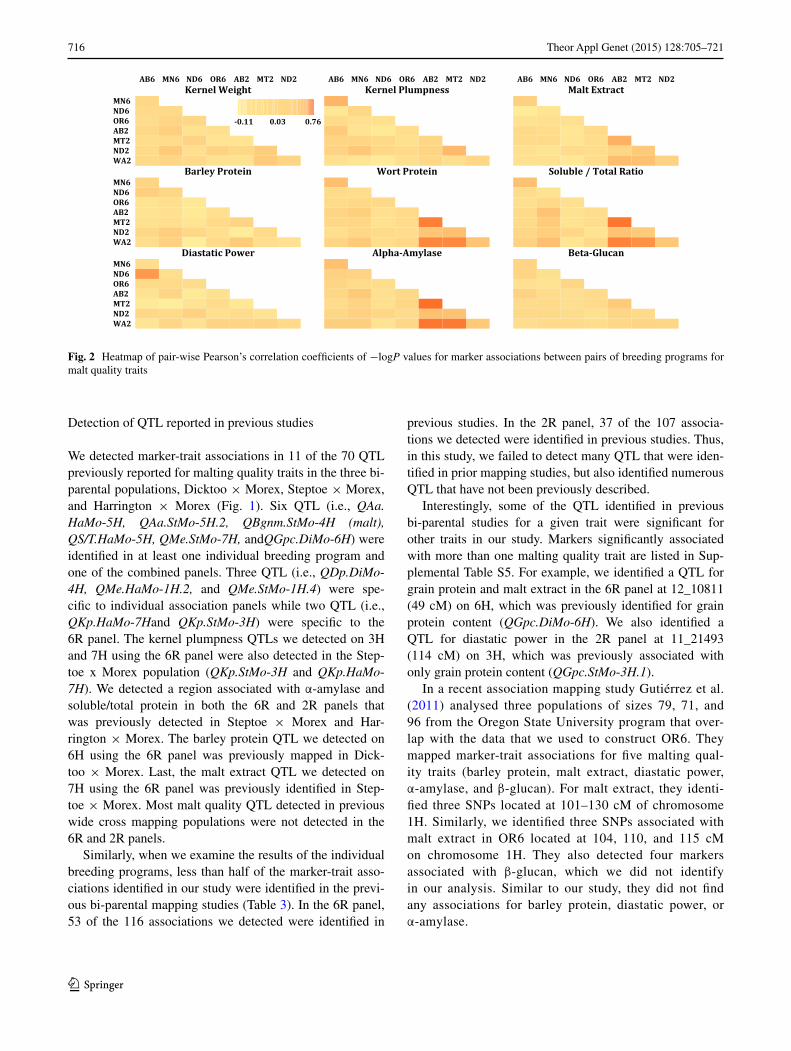
Fig. 1 Heatmap of genome-wide association signals detected in the six-row panel (AB6 + MN6 + ND6) and the two-row panel (AB2 + MT2 + ND2 + WA2) for nine traits. Signals with 1.3 ≤ −logP ≤ 3 are shown in light gray; 3 ≤ −logP ≤ 4 in dark gray; −logP ≥4 in dark red. Traits include kernel weight (KW), kernel plumpness (PL), malt extract (ME), barley protein (BP), wort protein (WP), soluble/total ratio (ST), diastatic power (DP), α-amylase (AA),
and β-glucan (BG). The three color-coded columns on the right depict the coordinates of previously identified QTLs in bi-parental map-ping populations Diktoo × Morex ‘DiMo’ (red), Steptoe × Morex ‘StMo’(blue), and Harrington × Morex ‘HaMo’ (green). The QTLs marked by ‘×’ are those which were detected in this analysis. Val-ues used to generate the heatmap are given in Table S5 (color figure online)
708 Theor Appl Genet (2015) 128:705–721
1 3
the market classes of six-row and two-row, growth habit classes of winter and spring, geographic origin, and breed-ing program (Malysheva-Otto et al. 2006; Hamblin et al. 2010; Zhou et al. 2012).
An important goal of the U.S. Barley Coordinated Agri-cultural Project (Barley CAP http://www.barleycap.org) was to assemble large sets of marker and trait data that could be used to conduct GWAS in elite breeding germ-plasm. In this study, malting quality data from standard breeding trials conducted over a 4-year period from eight U.S. barley breeding programs and 3,072 SNP markers were used in association mapping. Analyses conducted within and across breeding programs reveal the genetic architecture of these traits and segregation of favorable alleles within elite breeding germplasm. This insight is used to suggest strategies for germplasm exchange among breeding programs and marker-based selection to improve malting quality.
Materials and methods
Germplasm, association mapping panels, and malting quality traits
To conduct association mapping, we assembled malt-ing quality data from eight barley breeding programs in the United States that participated in the Barley CAP. The germplasm included both six-row(spring and winter growth habit) and two-row spring barley breeding lines selfed to at least the F4 generation that were representative of breed-ing germplasm in the eight breeding programs from 2006 to 2009. Each breeding program contributed 96 entries in each of the 4 years of the project. The six-row spring breeding lines were contributed by USDA at Aberdeen, ID (AB6), University of Minnesota (MN6), North Dakota State University (ND6), and the six-row winter breeding lines were contributed by Oregon State University (OR6), and the two-row spring breeding lines were contributed by USDA at Aberdeen, ID (AB2), Montana State University (MT2), North Dakota State University (ND2), and Wash-ington State University (WA2). The lines that were evalu-ated for malting quality were chosen as part of the routine breeding procedures for each program and in some cases included all 96 lines, while in other cases included only a subset of the entries. Some lines designated as food barley were not included in the analysis because food barley lines often have high levels of β-glucan and are hulless, which is undesirable in malting barley. Lines designated as feed barley were retained in the analyses because the distinction between malt and feed is not always clear. Because most of the breeding programs only submitted lines for malt analy-sis that would be under consideration for release as malting
varieties, we reasoned that truly non-malting types should be excluded. Initially, association mapping was conducted on each individual breeding population. Subsequently, three six-row spring (AB6, MN6, and ND6) and four two-row spring (AB2, MT2, ND2, and WA2) breeding popula-tions were combined to make joint six-row (6R) and joint two-row (2R) association mapping panels, respectively. Analysis of the OR6 program has been previously reported (Gutiérrez et al. 2011). Each breeding program generated their micro-malting datasets by shipping a bulked sample of the replicates of each entry in each of their breeding tri-als to the USDA–ARS Cereal Crops Research Unit located in Madison, WI, where micro-malting assessments were conducted following American Society of Brewing Chem-ists protocols (ASBC 1992). Full description of methods used for malt quality measurements is detailed in Budde et al. (2010). Each sample was analysed for nine traits including kernel weight (mg), kernel plumpness (%), malt extract (%), barley protein (%), wort protein (%), soluble/total protein ratio, diastatic power (°ASBC), α-amylase (20°DU), and β-glucan (ppm).
Experimental design and phenotypic value estimations
Malting quality data were generated from grain samples obtained from yield trials conducted by each breeding pro-gram in randomized complete block designs in multiple locations between 2006 and 2010. Each breeding program used two to nine common check cultivars in all years to account for environmental effects and to allow for pheno-typic adjustment across trials. Phenotypic adjustment for individual breeding programs (hereafter called panels) as well as the joint 6R and 2R panels was conducted using Proc Mixed procedure in SAS v 9.2 (SAS Institute 2008) as described below. Pearson’s correlation coefficients among traits were calculated in R environment 2.15.3 (R Devel-opment Core Team 2013). To calculate a single phenotypic value for each breeding line, we fit a mixed-model for each trait within each panel by treating lines as fixed effects and trials and interaction of lines and trials as random effects. The common set of check cultivars in each panel allowed for extraction of solutions for trial effects as well as inter-action of trials and lines effects. Line effects were signifi-cant (P < 0.01) for all traits in each panel. Then, we used the LSMEANS statement in SAS to obtain BLUEs for each trait and line (Pozniak et al. 2012) within each panel. This process is similar to the two-step adjustment procedure, which uses best linear unbiased prediction (BLUP) solu-tions of trial effects followed by numerical adjustment of means. The combined 6R panel was comprised of 33 trials from AB6, MN6, and ND6. From these 33 trials, two tri-als were adjusted with only one common check cultivar and the remaining trials shared a minimum of three common

709Theor Appl Genet (2015) 128:705–721
1 3
check cultivars. The combined 2R panel consisted of 38 tri-als from AB2, MT2, ND2, and WA2, of which seven trials shared only one common check cultivar and the rest shared a minimum of three common check cultivars. Similar mixed-model analyses were performed for the combined 6R and 2R datasets and the LSMEANS statement in SAS was used to obtain BLUEs across lines and traits. Table 1 summarizes the number of trials and lines for each of the mapping panels. The differences between the total number of entries assessed in each panel and the number of entries used for association mapping analysis are primarily due to the removal of genetic stocks and food barley lines. Our intent was to retain only malting barley lines in the analy-sis, however, in the case of WA2, some feed barley lines were retained in the analysis because for WA2 panel, the majority of lines (186) were feed barley and only 104 were designated as malt barley.
Molecular marker data and linkage disequilibrium
DNA extracted from a single plant from each line in the study was genotyped. All of the lines included in the study were advanced to at least the F4 generation and genotyped with 3,072 SNP markers using two Illumina Golden Gate (Illumina Inc., San Diego, CA) Oligonucleotide Pool Assays known as BOPA1 and BOPA2 (Close et al. 2009; Szucs et al. 2009). For each individual panel and for the joint 6R and 2R panels, we extracted genotype data from The Triticeae Toolbox database (http://www.triticeaecap.org/; Blake et al. 2012) by querying for line names with the genetic map developed by Muñoz-Amatriaín et al. (2011). Markers with greater than 20 % missing genotype data across the germplasm in each AM panel and markers with conflicting genotyping data were excluded from further analysis. Assessment of LD was conducted by calculation of R2 statistics between markers per chromosome and sub-sequently aggregated across all chromosomes using TAS-SEL (Bradbury et al. 2007; http://www.maizegenetics.net).
Association mapping
We performed association mapping analysis on individual breeding programs and combined 6R and 2R panels. The prior knowledge of population structure in U.S. barley germplasm reported by Hamblin et al. (2010) indicates that most of the individual membership in subpopulations may be explained by differences in inflorescence row type and growth habit, suggesting the existence of three sub-populations i.e., spring six-row malting barley, winter six-row malting barley, and spring two-row malting bar-ley. The same research group has also concluded that the best fit was a model describing subpopulations without admixture roughly representing the individual breeding programs. Therefore, we used an additive kinship matrix (K model) to account for individuals’ relatedness in each breeding program and in the joint populations character-ized by row type. After eliminating monomorphic markers and those with more than 20 % missing data, the remaining markers in each association panel were used for estimating individuals’ relatedness matrix. Our association genetics model included markers and kinship as fixed effects and the polygenic effect of line and error as random effects. Asso-ciation mapping was conducted using the EMMA pack-age in R environment 2.7.0 (R Development Core Team 2008), which uses the Efficient Mixed Model Association (EMMA) algorithm (Kang et al. 2008). The EMMA pack-age returns the maximum likelihood estimation of marker effect and likelihood ratio test of significance for marker-trait associations. For control of false discovery rate (FDR), we considered a Bonferroni correction and a 5 % false dis-covery rate as described by Storey and Tibshirani (2003). A conservative Bonferroni −logP value of nearly 4.6 was derived by dividing P = 0.05 by the average total number of mapped markers across panels N = 2,091. A less con-servative −logP value of 2.8 was derived, based on the average of several panels and traits using the Storey and Tibshirani method. We therefore selected a −logP value of
Table 1 Characteristics of the trait and marker data sets for ten association mapping panels
a USDA at Aberdeen, ID (AB6), University of Minnesota (MN6), North Dakota State University (ND6), and Oregon State University (OR6) and two-row spring breeding programs i.e., USDA at Aberdeen, ID (AB2), Montana State University (MT2), North Dakota State University (ND2), and Washington State University (WA2). The 6R association panel is a joint panel of the three six-row spring breed-ing programs i.e., AB6 + MN6 + ND6 and the 2R association panel is a joint panel of the four two-row spring breeding programs i.e., AB2 + MT2 + ND2 + WA2
Characteristics AB2a MT2 ND2 WA2 2R AB6 MN6 ND6 6R OR6
Number of trials 6 5 12 15 38 6 14 22 59 17
Number of entries assessed in trials 182 351 155 323 1,011 98 474 194 966 200
Number of entries used for AM 182 315 151 290 938 98 474 192 764 160
Number of grain samples analysed 417 471 306 525 1,719 156 1,420 544 3,257 1,137
Number of markers used for AM 2,068 2,201 2,042 2,046 2,190 1,922 2,115 1,839 2,252 2,236
Average LD for adjacent markers (R2) 0.38 0.36 0.35 0.33 0.29 0.40 0.35 0.38 0.34 0.35

710 Theor Appl Genet (2015) 128:705–721
1 3
4.0 as a threshold for QTL detection that was on the con-servative side of this range. Marker effect was estimated using the rrBLUP package in R (Endelman 2011). For each significant marker-trait association, we passed the vector of a given significant marker alone and K matrix as the covari-ance structure of the random effect in ‘mixed.solve’ func-tion of rrBLUP package (Endelman 2011) to obtain the allele substitution effect when only that marker is in the model. Once we summarized all marker-trait associations for each trait, we identified those that were in close prox-imity (within 5 cM) and determined the LD between them. If the LD was greater than (R2 = 0.97), we concluded that the markers could be identifying the same QTL. We foot-noted two such cases where two adjacent markers that were in high LD such that the two markers likely represent two distinct haplotypes at a single locus rather than two tightly linked loci with opposite marker effects.
We used the SNP-based barley map reported by Muñoz-Amatriaín et al. (2011) as reference to build our tables containing mapped malting quality trait QTL. The rela-tive map positions of previously identified malting qual-ity QTL were determined by aligning markers with the genetic map developed by Muñoz-Amatriaín et al. (2011) with prior QTL studies (Han et al. 1997, 2004; Hayes et al. 1993; Hayes and Jones 2000; Marquez-Cedillo et al. 2000, Mather et al. 1997). We used the genomic data reposi-tory available at the GrainGenes database (http://www.graingenes.org) to obtain historical molecular markers associated with previously reported malting quality traits QTL. We then used the approximate position of flanking markers to highlight the genomic regions specifying these
QTL in our tables. Pearson’s correlation coefficients among −logP values between pairs of breeding programs were calculated using the “pairwise.complete.obs” option in the “cor” function in R environment 2.15.3 (R Development Core Team 2013).
Results
Trait correlations
We calculated pair-wise trait correlations for each panel based on the trait estimates obtained from mixed-model analyses (Table 2). The summary statistics and variance components for each trait in each breeding program are given in Supplemental Table S1. The correlation matrices for the individual panels are given in Supplemental Table S2. Protein content was negatively correlated with malt extract and positively correlated with diastatic power in all association panels consistent with previous studies (Ras-musson and Glass 1965; Ullrich et al. 1981; Eagles et al. 1995). The relationship between malt extract and diastatic power varied among the panels. The correlation was posi-tive in AB2, negligible in MT2, ND2, WA2, and OR6, and negative in MN6, ND6, and AB6. Diastatic power was found to be negatively correlated with malt extract in some studies (Hartog and Lambert 1953; Arends et al. 1995), although some modest positive genotypic correlations have also been reported (Eagles et al. 1995). The correlation between malt extract and wort protein and the correlation between α-amylase and diastatic power were positive and
Table 2 Pearson’s correlation coefficients of nine malting quality traits for the six-row combined association panel (6R) with 745 individuals (upper right triangle) and for the two-row combined association panel (2R) with 938 individuals (lower left triangle)
a KW Kernel weight, PL kernel plumpness, ME malt extract, BP barley protein, WP wort protein, ST soluble/total ratio, DP diastatic power, AA α-amylase and BG β-glucanb Magnitudes of correlations were color coded so to show correlations from low to high positive in orange to dark red color schemes and corre-lations from low to high negative in lime to dark green color schemesc Significance test of Pearson’s correlations was performed using t = r/sqrt[(1-r^2)/(N–2)] distribution with df = N−2. Non-significant values were denoted by “ns”
711Theor Appl Genet (2015) 128:705–721
1 3
substantial in two-row panels while negligible in six-row panels. Several correlations were consistent across all pan-els. Barley protein content was positively correlated with diastatic power, wort protein and negatively correlated with soluble/total protein ratio. Alpha-amylase was positively correlated with wort protein and soluble/total ratio.
Markers and linkage disequilibrium
Association mapping was conducted to identify QTL for malting quality traits in the ten association panels. The num-ber of markers included in the analyses of the ten mapping panels ranged from 1,829 to 2,252 (Table 1). In general, our LD analysis revealed that LD persisted for up to 10 cM (data not shown) as has been shown previously in other analyses of this germplasm (Hamblin et al. 2010; Mass-man et al. 2011). Given the total genetic map of 1,127 cM (Muñoz-Amatriaín et al. 2011) used in this study, about 113 (1,127/10) polymorphic SNPs, evenly distributed across the genome are required to cover the entire genome for asso-ciation mapping (Zhou et al. 2014). Thus, an average of 2,091 SNPs per panel used in this study provides sufficient coverage for association mapping. Linkage disequilibrium decayed more rapidly in the combined panels (2R and 6R) compared to the individual panels. Nordborg et al. (2002) have shown that the decay of LD depends on the demo-graphic history of the population and that LD in local popu-lations (e.g., in our case individual breeding programs) may be stronger than global population (e.g., combined 6R and 2R panels). Consistent with our observation, Laido et al. (2014) reported a rapid decay of LD upon pooling of durum
wheat varieties with wild and domesticated durum acces-sions. The average LD for adjacent markers among the single program panels ranged from a minimum of 0.33 in WA2 to a maximum of 0.40 in AB6 (Table 1). In the com-bined panels, the average adjacent marker LD was slightly higher for 6R compared to 2R. For each association panel, we report the results for only those markers with −logP value equal or greater than 4 and with at least 10 individuals homozygous for the minor allele to insure adequate reliabil-ity of the estimate of the mean of the rare variants.
Comparison of six-row and two-row breeding germplasm
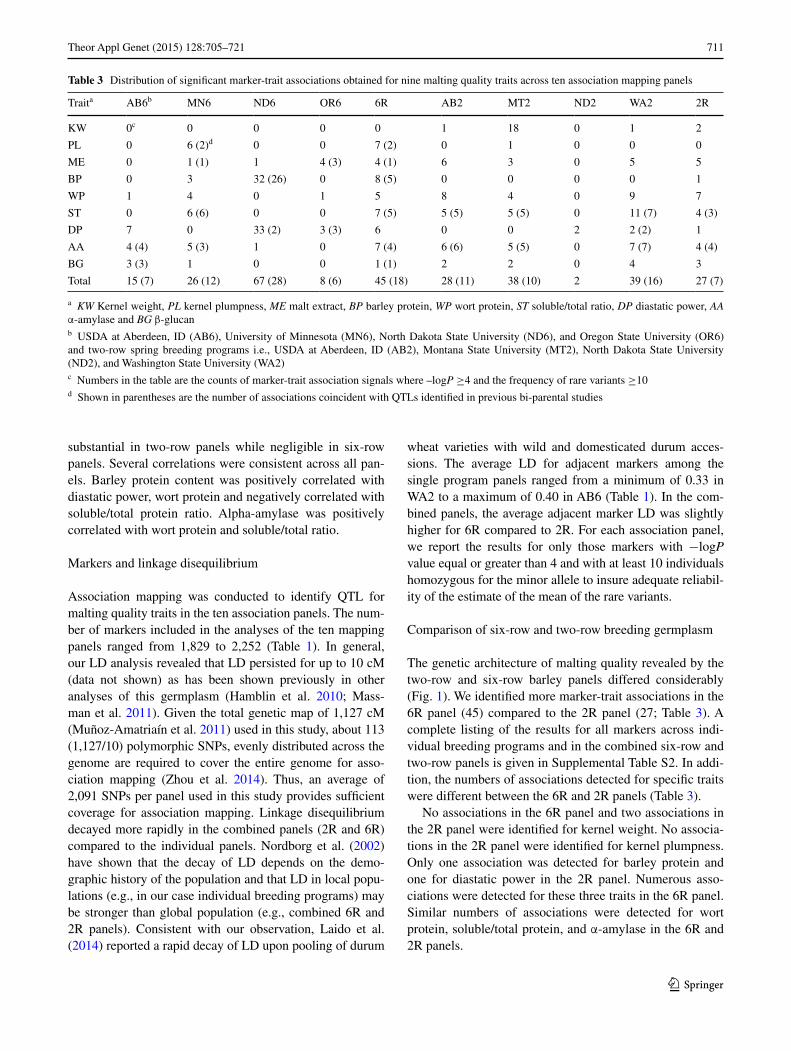
The genetic architecture of malting quality revealed by the two-row and six-row barley panels differed considerably (Fig. 1). We identified more marker-trait associations in the 6R panel (45) compared to the 2R panel (27; Table 3). A complete listing of the results for all markers across indi-vidual breeding programs and in the combined six-row and two-row panels is given in Supplemental Table S2. In addi-tion, the numbers of associations detected for specific traits were different between the 6R and 2R panels (Table 3).
No associations in the 6R panel and two associations in the 2R panel were identified for kernel weight. No associa-tions in the 2R panel were identified for kernel plumpness. Only one association was detected for barley protein and one for diastatic power in the 2R panel. Numerous asso-ciations were detected for these three traits in the 6R panel. Similar numbers of associations were detected for wort protein, soluble/total protein, and α-amylase in the 6R and 2R panels.
Table 3 Distribution of significant marker-trait associations obtained for nine malting quality traits across ten association mapping panels
a KW Kernel weight, PL kernel plumpness, ME malt extract, BP barley protein, WP wort protein, ST soluble/total ratio, DP diastatic power, AA α-amylase and BG β-glucanb USDA at Aberdeen, ID (AB6), University of Minnesota (MN6), North Dakota State University (ND6), and Oregon State University (OR6) and two-row spring breeding programs i.e., USDA at Aberdeen, ID (AB2), Montana State University (MT2), North Dakota State University (ND2), and Washington State University (WA2)c Numbers in the table are the counts of marker-trait association signals where –logP ≥4 and the frequency of rare variants ≥10d Shown in parentheses are the number of associations coincident with QTLs identified in previous bi-parental studies
Traita AB6b MN6 ND6 OR6 6R AB2 MT2 ND2 WA2 2R
KW 0c 0 0 0 0 1 18 0 1 2
PL 0 6 (2)d 0 0 7 (2) 0 1 0 0 0
ME 0 1 (1) 1 4 (3) 4 (1) 6 3 0 5 5
BP 0 3 32 (26) 0 8 (5) 0 0 0 0 1
WP 1 4 0 1 5 8 4 0 9 7
ST 0 6 (6) 0 0 7 (5) 5 (5) 5 (5) 0 11 (7) 4 (3)
DP 7 0 33 (2) 3 (3) 6 0 0 2 2 (2) 1
AA 4 (4) 5 (3) 1 0 7 (4) 6 (6) 5 (5) 0 7 (7) 4 (4)
BG 3 (3) 1 0 0 1 (1) 2 2 0 4 3
Total 15 (7) 26 (12) 67 (28) 8 (6) 45 (18) 28 (11) 38 (10) 2 39 (16) 27 (7)
712 Theor Appl Genet (2015) 128:705–721
1 3
The most striking result is the general lack of coincident QTL between six-row and two-row germplasm (Fig. 1). Only two regions were identified that had common marker-trait associations between 6R and 2R. The telomeric region of the long arm of 5H was associated with kernel plump-ness, wort protein, soluble/total protein, α-amylase in the 6R panel. The last three traits (wort protein, soluble/total protein, α-amylase), and malt extract and β-glucan were also detected in the 2R panel in that same region. The other region with coincident QTL was located on 7H where ker-nel plumpness and malt extract were identified in 6R and kernel plumpness was identified in 2R. All of the other QTL detected were specific to either two-row or six-row germplasm.
Since the allele frequencies and LD could differ between the 2R and 6R panels, it is possible that identical markers may not be significant in both panels, but closely linked markers may be significant. We identified 51 marker-trait associations, with –logP >4 and minor allele frequency >0.05 that were identified in either the 6R or 2R panel, but not in both (Table S2). These included associations for all traits except for kernel weight and kernel plumpness. In 29 out of the 51 cases (57 %), a significant association with a marker within 5 cM was detected, indicating the pres-ence of the QTL in both panels although associated with different SNP markers. In 22 cases (43 %), no marker-trait association was identified within 5 cM, indicating that the QTL is specific to only one panel. These 22 marker-trait associations represent a total of seven regions of which two were identified in 2R but not in 6R and five were identified in 6R but not in 2R. The two regions identified only in 2R include the telomeric region of chromosome 5H associated with malt extract and β-glucan and 3H (95 cM) associated with diastatic power. The five regions identified only in 6R include chromosome 4H (28 cM) associated with barley protein and wort protein, 6H (50 cM) associated with wort protein, the short arm of 5H (1 cM) associated with dia-static power, 6H (50 cM) associated with diastatic power, and 6H (81 cM) associated with α-amylase.
Consistency of marker-trait associations among individual breeding programs
The number of markers associated with one of the traits in individual breeding programs ranged from zero in many cases to 33 for diastatic power in the ND6 program (Table 3). Many of the markers associated with diastatic power were also associated with barley protein in the ND6 program and were localized to a region spanning from 50 to 65 cM on 6H (Table S2). This region appears to be of par-ticular importance to only the ND6 program for these two traits. Overall, the ND2 panel detected the fewest marker-trait associations while ND6 detected the most (Table 3).
In the six-row breeding programs, there were two regions where QTL for the same trait were detected by more than one program (Table 4). One region on 5H was detected for α-amylase by markers that are about 2 cM apart (12_31292 and11_10401) in the MN6 and AB6 pro-grams, respectively. However, the effect of the allele is in the opposite direction between the two programs suggest-ing that these may be two tightly linked QTL. Similarly, a region on 4H was detected for wort protein in the AB6 and OR6 panels. These markers (12_30540 and 11_10221) are 8 cM apart and thus they could also represent tightly linked QTL. In the two-row breeding programs, there were three regions where QTL for the same trait were detected by more than one program. The region on 5H that was asso-ciated with the five traits (wort protein, soluble/total pro-tein, α-amylase, malt extract and β-glucan; 183–188 cM), was consistently detected across all four two-row panels for four of the five traits. Nearby on 5H (172–176 cM), two QTL were detected for wort protein in the WA2 and AB2 panels. The third region on 4H (142–144 cM) is associated with diastatic power in the MT2 and ND2 panels.
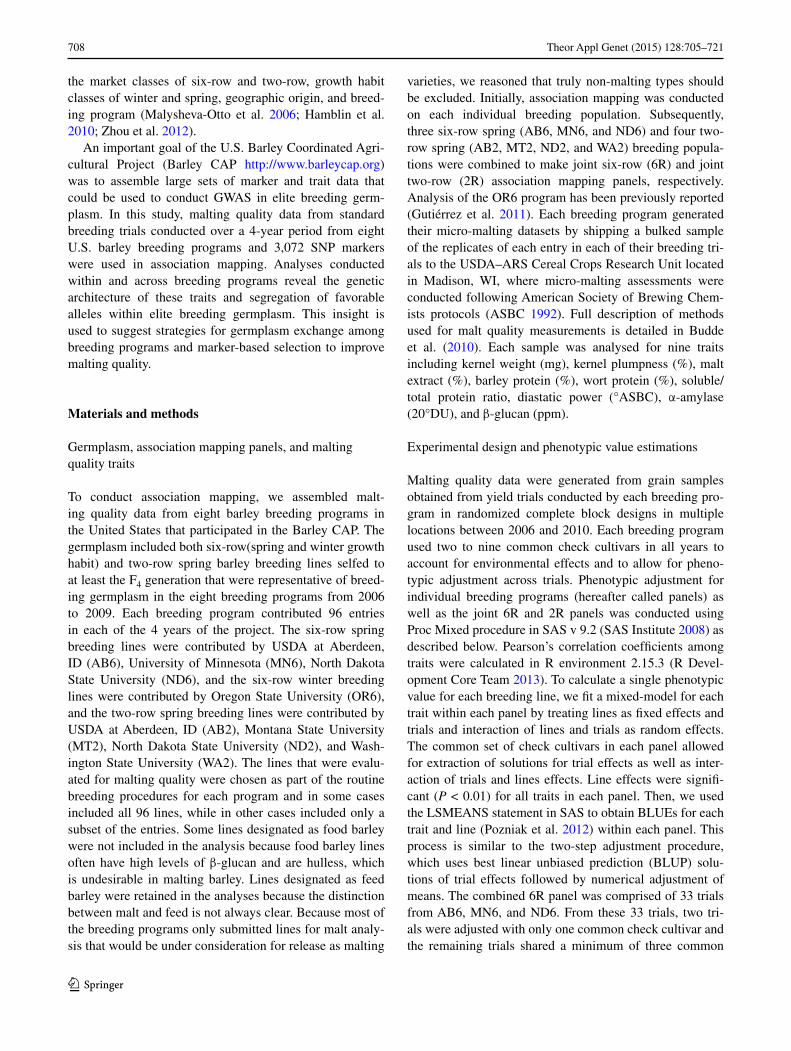
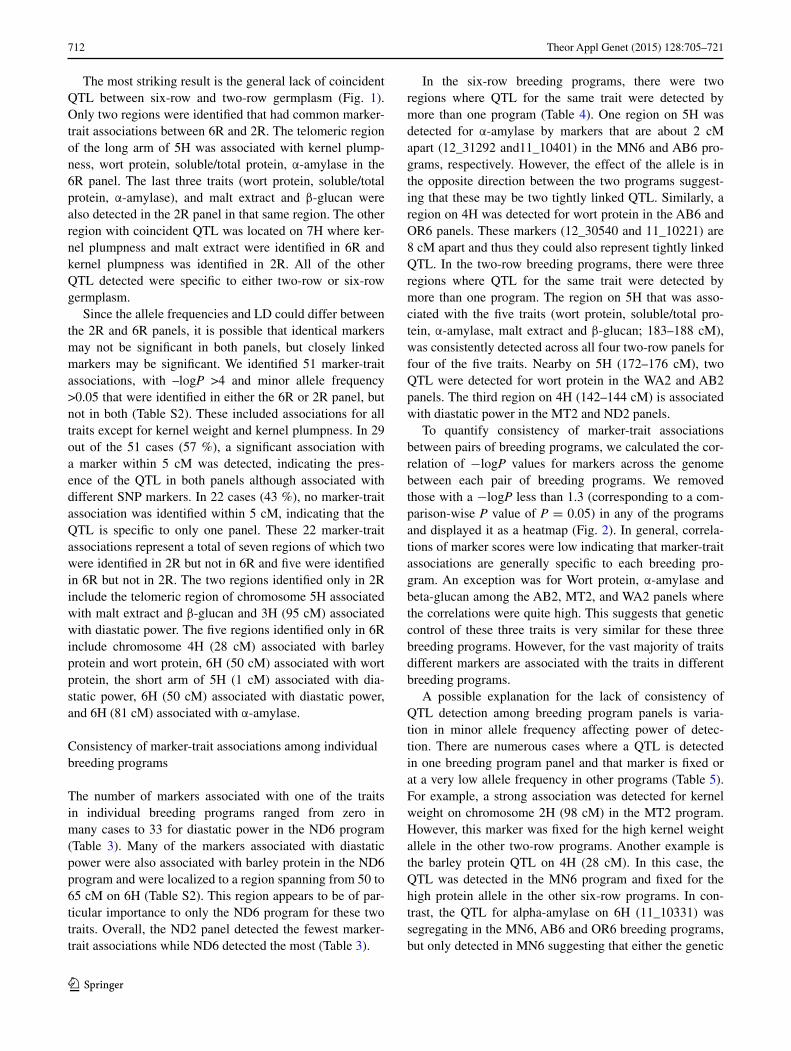
To quantify consistency of marker-trait associations between pairs of breeding programs, we calculated the cor-relation of −logP values for markers across the genome between each pair of breeding programs. We removed those with a −logP less than 1.3 (corresponding to a com-parison-wise P value of P = 0.05) in any of the programs and displayed it as a heatmap (Fig. 2). In general, correla-tions of marker scores were low indicating that marker-trait associations are generally specific to each breeding pro-gram. An exception was for Wort protein, α-amylase and beta-glucan among the AB2, MT2, and WA2 panels where the correlations were quite high. This suggests that genetic control of these three traits is very similar for these three breeding programs. However, for the vast majority of traits different markers are associated with the traits in different breeding programs.
A possible explanation for the lack of consistency of QTL detection among breeding program panels is varia-tion in minor allele frequency affecting power of detec-tion. There are numerous cases where a QTL is detected in one breeding program panel and that marker is fixed or at a very low allele frequency in other programs (Table 5). For example, a strong association was detected for kernel weight on chromosome 2H (98 cM) in the MT2 program. However, this marker was fixed for the high kernel weight allele in the other two-row programs. Another example is the barley protein QTL on 4H (28 cM). In this case, the QTL was detected in the MN6 program and fixed for the high protein allele in the other six-row programs. In con-trast, the QTL for alpha-amylase on 6H (11_10331) was segregating in the MN6, AB6 and OR6 breeding programs, but only detected in MN6 suggesting that either the genetic

713Theor Appl Genet (2015) 128:705–721
1 3
Table 4 Significant marker-trait associations identified in each breeding program for nine malting quality traits
Programa SNP Chr Map positionb −logP (Nc) Traitd PMe MEf Resides in
AB6
11_20145h 4H 1.19 5.13 (12) BG 240.9 −85.3 ×gQBgnm.StMo-4H(malt)
11_10208h 4H 2.58 4.98 (14) BG 240.9 78.3 ×QBgnm.StMo-4H (malt)
12_30540 4H 14.74 4.52 (27) WP 4.4 −0.2 QDp.StMo-4H; QBgnm.StMo-4H
11_10401 5H 185.51 4.54 (43) AA 62.8 −5.2 ×QAa.StMo-5H.2; ×QAa.HaMo-5H;QS/T.HaMo-5H
12_10857 5H 187 4.57 (47) AA 62.8 −4.8 ×QAa.StMo-5H.2; ×QAa.HaMo-5H;QS/T.HaMo-5H
11_10003 6H 55.55 4.61 (46) DP 117.0 8.9 QGpc.DiMo-6H
11_20835 6H 60.1 4.34 (46) DP 117.0 8.6 QGpc.DiMo-6H
11_20184 6H 60.63 4.47 (48) DP 117.0 8.7 QGpc.DiMo-6H
MN6
11_10176 1H 58.06 5.06 (66) BG 190.9 32.5
11_20302 4H 27.75 6.07 (141) BP 13.2 0.3
11_11200 5H 108.49 4.34 (31) PL 89.9 2.6
11_10310 5H 181.49 5.66 (15) PL 89.9 −4.0 QAa.StMo-5H.2; QAa.HaMo-5H;QS/T.HaMo-5H
12_31292 5H 183.33 4.78 (156) ST 43.3 1.0 QAa.StMo-5H.2; QAa.HaMo-5H; ×QS/T.HaMo-5H
12_31292 5H 183.33 5.01 (156) AA 71.2 2.4 ×QAa.StMo-5H.2; ×QAa.HaMo-5H;QS/T.HaMo-5H
12_30360 5H 185.51 4.49 (78) WP 5.5 −0.2 QAa.StMo-5H.2; QAa.HaMo-5H;QS/T.HaMo-5H
11_10401 5H 185.51 5.53 (84) ST 43.3 −1.4 QAa.StMo-5H.2; QAa.HaMo-5H; ×QS/T.HaMo-5H
12_30360 5H 185.51 4.71 (78) ST 43.3 −1.3 QAa.StMo-5H.2; QAa.HaMo-5H; ×QS/T.HaMo-5H
11_10401 5H 185.51 4.79 (84) AA 71.2 −3.1 ×QAa.StMo-5H.2; × QAa.HaMo-5H;QS/T.HaMo-5H
12_30382 5H 186.35 4.46 (18) ST 43.3 −2.2 QAa.StMo-5H.2; QAa.HaMo-5H; × QS/T.HaMo-5H
12_30382 5H 186.35 4.26 (18) AA 71.2 −5.1 ×QAa.StMo-5H.2; ×QAa.HaMo-5H;QS/T.HaMo-5H
12_10857 5H 187 4.42 (82) WP 5.5 −0.2 QAa.StMo-5H.2; QAa.HaMo-5H;QS/T.HaMo-5H
12_10857 5H 187 5.96 (82) ST 43.3 −1.5 QAa.StMo-5H.2; QAa.HaMo-5H; × QS/T.HaMo-5H
11_10331 6H 91.86 4.72 (33) AA 71.2 4.8
11_21404 6H 93.33 6.15 (29) AA 71.2 6.1
12_30879 7H 55.14 5.28 (10) ME 78.7 −1.5 ×QMe.StMo-7H; QBgnm.StMo-7H.1, QKp.HaMo-7H; QDp.HaMo-7H;QGpc.HaMo-7H
ND6
12_30948 1H 15.76 4.16 (10) BP 13.7 −0.4 QMe.StMo-1H.2; QKp.HaMo-1H.1
12_30456 5H 106.22 5.38 (12) ME 78.5 −0.8
12_30456 5H 106.22 4.01 (12) AA 76.6 6.5
11_10954 6H 58.72 6.06 (20) BP 13.7 0.9 ×QGpc.DiMo-6H
12_30346 6H 65.24 5.68 (21) BP 13.7 0.8
11_10954 6H 58.72 4.79 (20) DP 175.7 24.2 QGpc.DiMo-6H
12_30346 6H 65.24 6.13 (21) DP 175.7 24.2
OR6
12_31152 1H 104.82 4.46 (41) ME 78.5 −0.7 ×QMe.StMo-1H.4; ×QMe.HaMo-1H.2; QMe.Gutiérrez et al. (2011)
12_10905 1H 115.12 4.61 (29) ME 78.5 −0.8 ×QMe.HaMo-1H.2
11_10338 1H 117.91 4.29 (24) ME 78.5 −0.8 ×QMe.HaMo-1H.2
11_10221 4H 22.72 4.8 (72) WP 4.2 0.2 QAa.StMo-4H.1; QMe.StMo-4H; QDp.StMo-4H; QGpc.HaMo-4H; QS/T.HaMo-4H; QAa.HaMo-4H
11_20013 4H 145.16 4.98 (13) DP 120.2 −16.0 QGpc.DiMo-4H
11_10331 6H 91.86 4.25 (68) ME 78.5 0.7
AB2
11_10837 2H 41.63 4.4 (13) KW 39.7 1.6 Qme.DiMo-2H
11_10283 3H 178.5 4.46 (29) ME 80.4 −0.5
11_20022 5H 176.3 4.01 (39) WP 4.4 −0.2 QAa.StMo-5H.2

714 Theor Appl Genet (2015) 128:705–721
1 3
Table 4 continued
Programa SNP Chr Map positionb −logP (Nc) Traitd PMe MEf Resides in
12_30360 5H 185.51 4.82 (36) WP 4.4 −0.3 QAa.StMo-5H.2; QAa.HaMo-5H;QS/T.HaMo-5H
12_30360 5H 185.51 6.14 (36) AA 66.6 −8.2 ×QAa.StMo-5H.2; ×QAa.HaMo-5H;QS/T.HaMo-5H
12_30382 5H 186.35 4.8 (56) ME 80.4 −0.6 QAa.StMo-5H.2; QAa.HaMo-5H;QS/T.HaMo-5H
12_30382 5H 186.35 8.03 (56) WP 4.4 −0.3 QAa.StMo-5H.2; QAa.HaMo-5H;QS/T.HaMo-5H
12_30382 5H 186.35 12.61 (56) ST 41.8 −3.4 QAa.StMo-5H.2; QAa.HaMo-5H; × QS/T.HaMo-5H
12_30382 5H 186.35 9.04 (56) AA 66.6 −8.9 ×QAa.StMo-5H.2; ×QAa.HaMo-5H;QS/T.HaMo-5H
12_30382 5H 186.35 4.29 (56) BG 230.8 57.8 QAa.StMo-5H.2; QAa.HaMo-5H;QS/T.HaMo-5H
12_10322 5H 187.52 7.86 (68) ME 80.4 0.8 QAa.StMo-5H.2; QAa.HaMo-5H;QS/T.HaMo-5H
12_10322i 5H 187.52 12.9 (68) WP 4.4 0.4 QAa.StMo-5H.2; QAa.HaMo-5H;QS/T.HaMo-5H
12_10322i 5H 187.52 18.88 (68) ST 41.8 4.0 QAa.StMo-5H.2; QAa.HaMo-5H; × QS/T.HaMo-5H
12_10322i 5H 187.52 18.85 (68) AA 66.6 12.4 ×QAa.StMo-5H.2; ×QAa.HaMo-5H;QS/T.HaMo-5H
12_10322 5H 187.52 4.08 (68) BG 230.8 −55.8 QAa.StMo-5H.2; QAa.HaMo-5H;QS/T.HaMo-5H
12_31123i 5H 188.18 12.27 (67) WP 4.4 0.4 QAa.StMo-5H.2; QAa.HaMo-5H;QS/T.HaMo-5H
12_31123i 5H 188.18 16.41 (67) ST 41.8 3.8 QAa.StMo-5H.2; QAa.HaMo-5H; ×QS/T.HaMo-5H
12_31123i 5H 188.18 16.85 (67) AA 66.6 11.9 ×QAa.StMo-5H.2; ×QAa.HaMo-5H;QS/T.HaMo-5H
MT2
12_30336 1H 34.8 5.38 (22) PL 84.2 5.5 QMe.StMo-1H.3
11_20340 2H 97.85 7.22 (15) KW 37.6 −5.7 Qme.DiMo-2H
11_10065 2H 146.05 4.78 (20) KW 37.6 −3.5
12_10915 2H 153.2 5.4 (14) KW 37.6 −5.0
11_10380 3H 62.68 7.22 (15) KW 37.6 −4.4 QBgnm.StMo-3H
11_10631 3H 152.22 4.24 (31) KW 37.6 1.9 QS/T.DiMo-3H
12_30239 4H 142.06 4.24 (71) BG 313.9 60.3 QDp.DiMo-4H
12_30382 5H 186.348 6.4 (135) WP 4.4 −0.3 QAa.StMo-5H.2; QAa.HaMo-5H;QS/T.HaMo-5H
12_30382 5H 186.348 6.14 (135) ST 37.1 −2.2 QAa.StMo-5H.2; QAa.HaMo-5H; ×QS/T.HaMo-5H
12_30382 5H 186.348 7.32 (135) AA 59.7 −7.2 ×QAa.StMo-5H.2; ×QAa.HaMo-5H; QS/T.HaMo-5H
11_20402 5H 187 7.7 (139) ME 78.1 0.7 QAa.StMo-5H.2; QAa.HaMo-5H;QS/T.HaMo-5H
11_20402 5H 187 15.57 (139) WP 4.4 0.4 QAa.StMo-5H.2; QAa.HaMo-5H;QS/T.HaMo-5H
11_20402 5H 187 14.74 (139) ST 37.1 3.1 QAa.StMo-5H.2; QAa.HaMo-5H; ×QS/T.HaMo-5H
11_20402 5H 187 16.46 (139) AA 59.7 10.0 ×QAa.StMo-5H.2; ×QAa.HaMo-5H; QS/T.HaMo-5H
12_10322 5H 187.52 7.99 (136) ME 78.1 0.7 QAa.StMo-5H.2; QAa.HaMo-5H;QS/T.HaMo-5H
12_10322 5H 187.52 16.96 (136) WP 4.4 0.4 QAa.StMo-5H.2; QAa.HaMo-5H;QS/T.HaMo-5H
12_10322 5H 187.52 15.29 (136) ST 37.1 3.2 QAa.StMo-5H.2; QAa.HaMo-5H; ×QS/T.HaMo-5H
12_10322 5H 187.52 19.37 (136) AA 59.7 10.9 ×QAa.StMo-5H.2; ×QAa.HaMo-5H; QS/T.HaMo-5H
12_31123 5H 188.18 7.37 (138) ME 78.1 −0.7 QAa.StMo-5H.2; QAa.HaMo-5H;QS/T.HaMo-5H
12_31123 5H 188.18 15.24 (138) WP 4.4 0.4 QAa.StMo-5H.2; QAa.HaMo-5H;QS/T.HaMo-5H
12_31123 5H 188.18 12.8 (138) ST 37.1 2.9 QAa.StMo-5H.2; QAa.HaMo-5H; ×QS/T.HaMo-5H
12_31123 5H 188.18 16.89 (138) AA 59.7 10.2 ×QAa.StMo-5H.2; ×QAa.HaMo-5H; QS/T.HaMo-5H
11_11348 7H 64.4 4.92 (14) KW 37.6 −4.3 QKp.HaMo-7H;QDp.HaMo-7H;QGpc.HaMo-7H
11_10534 7H 81.67 4.76 (48) BG 313.9 −81.1 QMe.StMo-7H.3; QDp.StMo-7H.12; QAa.StMo-7H.1; QKp.HaMo-7H; QDp.HaMo-7H; QGpc.HaMo-7H
ND2
11_20089 4H 144.39 4.27 (36) DP 120.2 −8.0 ×QDp.DiMo-4H
11_20013 4H 145.16 4.61 (36) DP 120.2 −8.3 ×QDp.DiMo-4H
WA2
11_21038 1H 121.24 4.28 (10) WP 4.1 −0.4 QMe.HaMo-1H.2
11_10387 4H 129.64 4.04 (108) DP 110.3 −6.0 ×QDp.DiMo-4H
11_21130 4H 135.98 6.39 (37) DP 110.3 −9.5 ×QDp.DiMo-4H
11_20553 5H 1.9 4.4 (42) KW 38.4 0.9

715Theor Appl Genet (2015) 128:705–721
1 3
background or genotype by environment interaction could be important.
QTL detection in individual programs compared to combined programs
In general, combining breeding lines from individual pro-grams to form the 6R or 2R panels resulted in losing the signal of many markers that were detected in individual
programs (Fig. 3). Of 105 marker-trait associations detected in individual six-row breeding programs, only 21 remained significant in the combined 6R panel analysis. Similarly, when we combined the four two-row breeding programs to make the joint 2R panel, out of 72 significant marker-trait associations in individual two-row breeding programs, only 19 remained significant. However, combining individual programs also resulted in detecting 23 and 8 new marker-trait associations in the 6R and 2R panels, respectively.
Table 4 continued
Programa SNP Chr Map positionb −logP (Nc) Traitd PMe MEf Resides in
12_11450j 5H 167.62 4.42 (57) ST 32.9 −1.7 ×QAa.StMo-5H.2
12_30656j 5H 168.19 4.62 (55) ST 32.9 1.6 ×QAa.StMo-5H.2
11_10736 5H 170.03 5.75 (54) ST 32.9 1.976 ×QAa.StMo-5H.2
12_30504 5H 171.94 4.1 (78) WP 4.1 −0.2 QAa.StMo-5H.2
12_31292 5H 183.329 4.05 (104) WP 4.1 −0.1 QAa.StMo-5H.2; QAa.HaMo-5H;QS/T.HaMo-5H
12_31292 5H 183.329 5.91 (104) ST 32.9 −1.5 QAa.StMo-5H.2; QAa.HaMo-5H; ×QS/T.HaMo-5H
12_31292 5H 183.329 4.52 (104) AA 56.4 −4.7 ×QAa.StMo-5H.2; ×QAa.HaMo-5H; QS/T.HaMo-5H
11_10401 5H 185.512 4.75 (91) ME 76.9 −0.5 QAa.StMo-5H.2; QAa.HaMo-5H;QS/T.HaMo-5H
11_10401 5H 185.512 8.47 (91) WP 4.1 −0.2 QAa.StMo-5H.2; QAa.HaMo-5H;QS/T.HaMo-5H
11_10401 5H 185.512 8.36 (91) ST 32.9 −1.8 QAa.StMo-5H.2; QAa.HaMo-5H; ×QS/T.HaMo-5H
11_10401 5H 185.512 9.23 (91) AA 56.4 −6.9 ×QAa.StMo-5H.2; ×QAa.HaMo-5H; QS/T.HaMo-5H
11_10401 5H 185.512 5.44 (91) BG 200.0 38.6 QAa.StMo-5H.2; QAa.HaMo-5H;QS/T.HaMo-5H
11_20402 5H 187 5.38 (77) ME 76.9 0.5 QAa.StMo-5H.2; QAa.HaMo-5H;QS/T.HaMo-5H
11_20402 5H 187 12.56 (77) WP 4.1 0.3 QAa.StMo-5H.2; QAa.HaMo-5H;QS/T.HaMo-5H
11_20402 5H 187 12.08 (77) ST 32.9 2.3 QAa.StMo-5H.2; QAa.HaMo-5H; ×QS/T.HaMo-5H
11_20402 5H 187 16.28 (77) AA 56.4 9.5 ×QAa.StMo-5H.2; ×QAa.HaMo-5H; QS/T.HaMo-5H
11_20402 5H 187 4.23 (77) BG 200.0 −36.0 QAa.StMo-5H.2; QAa.HaMo-5H;QS/T.HaMo-5H
12_10322 5H 187.52 5.04 (76) ME 76.9 0.5 QAa.StMo-5H.2; QAa.HaMo-5H;QS/T.HaMo-5H
12_10322 5H 187.52 12.57 (76) WP 4.1 0.3 QAa.StMo-5H.2; QAa.HaMo-5H;QS/T.HaMo-5H
12_10322 5H 187.52 12.15 (76) ST 32.9 2.2 QAa.StMo-5H.2; QAa.HaMo-5H; ×QS/T.HaMo-5H
12_10322 5H 187.52 16.68 (76) AA 56.4 9.7 ×QAa.StMo-5H.2; ×QAa.HaMo-5H; QS/T.HaMo-5H
12_10322 5H 187.52 4.13 (76) BG 200.0 −34.8 QAa.StMo-5H.2; QAa.HaMo-5H;QS/T.HaMo-5H
12_31123 5H 188.18 10.01 (84) WP 4.1 0.2 QAa.StMo-5H.2; QAa.HaMo-5H;QS/T.HaMo-5H
12_31123 5H 188.18 13.04 (84) AA 56.4 8.3 ×QAa.StMo-5H.2; ×QAa.HaMo-5H; QS/T.HaMo-5H
a USDA at Aberdeen, ID (AB6), University of Minnesota (MN6), North Dakota State University (ND6), and Oregon State University (OR6) and two-row spring breeding programs i.e., USDA at Aberdeen, ID (AB2), Montana State University (MT2), North Dakota State University (ND2), and Washington State University (WA2)b Map positions are based on Muñoz-Amatriaín et al. (2011)c Number of lines homozygous for the minor alleled KW Kernel weight, PL kernel plumpness, ME malt extract, BP barley protein, WP wort protein, ST soluble/total ratio, DP diastatic power, AA α-amylase and BG β-glucane PM represents population average of BLUE estimates for each trait and association panel combinationf ME stands for marker effectg “×” denotes the QTL controlling the same trait that has been identified in the previous bi-parental mapping populationsh The LD between 11_20145 and 11_10208 in AB6 is D′ = −1 (R2 = 1). These markers likely represent two distinct haplotypes at a single locus rather than two tightly linked loci with opposite marker effectsi The LD between 12_10322 and 12_31123 in AB2 is D′ = ~0.98 (R2 = ~0.98). These markers likely represent two distinct haplotypes at a sin-gle locusj The LD between 12_11450 and 12_30656 in WA2 is D′ = −1 (R2 = ~0.98). These markers likely represent two distinct haplotypes at a single locus rather than two tightly linked loci with opposite marker effects
716 Theor Appl Genet (2015) 128:705–721
1 3
Detection of QTL reported in previous studies
We detected marker-trait associations in 11 of the 70 QTL previously reported for malting quality traits in the three bi-parental populations, Dicktoo × Morex, Steptoe × Morex, and Harrington × Morex (Fig. 1). Six QTL (i.e., QAa.HaMo-5H, QAa.StMo-5H.2, QBgnm.StMo-4H (malt), QS/T.HaMo-5H, QMe.StMo-7H, andQGpc.DiMo-6H) were identified in at least one individual breeding program and one of the combined panels. Three QTL (i.e., QDp.DiMo-4H, QMe.HaMo-1H.2, and QMe.StMo-1H.4) were spe-cific to individual association panels while two QTL (i.e., QKp.HaMo-7Hand QKp.StMo-3H) were specific to the 6R panel. The kernel plumpness QTLs we detected on 3H and 7H using the 6R panel were also detected in the Step-toe x Morex population (QKp.StMo-3H and QKp.HaMo-7H). We detected a region associated with α-amylase and soluble/total protein in both the 6R and 2R panels that was previously detected in Steptoe × Morex and Har-rington × Morex. The barley protein QTL we detected on 6H using the 6R panel was previously mapped in Dick-too × Morex. Last, the malt extract QTL we detected on 7H using the 6R panel was previously identified in Step-toe × Morex. Most malt quality QTL detected in previous wide cross mapping populations were not detected in the 6R and 2R panels.
Similarly, when we examine the results of the individual breeding programs, less than half of the marker-trait asso-ciations identified in our study were identified in the previ-ous bi-parental mapping studies (Table 3). In the 6R panel, 53 of the 116 associations we detected were identified in
previous studies. In the 2R panel, 37 of the 107 associa-tions we detected were identified in previous studies. Thus, in this study, we failed to detect many QTL that were iden-tified in prior mapping studies, but also identified numerous QTL that have not been previously described.
Interestingly, some of the QTL identified in previous bi-parental studies for a given trait were significant for other traits in our study. Markers significantly associated with more than one malting quality trait are listed in Sup-plemental Table S5. For example, we identified a QTL for grain protein and malt extract in the 6R panel at 12_10811 (49 cM) on 6H, which was previously identified for grain protein content (QGpc.DiMo-6H). We also identified a QTL for diastatic power in the 2R panel at 11_21493 (114 cM) on 3H, which was previously associated with only grain protein content (QGpc.StMo-3H.1).
In a recent association mapping study Gutiérrez et al. (2011) analysed three populations of sizes 79, 71, and 96 from the Oregon State University program that over-lap with the data that we used to construct OR6. They mapped marker-trait associations for five malting qual-ity traits (barley protein, malt extract, diastatic power, α-amylase, and β-glucan). For malt extract, they identi-fied three SNPs located at 101–130 cM of chromosome 1H. Similarly, we identified three SNPs associated with malt extract in OR6 located at 104, 110, and 115 cM on chromosome 1H. They also detected four markers associated with β-glucan, which we did not identify in our analysis. Similar to our study, they did not find any associations for barley protein, diastatic power, or α-amylase.
AB6 MN6 ND6 OR6 AB2 MT2 ND2 AB6 MN6 ND6 OR6 AB2 MT2 ND2 AB6 MN6 ND6 OR6 AB2 MT2 ND2
MN6ND6OR6AB2MT2ND2WA2
MN6ND6OR6AB2MT2ND2WA2
MN6ND6OR6AB2MT2ND2WA2
Diastatic Power Alpha-Amylase Beta-Glucan
Kernel Weight Kernel Plumpness Malt Extract
Barley Protein Wort Protein Soluble / Total Ratio
-0.11 0.03 0.76
Fig. 2 Heatmap of pair-wise Pearson’s correlation coefficients of −logP values for marker associations between pairs of breeding programs for malt quality traits

717Theor Appl Genet (2015) 128:705–721
1 3
Table 5 Distribution of marker alleles that were significant in at least one breeding program mapping panel, but fixed in other panels
SNP Chr Mappos
Traita Panelsb −logP Allelec Num. of lines with minor alleled
11_20340 2H 97.85 KW AB2 G
MT2 7.22 T/G 15 (T)
ND2 G
WA2 G
11_10065 2H 146.05 KW AB2 C
MT2 4.78 T/C 20 (T)
ND2 0.35 T/C 1 (T)
WA2 3.16 T/C 6 (T)
12_30680 3H 61.38 KW AB2 0.45 A/G 3 (A)
MT2 7.22 A/G 15 (A)
ND2 0.31 A/G 8 (A)
WA2 G
12_30367 3H 148.11 KW AB2 0.50 A/T 6 (T)
MT2 7.22 A/T 15 (T)
ND2 0.08 A/T 1 (T)
WA2 A
11_11348 7H 64.40 KW AB2 0.01 T/C 2 (T)
MT2 4.92 T/C 14 (T)
ND2 0.48 T/C 11 (T)
WA2 C
11_20302 4H 27.75 BP AB6 C
MN6 6.07 T/C 141 (T)
ND6 0.05 T/C 1 (T)
OR6 0.49 T/C 21 (T)
12_10199 6H 49.23 BP AB6 2.87 A/G 42 (A)
MN6 G
ND6 5.99 A/G 20 (A)
OR6 G
12_11353 6H 55.55 BP AB6 1.34 T/C 42 (T)
MN6 C
ND6 5.99 T/C 20 (T)
OR6 0.28 T/C 12 (T)
12_31003 6H 64.07 BP AB6 0.51 A/C 39 (A)
MN6 C
ND6 5.68 A/C 21 (A)
OR6 0.25 A/C 19 (A)
12_10199 6H 49.23 DP AB6 3.27 A/G 42 (A)
MN6 G
ND6 4.77 A/G 20 (A)
OR6 G
12_11353 6H 55.55 DP AB6 4.49 T/C 42 (T)
MN6 C
ND6 4.77 T/C 20 (T)
OR6 0.23 T/C 12 (T)
12_31003 6H 64.07 DP AB6 2.55 A/C 39 (A)
MN6 C
ND6 6.13 A/C 21 (A)

718 Theor Appl Genet (2015) 128:705–721
1 3
Discussion
Using breeding data to map QTL
Breeding data sets are extremely valuable and yet highly underutilized resources for the exploration of genetic archi-tecture for a wide array of crop traits. This study involved 1,862 breeding lines, 97 field trials, and nearly 5,000 grain samples that were analysed for malting quality. A conserva-tive cost estimate of 100 dollars per sample to conduct the micro-malting analysis alone would make a de novo study of this sort impractical. Exploiting historical breeding data for malting quality allowed us to confirm previously mapped QTL and identify new QTL. Comparing results across breeding programs gives further support and inde-pendently validates QTL. One challenge of using historical data sets is that they are frequently unbalanced and there-fore could result in false identification of QTL (Wang et al. 2012). Therefore, a comprehensive review of QTL results across mapping panels taking into account population size and allele frequencies is necessary to identify QTL with confidence. The AB6 panel had the smallest population size (98) and also detected relatively few QTL. Small popula-tion sizes not only affect the estimates of LD (Slate and Pemberton 2007), but also can result in low power to detect QTL and inflated QTL effects (Vales et al. 2005; Beavis 1994, 1997; Melchinger et al. 1998). Increasing population size would likely identify QTL with smaller effects, QTL that are not in high LD with the markers, and QTL asso-ciated with marker alleles at lower frequencies (Zhu et al. 2008).
We increased population size by combining six-row breeding populations and by combining two-row breeding populations with the primary goal of increasing the power to detect marker-trait associations. As a consequence of combining samples, we lost about 66 % of the signals that were detected in individual breeding programs suggesting that increasing sample size by pooling samples from dif-ferent breeding programs does not necessarily increase the power to detect marker-trait associations. On the other hand, we did detect some new QTL using the combined data sets. This suggests that multiple approaches to analys-ing data sets such as these are warranted. Because marker allele classes are often highly skewed, combining data sets will change allele frequencies and possibly affect detection power.
Diversity for QTL among breeding programs
The eight breeding programs included in this study devote significant resources to developing malting barley cultivars. Malting barley, which must meet industry standards for a complex set of traits, is clearly distinguishable from bar-ley developed for feed or food end-uses. The most signifi-cant difference between malt and feed barley is that feed barley fails to produce moderate to high levels of hydro-lytic enzymes needed during malting and mashing to break down endosperm (Fox et al. 2004). Feed barley checks included in malting quality evaluations typically exhibit malt parameters far outside acceptable industry stand-ards. There is general agreement among malt end-users on several malt parameters (e.g., higher malt extract, lower
a KW Kernel weight, PL kernel plumpness, ME malt extract, BP barley protein, WP wort protein, ST soluble/total ratio, DP diastatic power, AA α-amylase and BG β-glucanb USDA at Aberdeen, ID (AB6), University of Minnesota (MN6), North Dakota State University (ND6), and Oregon State University (OR6) and two-row spring breeding programs i.e., USDA at Aberdeen, ID (AB2), Montana State University (MT2), North Dakota State University (ND2), and Washington State University (WA2)c Alleles present in the panel. A single nucleotide state indicates that allele is fixed. The allele responsible for higher trait level is shown in boldd Number of lines carrying the minor allele. The nucleotide state of minor allele is in parentheses
Table 5 continued
SNP Chr Mappos
Traita Panelsb −logP Allelec Num. of lines with minor alleled
OR6 0.31 A/C 19 (A)
11_10331 6H 91.86 AA AB6 0.64 T/C 24 (C)
MN6 4.72 T/C 33 (C)
ND6 T
OR6 0.51 T/C 68 (C)
11_10176 1H 58.06 BG AB6 G
MN6 5.06 C/G 66 (C)
ND6 G
OR6 G

719Theor Appl Genet (2015) 128:705–721
1 3
β-glucan, and moderate grain protein concentration). How-ever, differences in beer style and the use of adjuncts have resulted in different requirements for some malt param-eters (e.g., diastatic power). It is therefore interesting that multiple breeding programs emphasizing similar targets for malt quality would result in different QTL segregating within their programs. In many cases, this was the result of fixation of the favorable allele within some breeding pro-grams but not others. There is typically limited germplasm exchange among breeding programs. Thus, even with simi-lar selection pressure for malting quality, the combination of different parental founders and drift due to small breed-ing population sizes could lead to differences in the alleles that become fixed in each of the programs. Also, even though selection for malting quality may be similar for all of the programs, selection for adaptation to target regions for variety deployment is not similar and could therefore lead to differential selection of quality alleles through link-age to local adaptation genes.
Implications for breeding and selection
This study revealed that some markers are associated with multiple malting quality traits in the germplasm tested and therefore impose some challenges to trait improve-ment. For example, a genomic region on 5H is associ-ated with soluble/total protein and α-amylase. The SNP 12_31123 was highly associated (−logP = 7.37) with malt extract in two-row barley germplasm from MT2. The same marker was significantly (−logP = 16.89) associated with α-amylase. Selection for the high allele for malt extract at this marker would decrease α-amylase to a large extent (Table 3). Depending on the malt end-user, this could be desirable or undesirable. If it is necessary to increase the level of both traits, it will be necessary to determine if the association is due to tight linkage or pleiotropy. Generating
large numbers of recombinant progeny in this region may be necessary to separate linked alleles and reassemble them in a favorable linkage block.
One of the goals of the Barley CAP was to create a national infrastructure for barley breeding and a shared trait and marker database to facilitated germplasm exchange. Typically elite lines are exchanged among breeding pro-grams based on performance in regional trials. The easy availability of trait and genotype information on a large set of U.S. elite barley breeding germplasm coupled with QTL information on target traits allows for more informed exchange of germplasm. Breeders can select high perform-ing lines that carry alleles at QTL for target traits that are more favorable than those present in their current breeding germplasm.
A general strategy for using this QTL information in breeding would be to enrich or fix favorable alleles that are segregating in the current breeding program germplasm. This could be done by screening parents for informa-tive markers and designing crosses that fix or enrich the favorable allele in the resulting progeny. An example of this would be selecting for the low β-glucan allele using the marker 11_10176 in the MN6 program (Table 5) which would result in about 15 % reduction in β-glucan content (Table 4). Since the other six-row programs lack the low β-glucan allele for this marker, they could select a parent from the Minnesota program with the low allele to intro-duce it into their breeding population.
Breeders are generally cautious about making wider crosses such as between two-row and six-row lines or winter and spring habit. In this study, we did not gener-ate a combined two-row and six-row panel because these two sets of lines were evaluated in entirely different trials without any common checks. However, the general lack of congruence of malting quality QTL detected in the six-row and two-row panels suggests the opportunity to make gains by crosses between the two germplasm groups. However, it is also likely that such crosses will produce segregation at numerous quality QTL and that large populations will be necessary to recover recombinants with the favorable allele at all or most of the loci. It should be possible to use the marker data to select combinations of two-row and six-row parents that carry the favorable allele at as many QTL as possible to minimize the number of loci that will segregate. Of course it is also important to note that there will likely be segregation at loci for other traits like yield and disease resistance that will further complicate selecting favorable recombinants.
Malting quality is genetically complex and the accept-able range of values for malting quality traits can vary depending on the end-user. Developing new varieties that meet industries changing needs and are productive in the target growing region will require continuous breeding
g
8421
23
Six-row
52
19
8
Two-row
Vanished Remained Newly identified
Fig. 3 Number of marker-trait associations that (a) vanished––detected in the individual program panels and not detected in the combined panels, (b) remained––detected in both combined and indi-vidual panels, or (c) newly identified––only identified after combin-ing individual breeding programs
720 Theor Appl Genet (2015) 128:705–721
1 3
effort. The enhanced understanding of the genetic archi-tecture of malting quality traits provided through this large collaborative study should help breeders maintain favorable alleles currently fixed in breeding populations and identify opportunities to introduce new genetic diversity to further improve malting quality.
Author contribution statement KS, PH, RD, DO, TB, and SU developed the breeding lines. AB conducted the malting quality analysis. SC conducted the marker geno-typing. MM conducted the data analysis and generated figures and tables. KS and MM wrote the manuscript. All the authors have read manuscript, provided feedback and approved the final manuscript.
Acknowledgments This research was supported by United States Department of Agriculture-NIFA Grant No. 2009-85606-05701, “Barley Coordinated Agricultural Project” and United States Depart-ment of Agriculture-NIFA Grant No. 2011-68002-30029, “Triticeae Coordinated Agricultural Project” and the American Malting Barley Association.
Conflict of interest The authors declare that they have no conflict of interest.
References
American Society of Brewing Chemists: Methods of Analysis (1992). 8th Revised Edition. Method Malt-4
Arbelbide M, Yu J, Bernardo R (2006) Power of mixed-model QTL mapping from phenotypic, pedigree and marker data in self-polli-nated crops. Theor Appl Genet 112:876–884
Arends AM, Fox GP, Henry RJ, Marschke RJ, Symons MH (1995) Genetic and environmental variation in the diastatic power of Australian barley. J Cereal Sci 21:63–70
Beavis WD (1994) The power and deceit of QTL experiments: Les-sons from comparative QTL studies. In Proceedings of the Forty-ninth Annual Corn and Sorghum Research Conference (Washing-ton, DC, American Seed Trade Association, 1994), pp 250–266
Beavis WD (1997) QTL analyses: Power, precision, and accuracy. In: Paterson AH (ed) Molecular dissection of complex traits. CRC Press, Boca Raton, pp 145–162
Bernardo R (2008) Molecular markers and selection for complex traits in plants: learning from the last 20 years. Crop Sci 48:1649–1664
Blake VC, Kling JG, Hayes PM, Jannink J, Jillella SR, Lee J, Mat-thews DE, Chao S, Close TJ, Muehlbauer GJ, Smith KP, Wise RP, Dickerson JA (2012) The Hordeum toolbox: the barley coor-dinated agricultural project genotype and phenotype resource. Plant Genom 5:81–91
Bradbury PJ, Zhang Z, Kroon DE, Casstevens TM, Ramdoss Y, Buckler ES (2007) TASSEL: software for association map-ping of complex traits in diverse samples. Bioinformatics 23: 2633–2635
Budde AD, Martens C and Staff. Mississippi Valley Regional Spring Barley Nursery—2009 Preliminary Quality Report. 2010 (Tech-nical Report) Available online at: http://www.ars.usda.gov/SP2UserFiles/Place/36551000/barleyreports/2009MVNfinal.pdf
Clancy JA, Ullrich SE (1988) Analysis and selection program for malt quality in barley by microcomputer. Cereal Chem 65:428–430
Close TJ, Bhat PR, Lonardi S, Wu Y, Rostoks N, Ramsay L, Druka A, Stein N, Svensson JT, Wanamaker S, Bozdag S, Roose ML, Mos-cou MJ, Chao S, Varshney RK, Szucs P, Sato K, Hayes PM, Mat-thews DE, Kleinhofs A, Muehlbauer GJ, DeYoung J, Marshall DF, Madishetty K, Fenton RD, Condamine P, Graner A, Waugh R (2009) Development and implementation of high-throughput SNP genotyping in barley. BMC Genom 10:582
Comadran J, Kilian B, Russell J, Ramsay L, Stein N, Ganal M, Shaw P, Bayer M, Thomas W, Marshall D, Hedley P, Tondelli A, Pec-chioni N, Francia E, Korzun V, Walther A, Waugh R (2012) Natu-ral variation in a homolog of Antirrhinum CENTRORADIALIS contributed to spring growth habit and environmental adaptation in cultivated barley. Nat Genet 44:1388–1392
Condon F, Gustus C, Rasmusson D, Smith K (2008) Effect of advanced cycle breeding on genetic diversity in barley breeding germplasm. Crop Sci 48:1027–1036
Crossa J, Burgueño J, Dreisigacker S, Vargas M, Herrera-Foessel SA, Lillemo M, Singh RP, Trethowan R, Warburton M, Franco J, Reynolds M, Crouch JH, Ortiz R (2007) Association analy-sis of historical bread wheat germplasm using additive genetic covariance of relatives and population structure. Genetics 177:1889–1913
Eagles HA, Bedggood AGJ, Panozzo F, Martin PJ (1995) Cultivar and environmental effects on malting quality in barley. Aust J Agric Res 46:831–844
Endelman JB (2011) Ridge regression and other kernels for genomic selection with R package rrBLUP. Plant Genom 4:250–255
Fox GP, Panozzo JF, Li CD, Lance RCM, Inkerman PA, Henry RJ (2003) Molecular basis of barley quality. Aust J Agr Res 54:1081–1101
Fox GP, Bowman JGP, Inkerman PA, Poulsen DME, Henry RJ (2004) Enzymes: the difference between malt and feed barley, paper pre-sented to the World Brewing Congress, San Diego, California, pp 24-28
Gao LF, Jing RL, Huo NX, Li Y, Li XP, Zhou RH, Chang XP, Tang JF, Ma ZY, Jia JZ (2004) One hundred and one new microsatellite loci derived from ESTs (EST-SSRs) in bred wheat. Theor Appl Genet 108:1392–1400
Gutiérrez L, Cuesta-Marcos A, Castro AJ, von Zitzewitz J, Schmitt M, Hayes PM (2011) Association mapping of malting quality quantitative trait loci in winter barley: positive signals from small germplasm arrays. Plant Genom 4:256–272
Hamblin MT, Close TJ, Bhat PR, Chao S, Kling JG, Abraham KJ, Blake T, Brooks WS, Cooper B, Griffey CA, Hayes PM, Hole DJ, Horsley RD, Obert DE, Smith KP, Ullrich SE, Muehlbauer GJ, Jannink JL (2010) Population structure and linkage disequilib-rium in U.S. barley germplasm: implications for association map-ping. Crop Sci 50:556–566
Han F, Ullrich SE, Kleinhofs A, Jones BL, Hayes PM, Wesenberg DM (1997) Fine structure mapping of the barley chromosome-1 centromere region containing malting-quality QTLs. Theor Appl Genet 95:903–910
Han F, Clancy JA, Jones BL, Wesenberg DM, Kleinhofs A, Ullrich SE (2004) Dissection of a malting quality QTL region on chromo-some 1 (7H) of barley. Mol Breeding 14:339–347
Hartog D, Lambert JW (1953) The relationships between certain agronomic and malting quality characters of barley. Agronomy J 45:208–212
Harvey BL, Rossnagel BG (1984) Harrington barley. Can J Plant Sci 64:193–194
Hayes PM, Jones BL (2000) Malting quality from a QTL perspec-tive.In 8th Int. Barley Genet. Symp. Adelaide Convention Centre, Adelaide, South Australia, 22–27 Oct. 2000. GlenOsmond, Waite Campus, Adelaide University, Adelaide, 8:99–105
Hayes PM, Liu BH, Knapp SJ, Chen F, Jones B, Blake T, Franck-owiak J, Rasmusson D, Sorrells M, Ullrich SE, Wesenberg D,

721Theor Appl Genet (2015) 128:705–721
1 3
Kleinhofs A (1993) Quantitative trait locus effects and environ-mental interaction in a sample of North American barley germ-plasm. Theor Appl Genet 87:392–401
Holland JB (2007) Genetic architecture of complex traits in plants. Curr Opin Plant Biol 10:156–161
Jannink JL, Bink MCAM, Jansen RC (2001) Using complex plant pedigrees to map valuable genes. Trend Plant Sci 6:337–342
Kang HM, Zaitlen NA, Wade CM, Kirby A, Heckerman D, Daly MJ, Eskin E (2008) Efficient control of population structure in model organism association mapping. Genetics 178:1709–1723
Kleinhofs A, Kilian A, Saghai-Maroof M, Biyashev R, Hayes P, Chen F, Lapitan N, Fenwick A, Blake T, Kanazin V, Ananiev E, Dahl-een L, Kudrna D, Bollinger J, Knapp S, Liu B, Sorrells M, Heun M, Franckowiak J, Hoffman D, Skadsen R, Steffenson B (1993) A molecular, isozyme, and morphological map of the barley (Hordeumvulgare) genome. Theor Appl Genet 86:705–712
Laido G, Marone D, Russo MA, Colecchia SA, Mastrangelo AM, Vita PD, Papa R (2014) Linkage disequilibrium and genome-wide association mapping in tetraploid wheat (Triticumturgidum L.). Plos One 9:e95211. doi:10.1371/journal.pone.0095211
Malysheva-Otto LV, Ganal MW, Röder MS (2006) Analysis of molec-ular diversity, population structure and linkage disequilibrium in a worldwide survey of cultivated barley germplasm (Hordeum-vulgare L.). BMC Genet 7:6
Marquez-Cedillo LA, Hayes PM, Jones BL, Kleinhofs A, Legge WG, Rossnagel BG, Sato K, Ullrich E, Wesenberg DM, Ullrich SE (2000) QTL analysis of malting quality on barley based on the doubled-haploid progeny of two elite North American varie-ties representing different germplasm groups. Theor Appl Genet 101:173–184
Massman J, Cooper B, Horsley R, Neate S, Dill-Macky R, Chao S, Dong Y, Schwarz P, Muehlbauer GJ, Smith KP (2011) Genome-wide association mapping of Fusarium head blight resist-ance in contemporary barley breeding germplasm. Mol Breed 27:439–454
Mather DE, Tinker NA, Laberge DE, Edney M, Jones BL, Rossnagel BG, Legge WG, Briggs KG, Irvine RB, Falk DE, Kasha KJ (1997) Regions of the genome that affect grain and malt qualityin a North American two row barley cross. Crop Sci 37:544–554
Melchinger AE, Utz HF, Schon CC (1998) Quantitative trait locus (QTL) mapping using different testers and independent popula-tion samples in maize reveals low power of QTL detection and large bias in estimates of QTL effects. Genetics 149:383–403
Mohammadi M, Endelman J, Nair N, Shiaoman C, Jones S, Mue-hlbauer G, Ullrich S, Baik B-K, Wise M, Smith K (2014) Asso-ciation mapping of grain hardness, polyphenol oxidase, total phenolics, amylose content, and β-glucan in US barley breeding germplasm. Mol Breed. doi:10.1007/s11032-014-0112-5
Muñoz-Amatriaín M, Moscou MJ, Bhat PR, Svensson JT, Bartoš J, Suchánková P, Šimková H, Endo TR, Fenton RD, Lonardi S, Castillo AM, Chao S, Cistué L, Cuesta-Marcos A, Forrest KL, Hayden MJ, Hayes PM, Horsley RD, Makoto K, Moody D, Sato K, Vallés MP, Wulff BBH, Muehlbauer GJ, Doležel J, Close TJ (2011) An improved consensus linkage map of barley based on flow-sorted chromosomes and single nucleotide polymorphism markers. Plant Genom 4:238–249
Nordborg M, Borevitz JO, Bergelson J, Berry CC, Chory J, Hagen-blad J, Kreitman M, Maloof JN, Noyes T, Oefner PJ, Stahl EA, Weige D (2002) The extent of linkage disequilibrium in Arabi-dopsis thaliana. Nat Genet 30:190–193
Oziel A, Hayes PM, Chen FQ, Jones B (1996) Application of quan-titative trait locus mapping to the development of winter-habit malting barley. Plant Breed 115:43–51
Podlich DW, Winkler CR, Cooper M (2004) Mapping as you go: an effective approach for marker-assisted selection of complex traits. Crop Sci 44:1560–1571
Pozniak CJ, Clarke JM, Clarke FR (2012) Potential for detection of marker–trait associations in durum wheat using unbalanced, his-torical phenotypic dataset. Mol Breed 30:1537–1550
Pritchard JK, Stephens M, Donnelly P (2000) Inference of population structure using multilocus genotype data. Genetics 155:945–959
Rasmusson DC, Glass RL (1965) Effectiveness of early generation selec-tion for four quality characters in barley. Crop Sci 1965:389–391
Rasmusson DC, Wilcoxon RW (1979) Registration of morcx barley. Crop Sci 19:293
R Development Core Team (2008) R: a language and environment for statistical computing. R Foundation for Statistical Computing, Vienna. http://www-R-project.org
R Development Core Team (2013) R: a language and environment for statistical computing. R Foundation for Statistical Computing, Vienna. http://www-R-project.org
SAS Institute (2008) SAS-statistical analysis software for windows, 9.2. SAS Institute, Cary, NC
Schmitt M, Budde AD (2010) Simplified mashing methods for ini-tial prediction of malting quality. American Society of Brew-ing Chemists Brewing Summit, June 15–18 2010, Providence, RI.Poster 67
Slate J, Pemberton JM (2007) Admixture and patterns of linkage dis-equilibrium in a free-living vertebrate population. J Evol Biol 20:1415–1427
Sneller CH, Mather DE, Crepieux S (2009) Analytical approaches and population types for finding and utilizing QTL in complex plant populations. Crop Sci 49:363–380
Stich B, Mohring J, Piepho HP, Heckenberger M, Buckler ES, Melch-inger AE (2008) Comparison of mixed-model approaches for association mapping. Genetics 178:1745–1754
Storey JD, Tibshirani R (2003) Statistical significance for genome-wide experiments. Proc Natl Acad Sci 100:9440–9445
Szucs P, Blake VC, Bhat PR, Close TJ, Cuesta-Marcos A, Muehlbauer GJ, Ramsay LV, Waugh R, Hayes PM (2009) An integrated resource for barley linkage map and malting quality QTL align-ment. Plant Genom 2:134–140
Ullrich SE, Coon CN, Sever JM (1981) Relationships of nutritional and malting quality traits of barley. In: Asher MJC (ed) Barley genetics IV. Proc. Fourth Intern. Barley Genet. Symposium. Univ. Edinburgh Press, Edinburgh, pp 225–233
Vales MI, Schön CC, Capettini F, Chen XM, Corey AE, Mather DE, Mundt CC, Richardson KL, Sandoval-Islas JS, Utz HF, Hayes PM (2005) Effect of population size on the estimation of QTL: a test using resistance to barley stripe rust. Theor Appl Genet 111:1260–1270
Wang H, Smith KP, Combs E, Blake T, Horsley RD, Muehlbauer GJ (2012) Effect of population size and unbalanced data sets on QTL detection using genome-wide association mapping in barley breeding germplasm. Theor Appl Genet 124:111–124
Zhao K, Aranzana MJ, Kim S, Lister C, Shindo C, Tang C, Toomajin C, Zheng H, Dean C, Marjoram P, Nordborg M (2007) An Arabi-dopsis example of association mapping in structured samples. PLoS Genet 3:e4
Zhou H, Steffenson BJ (2013) Association mapping of Septoria speckled leaf blotch resistance in U.S. barley breeding germ-plasm. Phytopathology 103:600–609
Zhou H, Muehlbauer G, Steffenson B (2012) Population structure and linkage disequilibrium in elite barley breeding germplasm from the United States. J Zhejiang Univ Sci B Biomed Biotechnol 13:438–451
Zhou H, Steffenson BJ, Muehlbauer G, Wanyera R, Njau P, Ndeda S (2014) Association mapping of stem rust race TTKSK resist-ance in US barley breeding germplasm. Theor Appl Genet 127:1293–1304
Zhu C, Gore M, Buckler ES, Yu J (2008) Status and prospects of asso-ciation mapping in plants. Plant Genom 1:5–20