a geotechnical engineer’s transition from the ubc …a geotechnical engineer’s transition from...
TRANSCRIPT

A Geotechnical EngineerA Geotechnical Engineer’’s Transition s Transition from the UBC to the IBCfrom the UBC to the IBC
David A. BaskaPh.D., P.E., C.E.G.


UBC End ResultUBC End Result

IBC End ResultIBC End Result

Seismic Zone MapSeismic Zone Map

Seismic Zone MapSeismic Zone Map

• Seismic zones• Seismic zone factors• Zone 4 near-source factors• Seismic source type


MCEMCE(Maximum Considered Earthquake)(Maximum Considered Earthquake)

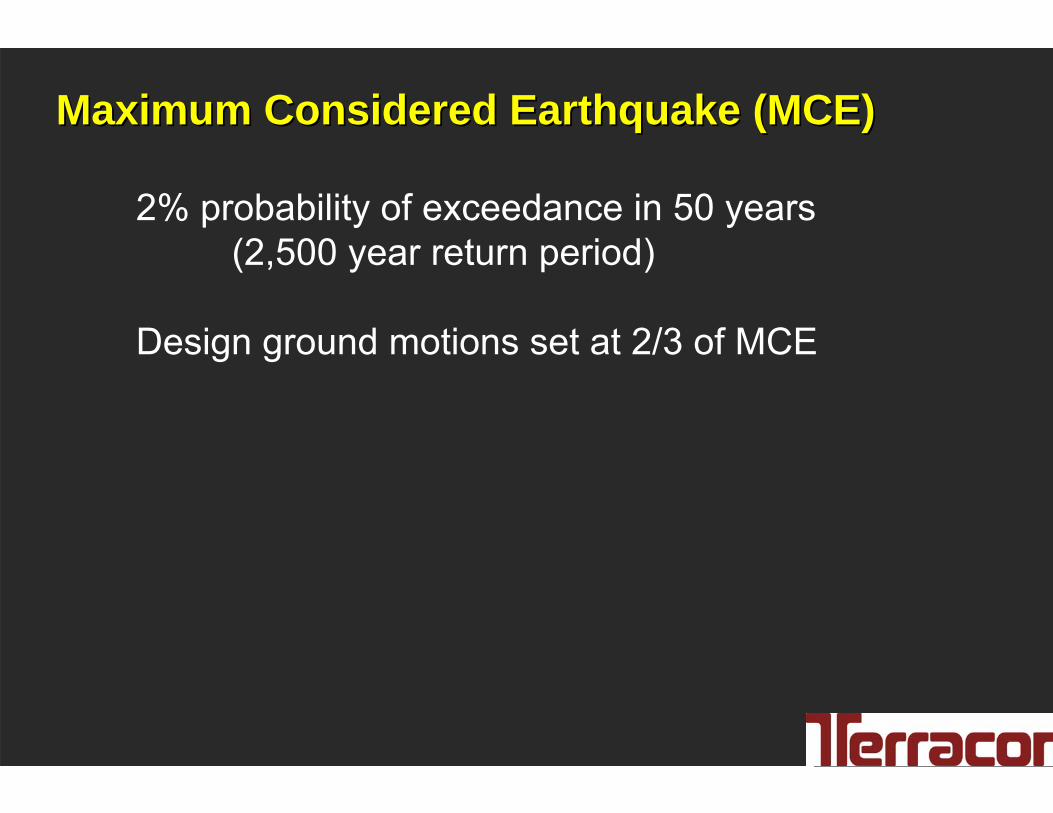
Maximum Considered Earthquake (MCE)Maximum Considered Earthquake (MCE)
2% probability of exceedance in 50 years (2,500 year return period)
Maximum Considered Earthquake (MCE)Maximum Considered Earthquake (MCE)
2% probability of exceedance in 50 years (2,500 year return period)
Design ground motions set at 2/3 of MCE

Maximum Considered Earthquake (MCE)Maximum Considered Earthquake (MCE)
2% probability of exceedance in 50 years (2,500 year return period)
Design ground motions set at 2/3 of MCE
Design ground motions were set at 2/3 of the MCE ground motion level, with the reasoning that any structure designed to the new seismic provisions, had a minimum margin against collapse of 1.5 (BSSC, 2004)
Design ground motions were set at 2/3 of the MCE ground motion level, with the reasoning that any structure designed to the new seismic provisions, had a minimum margin against collapse of 1.5 (BSSC, 2004)

Maximum Considered Earthquake (MCE)Maximum Considered Earthquake (MCE)
2% probability of exceedance in 50 years (2,500 year return period)
Except in high seismic regions

Maximum Considered Earthquake (MCE)Maximum Considered Earthquake (MCE)
2% probability of exceedance in 50 years (2,500 year return period)
Except in high seismic regions Deterministic

Basic Needs Of The Structural EngineerBasic Needs Of The Structural Engineer
• Mapped acceleration parameters (SS and S1)
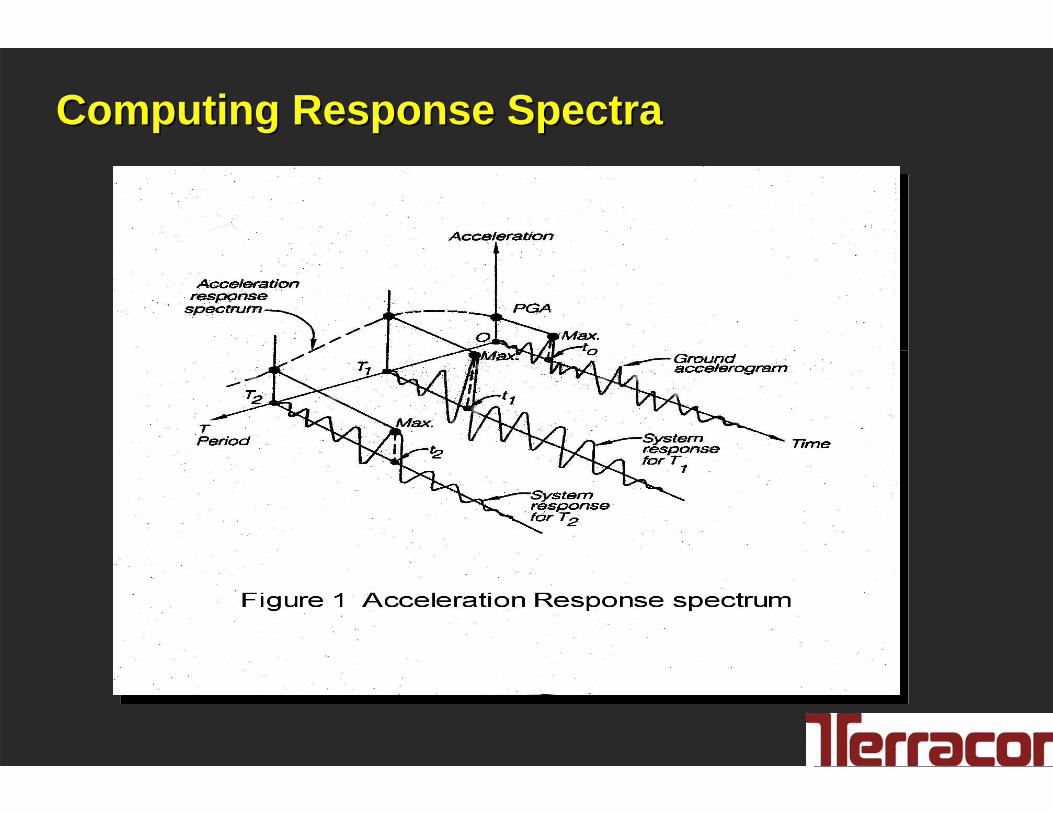
Computing Response SpectraComputing Response Spectra

Basic Needs Of The Structural EngineerBasic Needs Of The Structural Engineer
• Mapped acceleration parameters (SS and S1)
• Site class (A, B, C, D, E, or F)
• Long-period transition period (TL)

Mapped Acceleration Parameter Mapped Acceleration Parameter SSSS

Mapped Acceleration Parameter Mapped Acceleration Parameter SS11

Site Class DefinitionsSite Class Definitions

LongLong--Period Transition Period Period Transition Period TTLL

Maximum Considered Earthquake (MCE)
SMS = Fa * SSSM1 = Fv * S1
Spectral Acceleration ParametersSpectral Acceleration Parameters

Site Coefficients Site Coefficients FFaa and and FFvv

Maximum Considered Earthquake (MCE)
SMS = Fa * SSSM1 = Fv * S1
Spectral Acceleration ParametersSpectral Acceleration Parameters
Design Earthquake
SDS = 2/3 * SMSSD1 = 2/3 * SM1

Design Response SpectrumDesign Response Spectrum
Sa,To, and TS = f (SDS and SD1)

Acceleration parameters, SS and S1(Site Class B), from IBC maps
Acceleration parameters, SS and S1(Site Class B), from IBC maps

Acceleration parameters, SS and S1(Site Class B), from IBC maps
Acceleration parameters, SS and S1(Site Class B), from IBC maps
Subsurface exploration(VS, N, or Su)
Subsurface exploration(VS, N, or Su)

Acceleration parameters, SS and S1(Site Class B), from IBC maps
Acceleration parameters, SS and S1(Site Class B), from IBC maps
Site class, A, B, C, D, E, or F, from Table 1613.5.2
Site class, A, B, C, D, E, or F, from Table 1613.5.2
Subsurface exploration(VS, N, or Su)
Subsurface exploration(VS, N, or Su)

Acceleration parameters, SS and S1(Site Class B), from IBC maps
Acceleration parameters, SS and S1(Site Class B), from IBC maps
Site class, A, B, C, D, E, or F, from Table 1613.5.2
Site class, A, B, C, D, E, or F, from Table 1613.5.2
Subsurface exploration(VS, N, or Su)
Subsurface exploration(VS, N, or Su)
Site coefficients, Fa and Fv, from Table 1613.5.3
Site coefficients, Fa and Fv, from Table 1613.5.3

Acceleration parameters, SS and S1(Site Class B), from IBC maps
Acceleration parameters, SS and S1(Site Class B), from IBC maps
Site class, A, B, C, D, E, or F, from Table 1613.5.2
Site class, A, B, C, D, E, or F, from Table 1613.5.2
Subsurface exploration(VS, N, or Su)
Subsurface exploration(VS, N, or Su)
Site coefficients, Fa and Fv, from Table 1613.5.3
Site coefficients, Fa and Fv, from Table 1613.5.3
SMS = FaSsSM1 = FvS1
SMS = FaSsSM1 = FvS1

Acceleration parameters, SS and S1(Site Class B), from IBC maps
Acceleration parameters, SS and S1(Site Class B), from IBC maps
Site class, A, B, C, D, E, or F, from Table 1613.5.2
Site class, A, B, C, D, E, or F, from Table 1613.5.2
Subsurface exploration(VS, N, or Su)
Subsurface exploration(VS, N, or Su)
Site coefficients, Fa and Fv, from Table 1613.5.3
Site coefficients, Fa and Fv, from Table 1613.5.3
SMS = FaSsSM1 = FvS1
SMS = FaSsSM1 = FvS1
SDS = 2/3 SMSSD1 = 2/3 SM1
SDS = 2/3 SMSSD1 = 2/3 SM1

Acceleration parameters, SS and S1(Site Class B), from IBC maps
Acceleration parameters, SS and S1(Site Class B), from IBC maps
Site class, A, B, C, D, E, or F, from Table 1613.5.2
Site class, A, B, C, D, E, or F, from Table 1613.5.2
Subsurface exploration(VS, N, or Su)
Subsurface exploration(VS, N, or Su)
Site coefficients, Fa and Fv, from Table 1613.5.3
Site coefficients, Fa and Fv, from Table 1613.5.3
SMS = FaSsSM1 = FvS1
SMS = FaSsSM1 = FvS1
SDS = 2/3 SMSSD1 = 2/3 SM1
SDS = 2/3 SMSSD1 = 2/3 SM1
Long-period transition period, TL, from
Fig. 22-16 (ASCE 7)
Long-period transition period, TL, from
Fig. 22-16 (ASCE 7)

Example ProjectExample Project
• 3-story hotel
• 6680 Regional Street, Dublin, CA

IBC Short Period Spectral AccelerationIBC Short Period Spectral Acceleration
6680 Regional Street?

IBC Short Period Spectral AccelerationIBC Short Period Spectral Acceleration
http://terraserver.microsoft.com
6680 Regional Street 37.702N121.933W

IBC Short Period Spectral AccelerationIBC Short Period Spectral Acceleration
http://earthquake.usgs.gov/research/hazmaps


IBC Short Period Spectral AccelerationIBC Short Period Spectral Acceleration
Latitude37.702N
Longitude121.933W
SS = 2.71
http://earthquake.usgs.gov/research/hazmaps

IBC 1IBC 1--Second Period Spectral AccelerationSecond Period Spectral Acceleration
Latitude37.702N
Longitude121.933W
S1 = 1.06
http://earthquake.usgs.gov/research/hazmaps

Site Class DefinitionsSite Class Definitions

LongLong--Period Transition Period Period Transition Period TTLL
TL = 8

Basic Needs Of The Structural EngineerBasic Needs Of The Structural Engineer
• Mapped acceleration parameters SS = 2.71 and S1 = 1.06
• Site class D
• Long-period transition period TL = 8

IBC Site Coefficients IBC Site Coefficients FFaa and and FFvv

Maximum Considered Earthquake (MCE)
SMS = Fa * SSSM1 = Fv * S1
Spectral Acceleration ParametersSpectral Acceleration Parameters
Maximum Considered Earthquake (MCE)
SMS = 1.0 * 2.71 = 2.71SM1 = 1.5 * 1.06 = 1.59
Spectral Acceleration ParametersSpectral Acceleration Parameters

Maximum Considered Earthquake (MCE)
SMS = 2.71SM1 = 1.59
Spectral Acceleration ParametersSpectral Acceleration Parameters
Design Earthquake
SDS = 2/3 * SMSSD1 = 2/3 * SM1

Maximum Considered Earthquake (MCE)
SMS = 2.71SM1 = 1.59
Spectral Acceleration ParametersSpectral Acceleration Parameters
Design Earthquake
SDS = 2/3 * 2.71 = 1.81SD1 = 2/3 * 1.59 = 1.06

Design Response SpectrumDesign Response Spectrum
0.0
0.5
1.0
1.5
2.0
0 1 2 3 4Period (seconds)
Spec
tral
Acc
eler
atio
n (g
)

Design Response SpectrumDesign Response Spectrum
0.0
0.5
1.0
1.5
2.0
0 1 2 3 4Period (seconds)
Spec
tral
Acc
eler
atio
n (g
) Perform a site-specific study

Design Response SpectrumDesign Response Spectrum
0.0
0.5
1.0
1.5
2.0
0 1 2 3 4Period (seconds)
Spec
tral
Acc
eler
atio
n (g
)

Design SpectrumDesign Spectrum
0.0
0.5
1.0
1.5
2.0
0 1 2 3 4Period (seconds)
Spec
tral
Acc
eler
atio
n (g
) IBC
UBC
Deterministic

SiteSite--Specific Study RequiredSpecific Study Required
• Base isolated structures
• Structures with damping systems on sites with S1 ≥ 0.6
• Site class F, except for T ≤ 0.5 second structures

SiteSite--Specific Study AlternativesSpecific Study Alternatives
• Attenuation relations (not for site class F)• Site response analysis
Also,
• Probabilistic• Deterministic

SiteSite--Specific Study Limitations/RequirementsSpecific Study Limitations/Requirements
• Site response input motions
• Spectral values not less than 80 percent of general procedure
• SDS ≥ 0.9 Sa and SD1 ≥ 2 * Sa at T = 2 seconds
• Deterministic limit

Deterministic LimitDeterministic Limit

MCE ?MCE ?’’ss

What Else Does The What Else Does The GeotechGeotech Need to Address?Need to Address?
• Slope instability• Liquefaction (strength loss and settlement)• Lateral spreading• Fault rupture• Mitigation measures• Dynamic earth pressures on walls• Kinematic loads (SSI) on deep foundations

Ground Motion ParametersGround Motion Parameters
• Source characteristics and ground motion values consistent with design earthquake
• PGA from site-specific study, or SDS/2.5


*** Deaggregation of Seismic Hazard for PGA & 2 Periods of Spectral Accel. ****** Data from U.S.G.S. National Seismic Hazards Mapping Project, 2002 version ***PSHA Deaggregation. %contributions. site: Santa_Ana long: 117.853 W., lat: 33.709 N.USGS 2002-03 update files and programs. dM=0.2. Site descr:ROCKReturn period: 2475 yrs. Exceedance PGA =0.6197 g.#Pr[at least one eq with median motion>=PGA in 50 yrs]=0.00620DIST(KM) MAG(MW) ALL_EPS EPSILON>2 1<EPS<2 0<EPS<1 -1<EPS<0 -2<EPS<-1 EPS<-2 7.0 5.05 1.376 1.079 0.298 0.000 0.000 0.000 0.000 13.0 5.05 0.157 0.157 0.000 0.000 0.000 0.000 0.000 7.0 5.20 2.749 1.770 0.979 0.000 0.000 0.000 0.000 13.1 5.20 0.412 0.412 0.000 0.000 0.000 0.000 0.000 7.0 5.40 2.755 1.341 1.414 0.000 0.000 0.000 0.000 13.3 5.40 0.540 0.540 0.000 0.000 0.000 0.000 0.000 7.0 5.60 2.759 0.999 1.760 0.000 0.000 0.000 0.000 13.5 5.60 0.695 0.695 0.000 0.000 0.000 0.000 0.000 7.0 5.80 2.725 0.740 1.961 0.025 0.000 0.000 0.000 13.7 5.80 0.857 0.829 0.027 0.000 0.000 0.000 0.000 6.6 6.02 3.785 0.814 2.499 0.472 0.000 0.000 0.000 13.2 6.01 1.039 0.823 0.216 0.000 0.000 0.000 0.000 5.9 6.23 8.051 1.082 4.309 2.661 0.000 0.000 0.000 13.1 6.20 1.214 0.788 0.426 0.000 0.000 0.000 0.000 4.0 6.44 28.962 1.798 9.554 13.929 3.681 0.000 0.000 12.2 6.41 1.686 0.753 0.932 0.000 0.000 0.000 0.000 21.5 6.38 0.059 0.059 0.000 0.000 0.000 0.000 0.000 4.2 6.64 21.023 1.285 7.335 9.736 2.667 0.000 0.000 13.2 6.62 1.756 0.972 0.783 0.000 0.000 0.000 0.000 22.2 6.61 0.071 0.071 0.000 0.000 0.000 0.000 0.000 4.8 6.83 5.645 0.348 2.125 2.656 0.516 0.000 0.000 13.4 6.83 4.188 2.366 1.823 0.000 0.000 0.000 0.000 23.2 6.82 0.107 0.107 0.000 0.000 0.000 0.000 0.000 7.4 6.95 1.430 0.150 0.820 0.460 0.000 0.000 0.000 13.5 7.03 3.728 2.514 1.214 0.000 0.000 0.000 0.000 23.8 7.01 0.090 0.090 0.000 0.000 0.000 0.000 0.000 13.0 7.21 1.905 0.817 1.088 0.000 0.000 0.000 0.000 13.3 7.42 0.126 0.049 0.077 0.000 0.000 0.000 0.000
Summary statistics for above PSHA PGA deaggregation, R=distance, e=epsilon: Mean src-site R= 6.5 km; M= 6.38; eps0= 0.67. Mean calculated for all sources.Modal src-site R= 4.0 km; M= 6.44; eps0= 0.01 from peak (R,M) binGridded source distance metrics: Rseis Rrup and Rjb MODE R*= 3.9km; M*= 6.45; EPS.INTERVAL: 0 to 1 sigma % CONTRIB.= 13.929
Principal sources (faults, subduction, random seismicity having >10% contribution)Source Category: % contr. R(km) M epsilon0 (mean values)Calif. thrust/reverse faults 45.34 3.6 6.54 -0.14California shallow gridded 45.14 8.0 6.10 1.26Individual fault hazard details if contrib.>1%: 2 Newport-Inglewood offshore 3.43 14.3 7.02 1.902 Newport-Inglewood 4.25 12.4 7.02 1.632 Newport-Inglewood GR M-distri 1.32 13.1 6.79 1.802 San Joaquin Hills Thrust 28.65 3.5 6.56 -0.162 San Joaquin Hills Thrust GR M 16.53 3.5 6.51 -0.14
10% in 50 year
PGA = 0.71g

Distance, R
Magnitude, M

Ground Surface PGAGround Surface PGA
• Site response analysis
• Amplification factors (Stewart et al., 2003)

Future IBC (ASCE 7) DevelopmentsFuture IBC (ASCE 7) Developments
• Updated MCE maps
• Basin effects
• Vertical design response spectrum
• Long-period transition period, TL
• Soil-structure interaction (SSI) effects

Flowchart For Problem Resolution
Don’t Mess With It!
YES NO
YES
You IDIOT!NO
Will it Blow UpIn Your Hands?
NO
Look The Other Way
Anyone ElseKnow? Say GOODBYE!
YESYES
NO
Hide ItCan You Blame Someone Else?
NO
NO PROBLEM!
YES
Is It Working?
Did You Mess With It?

IBC Short Period Spectral AccelerationIBC Short Period Spectral Acceleration

IBC Short Period Spectral AccelerationIBC Short Period Spectral Acceleration
http://terraserver.microsoft.com
1325 E. Dyer Road 33.709N117.853W

IBC Short Period Spectral AccelerationIBC Short Period Spectral Acceleration
Latitude33.709N
Longitude117.853W
SS = 1.50
http://earthquake.usgs.gov/research/hazmaps
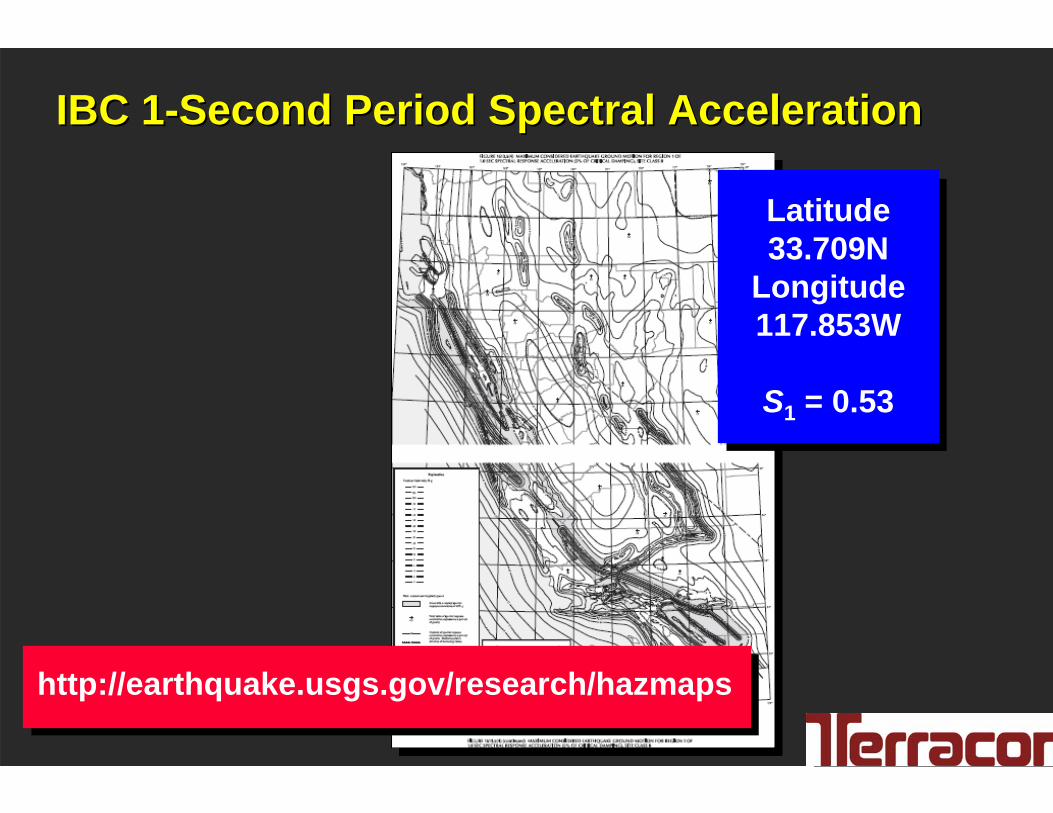
IBC 1IBC 1--Second Period Spectral AccelerationSecond Period Spectral Acceleration
Latitude33.709N
Longitude117.853W
S1 = 0.53
http://earthquake.usgs.gov/research/hazmaps

IBC 1IBC 1--Second Period Spectral AccelerationSecond Period Spectral Acceleration

IBC Site Coefficients IBC Site Coefficients FFaa and and FFvv

Basic Needs Of The Structural EngineerBasic Needs Of The Structural Engineer
• Mapped acceleration parameters SS = 1.50 and S1 = 0.53
• Site class D
• Long-period transition period TL = 8

Maximum Considered Earthquake (MCE)
SMS = Fa * SSSM1 = Fv * S1
Spectral Acceleration ParametersSpectral Acceleration Parameters

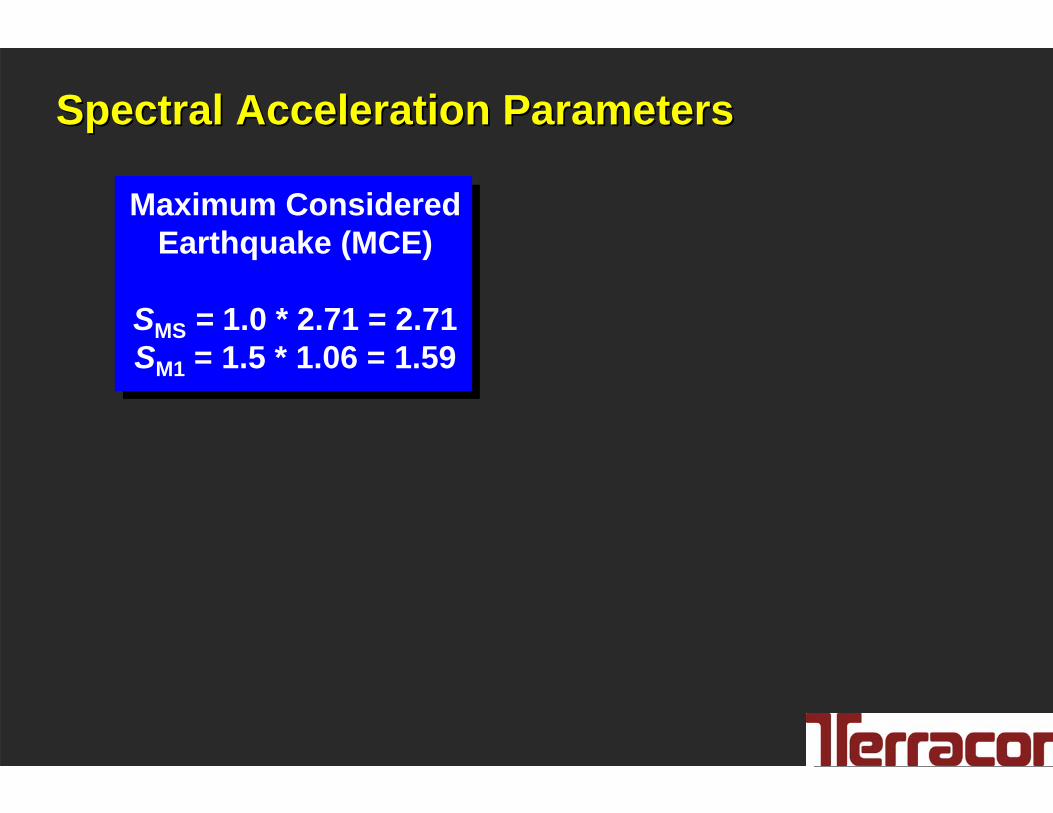
Maximum Considered Earthquake (MCE)
SMS = 1.0 * 1.50 = 1.50SM1 = 1.5 * 0.53 = 0.80
Spectral Acceleration ParametersSpectral Acceleration Parameters

Maximum Considered Earthquake (MCE)
SMS = 1.50SM1 = 0.80
Spectral Acceleration ParametersSpectral Acceleration Parameters
Design Earthquake
SDS = 2/3 * SMSSD1 = 2/3 * SM1

Maximum Considered Earthquake (MCE)
SMS = 1.50SM1 = 0.80
Spectral Acceleration ParametersSpectral Acceleration Parameters
Design Earthquake
SDS = 2/3 * 1.50 = 1.00SD1 = 2/3 * 0.80 = 0.53

Design Response SpectrumDesign Response Spectrum
0.0
0.5
1.0
1.5
0 1 2 3 4Period (seconds)
Spec
tral
Acc
eler
atio
n (g
) IBCUBC

Design Response SpectrumDesign Response Spectrum
0.0
0.2
0.4
0.6
0.8
1.0
1.2
0 1 2 3 4Period (seconds)
Spec
tral
Acc
eler
atio
n (g
)

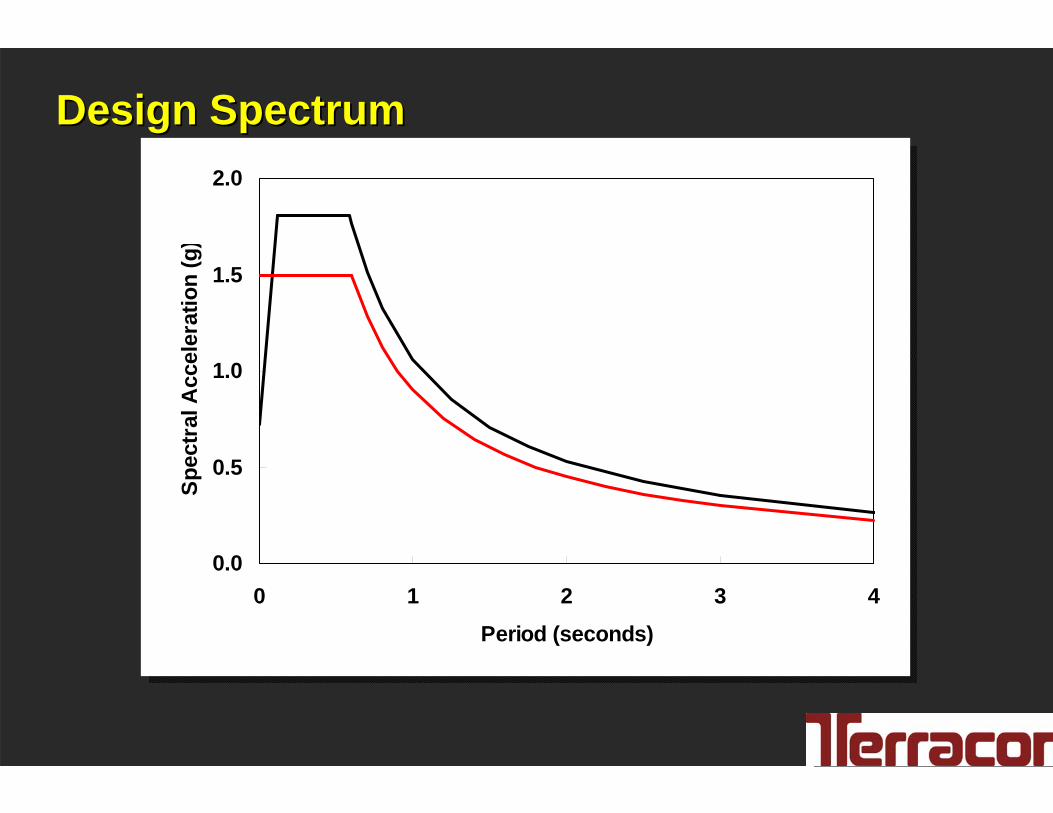
Design SpectrumDesign Spectrum
0.0
0.5
1.0
1.5
2.0
0 1 2 3 4Period (seconds)
Spec
tral
Acc
eler
atio
n (g
)
Design SpectrumDesign Spectrum
0.0
0.5
1.0
1.5
2.0
0 1 2 3 4Period (seconds)
Spec
tral
Acc
eler
atio
n (g
)


*** Deaggregation of Seismic Hazard for PGA & 2 Periods of Spectral Accel. ****** Data from U.S.G.S. National Seismic Hazards Mapping Project, 2002 version ***PSHA Deaggregation. %contributions. site: Santa_Ana long: 117.853 W., lat: 33.709 N.USGS 2002-03 update files and programs. dM=0.2. Site descr:ROCKReturn period: 2475 yrs. Exceedance PGA =0.6197 g.#Pr[at least one eq with median motion>=PGA in 50 yrs]=0.00620DIST(KM) MAG(MW) ALL_EPS EPSILON>2 1<EPS<2 0<EPS<1 -1<EPS<0 -2<EPS<-1 EPS<-2 7.0 5.05 1.376 1.079 0.298 0.000 0.000 0.000 0.000 13.0 5.05 0.157 0.157 0.000 0.000 0.000 0.000 0.000 7.0 5.20 2.749 1.770 0.979 0.000 0.000 0.000 0.000 13.1 5.20 0.412 0.412 0.000 0.000 0.000 0.000 0.000 7.0 5.40 2.755 1.341 1.414 0.000 0.000 0.000 0.000 13.3 5.40 0.540 0.540 0.000 0.000 0.000 0.000 0.000 7.0 5.60 2.759 0.999 1.760 0.000 0.000 0.000 0.000 13.5 5.60 0.695 0.695 0.000 0.000 0.000 0.000 0.000 7.0 5.80 2.725 0.740 1.961 0.025 0.000 0.000 0.000 13.7 5.80 0.857 0.829 0.027 0.000 0.000 0.000 0.000 6.6 6.02 3.785 0.814 2.499 0.472 0.000 0.000 0.000 13.2 6.01 1.039 0.823 0.216 0.000 0.000 0.000 0.000 5.9 6.23 8.051 1.082 4.309 2.661 0.000 0.000 0.000 13.1 6.20 1.214 0.788 0.426 0.000 0.000 0.000 0.000 4.0 6.44 28.962 1.798 9.554 13.929 3.681 0.000 0.000 12.2 6.41 1.686 0.753 0.932 0.000 0.000 0.000 0.000 21.5 6.38 0.059 0.059 0.000 0.000 0.000 0.000 0.000 4.2 6.64 21.023 1.285 7.335 9.736 2.667 0.000 0.000 13.2 6.62 1.756 0.972 0.783 0.000 0.000 0.000 0.000 22.2 6.61 0.071 0.071 0.000 0.000 0.000 0.000 0.000 4.8 6.83 5.645 0.348 2.125 2.656 0.516 0.000 0.000 13.4 6.83 4.188 2.366 1.823 0.000 0.000 0.000 0.000 23.2 6.82 0.107 0.107 0.000 0.000 0.000 0.000 0.000 7.4 6.95 1.430 0.150 0.820 0.460 0.000 0.000 0.000 13.5 7.03 3.728 2.514 1.214 0.000 0.000 0.000 0.000 23.8 7.01 0.090 0.090 0.000 0.000 0.000 0.000 0.000 13.0 7.21 1.905 0.817 1.088 0.000 0.000 0.000 0.000 13.3 7.42 0.126 0.049 0.077 0.000 0.000 0.000 0.000
Summary statistics for above PSHA PGA deaggregation, R=distance, e=epsilon: Mean src-site R= 6.5 km; M= 6.38; eps0= 0.67. Mean calculated for all sources.Modal src-site R= 4.0 km; M= 6.44; eps0= 0.01 from peak (R,M) binGridded source distance metrics: Rseis Rrup and Rjb MODE R*= 3.9km; M*= 6.45; EPS.INTERVAL: 0 to 1 sigma % CONTRIB.= 13.929
Principal sources (faults, subduction, random seismicity having >10% contribution)Source Category: % contr. R(km) M epsilon0 (mean values)Calif. thrust/reverse faults 45.34 3.6 6.54 -0.14California shallow gridded 45.14 8.0 6.10 1.26Individual fault hazard details if contrib.>1%: 2 Newport-Inglewood offshore 3.43 14.3 7.02 1.902 Newport-Inglewood 4.25 12.4 7.02 1.632 Newport-Inglewood GR M-distri 1.32 13.1 6.79 1.802 San Joaquin Hills Thrust 28.65 3.5 6.56 -0.162 San Joaquin Hills Thrust GR M 16.53 3.5 6.51 -0.14
10% in 50 year
PGA = 0.33g

Distance, R
Magnitude, M