a gis spatial model for defining management zones in ... · a gis spatial model for defining...
TRANSCRIPT

A. Peeters, A. Ben-Gal and A. Hetzroni. “A GIS spatial model for defining management zones in orchards based on spatial clustering”. EFITA-WCCA-CIGR Conference “Sustainable Agriculture through ICT Innovation”, Turin, Italy, 24-27 June 2013. The authors are solely responsible for the content of this technical presentation. The technical presentation does not necessarily reflect the official position of the International Commission of Agricultural and Biosystems Engineering (CIGR) and of the EFITA association, and its printing and distribution does not constitute an endorsement of views which may be expressed. Technical presentations are not subject to the formal peer review process by CIGR editorial committees; therefore, they are not to be presented as refereed publications.
A GIS Spatial Model for Defining Management Zones in Orchards Based on Spatial Clustering
A. Peeters12, A. Ben-Gal2 and A. Hetzroni3
1The Faculty of Food, Agriculture and Environmental Sciences, The Hebrew University of Jerusalem, Israel
2Institute of Soil, Water and Environmental Sciences, Agricultural Research Organization, Gilat Research Center, Israel
3Institute of Agricultural Engineering, Agricultural Research Organization, Volcani Center, Israel
Correspondence: Institute of Soil, Water and Environmental Sciences, Agricultural Research Organization, Gilat Research Center, Israel [email protected]
ABSTRACT
Management zones partition agricultural fields into sub-units which exhibit homogeneity in yield-defining environmental or plant parameters. Common methods for defining management zones, mainly for field crops, make use of algorithms to partition data observations into clusters based on different similarity methods and often do not account for the spatial neighborhood of the data. Spatial clustering methods, based on spatial statistics, include location of objects and spatial relationships and therefore account for spatial heterogeneity. We present a comprehensive spatial clustering methodology for defining management zones in orchards based on data from individual trees. We have examined the validity of the General G statistic for recognizing global patterns in individual tree data and the Gi* statistic for recognizing local clusters. Results based on case studies on grapefruit in Turkey and plum in Germany demonstrate that point-based spatial-clustering methods and, in particular, the Gi* statistic represent a valid method for delineating management zones in orchards.
Keywords: ECa, Hot-spot, Spatial-clustering, management zones, Israel.
INTRODUCTION The aim of precision agriculture is to reduce the environmental footprint of farming through optimizing the sustainable management of crops. This is achieved by addressing the spatial variability in plant and environmental conditions and by employing information technology, remote sensing data and geospatial methods to evaluate the extent of spatial variability. A well-established practice to address existing spatial variability is to partition the agricultural field into homogenous sub-units, known as management zones, which delineate areas in which yield-defining parameters are similar. This practice has been shown to optimize inputs, such as irrigation and fertilization, as well as to improve yields and their quality. Existing methods, such as those developed by Fleming et al. (2000) and Boydell and McBratney (2002), use either a particular or a combination of parameters for

C0046 A. Peeters, A. Ben-Gal and A. Hetzroni. “A GIS spatial model for defining management zones in orchards based on spatial clustering”. EFITA-WCCA-CIGR Conference “Sustainable Agriculture through ICT Innovation”, Turin, Italy, 24-27 June 2013.
partitioning the field into homogenous areas. Recent methods employ clustering algorithms such as fuzzy k-means clustering, to partition the field into homogenous areas based on the internal structure of the data (Fraisse et al., 2001; Fridgen et al., 2004; Kitchen et al., 2005 and Fu et al., 2010). While these methods consider the location of the observation (data) in the character space, they do not take into account its geographical spatial context and in particular do not model the spatial relationships between features. In addition, existing methods tend to concentrate primarily on field crops and are therefore based on techniques which are suitable for the analysis of continuous data and are less suitable for the analysis of discrete data such as that collected from individual trees in orchards. A few recent examples do successfully apply spatial and non-spatial methods to develop management zones in orchards, such as for apple and pear orchards (Perry et al., 2010; Aggelopoulou et al., 2010 and Mann et al., 2010). It is therefore apparent that horticultural practices based on individual tree management could benefit from spatial clustering-based methods that can address spatial variability among trees and produce site-specific measures. The field of spatial statistics is a rather recent and rapidly evolving extension to a-spatial statistics. Spatial statistical methods consist of a range of inferential statistical tests for analyzing spatial patterns and are based on the theory of correlated samples. As such the location of objects (samples) and their spatial relationships is directly integrated in the mathematics of the statistical tests (Cressie and Wikle 2011; Mitchel 2005). Spatial statistical tests can model phenomena which exhibit spatial dependence and spatial heterogeneity as well as model non-stationary processes, i.e. recognize and quantify patterns and relations which vary in space. Spatial statistical methods model spatial variability by comparing the observed spatial distribution of a set of features or of their associated attributes to a hypothetical random spatial distribution. Like a-spatial inferential statistics, they are evaluated within the context of the null hypothesis and a defined confidence level. Considering measures of probability is particularly important in areas such as agriculture in which a high level of confidence is required for decision making which is both viable economically as well as sustainable. We present the development of a comprehensive spatial clustering method based on information gathered from individual trees as a basis for defining management zones in orchards. The developed method is based on assessing the distribution in space of attributes associated with trees or with environmental parameters by quantifying spatial autocorrelation and evaluating to what extent a recognized pattern is statistically significantly clustered or dispersed. Spatial autocorrelation describes the extent of association between attributes of neighboring objects. If objects that are closer to each other tend to be more similar than objects that are farther apart the objects are considered to be spatially dependent and exhibit spatial clusters. Recognized clusters can then be used to delineate management zones.
2. MATERIALS AND METHODS Two case studies were considered in the development and testing of the proposed methodology: (i) a section of 207 cv Rio Red grapefruit (Citrus paradisi) trees located in an orchard near the city of Adana, Turkey which was monitored during 2011-2012,

C0046 A. Peeters, A. Ben-Gal and A. Hetzroni. “A GIS spatial model for defining management zones in orchards based on spatial clustering”. EFITA-WCCA-CIGR Conference “Sustainable Agriculture through ICT Innovation”, Turin, Italy, 24-27 June 2013.
and (ii) a plum orchard (Tophit plus) of 180 trees located in Potsdam-Marquardt, Germany, which was monitored from 2010-2012. Data regarding plant and environmental properties were collected for individual trees and organized within a geographical information system (GIS). Spatial statistical analysis was applied to data given that sufficient sampling existed to allow for a reliable spatial statistical analysis. The developed methodology applies point-based spatial statistical algorithms in which both the analysis of patterns and the evaluation of their statistical significance is based on point data. The distribution of observed values (field data) is compared to the values that would be expected if features were randomly distributed and the extent of deviation from the random distribution indicates the extent of clustering or dispersion. The developed methodology presented in Fig.1 consists of: (i) evaluating the global spatial variability in the orchard, (ii) detecting local spatial clusters, and (iii) defining the management zones. The method was developed within the ArcGIS® Desktop software package (ESRI, 1984) and the workflow was exported into a Python script to automate the process of delineating management zones. The difference between global and local spatial statistical methods is that global methods measure the degree of spatial autocorrelation over an entire area and output a single statistic for the entire study area. The output can be considered as a global average for a set of local spatial relationships and indicates on the degree of global clustering. Since the General G statistic is a global method and computes a single statistic for the entire study area, it can indicate only the presence of a concentration of either high values or low values but not of both. Local methods, alternatively, measure the degree of spatial autocorrelation locally, recognizing local regions that exhibit strong spatial autocorrelation by computing a statistic for each observation point in the study area. The degree of local spatial autocorrelation is evaluated by examining the degree to which each feature is surrounded by features with similarly high or low values within a specified distance. We applied the Getis-Ord General G statistic (Getis and Ord 1992) to assess the degree of global spatial clustering in the orchard (step a. Fig.1) and the Getis-Ord Gi* statistic (Gi*) or hot-spot analysis (Mitchell 2005; Ord and Getis 1995) to recognize local clusters in the study area (step b. in Fig.1). The Gi* statistic is often used in applications that are concerned with identifying hot-spots and cold-spots such as in crime analysis, demographics and epidemiology. The null hypotheses for both statistics states that attribute values do not exhibit either global or local spatial clustering. The statistics compute, in addition to the statistical indices, also a z-score and a p-value which are measures for evaluating the statistical significance of the indices and help to decide whether an observed global pattern or local cluster is statistically significant. The output graphical representation of the local statistic indicates the location of clusters in the study area. The identified significant local clusters are then employed to delineate n management zones. The z-score outputs of the Gi* statistic are reclassified into n classes (Fig.1 step c). In our case, we defined n = 3 in order to best represent the hot-spots and the cold-spots in the field based on the following conditions: IF z > 1.96 THEN classify as Class 1, IF -1.96 ≤ z ≤ 1.96 THEN classify as Class 2, and IF z < -1.96 THEN classify

C0046 A. Peeters, A. Ben-Gal and A. Hetzroni. “A GIS spatial model for defining management zones in orchards based on spatial clustering”. EFITA-WCCA-CIGR Conference “Sustainable Agriculture through ICT Innovation”, Turin, Italy, 24-27 June 2013.
as Class 3. The number of classes is, of course, variable based on specific management objectives or limitations, required statistical confidence level and on the size of the orchard. Each group of points belonging to a class is automatically converted into a minimum bounding polygon (step d. Fig.1) and post processing operations are required in order that polygon boundaries are placed between tree rows and not directly on trees (step e. Fig.1).
Figure 1. Flowchart of the proposed methodology for deriving management zones.
C0046 A. Peeters, A. Ben-Gal and A. Hetzroni. “A GIS spatial model for defining management zones in orchards based on spatial clustering”. EFITA-WCCA-CIGR Conference “Sustainable Agriculture through ICT Innovation”, Turin, Italy, 24-27 June 2013.
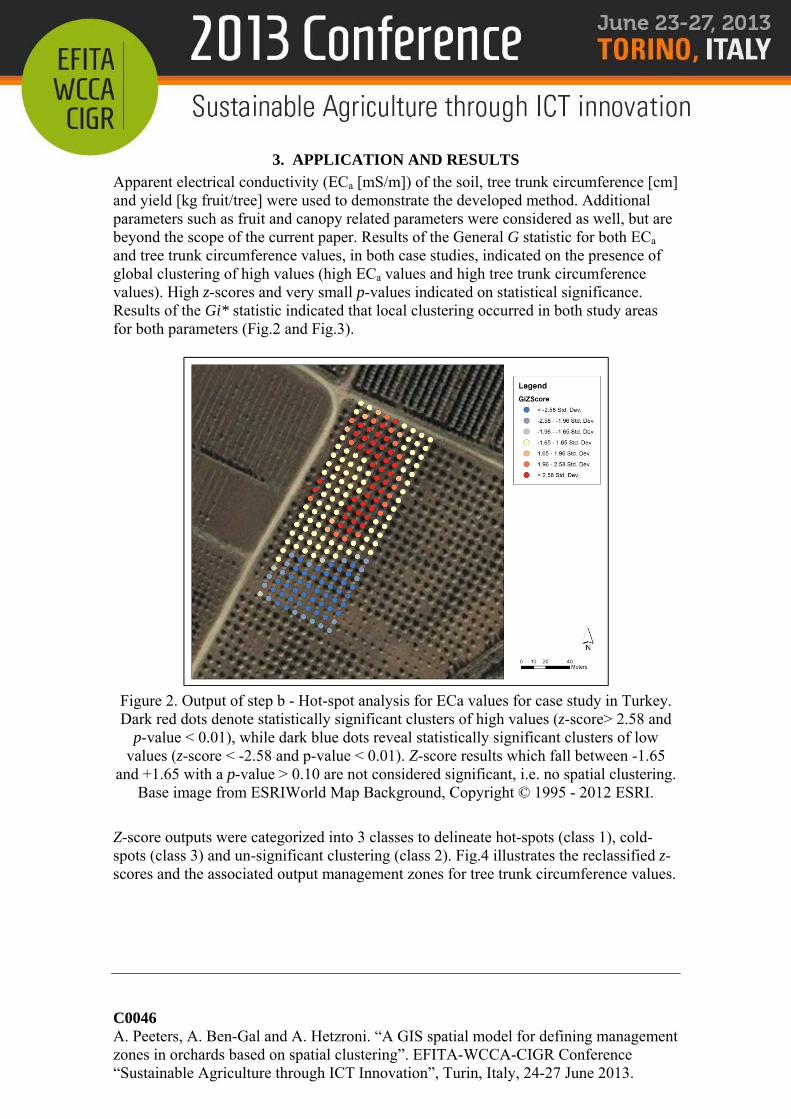
3. APPLICATION AND RESULTS Apparent electrical conductivity (ECa [mS/m]) of the soil, tree trunk circumference [cm] and yield [kg fruit/tree] were used to demonstrate the developed method. Additional parameters such as fruit and canopy related parameters were considered as well, but are beyond the scope of the current paper. Results of the General G statistic for both ECa and tree trunk circumference values, in both case studies, indicated on the presence of global clustering of high values (high ECa values and high tree trunk circumference values). High z-scores and very small p-values indicated on statistical significance. Results of the Gi* statistic indicated that local clustering occurred in both study areas for both parameters (Fig.2 and Fig.3).
Figure 2. Output of step b - Hot-spot analysis for ECa values for case study in Turkey. Dark red dots denote statistically significant clusters of high values (z-score> 2.58 and
p-value < 0.01), while dark blue dots reveal statistically significant clusters of low values (z-score < -2.58 and p-value < 0.01). Z-score results which fall between -1.65
and +1.65 with a p-value > 0.10 are not considered significant, i.e. no spatial clustering. Base image from ESRIWorld Map Background, Copyright © 1995 - 2012 ESRI.
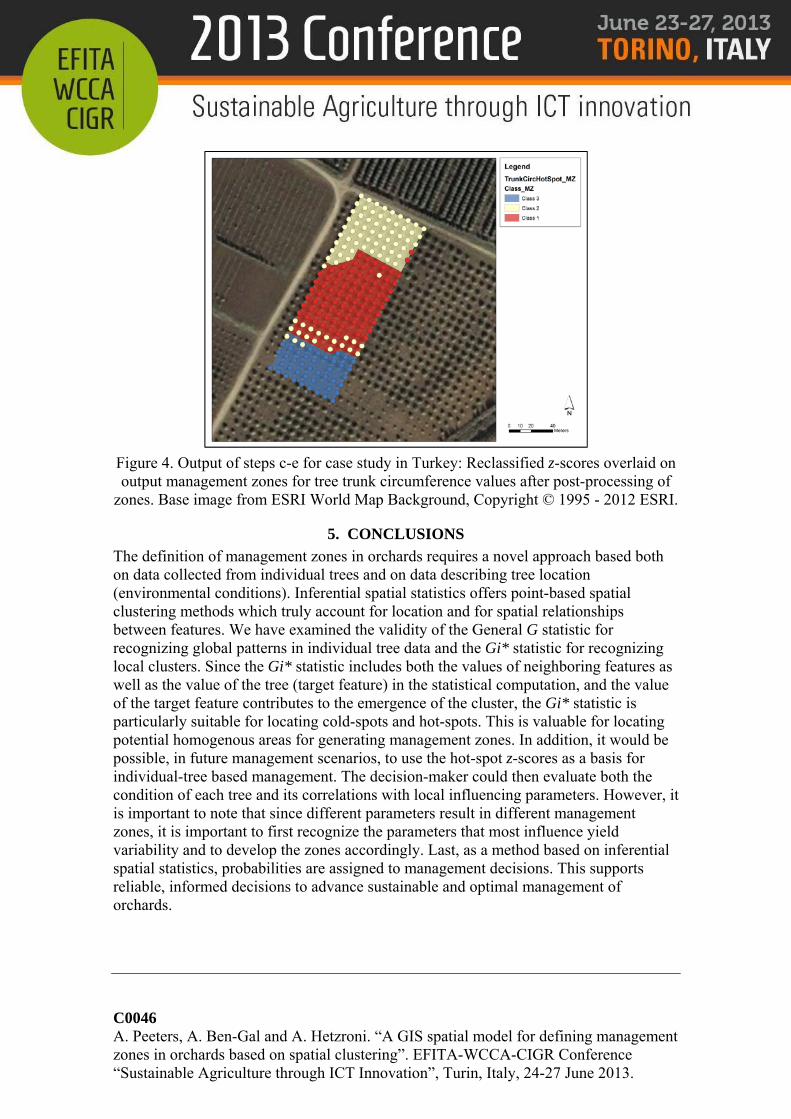
Z-score outputs were categorized into 3 classes to delineate hot-spots (class 1), cold-spots (class 3) and un-significant clustering (class 2). Fig.4 illustrates the reclassified z-scores and the associated output management zones for tree trunk circumference values.

C0046 A. Peeters, A. Ben-Gal and A. Hetzroni. “A GIS spatial model for defining management zones in orchards based on spatial clustering”. EFITA-WCCA-CIGR Conference “Sustainable Agriculture through ICT Innovation”, Turin, Italy, 24-27 June 2013.
Figure 3. Output of step b - Hot-spot analysis for ECa values for case study in Germany.
Dot symbology follows the same symbology used in Fig.3. Base image from ESRIWorld Map Background, Copyright © 1995 - 2012 ESRI.
4. ACCURACY EVALUATION Methods for defining management zones are often evaluated by how well they represent yield variation. We used yield represented by its clustering intensity (z-score) in order to examine the predictive capability of the management zones defined by the spatial clustering of ECa and tree trunk circumference. A one-way ANOVA test was applied. The sampled trees were divided into groups based on the output management zones. The dependent variable was yield variation (represented by its clustering intensity) and the independent variables were the management zones as delineated by ECa and tree trunk circumference values. The objective was to evaluate whether the group means of the dependent variable (yield) differed significantly among the groups of management zones. Results demonstrated that while trunk circumference values were a valid parameter for predicting yield variations, ECa values did not sufficiently predict yield and could not therefore serve as a unique parameter for defining management zones in the orchard.
C0046 A. Peeters, A. Ben-Gal and A. Hetzroni. “A GIS spatial model for defining management zones in orchards based on spatial clustering”. EFITA-WCCA-CIGR Conference “Sustainable Agriculture through ICT Innovation”, Turin, Italy, 24-27 June 2013.
Figure 4. Output of steps c-e for case study in Turkey: Reclassified z-scores overlaid on output management zones for tree trunk circumference values after post-processing of
zones. Base image from ESRI World Map Background, Copyright © 1995 - 2012 ESRI.
5. CONCLUSIONS The definition of management zones in orchards requires a novel approach based both on data collected from individual trees and on data describing tree location (environmental conditions). Inferential spatial statistics offers point-based spatial clustering methods which truly account for location and for spatial relationships between features. We have examined the validity of the General G statistic for recognizing global patterns in individual tree data and the Gi* statistic for recognizing local clusters. Since the Gi* statistic includes both the values of neighboring features as well as the value of the tree (target feature) in the statistical computation, and the value of the target feature contributes to the emergence of the cluster, the Gi* statistic is particularly suitable for locating cold-spots and hot-spots. This is valuable for locating potential homogenous areas for generating management zones. In addition, it would be possible, in future management scenarios, to use the hot-spot z-scores as a basis for individual-tree based management. The decision-maker could then evaluate both the condition of each tree and its correlations with local influencing parameters. However, it is important to note that since different parameters result in different management zones, it is important to first recognize the parameters that most influence yield variability and to develop the zones accordingly. Last, as a method based on inferential spatial statistics, probabilities are assigned to management decisions. This supports reliable, informed decisions to advance sustainable and optimal management of orchards.

C0046 A. Peeters, A. Ben-Gal and A. Hetzroni. “A GIS spatial model for defining management zones in orchards based on spatial clustering”. EFITA-WCCA-CIGR Conference “Sustainable Agriculture through ICT Innovation”, Turin, Italy, 24-27 June 2013.
6. ACNOWLEDGEMENTS The research was part of the '3D-Mosaic' project funded by the European Commission's ERA-Net ICT-Agri project contributed to by Israel’s Ministry of Agriculture and Rural Development, Chief Scientist fund, project 304-0450.
7. REFERENCES Aggelopoulou, K. D., Wufsohn, D., Fountas, S., Gemtos, T. A., Nanos, G. D., &
Blackmore, S. 2010. Spatial variation in yield and quality in a small apple orchard. Precision Agriculture, 11: 538-556.
Boydell, B., & McBratney, A. B. 2002. Identifying potential within-field management zones from cotton yield estimates. Precision Agriculture, 3: 9-23.
Cressie, N., & Wikle, C. K. 2011. Statistics for spatio-temporal data. NJ: John Willey & Sons, Inc.
ESRI. 1984. ArcGIS® desktop 10.0 copyright © 1999-2010 ESRI inc. Redlands, CA: Environmental Systems Research Institute, Inc. (ESRI).
Fleming, K. L., Westfall, D. G., Wiens, D. W., & Brodahl, M. C. 2000. Evaluating farmer defined management zone maps for variable rate fertilizer application. Precision Agriculture, 2: 201-215.
Fraisse, C. W., Sudduth, K. A., & Kitchen, N. R. 2001. Delineation of site-specific management zones by unsupervised classification of topographic attributes and soil electrical conductivity. Transactions of the ASAE, 44(1): 155-166.
Fridgen, J. J., Kitchen, N. R., Sudduth, K. A., Drummond, S. T., Wiebold, W. J., & Fraisse, C. W. 2004. Management zone analyst (MZA): Software for subfield management zone delineation. Agronomy Journal, 96: 100-108.
Getis, A., & Ord, J. K. 1992. The analysis of spatial association by use of distance statistics. Geographical Analysis, 24(3): 189-206.
Kitchen, N. R., Sudduth, K. A., Myers, D. B., Drummond, S. T., & Hong, S. Y. 2005. Delineating productivity zones on claypan soil fields using apparent soil eleectrical conductivity. Computers and Electronics in Agriculture, 46: 285-308.
Mann, K. K., Schumann, A. W., & Obreza, T. A. 2010. Delineating productivity zones in a citrus grove using citrus production, tree growth and temporally stable soil data. Precision Agriculture, 12(4): 457-472.
Mitchell, A. 2005. The ESRI guide to GIS analysis, volume 2: Spatial measurements & statistics. Redlands, CA: ESRI Press.
Ord, J. K., & Getis, A. 1995. Local spatial autocorrelation statistics: Distributional issues and an application. Geographical Analysis, 27(4): 286-306.