a global overview of the geology and economics of lithium
TRANSCRIPT

MinEx Consulting Strategic advice on mineral economics & exploration
A global overview of the geology and economics of
lithium productionJohn Sykes
Strategist, MinEx ConsultingWith input from Richard Schodde (MinEx Consulting) and Sam Davies (The University of Western Australia)
AusIMM Lithium Conference 3 July 2019 Perth, WA
IMAGE: Salar de Uyuni, Bolivia (Shutterstock); © MinEx Consulting, 2019

MinEx Consulting Strategic advice on mineral economics & exploration
Linking geology and economics in the lithium industry
•Geology
•Geography
•Other
Exploration
•Hard Rock
•Brine
•Clay
•Other
Mining
•Minerals
•Carbonate
•Hydroxide
•Other
Processing
•Batteries (of many types)
•Ceramics, greases, alloys, and many more…
Semi-Products
•Cars
•Electronics
•Energy storage
•Many non-battery uses
Consumer Products
Deposit Type Mine Type Product Type Battery Type End Use
Geography
SOURCE: Hao et al., 2017; © MinEx Consulting, 2019
Part 1Part 2
Part 3
Part 4
MINE-TO-MARKET

MinEx Consulting Strategic advice on mineral economics & exploration
A BRIEF INTRODUCTION ON EVOLVING LITHIUM DEMAND
A global overview of the geology and economics of lithium production
IMAGE: Display from a Nissan Leaf EV (Shutterstock / A. Aleksandravicius); © MinEx Consulting, 2019

MinEx Consulting Strategic advice on mineral economics & exploration
Lithium demand is in flux: switching to batteries
Lithium-ion batteries account for 41% of
lithium demand currently
Demand for lithium-ion batteries has transformed the lithium market in less than a decade
Lithium-ion batteries are forecast to dominate the lithium
market over the next decade
Consumer applications account for most lithium-ion battery consumption (68%)
SOURCES: Hao et al., 2017; Azevedo et al., 2018; © MinEx Consulting, 2019
China (2015)

MinEx Consulting Strategic advice on mineral economics & exploration
Lithium-ion battery consumption is in flux as well – switching to automotive from consumer applications
Application LCE Content
Mobile Phone ~3g
Laptop ~30g
Power Tool ~35g
HEV (3kWh) ~1.6kg
PHEV (15kWh) ~12kg
BEV (25kWh) ~20kg
Tesla (85kWh) ~50kg
SOURCES: American Lithium; Azevedo et al., 2018; © MinEx Consulting, 2019

MinEx Consulting Strategic advice on mineral economics & exploration
However, there are many different types of lithium-ion battery with different performance characteristics
Lithium-cobalt oxide (LCO) is a good general performer and is now relatively safe, but has had issues in the past. Overall it is relatively cheap, but is vulnerable to cobalt price movements.
Mainly used in consumer electronics and struggling to find application in electric vehicles (EVs). A dated technology.
Lithium-nickel-manganese-cobalt (LNMC) is a newer, higher performing range of battery chemistries giving flexibility over the price-performance trade-off. Mainly developed for the EV market but increasing cost effectiveness means they could find wider use.
Popular both in China and outside.
Lithium-manganese oxide (LMO) was one of the first types of batteries developed for EVs, and as such is well established with as solid safety record. Popular outside China. However, its price-
performance trade-off means that it may be a dated technology.
Lithium-iron phosphate (LFP) is the safest technology, in addition to being a relatively high performance battery. It is relatively expensive, but also has fewer intellectual
property restrictions compensating for material costs. Popular in China. Increasingly popular choice for high-performance EVs, but likely to become overtaken by LNMC
technologies over the longer term.
Lithium-nickel-cobalt-aluminium (LNCA) was one of the first chemistries developed with the aim of reducing cobalt consumption. Popular outside China. Solid performer
and of reasonable cost so will find broad application across the first-phase of EVs –especially in high cobalt price scenarios, but over the longer term may be ‘overtaken’.
SOURCE: Azevedo et al., 2018; © MinEx Consulting, 2019

MinEx Consulting Strategic advice on mineral economics & exploration
In addition, lithium-ion battery demand varies by region and is likely to evolve over time
• In addition, to lithium-ion secondary (i.e. rechargeable) batteries there are
several existing alternative rechargeable battery technologies;
• The most common are lead-acid, nickel-cadmium (NiCd), and nickel-metal
hydride (NiMH);
• Lithium-ion batteries are generally more expensive, but have better
performance;
• The current alternatives are mature technologies and in most applications
lithium-ion batteries are becoming the preferred technology.
• There are several emerging battery technologies, but most also use lithium,
such as lithium-air, lithium-metal, solid-state lithium and lithium-sulphur;
• However, one potential non-lithium future battery technology is sodium-ion;
• Sodium is just below lithium on the periodic table, sharing similar chemical
properties, and would be similarly widely available as lithium (many rock
types, salt, seawater etc.);
• Sodium-ion batteries could be cheaper than lithium-ion batteries and may
also be safer.
• It should also be noted that in some applications primary (i.e. disposable)
batteries can substitute for rechargeable batteries, though this is mainly
consumer products and some niche uses, not EVs and associated
technologies.
• Most common disposable battery technologies are based on zinc, though
some minor applications use lithium technology.
SOURCE: Azevedo et al., 2018; Battery University; © MinEx Consulting, 2019

MinEx Consulting Strategic advice on mineral economics & exploration
Lithium has significant supply chain complexity
SOURCE: Hao et al., 2017; © MinEx Consulting, 2019
Lithium minerals have the most flexibility in intermediate product (lithium chemicals) production…
…however, many of the new lithium mineral mines are
currently only producing mineral concentrates, for which, uses are mainly restricted to the glasses
and ceramics markets
Brines can be used to produce battery chemicals, however, the
Li2CO3 produced can be poor quality (both grade and
deleterious elements), thus mineral feedstock for battery
grade LiCO3 is preferred.

MinEx Consulting Strategic advice on mineral economics & exploration
Lithium mineral derived carbonate was previously the most popular feedstock for lithium battery production
SOURCE: Hao et al., 2017; Jaskula, 2017; © MinEx Consulting, 2019
This diagram shows the complexity of the lithium supply chain in China – the world’s
largest lithium raw materials consumer
…however, whilst both brines and minerals are imported the preference for
using lithium minerals for producing LiCO3 and then battery chemicals is clear.
Brines are mainly used for the production of lithium chloride and lithium metal,
which have general ‘industrial’ use.
NB: units in the above diagram are tonnes of ‘lithium carbonate equivalent’ (LCE), where one metric tonne of LCE contains 189kg of lithium.

MinEx Consulting Strategic advice on mineral economics & exploration
Lithium hydroxide is now apparently the most popular feedstock for lithium battery production
• However, evidence from the activities of the main players in the lithium sector has
shown that lithium hydroxide (LiOH) is now the most popular feedstock for lithium
battery production, for example:
– Orocobre (in partnership with Toyota & Panasonic) is building a ‘technical grade’
(>99% lithium carbonate [Li2CO3]) plant at Salar de Olaroz, which in turn will feed
a battery-grade LiOH plant in Japan (Naraha);
– Kidman Resources in a JV with SQM (Chile) is building a LiOH refinery in
Western Australia that is integrated with its Earl Grey (Mt Holland) project;
• LiOH is the preferred input for nickel-cobalt-aluminium (NCA) and nickel-
manganese-cobalt (NMC) lithium-ion batteries, whereas Li2CO3 was the preferred
input for lithium-iron-phosphate (LFP) batteries (Macquarie, 2018);
• As demonstrated in the diagram (right – and also earlier) LFP battery production, which
was mainly in China, is set to fall in relative importance in comparison to NMC batteries;
• A further advantage of producing LiOH is that it by-passes the Chinese Li2CO3 market
(see previous slide and right) and reduces the exposure of battery producers (and
users) to China;
• Although NCA batteries are also forecast to decline in relative importance, this process
is forecast to be slower for LFP batteries, and also retains the advantage of being a
battery technology largely produced outside of China;
• It should be noted, however, that Tianqi Lithium (China) has also built (and is
expanding) a LiOH refinery in Western Australia too – Tianqi is 51% owner (with
Albemarle at 49%) of the Greenbushes mines in Western Australia.
SOURCES: Orocobre, Kidman Resources, Tianqi, Azevedo et al., 2018; © MinEx Consulting, 2019

MinEx Consulting Strategic advice on mineral economics & exploration
A BRIEF OVERVIEW OF LITHIUM DEPOSIT TYPESA global overview of the geology and economics of lithium production
IMAGE: Spodumene, Haapaluoma, Finland (Shutterstock); © MinEx Consulting, 2019

MinEx Consulting Strategic advice on mineral economics & exploration
The ‘MinEx’ geological framework for lithium depositsTOTAL
389 Li deposits112 resources
70.6 Mt Li (103.4 Mt Li eq.)
IGNEOUS138 Li deposits
66 resources20.8 Mt Li (23.1 Mt Li eq.)
SEDIMENTARY37 Li deposits10 resources
7.9 Mt Li (8.8 Mt Li eq.)
BRINE (SALAR / SALT LAKE)170 Li deposits
27 resources31.1 Mt Li (57.0 Mt Li eq.)
UNCONVENTIONAL BRINE44 Li deposits
9 resources13.6 Mt Li (17.6 Mt Li eq.)
PEGMATITE125 Li deposits
60 resources18.8 Mt Li (20.1 Mt Li eq.)
OTHER GRANITE
GREISEN11 Li deposits6 resources
2.0 Mt Li (3.0 Mt Li eq.)
ALKALI2 Li deposits
LI-RICH CLAY
TYPICAL13 Li deposits4 resources
3.8 Mt Li (4.0 Mt Li eq.)
ATYPICAL11 Li deposits4 resources
3.1 Mt Li (3.7 Mt Li eq.)
VOLCANIC SEDIMENT-HOSTED8 Li deposits2 resources
1.0 Mt Li (1.2 Mt Li eq.)
B-RICH CLAY4 Li deposits
U-RICH CLAY1 Li deposit
NB: the ‘unconventional’ deposits are technically a sub-category of brine deposits, but have been listed separately in this framework to differentiate between technically feasible (‘salar’) and not yet technically feasible (unconventional) deposits.
OILFIELD BRINE35 Li deposits
8 resources10.7 Mt Li (14.6 Mt Li eq.)
GEOTHERMAL BRINE9 Li deposits1 resources
2.8 Mt Li (3.0 Mt Li eq.)
CREDIT: SAM DAVIES; © MinEx Consulting 2019
NB: Resource figures are ‘pre-mined resources’ not ‘current resources’.

MinEx Consulting Strategic advice on mineral economics & exploration
Pegmatite is the dominant ‘hard rock’ lithium deposit type, though granite-type deposits are related
• For the source magma to be rich in lithium it must also undergo
extreme fractional crystallisation;
• The size of the parental pluton for a lithium pegmatite is ~70-fold
larger (Partington et al., 1995), which may place an upper limit on
the size of pegmatites;
• Parts of the parental pluton may also be sufficiently enriched in
lithium or other metals to be considered an orebody (the ‘granite-
related’ deposit type);
• The diagram right shows the relative enrichment of different
elements in a pegmatite (at Tanco, Canada) and its parental pluton
(which in this case is not considered an economic orebody, but
nonetheless demonstrates the concept);
• The difference in source magmas and thus why some pegmatites
are lithium rich and others are not, is poorly understood – but it
may be linked to the felsic content of the magmas sourced from
continental crust material;
• LCT pegmatites may be associated with aluminium-rich (S-type)
granites formed by the melting of subducting metamorphosed
sediments.
CREDIT: SAM DAVIES; OTHER SOURCES: Bradley et al., 2017; © MinEx Consulting, 2019
Image: Chemical fraction from source to pegmatite (London, 2016)

MinEx Consulting Strategic advice on mineral economics & exploration
Greenbushes (Western Australia) is the case example of a world-class lithium(-tantalum-tin) pegmatite
• Greenbushes is a complex of tin, tantalum, lithium and kaolin bearing
pegmatites, with extensive weathered and alluvial material at surface;
• The weathered and alluvial material has been mined for tin and then
tantalum since 1888, with the presence of the alluvial material critical in
its discovery and exploitation (Wenman, 2006);
• Hard rock mining commenced in the 1980s and was focused on lithium,
tin and tantalum;
• Currently it is mainly lithium that is mined (by a Tianqi, China and
Albemarle, USA joint venture through Talison Lithium), with the other
mineral rights held separately (by Global Advanced Metals) – tantalum is
still mined but tin is no longer mined (though it remains economically
feasible);
• The Greenbushes pegmatite is about 3km long and several hundred
metres thick (see diagram);
• The extensive alluvial and weathered material suggests the original
pegmatite was much larger;
• MinEx calculates the pre-mined resource of lithium at Greenbushes
to be about 131Mt @ 1.14% lithium, thus containing 1.49Mt of
lithium (making it the second largest known lithium pegmatite).
CREDIT: SAM DAVIES; OTHER SOURCE: Partingtonet al., 1995; © MinEx Consulting, 2019
Image: Cross-section of the Greenbushes pegmatite (Dill, 2015 [corrected])
200m

MinEx Consulting Strategic advice on mineral economics & exploration
Pegmatite mining faces several general challenges• The deposit can be complex structurally making ‘economies of scale’ difficult to capture;
• The small size of the lithium market also means operations may have to be ‘scaled to market’
in a less economic manner;
• Spodumene is the most common ore mineral, though its hardness means it can be difficult to
process;
• Quality factors such as grade, purity and deleterious elements (P, F, Fe) can also significantly
affect product pricing and mine economics;
• Some of the non-spodumene minerals result in even lower grade concentrates, in addition to
hardness and complexity adding to processing costs – most have no ‘established’ processing
route;
• A spodumene lithium concentrate is usually about 2.8% Li (6% Li2O) – this significantly
increases transport costs as a share of overall operating costs, in comparison to other
commodities (see diagram right);
• Details of the freight cost comparison are included below:
– Roche Dore, DRC, 260Mt @ 0.76% Li, ~2,050km to port (Dar es Salaam)
– Mt Holland, WA, 189Mt @ 0.7% Li, ~400km to refinery on coast (Kwinana)
– Pilgangoora, WA, 226Mt @ 0.59% Li, ~120km to port (Port Hedland)
• The high transport costs of the low grade lithium mineral concentrates significantly
increases the incentive to integrate operations further downstream.
SOURCES: AVZ Minerals; Kidman Resources; Pilbara Minerals; © MinEx Consulting, 2019

MinEx Consulting Strategic advice on mineral economics & exploration
There are 55 lithium pegmatite resources globally
Lithium pegmatites range from about 300Kt @ 0.6% Li = 1,800t Li
to 700Mt @ 0.8% = 5.6Mt Li
Lithium pegmatite grades range from 0.15% to 1.5% Li
© MinEx Consulting 2019

MinEx Consulting Strategic advice on mineral economics & exploration
Lithium pegmatite quality is a function of size
Greenbushes, WA
Manono-Kitotolo, DRC
Pilgangoora, WAWodgina, WA
© MinEx Consulting 2019
A ‘Tier 1’ lithium pegmatite needs ~100Mt ore @ 0.55% Li
= 550Kt Li

MinEx Consulting Strategic advice on mineral economics & exploration
The ‘MinEx’ geological framework for lithium depositsTOTAL
389 Li deposits112 resources
70.6 Mt Li (103.4 Mt Li eq.)
IGNEOUS138 Li deposits
66 resources20.8 Mt Li (23.1 Mt Li eq.)
SEDIMENTARY37 Li deposits10 resources
7.9 Mt Li (8.8 Mt Li eq.)
BRINE (SALAR / SALT LAKE)170 Li deposits
27 resources31.1 Mt Li (57.0 Mt Li eq.)
UNCONVENTIONAL BRINE44 Li deposits
9 resources13.6 Mt Li (17.6 Mt Li eq.)
PEGMATITE125 Li deposits
60 resources18.8 Mt Li (20.1 Mt Li eq.)
OTHER GRANITE
GREISEN11 Li deposits6 resources
2.0 Mt Li (3.0 Mt Li eq.)
ALKALI2 Li deposits
LI-RICH CLAY
TYPICAL13 Li deposits4 resources
3.8 Mt Li (4.0 Mt Li eq.)
ATYPICAL11 Li deposits4 resources
3.1 Mt Li (3.7 Mt Li eq.)
VOLCANIC SEDIMENT-HOSTED8 Li deposits2 resources
1.0 Mt Li (1.2 Mt Li eq.)
B-RICH CLAY4 Li deposits
U-RICH CLAY1 Li deposit
NB: the ‘unconventional’ deposits are technically a sub-category of brine deposits, but have been listed separately in this framework to differentiate between technically feasible (‘salar’) and not yet technically feasible (unconventional) deposits.
OILFIELD BRINE35 Li deposits
8 resources10.7 Mt Li (14.6 Mt Li eq.)
GEOTHERMAL BRINE9 Li deposits1 resources
2.8 Mt Li (3.0 Mt Li eq.)
CREDIT: SAM DAVIES; © MinEx Consulting 2019
NB: Resource figures are ‘pre-mined resources’ not ‘current resources’.

MinEx Consulting Strategic advice on mineral economics & exploration
Lithium brines in ‘salars’ (salt lakes) are the other main deposit type
• Lithium ‘salar’ deposits are salt lakes formed from groundwater,
that are enriched in lithium, from which the brine can be extracted
to produce lithium (and some other commodities);
• These salt lakes from in closed basins (i.e. water flows in, but not
out) in arid regions which are dominated by evaporation;
• Salars are typically large in surface area (though they vary is size
greatly) and very low grade (lithium in ppm), however, the ability
to extract them as a brine and naturally evaporate them means
they can be produced economically at these grades;
• Most of the other major lithium deposits in the MinEx Consulting
lithium database are ‘salars’;
• ‘Salars’ are one of only two deposit types (the other being
pegmatites) that are currently mined for lithium;
• Most of the largest lithium ‘salars’ are in the Andean Highlands
(Argentina, Bolivia and Chile).
CREDIT: SAM DAVIES; OTHER SOURCE: Bradley et al., 2013; © MinEx Consulting, 2019
Image: Salar de Uyuni in Bolivia – the world’s largest salar and potentially the world’s largest lithium resource (though commercial
mining has not yet been established on the salar). The salar is approximately 125km East-to-West. The bright white reflective crust is
predominantly halite (NaCl) – common salt. The cone-shaped Cerro Tunupa volcano can be seen on the northern end of the salar.

MinEx Consulting Strategic advice on mineral economics & exploration
The requirement for arid conditions mean lithium ‘salars’ form primarily along the tropics in the ‘arid zone’
Arid zone
Arid zone
CREDIT: SAM DAVIES; © MinEx Consulting 2019

MinEx Consulting Strategic advice on mineral economics & exploration
Lithium ‘salars’ form at high altitude – a result of the orogenic volcanism, but also required for aridity and evaporation
CREDIT: SAM DAVIES; © MinEx Consulting, 2019
Images (Right): Digital elevation model of the Central Andes showing the postulated position of a large sub-surface magma body (the dotted white line) and the location of major salars in depressions within the
range. Source: Houston et al., 2011.
Above: Approximate altitudes (derived from Google Earth) for selected key lithium salars and sedimentary deposits. The high altitude of these deposits is partly a product of the orogenic volcanism that provides
the lithium. However, the orogenic ranges formed also create internal drainage basins and act as rain shadows increasing aridity. The high altitude also results in higher rates of evaporation – all of which
encourage salar formation. Lithium-rich clays may form instead of salars at lower altitudes.
Salar / Salt Lake
Lithium-rich Clay
Lithium-rich Clay (Atypical)

MinEx Consulting Strategic advice on mineral economics & exploration
Salar de Atacama (Chile) is the case example of a world-class mature lithium-brine ‘salar’
• The ‘Salar de Atacama’ is a large lithium-brine bearing ‘salar’
in Chile, that it one of the world’s largest producers of lithium;
• Both state company ‘Sociedad Química y Minera de Chile’
(‘SQM’) and US private company ‘Albemarle’ extract brine from
the salar and then process the brine into lithium carbonate
(Li2CO3) and other chemicals in Antofagasta;
• The USGS estimates SQM’s Li2CO3 production capacity to be
48,000tpa (9,070tpa Li) and lithium hydroxide (LiOH.H2O)
production capacity to be 6,000tpa (1,750tpa Li) – though the
operations are undergoing an expansion of LiOH.H2O capacity
to 13,500tpa (2,255tpa Li);
• The USGS estimates Albemarle’s recently expanded Li2CO3
production capacity in Chile to be 47,000tpa (8,885tpa Li) and
in with a further capacity of 4,500tpa (745tpa Li) for lithium
chloride (LiCl);
• MinEx calculates the pre-mined resource of lithium at
Salar de Atacama to be about 6.1Bm3 (~7.3Bt) @ 1,780mg/l
(0.178%) lithium, thus containing 10.9Mt of lithium.
CREDIT: SAM DAVIES; OTHER SOURCES: USGS; © MinEx Consulting, 2019
Image: Satellite image of the Salar de Atacama. The brine extraction and evaporation operations of SQM can be seen in the centre of the ‘salar’, with Albemarle’s operations fringing the south peninsular of the ‘salar’. The yellow bar represents a distance of ~10km. Source: Google Earth.

MinEx Consulting Strategic advice on mineral economics & exploration
There are 25 known lithium brine resources globally…
© MinEx Consulting 2019
Lithium brines range from about 400Mt @ 0.01% Li = 40,000t Li to
~7.5Bt @ 0.15% Li = 11.3Mt Li
Note: conversion into tonnes from usual unit of m3 (1.0 tonne = ~1.0m3)
Note: conversion into percent from
usual unit of ppm (1% =
10,000ppm)
Equivalent to ~400 million m3 @ 100ppm Li = 40,000t Li to ~7.5 billion
m3 @ 1,500ppm Li = 11.3Mt Li

MinEx Consulting Strategic advice on mineral economics & exploration
There are only a few ‘Tier 1’ ‘salars’
Salar de Atacama, Chile
Salars de Oloroz & Cauchari, Argentina
© MinEx Consulting 2019
Salar de Uyuni, Bolivia
A ‘Tier 1’ lithium salar needs ~10 billion m3 @ 600ppm Li =
6.0Mt Li
Note: conversion into percent from
usual unit of ppm (1% =
10,000ppm)
Note: conversion into tonnes from usual unit of m3 (1.0 tonne = ~1.0m3)

MinEx Consulting Strategic advice on mineral economics & exploration
Salars however also face some general challenges in extraction
• Deleterious elements, especially magnesium, can
impede recoveries;
• Deleterious elements also can affect product
quality and sale prices;
• Natural evaporation of brines is time-intensive
(‘months’) and vulnerable to bad weather (albeit
rare);
• Remoteness can also be a problem;
• The hyper-aridity of many ‘salar’ regions means
that water use is a major concern;
CREDIT: SAM DAVIES; © MinEx Consulting, 2019
Image: Salar de Atacama. Source: Shutterstock.

MinEx Consulting Strategic advice on mineral economics & exploration
The ‘MinEx’ geological framework for lithium depositsTOTAL
389 Li deposits112 resources
70.6 Mt Li (103.4 Mt Li eq.)
IGNEOUS138 Li deposits
66 resources20.8 Mt Li (23.1 Mt Li eq.)
SEDIMENTARY37 Li deposits10 resources
7.9 Mt Li (8.8 Mt Li eq.)
BRINE (SALAR / SALT LAKE)170 Li deposits
27 resources31.1 Mt Li (57.0 Mt Li eq.)
UNCONVENTIONAL BRINE44 Li deposits
9 resources13.6 Mt Li (17.6 Mt Li eq.)
PEGMATITE125 Li deposits
60 resources18.8 Mt Li (20.1 Mt Li eq.)
OTHER GRANITE
GREISEN11 Li deposits6 resources
2.0 Mt Li (3.0 Mt Li eq.)
ALKALI2 Li deposits
LI-RICH CLAY
TYPICAL13 Li deposits4 resources
3.8 Mt Li (4.0 Mt Li eq.)
ATYPICAL11 Li deposits4 resources
3.1 Mt Li (3.7 Mt Li eq.)
VOLCANIC SEDIMENT-HOSTED8 Li deposits2 resources
1.0 Mt Li (1.2 Mt Li eq.)
B-RICH CLAY4 Li deposits
U-RICH CLAY1 Li deposit
NB: the ‘unconventional’ deposits are technically a sub-category of brine deposits, but have been listed separately in this framework to differentiate between technically feasible (‘salar’) and not yet technically feasible (unconventional) deposits.
OILFIELD BRINE35 Li deposits
8 resources10.7 Mt Li (14.6 Mt Li eq.)
GEOTHERMAL BRINE9 Li deposits1 resources
2.8 Mt Li (3.0 Mt Li eq.)
CREDIT: SAM DAVIES; © MinEx Consulting 2019
NB: Resource figures are ‘pre-mined resources’ not ‘current resources’.

MinEx Consulting Strategic advice on mineral economics & exploration
Sedimentary (or clay) deposits are of emergent economic importance to the lithium industry
• Sedimentary lithium, or lithium-clay, deposits are typically hosted by
hydrothermally altered, volcanic-derived sediments deposited in lake beds;
• As with lithium-brine deposits the lithium is leached from rhyolitic lavas,
volcanic ash and lithium-rich magmas by meteoric and hydrothermal fluids;
• There are several examples of atypical mineralisation settings and/or
processes leading to the formation of deposits containing unusual lithium
minerals or salts;
• One common factor is that they are often associated with unusual or even
unique mineralogy;
• It is also worth noting that lithium occurs as a by-product in other ‘clay’
deposits, such as the borate clays of Turkey or the uranium clays in
Macusani, Peru;
• Finally, a separate ‘volcano-clastic’ lithium deposit type has been identified
at Macusani, Peru, with the lithium contained within volcanic tuffs.
CREDIT: SAM DAVIES; OTHER SOURCES: Bradley et al., 2017; Mindat; Lithium Americas; © MinEx Consulting, 2019
• Whilst lithium-rich clays have been mined in the past, this was for the ‘clays’ themselves which had properties useful for drilling muds, paints and
cosmetics, rather than their lithium content (for example, hectorite is named after the ‘Hector’ deposit in California from which such industrial clays were
extracted);
• There is now more focus on extracting the lithium from lithium-clays, though there are no current operations doing this.
Image: The most recent model for ‘typical’ hectorite lithium clay deposits. Lithium-enrichment primarily comes from the erupted ignimbrites and tuffs from lithium-rich rhyolitic magmas, with the volcanic sediments undergoing further enrichment during
burial and diagenesis within the caldera. Hydrothermal and meteoric waters may then further enrich the deposit in lithium. Source: Benson et al., 2017.

MinEx Consulting Strategic advice on mineral economics & exploration
Thacker Pass (Kings Valley) in Nevada is the case example of a ‘typical’ hectorite lithium-clay deposit
• The Thacker Pass lithium-clay project (sometimes known as Kings Valley)
is located in Nevada and owned by Canadian junior, Lithium Americas
(LAC);
• The project is located within an extinct supervolcano – the McDermitt
Caldera – that is associated with the Yellowstone hotspot;
• The genetic model for the deposit (see previous slide) is that of erupted
volcanic sediments depositing in a caldera lake and being leached of
lithium, followed by later volcanic-related uplift which drains the lake and
exposes the lithium-rich sediments;
• LAC envisages a two stage operation, first producing 30,000tpa of lithium
carbonate (Li2CO3) or 5,670tpa of lithium, and then later doubling capacity;
• The current resource across all of ‘Kings Valley’ is 532.7Mt @ 0.292%
lithium, thus containing ~1.56Mt of lithium;
• Although, the Thacker Pass component of the Kings Valley project has a
completed prefeasibility study and defined ‘reserves’ it should be noted the
extraction of lithium-clay deposits is still relatively unproven.
CREDIT: SAM DAVIES; OTHER SOURCES: Lithium Americas; © MinEx Consulting, 2019
Image: Clay alteration phases with depth at the Thacker Pass project moving from relatively unaltered smectite to more altered illite, with a mixed transition zone between. In this deposit the deeper illite is more lithium-rich attributed to greater diagenesis. Source: Lithium Americas

MinEx Consulting Strategic advice on mineral economics & exploration
Jadar (Serbia) is the case example of a ‘world class’ atypicalsedimentary lithium deposit
• Jadar is a lithium-boron deposit in Serbia;
• It is hosted in a sequence of oil-shales, dolomicrites and pyroclastic deposits
within a lacustrine (paleo-lake) sedimentary basin;
• It is the only recorded occurrence of the mineral jadarite (LiNaB3SiO7(OH));
• Nonetheless, the genetics of the deposit are still the hydrothermal alteration of
volcanic ash that had been deposited in an arid, closed basin;
• It appears Jadar may be a fossilised lithium salar/playa in which the lithium-rich
brine has interacted with the basin sediments creating an enriched clay –
something that has been noted in other lithium evaporite/brine deposits but which
may have been ignored due to the presence of conventional lithium brines
available for extraction;
• The current resource at Jadar is 136Mt @ 0.887% lithium, thus containing
~1.2Mt of lithium – a noticeably higher grade than other sedimentary lithium
deposits;
• The deposit also contains abundant borate (21Mt contained, thus grading >15%)
further improving project economics;
• In MinEx’s opinion it is probably the only sedimentary lithium deposit (if you
exclude Zabuye from the class) with the potential to be a ‘Tier 1’ or world class
lithium deposit – should an economically viable processing route be established.
CREDIT: SAM DAVIES; OTHER SOURCES: Stanley et al., 2007; Kesler et al., 2012; Bradley et al., 2017; © MinEx Consulting, 2019
Image: A display quality sample of Jadarite (the white mineral) embedded in host lacustrine clays.
Source: Rio Tinto

MinEx Consulting Strategic advice on mineral economics & exploration
There are a few interesting (undeveloped) sedimentary deposits emerging
Jadar, Serbia
© MinEx Consulting 2019
Falchani, Peru

MinEx Consulting Strategic advice on mineral economics & exploration
The ‘MinEx’ geological framework for lithium depositsTOTAL
389 Li deposits112 resources
70.6 Mt Li (103.4 Mt Li eq.)
IGNEOUS138 Li deposits
66 resources20.8 Mt Li (23.1 Mt Li eq.)
SEDIMENTARY37 Li deposits10 resources
7.9 Mt Li (8.8 Mt Li eq.)
BRINE (SALAR / SALT LAKE)170 Li deposits
27 resources31.1 Mt Li (57.0 Mt Li eq.)
UNCONVENTIONAL BRINE44 Li deposits
9 resources13.6 Mt Li (17.6 Mt Li eq.)
PEGMATITE125 Li deposits
60 resources18.8 Mt Li (20.1 Mt Li eq.)
OTHER GRANITE
GREISEN11 Li deposits6 resources
2.0 Mt Li (3.0 Mt Li eq.)
ALKALI2 Li deposits
LI-RICH CLAY
TYPICAL13 Li deposits4 resources
3.8 Mt Li (4.0 Mt Li eq.)
ATYPICAL11 Li deposits4 resources
3.1 Mt Li (3.7 Mt Li eq.)
VOLCANIC SEDIMENT-HOSTED8 Li deposits2 resources
1.0 Mt Li (1.2 Mt Li eq.)
B-RICH CLAY4 Li deposits
U-RICH CLAY1 Li deposit
NB: the ‘unconventional’ deposits are technically a sub-category of brine deposits, but have been listed separately in this framework to differentiate between technically feasible (‘salar’) and not yet technically feasible (unconventional) deposits.
OILFIELD BRINE35 Li deposits
8 resources10.7 Mt Li (14.6 Mt Li eq.)
GEOTHERMAL BRINE9 Li deposits1 resources
2.8 Mt Li (3.0 Mt Li eq.)
CREDIT: SAM DAVIES; © MinEx Consulting 2019
NB: Resource figures are ‘pre-mined resources’ not ‘current resources’.

MinEx Consulting Strategic advice on mineral economics & exploration
Extracting lithium (but not boric acid) from geothermal brines is not currently technologically feasible
• The concept has existed since at least the 1970s (e.g.
Blake, 1974; Berthold & Baker Jr., 1976) – in response
to the oil crises of the time;
• Presently the only advanced geothermal lithium-brine
project is at the Salton Sea, California and as yet is not
commercially proven;
• However, mineral extraction from geothermal brines has
been proven for other minerals, such as boric acid,
where it has been extracted for over 200 years in
Larderello, Italy (and still is today by the Larderello
Group);
• The image (right) shows a ‘covered lagoon’ or “lagone
coperto” – a brick structure used to extract boric acid
from geothermal waters in the 19th century at
Larderollo;
• However, equivalent processes for lithium have
only been conducted on a small ‘test’ scale.
Image: Lund, 2005
© MinEx Consulting, 2019
MinEx Consulting Strategic advice on mineral economics & exploration
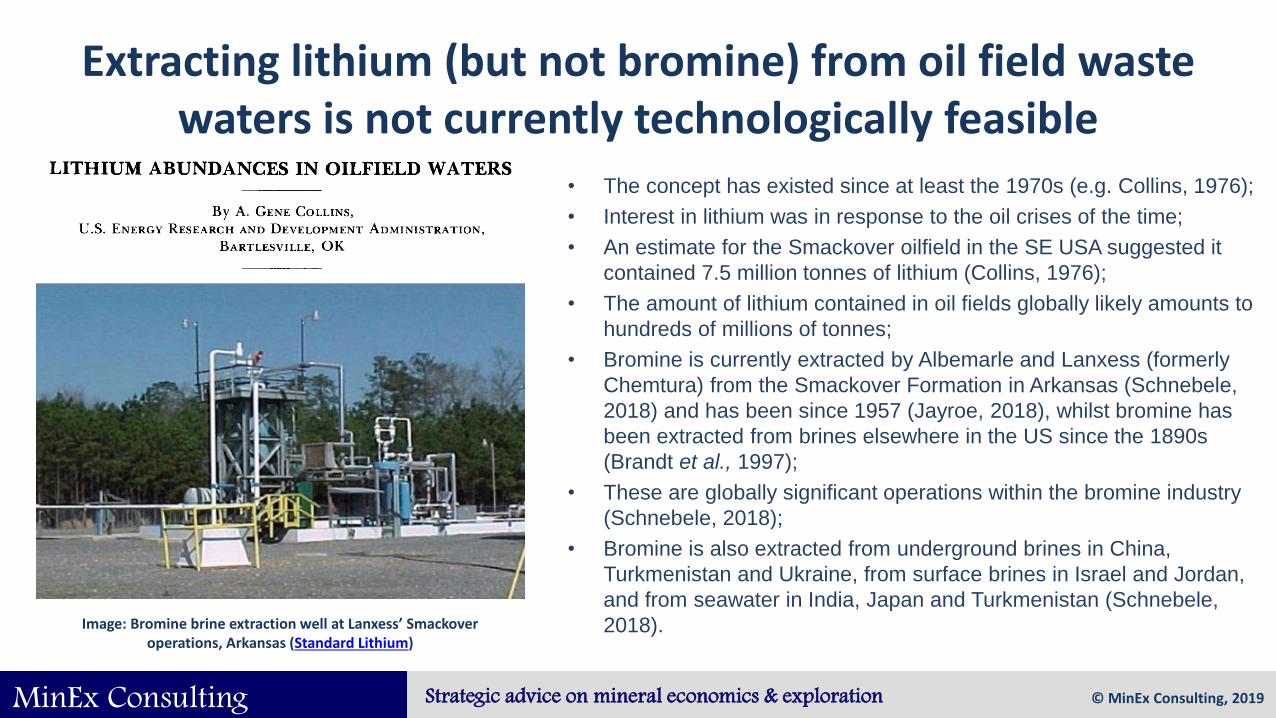
Extracting lithium (but not bromine) from oil field waste waters is not currently technologically feasible
• The concept has existed since at least the 1970s (e.g. Collins, 1976);
• Interest in lithium was in response to the oil crises of the time;
• An estimate for the Smackover oilfield in the SE USA suggested it
contained 7.5 million tonnes of lithium (Collins, 1976);
• The amount of lithium contained in oil fields globally likely amounts to
hundreds of millions of tonnes;
• Bromine is currently extracted by Albemarle and Lanxess (formerly
Chemtura) from the Smackover Formation in Arkansas (Schnebele,
2018) and has been since 1957 (Jayroe, 2018), whilst bromine has
been extracted from brines elsewhere in the US since the 1890s
(Brandt et al., 1997);
• These are globally significant operations within the bromine industry
(Schnebele, 2018);
• Bromine is also extracted from underground brines in China,
Turkmenistan and Ukraine, from surface brines in Israel and Jordan,
and from seawater in India, Japan and Turkmenistan (Schnebele,
2018). Image: Bromine brine extraction well at Lanxess’ Smackover operations, Arkansas (Standard Lithium)
© MinEx Consulting, 2019

MinEx Consulting Strategic advice on mineral economics & exploration
The ‘MinEx’ geological framework for lithium depositsTOTAL
389 Li deposits112 resources
70.6 Mt Li (103.4 Mt Li eq.)
IGNEOUS138 Li deposits
66 resources20.8 Mt Li (23.1 Mt Li eq.)
SEDIMENTARY37 Li deposits10 resources
7.9 Mt Li (8.8 Mt Li eq.)
BRINE (SALAR / SALT LAKE)170 Li deposits
27 resources31.1 Mt Li (57.0 Mt Li eq.)
UNCONVENTIONAL BRINE44 Li deposits
9 resources13.6 Mt Li (17.6 Mt Li eq.)
PEGMATITE125 Li deposits
60 resources18.8 Mt Li (20.1 Mt Li eq.)
OTHER GRANITE
GREISEN11 Li deposits6 resources
2.0 Mt Li (3.0 Mt Li eq.)
ALKALI2 Li deposits
LI-RICH CLAY
TYPICAL13 Li deposits4 resources
3.8 Mt Li (4.0 Mt Li eq.)
ATYPICAL11 Li deposits4 resources
3.1 Mt Li (3.7 Mt Li eq.)
VOLCANIC SEDIMENT-HOSTED8 Li deposits2 resources
1.0 Mt Li (1.2 Mt Li eq.)
B-RICH CLAY4 Li deposits
U-RICH CLAY1 Li deposit
NB: the ‘unconventional’ deposits are technically a sub-category of brine deposits, but have been listed separately in this framework to differentiate between technically feasible (‘salar’) and not yet technically feasible (unconventional) deposits.
OILFIELD BRINE35 Li deposits
8 resources10.7 Mt Li (14.6 Mt Li eq.)
GEOTHERMAL BRINE9 Li deposits1 resources
2.8 Mt Li (3.0 Mt Li eq.)
CREDIT: SAM DAVIES; © MinEx Consulting 2019
NB: Resource figures are ‘pre-mined resources’ not ‘current resources’.

MinEx Consulting Strategic advice on mineral economics & exploration
The global distribution of lithium deposits (by type)
SuperGiant (>5Mt Li)Giant (>1Mt Li)Major (>200Kt Li)Moderate (>20Kt Li)
IGNEOUS SEDIMENTARY BRINE UNCONVENTIONAL
© MinEx Consulting, 2019

MinEx Consulting Strategic advice on mineral economics & exploration
The four main types of lithium deposit form a grade-size distribution
‘Unconventional’ deposits are a sub-group of brine deposits that are not yet technically feasible
© MinEx Consulting 2019

MinEx Consulting Strategic advice on mineral economics & exploration
ECONOMICS OF PEGMATITES VERSUS ‘SALARS’A global overview of the geology and economics of lithium production
IMAGE: Lepidolite, Haapaluoma, Finland (Shutterstock); © MinEx Consulting 2019

MinEx Consulting Strategic advice on mineral economics & exploration
The recent ‘story’ in lithium has been fast growing hard rock spodumene concentrate supply…
Chilean brine entry into lithium – prices
cut by 50%
Dot.com crash
Argentinian brine entry into lithium – further
downward price pressure
Most lithium mineral concentrates still not converted
into carbonate – EV battery demand not yet important
Electronics battery demand becoming
important
Global economic ‘boom’ & mining boom
‘Phase 1’
Lithium ‘boomlet’
GFC!
China driven mining boom (‘Phase 2’)
Asian investment in ROW lithium supply
Lithium batteries for EVs concept
Lithium minerals now commonly converted
to carbonate & hydroxide
Greenbushes doubles supply to China
Supply consolidation
Lithium EV battery demand now
important
New Western Australian
supply
Mining ‘bust’
SOURCE: USGS; © MinEx Consulting, 2019

MinEx Consulting Strategic advice on mineral economics & exploration
…from Western Australia
Chilean brine entry into lithium – prices
cut by 50%
Dot.com crash
Argentinian brine entry into lithium – further
downward price pressure
Most lithium mineral concentrates still not converted
into carbonate – EV battery demand not yet important
Electronics battery demand becoming
important
Global economic ‘boom’ & mining boom
‘Phase 1’
Lithium ‘boomlet’
GFC!
China driven mining boom (‘Phase 2’)
Asian investment in ROW lithium supply
Lithium batteries for EVs concept
Lithium minerals now commonly converted
to carbonate & hydroxide
Greenbushes doubles supply to China
Supply consolidation
Lithium EV battery demand now
important
New Western Australian
supply
Mining ‘bust’
SOURCE: USGS; © MinEx Consulting, 2019

MinEx Consulting Strategic advice on mineral economics & exploration
Both hard rock and brine operations can produce carbonate and hydroxide
Lithium-to-battery options
• Hard rock – concentrate – carbonate, e.g. Cachoeira, Brazil
• Hard rock – concentrate – hydroxide, e.g. Greenbushes
• Brine – carbonate, e.g. Salar de Atacama
• Brine – carbonate – hydroxide, e.g. Salar de Atacama
Which is the more economic option?
• Lithium overall: Hard rock or brine?
• Carbonates: Hard rock or brine?
• Hydroxide: Hard rock or brine?
Hard rock
Brine
Concentrate
Carbonate
Hydroxide
Others
Glass & Ceramics
Lubricants
Batteries
Polymers
Aluminium
Air Conditioning
Pharmaceuticals
Chemicals
SOURCE: Warren, 2018; © MinEx Consulting, 2019
e.g. Greenbushes
e.g. Greenbushes
e.g. Cachoeira, Brazil
e.g. Salar de Atacamae.g. Salar de Atacama

MinEx Consulting Strategic advice on mineral economics & exploration
Initially it appears the spodumene producers are most competitive…
Mineral concentrate
Lithium carbonate or chloride
Lithium hydroxideBUT these produce different products – NOT a like-for-like
comparison
NB: MinEx is reliant on the SNL cost data for this analysis, as well as some very general assumptions. The aim is to show the general strategic picture, rather than accurate break-down of costs.
SOURCE: SNL; © MinEx Consulting, 2019

MinEx Consulting Strategic advice on mineral economics & exploration
Mineral concentrate and downstream lithium products have very different prices
SOURCE: FiFighter, 2016; © MinEx Consulting, 2019
Also note the importance of high-purity carbonate
for pricing

MinEx Consulting Strategic advice on mineral economics & exploration
Mineral concentrate and downstream lithium products have very different costs and prices
Mineral concentrate
Lithium carbonate or chloride
Lithium hydroxide‘Prevailing’ lithium hydroxide price in LCE (see previous slide)
‘Prevailing’ high-purity lithium carbonate price in LCE (see previous slide)
‘Prevailing’ low-purity lithium carbonate price in LCE (see previous slide)
‘Prevailing’ spodumene concentrate price in LCE (see previous slide)
NB: MinEx is reliant on the SNL cost data for this analysis, as well as some very general assumptions. The aim is to show the general strategic picture, rather than accurate break-down of costs.
SOURCES: FiFighter, 2016; SNL; © MinEx Consulting, 2019

MinEx Consulting Strategic advice on mineral economics & exploration
Normalised for product price the spodumene miners become less competitive… integrating more economic
Mineral concentrate
Lithium carbonate or chloride
Lithium hydroxide
Break even
NB: MinEx is reliant on the SNL cost data for this analysis, as well as some very general assumptions. The aim is to show the general strategic picture, rather than accurate break-down of costs.
SOURCES: FiFighter, 2016; SNL; © MinEx Consulting, 2019

MinEx Consulting Strategic advice on mineral economics & exploration
SOME THOUGHTS ON THE WESTERN AUSTRALIAN ‘LITHIUM VALLEY’ CONCEPT
A global overview of the geology and economics of lithium production
IMAGE: Mt Cattlin, Western Australia (Shutterstock); © MinEx Consulting, 2019

MinEx Consulting Strategic advice on mineral economics & exploration
WA’s ‘Lithium Valley’ and ‘cluster economics’• Clustering is a well-established economic concept, where companies (and a
local industry) gain a competitive advantage due to proximity;
• They have better access to relevant resources, suppliers, infrastructure,
education, expertise, innovations, economies of scale, brand, and often
favourable (but relevant) business climates;
• The complex, intangible nature of a cluster creates very high ‘barriers to entry’;
• The advantage endures long after initial ‘cost advantages’ may have dissipated;
• Classic examples include:
– Silicon Valley, San Francisco;
– Hollywood, Los Angeles
– Napa Valley wine – all French wine – and Margaret River nearer home;
– German car manufacturing;
– British F1 car manufacturing;
– Italian leather manufacturing;
– Swiss watches;
– Biotech in Massachusetts;
– Finance in London & New York;
– Outsourcing in/to India;
– ‘Factory Asia’ (see right)
Image: The Pearl River Basin, China – this increasingly high cost manufacturing location still sits at the centre of ‘Factory Asia’ co-ordinating a massive SE Asian manufacturing cluster managing and outsourcing low-cost manufacturing, and
implementing high-end and innovative, automated manufacturing at the centre. It is a substantial barrier to entry for non-Asian manufacturers. ‘Cluster economics’
now explains China’s manufacturing dominance better than ‘low costs’.
SOURCES: Porter, 1998; Porter & Kramer, 2011; The Economist, 2009; The Economist, 2015; The Economist, 2015; The Economist, 2017; The Economist,
2017; The Economist, 2018; © MinEx Consulting, 2019

MinEx Consulting Strategic advice on mineral economics & exploration
Tasmania
Northern Territory
A.C.T.
South AustraliaRegistered businesses:
2,437 (4.5%)Mining: 88 (3.3%)
QueenslandRegistered businesses: 7,268 (13.4%)
Mining: 384 (14.3%)Metal Mining: 105 (7.9%)
Metal Mining Services: 72 (8.5%)Lithium businesses: 8 (7.2%) New South Wales
Registered businesses: 18,451 (34.0%)Mining: 495 (18.5%)
Metal Mining: 192 (14.5%)Metal Mining Services: 117 (13.8%)
Lithium businesses: 16 (14.4%)
VictoriaRegistered businesses: 18,287 (33.7%)
Mining: 584 (21.8%)Metal Mining: 249 (18.8%)
Metal Mining Services: 157 (18.6%)Lithium businesses: 22 (19.8%)
Western AustraliaRegistered businesses: 5,506 (10.2%)
Mining: 1,034 (38.6%)Metal Mining: 679 (51.2%)
Metal Mining Services: 436 (51.6%)Lithium businesses: 59 (53.2%)
WA is already a ‘mining and exploration’ cluster
Data: Company360; © MinEx Consulting, 2019
NB: Percentage in brackets refers to that states share of Australia’s businesses in that category. Bubble area represents relative size of mining industry by no. of mining related companies.

MinEx Consulting Strategic advice on mineral economics & exploration
The WA ‘Lithium Valley’ concept is realistic (but still a challenge)
• Good lithium deposits!
• Low-grade of spodumene concentrate
(freight cost);
• Minerals industry infrastructure, suppliers and
expertise;
• Economies of scale (for once);
• Supportive academic communities;
• Supportive local government;
• Proximity to China – a chance to join
‘Factory Asia’;
• Or potentially some geopolitical linkages with
other Asian battery clusters;
• But more realistically battery raw materials,
rather than ‘batteries’ (so not quite ‘Factory
WA’.
Image: Western Australia’s hard rock lithium deposits, with bubble size
reflecting relative size by contained lithium. Source: MinEx Consulting, 2019.
© MinEx Consulting, 2019

MinEx Consulting Strategic advice on mineral economics & exploration
A NOTE ON STRATEGIC COHERENCEA global overview of the geology and economics of lithium production
Image: Shutterstock; © MinEx Consulting, 2019

MinEx Consulting Strategic advice on mineral economics & exploration
Lithium mining, the ‘green revolution’ and strategic coherence
• The mining industry is facing real
pressure to genuinely implement
more sustainable practices;
• In addition, lithium is seen as a
‘green metal’ suggesting such
pressures may be greater;
• e.g. The Whabouchi lithium project in
Quebec (see left) was designed to go
underground ‘early’ for environmental
and social reasons;
• This is likely more due to its location
(in Quebec) than because it is a
lithium project;
• BUT the ‘green’ focus of lithium will
likely create stakeholder demand for
‘green’ coherence in lithium mining
strategy.
Image: Section from Whabouchi Feasibility Study (2018) with author highlights
SOURCES: Sykes & Trench, 2018; Dupere et al., 2018; © MinEx Consulting, 2019
MinEx Consulting Strategic advice on mineral economics & exploration
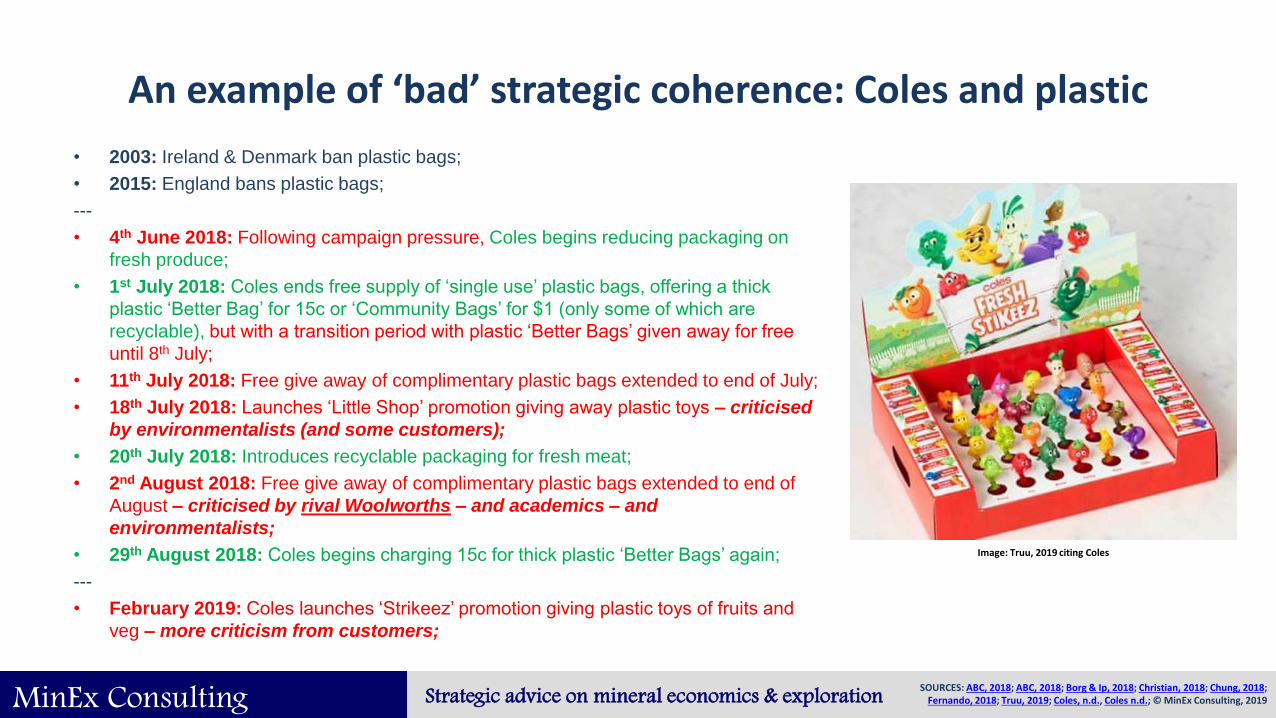
An example of ‘bad’ strategic coherence: Coles and plastic
• 2003: Ireland & Denmark ban plastic bags;
• 2015: England bans plastic bags;
---
• 4th June 2018: Following campaign pressure, Coles begins reducing packaging on
fresh produce;
• 1st July 2018: Coles ends free supply of ‘single use’ plastic bags, offering a thick
plastic ‘Better Bag’ for 15c or ‘Community Bags’ for $1 (only some of which are
recyclable), but with a transition period with plastic ‘Better Bags’ given away for free
until 8th July;
• 11th July 2018: Free give away of complimentary plastic bags extended to end of July;
• 18th July 2018: Launches ‘Little Shop’ promotion giving away plastic toys – criticised
by environmentalists (and some customers);
• 20th July 2018: Introduces recyclable packaging for fresh meat;
• 2nd August 2018: Free give away of complimentary plastic bags extended to end of
August – criticised by rival Woolworths – and academics – and
environmentalists;
• 29th August 2018: Coles begins charging 15c for thick plastic ‘Better Bags’ again;
---
• February 2019: Coles launches ‘Strikeez’ promotion giving plastic toys of fruits and
veg – more criticism from customers;
SOURCES: ABC, 2018; ABC, 2018; Borg & Ip, 2018; Christian, 2018; Chung, 2018; Fernando, 2018; Truu, 2019; Coles, n.d., Coles n.d.; © MinEx Consulting, 2019
Image: Truu, 2019 citing Coles

MinEx Consulting Strategic advice on mineral economics & exploration
An example of ‘good’ strategic coherence: Shell and CO2
It is not Shell’s CO2 emissions that are the problem (15% of their
CO2 footprint)…
It is Shell’s customers’ CO2 emissions that are
the problem (85% of their CO2 footprint)…
As well as trying to reduce its own CO2 emissions, Shell is also trying to reduce its customers’
CO2 emissions (or at least accounting for it)
…but this is where some petroleum
companies are focusing
SOURCES: Shell, 2019; © MinEx Consulting, 2019

MinEx Consulting Strategic advice on mineral economics & exploration
What is a coherent lithium mining strategy?
Potential components of a ‘coherent’ lithium mining strategy:
• Operations
– Renewable power plants? e.g. Sandfire Resources;
– EV fleets (Anglo American is looking at hydrogen) – also good for H&S;
– Going underground early, e.g. Whabouchi;
– EV company cars? Especially the CEO & Chairman!
– What about tailings and waste? Water use? Electricity use? Recycling bins?
• Exploration
– Remote, low impact exploration?
– BUT maintaining good local stakeholder contact (explorers as anthropologists);
– Exploring in EVs? ‘What would Elon do?’
• Investors
– Targeting ESG investors? Governance important is important too.
– Targeting millennials? Bitcoin, crowdfunding, gamification?
– Targeting Tesla, Apple, Toyota etc., Supply chain transparency is important;
• Government & Social
– Most lithium projects in countries such as Canada, Australia, Germany, Finland, Spain
etc., where environmental and social concerns are commonplace;
– Land values are often higher leading to land-use conflict;
– Lithium is often seen as ‘strategic’ which may create requirements for socio-politically or
geopolitically appropriate off-takers, a desire for downstream integration, low content use,
or local employment rules.
• Leadership
– Not pale, stale and grey?
SOURCES: Sykes & Trench, 2018; © MinEx Consulting, 2019
For more on
‘strategic coherence’ in
mining…
Image: Threadsquad on Amazon

MinEx Consulting Strategic advice on mineral economics & exploration
A NOTE ON LITHIUM PRICES, BOOMS AND LONG-TERM MARKET GROWTH
A global overview of the geology and economics of lithium production
IMAGE: Salt extraction, Salinas Grandes, Argentina (Shutterstock)

MinEx Consulting Strategic advice on mineral economics & exploration
The recent lithium prices are a historical anomaly
Li2CO3 Historic Ave. Price*
2018 US/t
67-yr 8,424
20-yr 5,273
10-yr 6,924
5-yr 8,257
3-yr 9,870
MinEx (3-yr) 9,735
MinEx (10-yr) 6,924
NB: Generally, MinEx uses 3-year average prices in its database, however, the lithium price spike means a 10-year price is more appropriate for understanding the quality of a mine or project through the full price cycle.
SOURCES: BLS; SNL; USGS [MCS]; USGS [DS140]; © MinEx Consulting, 2019

MinEx Consulting Strategic advice on mineral economics & exploration
For the industry to grow prices will need to moderate
We are in an unusual
‘Lithium Boom’
(‘Party’) market at the
moment – with
growing volumes
and high prices –
this will be
temporary;
Either volumes will
grow and prices will
fall (‘Parents’);
Or high prices will
choke demand and
kill of growth and
normalise prices (the
‘Hangover’);
Or high prices and
high demand will
encourage
politicians to get
involved (the
Policemans market).
Volumes
Pri
ces
The ‘Party’ market(rare and always very temporary)
The ‘Parents’ market(the usual situation… all work and
no play)
The ‘Policemans’ market(party gets out of control… politicians
get involved to ‘secure’ supply…)
The ‘Hangover’ market(all too real, but also usually temporary
– and usually partly your fault)
SOURCES: Sernovitz, 2016; © MinEx Consulting, 2019

MinEx Consulting Strategic advice on mineral economics & exploration
Small mineral markets do sometimes grow into large ones
x1,000+
x8,800+
x0.1
Factors in place prior to 20th century
Key supply & demand innovations in late 19th & early 20th century
Crustal abundance
Large bauxite deposits
Images: Alcoa; Shutterstock
Bulk open pit mining
Bayer & Hall-Heroult
processes
New uses Cheap energy
SOURCES: Sykes et al., 2016a,b; USGS; © MinEx Consulting, 2019

MinEx Consulting Strategic advice on mineral economics & exploration
Is lithium on this growth track? Only with lower prices…
Metal Crustal Abundance (ppm)
Aluminium 84,300
Zinc 72
Nickel 59
Copper 27
Cobalt 27
Lithium 17
Lead 11
Tin 2
Molybdenum 1
SOURCES: Sykes et al., 2016a,b; USGS; © MinEx Consulting, 2019
Lithium, 1989-2018
Aluminium, 1904-1933

MinEx Consulting Strategic advice on mineral economics & exploration
IN SUMMARY
A global overview of the
geology and economics of
lithium production
Image: Shutterstock; © MinEx Consulting, 2019

MinEx Consulting Strategic advice on mineral economics & exploration
In summary: The global geology & economics of lithium
• Lithium demand is growing fast, driven by a wide range of battery applications, which are in turn changing the structure of
demand, the lithium supply chain and potentially raw material requirements – though much still remains uncertain;
• Geologically ‘brine’ salars and ‘hard rock’ pegmatites remain the most important lithium deposit types in terms of
production and undeveloped resources, however, there are some interesting emerging sedimentary / clay deposits and
unconventional brine concepts – and lithium remains very ‘under explored’ globally;
• Spodumene pegmatites in Australia are the fastest growing source of supply, however, long-term competitiveness may be
dependent on successful downstream integration targeting the battery industry;
• The concept of a Western Australian ‘Lithium Valley’ is possible, despite high costs, due to the number of quality mines,
proximity to Asia, and the unit reduction in freight costs associated with the low grade spodumene concentrate, in addition
to the ‘cluster effect’ of many minerals businesses, specialists and students;
• The ‘green’ association of lithium use presents a challenge of ‘strategic coherence’ to explorers and miners impacting
decisions around exploration, mining, investors, stakeholders, and leadership;
• But remember, we are in an unsustainable ‘lithium boom’ of high prices and high volume growth – future long-term growth
of the industry is reliant on structurally lower prices, and thus structurally lower costs.
© MinEx Consulting, 2019

MinEx Consulting Strategic advice on mineral economics & exploration
Thank You!
Contact details
John Sykes
Strategist
MinEx Consulting
Perth, Australia
Email: [email protected]
Website: www.MinExConsulting.com
Copies of this and other similar presentations can be downloaded
from our website
© MinEx Consulting, 2019

MinEx Consulting Strategic advice on mineral economics & exploration
References [1]• Azevedo, M., Campagnol, N., Hagenbruch, T., Hoffman, K., Lala, A., & Ramsbottom, O., 2018, Lithium and cobalt – a tale of two commodities, McKinsey &
Company, June, 20p.
• Benson, T.R., Coble, M.A., Rytuba, J.J., & Mahood, G.A., 2017, Lithium enrichment in intracontinental rhyolite magmas leads to Li deposits in caldera
basins, Nature Communications, 8(270), pp.1-9.
• Berthold, C.E., & Baker, D.H., 1976, Lithium Recovery in Geothermal Fluids, in ‘Lithium Resources and Requirements by the Year 2000’, U.S. Geological
Survey, Reston, VA, pp.61-66.
• Blake, R.L., 1974, Extracting Minerals From Geothermal Brines: A Literature Study: U.S. Bureau of Mines Information Circular, 8638, 30p.
• Bradley, D., Munk, L-A., Jochens, H., Hynek, S., & Labay, K., 2013, A Preliminary Deposit Model for Lithium Brains, U.S. Geological Survey Open-File
Report, 2013-1006, 9p.
• Bradley, D.C., Stillings, L.L., Jaskula, B.W., Munk, L., & McCauley, A.D., 2017, Lithium, chap. K of Schulz, K.J., DeYoung Jr, J.H., Seal II, R.R., & Bradley,
D.C., eds., Critical mineral resources of the United States – Economic and environmental geology and prospects for future supply: U.S. Geological Survey
Professional Paper, 1802, pp.K1– K21
• Brandt, E.N., Cassar, A.J., Kohl, G.S., Ziemelis, M.J., & Bohning, J.J., 1997, A National Historic Chemical Landmark: First Commercial Production of
Bromine in the United States, American Chemical Society, Midland, MI, 29 May, 8p.
• Collins, A.G., 1976, Lithium Abundances in Oilfield Waters, in ‘Lithium Resources and Requirements by the Year 2000’, U.S. Geological Survey, Reston,
VA, pp.116-123.
• Dupéré, M., Perez, P., Boyd, A., Anson, J., Girard, P., Tremblay, D., Stapinsky, M., Michaud, A., Tremblay, M., Gagnon, R., 2018, NI 43-101 Technical
Report Feasibility Study on the Whabouchi Lithium Mine and Shawinigan Electrochemical Plant for Nemaska Lithium, Met-Chem, DRA, SGS, Hatch, SNC
Lavalin & Noram, 21 February (Effective Date: 7 November 2017), pp.116-123.
• Hao, H., Liu, Z., Zhao, F., Geng, Y., & Sarkis, J., 2017, Materials flow analysis of lithium in China, Resources Policy, 51, pp.100-106
• Houston, J., Butcher, A., Ehren, P., Evans, K., & Godfrey, L., 2011, The Evaluation of Brine Prospects and the Requirement for Modifications to Filing
Standards, Economic Geology, 106, pp.1225-1239
© MinEx Consulting, 2019

MinEx Consulting Strategic advice on mineral economics & exploration
References [2]• Jaskula, B.W., 2017, Lithium, in ‘Mineral Commodity Summaries’, U.S. Geological Survey, Reston, VA, pp.100-101
• Jayroe, D., 2018, Arkansas Set to Play Major Role in Electric Vehicle Market, Arkansas Money & Politics, October: https://amppob.com/arkansas-role-
electric-vehicle-market/
• Kesler, S.E., Gruber, P.W., Medina, P.A., Keoleian, G.A., Everson, M.P., & Wallington, T.J., 2012, Global lithium resources: Relative importance of
pegmatite, brine and other deposits, Ore Geology Reviews, 48, pp.55-69
• London, D., 2016, Rare-Element Granitic Pegmatites, chap. 8 of Verplanck, P.L., & Hitzman, M.W., eds., Rare Earth and Critical Elements in Ore Deposits:
Reviews in Economic Geology, 18, pp.165-193
• Lund, J.W., 2005, 100 Years Of Geothermal Power Product, Proceedings of the Thirtieth Workshop on Geothermal Reservoir Engineering, 31 January-2
February, Stanford, CA, 10p.
• Macquarie Wealth Management, 2018, Lithium: Welcome to Thunderdome, Commodities Comment, 2 August, 6p.
• Orocobre, 2018, Annual General Meeting, 23 November, 24p.
• Partington, G.A., McNaughton, N.J., & Williams, I.S., 1995, A Review of the Geology, Mineralization and Geochronology of the Greenbushes Pegmatite,
Western Australia, Economic Geology, 90, pp.616-635
• Porter, M.E., 1998, Clusters and the New Economics of Competition, Harvard Business Review, November-December, pp.77-90.
• Porter, M.E., & Kramer, M.R., 2011, Shared Value: How to reinvent capitalism – and unleash a wave of innovation and growth, Harvard Business Review,
January-February, pp.63-77.
• Schnebele, E.K., 2018, Bromine, in ‘2016 Minerals Yearbook’, U.S. Geological Survey, Reston, VA, 8p.
• Sernovitz, G., 2016, The Green and the Black: The Complete Story of the Shale Revolution, the Fight Over Fracking, and the Future of Energy, St. Martin's
Press, New York, NY, 280p.
• Stanley, C.J., Jones, G.C., Rumsey, M.S., Blake, C., Roberts, A.C., Stirling, J.A.R., Carpenter, G.J.C., Whitfield, P.S., Grice, J.D., & Lepage, Y., 2007,
Jadarite, LiNaSiB3O7(OH), a new mineral species from the Jadar Basin, Serbia, European Journal of Mineralogy, 19, pp.575-580
© MinEx Consulting, 2019

MinEx Consulting Strategic advice on mineral economics & exploration
References [3]• Sykes, J.P., Wright, J.P., & Trench, A., 2016, Discovery, supply and demand: From Metals of Antiquity to critical metals, Applied Earth Science, 125(1),
pp.3-20
• Sykes, J.P., Wright, J.P., Trench, A., & Miller, P., 2016, An assessment of the potential for transformational market growth amongst the critical metals,
Applied Earth Science, 125(1), pp.21-56
• Warren, J., 2018, Brine evolution and origins of potash ore salts: Primary or secondary? Part 1 of 3, Salty Matters, 31 October:
http://www.saltworkconsultants.com/blog/brine-evolution-and-origins-of-potash-ore-salts-primary-or-secondary-part-1-of-3
• Wenman, T., 2006, There’s Gold in Margaret River, Drumprint, Mandurah, WA, 144p.
• Zhu, C., Dong, Y., Yun, Z., Hao, Y., Wang, C., Dong, N., & Li, W., 2014, Study of lithium exploitation from carbonate subtype and sulfate type salt-lakes of
Tibet, Hydrometallurgy, 149, pp.143-147.
© MinEx Consulting, 2019