a graph-based approach to skin mole matching …hamarneh/ecopy/cvpr2009.pdf · a graph-based...
TRANSCRIPT

A Graph-based Approach to Skin Mole Matching IncorporatingTemplate-Normalized Coordinates
Hengameh Mirzaalian1, Ghassan Hamarneh1, Tim K. Lee1,2,3
1Medical Image Analysis Lab, Simon Fraser University, BC Canada2Cancer Control Research, BC Cancer Agency, BC Canada
3Department of Dermatology and Skin Science, University of British Columbia, BC Canada{hma36,hamarneh}@cs.sfu.ca,[email protected]
Abstract
Density of moles is a strong predictor of malignantmelanoma. Some dermatologists advocate periodic full-body scan for high-risk patients. In current practice, physi-cians compare images taken at different time instances torecognize changes. There is an important clinical need tofollow changes in the number of moles and their appear-ance (size, color, texture, shape) in images from two differ-ent times. In this paper, we propose a method for findingcorresponding moles in patient’s skin back images at differ-ent scanning times. At first, a template is defined for the hu-man back to calculate the moles’ normalized spatial coor-dinates. Next, matching moles across images is modeled asa graph matching problem and algebraic relations betweennodes and edges in the graphs are induced in the match-ing cost function, which contains terms reflecting proximityregularization, angular agreement between mole pairs, andagreement between the moles’ normalized coordinates cal-culated in the unwarped back template. We propose anddiscuss alternative approaches for evaluating the goodnessof matching. We evaluate our method on a large set of syn-thetic data (hundreds of pairs) as well as 56 pairs of realdermatological images. Our proposed method compares fa-vorably with the state-of-the-art.
1. IntroductionMelanoma is one of the fastest growing cancers among
the white population in the world with an average 3% in-crease in incidence for the last four decades. In the USAand Canada alone, it is estimated that there will be 67,080new cases of melanoma in 2008 [17, 1].
The mechanism of melanoma development is not fullyunderstood. Nevertheless, mole density (number of molesper unit area of skin) has been reported as the strongest riskfactor, and about 50% of melanoma originates from pre-
existing moles. Early diagnosis of melanoma may lead topotentially life-saving therapy. To allow for early diagno-sis, patients are full-body scanned periodically and digitalcolor images of the skin are collected during the process.One example of the back images at two different times isshown in Figure 1(a). During a dermatological examina-tion, a physician compares the skin images at different timeinstances to observe changes in the number of moles andtheir appearance, such as size, color, shape, and texture.However, relying on visual inspection of moles is costly,time consuming, and may be error prone due to fatigue [8].Therefore, an automatic method for matching correspond-ing moles would have significant health benefits, especiallyfor tracking moles in patients who are at a high risk of de-veloping melanoma and, hence, require regular mole exam-inations.
To the best of our knowledge, there exists limited previ-ous work on skin mole or lesion matching. In [9], Huangand Bergstresser proposed to utilize the area of the voronoicells surrounding moles in the similarity term for molematching. Then, a dynamic programming approach wasused to find corresponding moles. To favor preserving thetopology of the constellation of moles, moles were sortedbased on their distance to a reference mole. In [15], Pered-nia and White proposed a two-step process to match moles.First, they assumed some known mole matches and solvedfor an affine transformation that brings the known matchesinto alignment. Then, they corresponded each unmatchedmole to its closest neighbor after alignment. Similarly, theapproach in [18] also relies on an initial matching of molesto establish a course alignment. The lines between the ini-tial matches are then used to construct baselines. Certaingeometrical properties for each mole with respect to thesebaselines are then used in a similarity metric to find the cor-responding moles. Compared with [15], [18] is more robustto non-rigid transformation caused by changes in the pa-tients posture.
2152978-1-4244-3991-1/09/$25.00 ©2009 IEEE
Authorized licensed use limited to: SIMON FRASER UNIVERSITY. Downloaded on September 26, 2009 at 17:09 from IEEE Xplore. Restrictions apply.
The mole matching problem can be seen as a generalpoint cloud or graph matching problem. We, therefore,highlight some key related works in this latter area. In [11],a spectral method for finding consistent correspondencesbetween two sets of features is proposed by Leordeanu andHebert. After constructing an adjacency matrix represent-ing the pairwise agreements between edges, the correct as-signments are recovered based on how strongly they belongto the main cluster of the matrix, using eigenvector decom-position. In [14], Coherent Point Drift (CPD) algorithmwas proposed by Myronenko et al. CPD establishes cor-respondence between two point sets based on a maximumlikelihood estimate that enforces motion (or velocity field)coherence. CPD simultaneously finds both the non-rigidtransformation and the correspondence between two pointsets without making any prior assumption about the trans-formation model except that of motion coherence. In [2],shape context features are used in the similarity measure-ment to find corresponding points and the best non-rigidalignment of two shapes is provided by thin-plate splines.Zheng and Doermann [23] formulate point matching as anoptimization problem to preserve local neighborhood struc-tures during matching and use shape context distance to ini-tialize the graph matching, followed by relaxation labelingupdates for refinement. Maciel and Costeira [12] formulatethe matching problem as an integer constrained minimiza-tion and find global optimal solution via a relaxed concaveobjective function. Gold et al. [7] define the pose term (theaffine transformation between points) into the point match-ing objective and use soft assign to find good suboptimalsolutions. Zass and Shashua [22] derive the hyper-graphmatching problem in a probabilistic setting, which is solvedvia convex optimization and based on an algebraic relationbetween the hyperedges; the global optimum of the match-ing is found via an iterative successive projection algorithm.
We note that previous mole matching approaches (e.g.[18, 9, 15]) do not benefit from state of the art pointand graph matching techniques. Further, for improvedmole matching, we argue that matching algorithms (e.g.[22]) must be extended to incorporate high-level, domainknowledge about the anatomy, e.g. the human back. Inthis paper, we propose to augment anatomical knowledgeinto the state-of-the-art matching algorithms and developan anatomy-aware mole matching technique. We are in-spired by works on human brain atlases, which have ben-efited the medical image analysis research in many ways;mainly by providing a common frame-of-reference that fa-cilitates cross-sectional and longitudinal comparisons ofbrain anatomy [19, 20, 5, 13]. We propose the first hu-man back template (or atlas) to encode spatial mole coor-dinates in a common normalized coordinate system (sec-tions 3 and 4). After a discussion on graph representationof the constellation of moles in section 5, we extend the hy-
(a) (b)
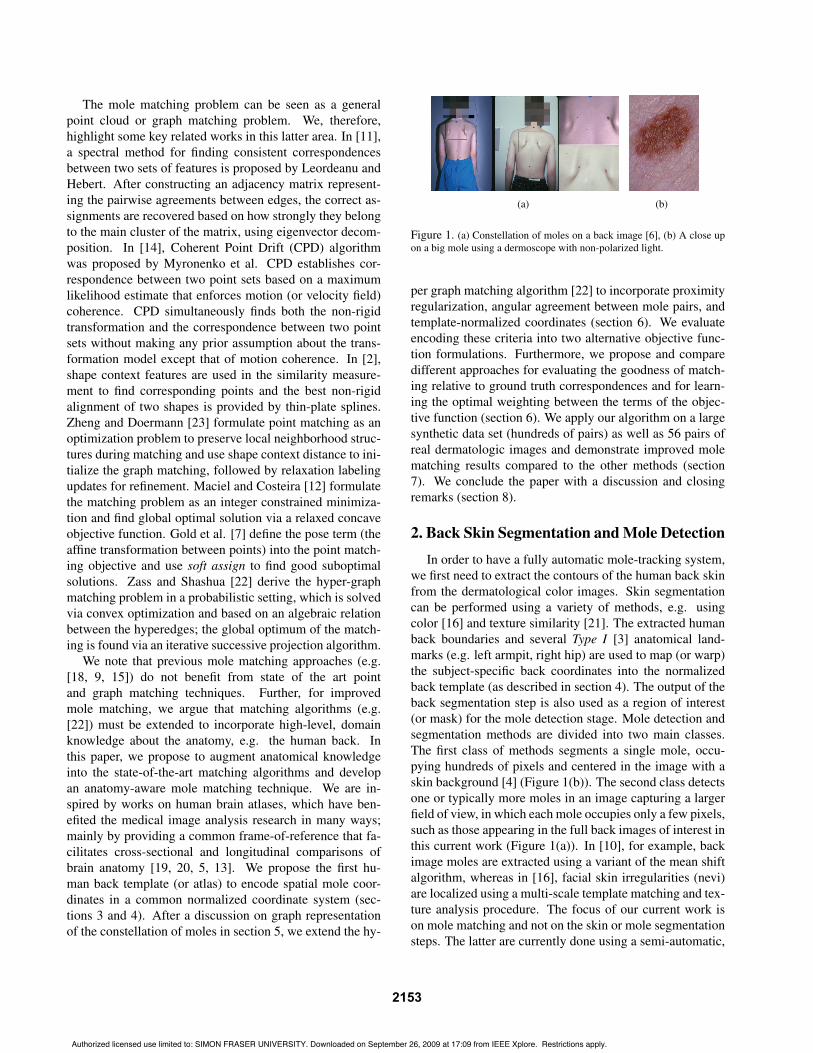
Figure 1. (a) Constellation of moles on a back image [6], (b) A close upon a big mole using a dermoscope with non-polarized light.
per graph matching algorithm [22] to incorporate proximityregularization, angular agreement between mole pairs, andtemplate-normalized coordinates (section 6). We evaluateencoding these criteria into two alternative objective func-tion formulations. Furthermore, we propose and comparedifferent approaches for evaluating the goodness of match-ing relative to ground truth correspondences and for learn-ing the optimal weighting between the terms of the objec-tive function (section 6). We apply our algorithm on a largesynthetic data set (hundreds of pairs) as well as 56 pairs ofreal dermatologic images and demonstrate improved molematching results compared to the other methods (section7). We conclude the paper with a discussion and closingremarks (section 8).
2. Back Skin Segmentation and Mole DetectionIn order to have a fully automatic mole-tracking system,
we first need to extract the contours of the human back skinfrom the dermatological color images. Skin segmentationcan be performed using a variety of methods, e.g. usingcolor [16] and texture similarity [21]. The extracted humanback boundaries and several Type I [3] anatomical land-marks (e.g. left armpit, right hip) are used to map (or warp)the subject-specific back coordinates into the normalizedback template (as described in section 4). The output of theback segmentation step is also used as a region of interest(or mask) for the mole detection stage. Mole detection andsegmentation methods are divided into two main classes.The first class of methods segments a single mole, occu-pying hundreds of pixels and centered in the image with askin background [4] (Figure 1(b)). The second class detectsone or typically more moles in an image capturing a largerfield of view, in which each mole occupies only a few pixels,such as those appearing in the full back images of interest inthis current work (Figure 1(a)). In [10], for example, backimage moles are extracted using a variant of the mean shiftalgorithm, whereas in [16], facial skin irregularities (nevi)are localized using a multi-scale template matching and tex-ture analysis procedure. The focus of our current work ison mole matching and not on the skin or mole segmentationsteps. The latter are currently done using a semi-automatic,
2153
Authorized licensed use limited to: SIMON FRASER UNIVERSITY. Downloaded on September 26, 2009 at 17:09 from IEEE Xplore. Restrictions apply.
user-assisted algorithm to rule out errors in matching due toincorrect segmentation (see future work in section 8).
3. Human Back TemplateIn order to have an anatomically meaningful compari-
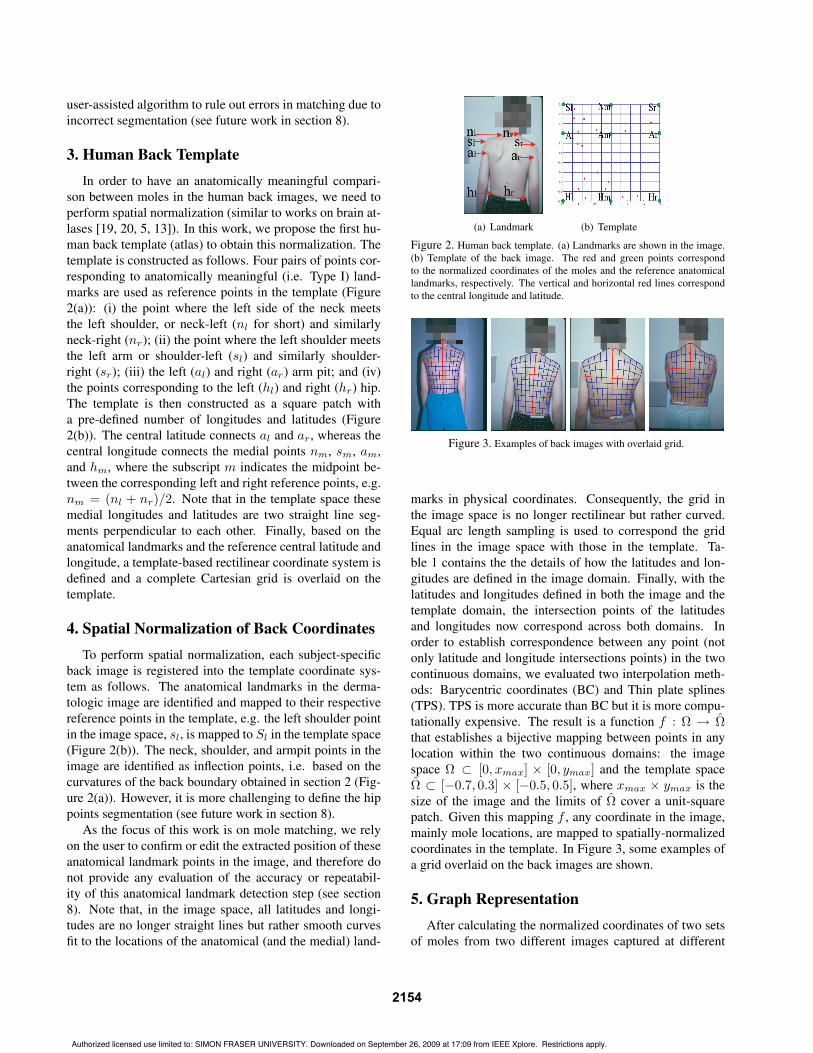
son between moles in the human back images, we need toperform spatial normalization (similar to works on brain at-lases [19, 20, 5, 13]). In this work, we propose the first hu-man back template (atlas) to obtain this normalization. Thetemplate is constructed as follows. Four pairs of points cor-responding to anatomically meaningful (i.e. Type I) land-marks are used as reference points in the template (Figure2(a)): (i) the point where the left side of the neck meetsthe left shoulder, or neck-left (nl for short) and similarlyneck-right (nr); (ii) the point where the left shoulder meetsthe left arm or shoulder-left (sl) and similarly shoulder-right (sr); (iii) the left (al) and right (ar) arm pit; and (iv)the points corresponding to the left (hl) and right (hr) hip.The template is then constructed as a square patch witha pre-defined number of longitudes and latitudes (Figure2(b)). The central latitude connects al and ar, whereas thecentral longitude connects the medial points nm, sm, am,and hm, where the subscript m indicates the midpoint be-tween the corresponding left and right reference points, e.g.nm = (nl + nr)/2. Note that in the template space thesemedial longitudes and latitudes are two straight line seg-ments perpendicular to each other. Finally, based on theanatomical landmarks and the reference central latitude andlongitude, a template-based rectilinear coordinate system isdefined and a complete Cartesian grid is overlaid on thetemplate.
4. Spatial Normalization of Back CoordinatesTo perform spatial normalization, each subject-specific
back image is registered into the template coordinate sys-tem as follows. The anatomical landmarks in the derma-tologic image are identified and mapped to their respectivereference points in the template, e.g. the left shoulder pointin the image space, sl, is mapped to Sl in the template space(Figure 2(b)). The neck, shoulder, and armpit points in theimage are identified as inflection points, i.e. based on thecurvatures of the back boundary obtained in section 2 (Fig-ure 2(a)). However, it is more challenging to define the hippoints segmentation (see future work in section 8).
As the focus of this work is on mole matching, we relyon the user to confirm or edit the extracted position of theseanatomical landmark points in the image, and therefore donot provide any evaluation of the accuracy or repeatabil-ity of this anatomical landmark detection step (see section8). Note that, in the image space, all latitudes and longi-tudes are no longer straight lines but rather smooth curvesfit to the locations of the anatomical (and the medial) land-
(a) Landmark (b) Template
Figure 2. Human back template. (a) Landmarks are shown in the image.(b) Template of the back image. The red and green points correspondto the normalized coordinates of the moles and the reference anatomicallandmarks, respectively. The vertical and horizontal red lines correspondto the central longitude and latitude.
Figure 3. Examples of back images with overlaid grid.
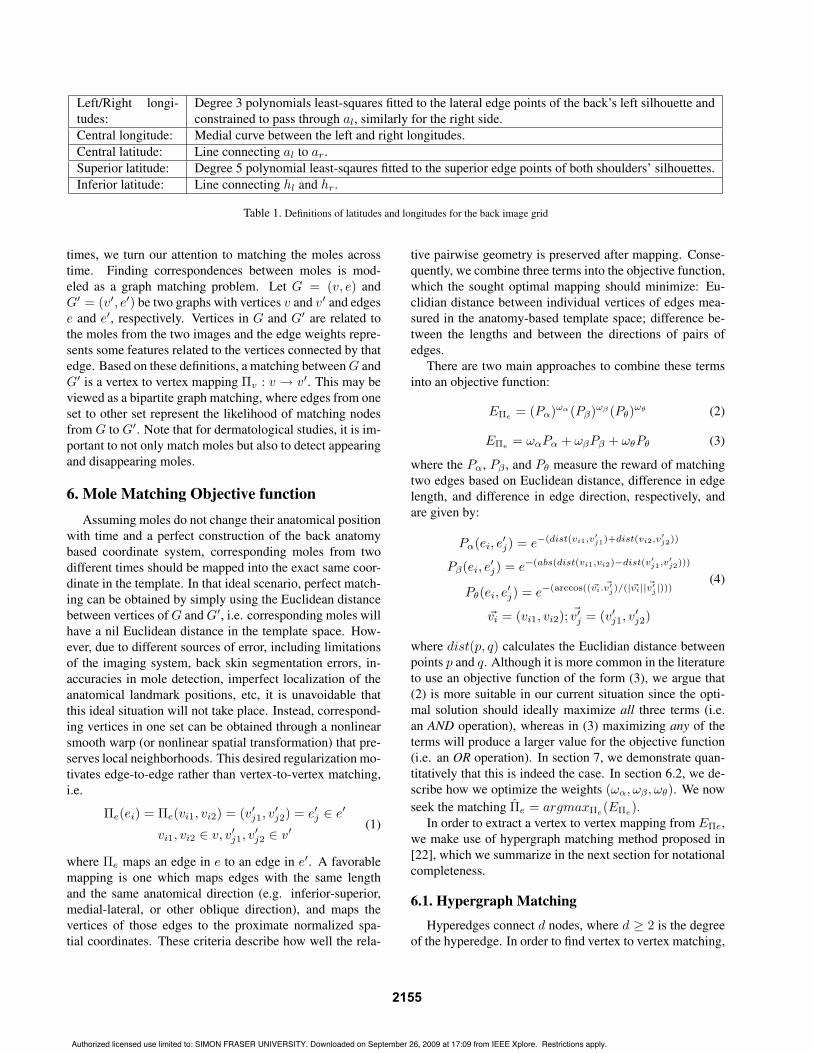
marks in physical coordinates. Consequently, the grid inthe image space is no longer rectilinear but rather curved.Equal arc length sampling is used to correspond the gridlines in the image space with those in the template. Ta-ble 1 contains the the details of how the latitudes and lon-gitudes are defined in the image domain. Finally, with thelatitudes and longitudes defined in both the image and thetemplate domain, the intersection points of the latitudesand longitudes now correspond across both domains. Inorder to establish correspondence between any point (notonly latitude and longitude intersections points) in the twocontinuous domains, we evaluated two interpolation meth-ods: Barycentric coordinates (BC) and Thin plate splines(TPS). TPS is more accurate than BC but it is more compu-tationally expensive. The result is a function f : ! ! !that establishes a bijective mapping between points in anylocation within the two continuous domains: the imagespace ! " [0, xmax] # [0, ymax] and the template space! " [$0.7, 0.3] # [$0.5, 0.5], where xmax # ymax is thesize of the image and the limits of ! cover a unit-squarepatch. Given this mapping f , any coordinate in the image,mainly mole locations, are mapped to spatially-normalizedcoordinates in the template. In Figure 3, some examples ofa grid overlaid on the back images are shown.
5. Graph RepresentationAfter calculating the normalized coordinates of two sets
of moles from two different images captured at different
2154
Authorized licensed use limited to: SIMON FRASER UNIVERSITY. Downloaded on September 26, 2009 at 17:09 from IEEE Xplore. Restrictions apply.
Left/Right longi-tudes:
Degree 3 polynomials least-squares fitted to the lateral edge points of the back’s left silhouette andconstrained to pass through al, similarly for the right side.
Central longitude: Medial curve between the left and right longitudes.Central latitude: Line connecting al to ar.Superior latitude: Degree 5 polynomial least-sqaures fitted to the superior edge points of both shoulders’ silhouettes.Inferior latitude: Line connecting hl and hr.
Table 1. Definitions of latitudes and longitudes for the back image grid
times, we turn our attention to matching the moles acrosstime. Finding correspondences between moles is mod-eled as a graph matching problem. Let G = (v, e) andG! = (v!, e!) be two graphs with vertices v and v! and edgese and e!, respectively. Vertices in G and G! are related tothe moles from the two images and the edge weights repre-sents some features related to the vertices connected by thatedge. Based on these definitions, a matching between G andG! is a vertex to vertex mapping "v : v ! v!. This may beviewed as a bipartite graph matching, where edges from oneset to other set represent the likelihood of matching nodesfrom G to G!. Note that for dermatological studies, it is im-portant to not only match moles but also to detect appearingand disappearing moles.
6. Mole Matching Objective functionAssuming moles do not change their anatomical position
with time and a perfect construction of the back anatomybased coordinate system, corresponding moles from twodifferent times should be mapped into the exact same coor-dinate in the template. In that ideal scenario, perfect match-ing can be obtained by simply using the Euclidean distancebetween vertices of G and G!, i.e. corresponding moles willhave a nil Euclidean distance in the template space. How-ever, due to different sources of error, including limitationsof the imaging system, back skin segmentation errors, in-accuracies in mole detection, imperfect localization of theanatomical landmark positions, etc, it is unavoidable thatthis ideal situation will not take place. Instead, correspond-ing vertices in one set can be obtained through a nonlinearsmooth warp (or nonlinear spatial transformation) that pre-serves local neighborhoods. This desired regularization mo-tivates edge-to-edge rather than vertex-to-vertex matching,i.e.
"e(ei) = "e(vi1, vi2) = (v!j1, v!j2) = e!j % e!
vi1, vi2 % v, v!j1, v!j2 % v!
(1)
where "e maps an edge in e to an edge in e!. A favorablemapping is one which maps edges with the same lengthand the same anatomical direction (e.g. inferior-superior,medial-lateral, or other oblique direction), and maps thevertices of those edges to the proximate normalized spa-tial coordinates. These criteria describe how well the rela-
tive pairwise geometry is preserved after mapping. Conse-quently, we combine three terms into the objective function,which the sought optimal mapping should minimize: Eu-clidian distance between individual vertices of edges mea-sured in the anatomy-based template space; difference be-tween the lengths and between the directions of pairs ofedges.
There are two main approaches to combine these termsinto an objective function:
E!e = (P!)"!(P#)"" (P$)"# (2)
E!e = !!P! + !#P# + !$P$ (3)
where the P!, P# , and P$ measure the reward of matchingtwo edges based on Euclidean distance, difference in edgelength, and difference in edge direction, respectively, andare given by:
P!(ei, e!j) = e"(dist(vi1,v!
j1)+dist(vi2,v!j2))
P#(ei, e!j) = e"(abs(dist(vi1,vi2)"dist(v!
j1,v!j2)))
P$(ei, e!j) = e"(arccos((%vi. %v!
j)/(|%vi|| %v!j |)))
"vi = (vi1, vi2); "v!j = (v!j1, v!j2)
(4)
where dist(p, q) calculates the Euclidian distance betweenpoints p and q. Although it is more common in the literatureto use an objective function of the form (3), we argue that(2) is more suitable in our current situation since the opti-mal solution should ideally maximize all three terms (i.e.an AND operation), whereas in (3) maximizing any of theterms will produce a larger value for the objective function(i.e. an OR operation). In section 7, we demonstrate quan-titatively that this is indeed the case. In section 6.2, we de-scribe how we optimize the weights (!!, !# , !$). We nowseek the matching "e = argmax!e(E!e).
In order to extract a vertex to vertex mapping from E!e,we make use of hypergraph matching method proposed in[22], which we summarize in the next section for notationalcompleteness.
6.1. Hypergraph MatchingHyperedges connect d nodes, where d & 2 is the degree
of the hyperedge. In order to find vertex to vertex matching,
2155
Authorized licensed use limited to: SIMON FRASER UNIVERSITY. Downloaded on September 26, 2009 at 17:09 from IEEE Xplore. Restrictions apply.

matching hyperedges is considered in [22]. For instance, ford = 4, the ratio between the area of the triangles describedby v1, v2, v3 and v2, v3, v4 (vi is a vertex of G) is used as asimilarity measure for matching hyperedges. A probabilitymatrix reflecting the likelihood of an edge-to-edge match-ing is constructed as E!e = E(e, e!) = P ("e(e) = e! |G, G!).
According to [22], under the assumption of "v(vi) '"v(vj), E!e is written as d times Kronecker product ofX(v, v!), i.e. E!e = (dX , where X is a doubly semi-stochastic (X & 0, X1 ) 1, XT 1 ) 1) whose entries storethe probability of matching vi and v!j . Therefore, we needto find X = argminXdist(E!e ,(dX).
This function can be reduced to a simpler formby defining a marginalization matrix Y : Yv,v! =!d
i=1
!e|vi=v,e!|v!
i=v! E(e, e!) where e = (v1, v2, ..., vd)and e! = (v!1, v!2, ..., v!d). Therefore, the minimization canbe rewritten as X = argminXd(Y,X). A successive pro-jections algorithm is used to find the globally optimal so-lution of the matching probability matrix X and a linearassignment problem is solved to obtain a hard matching,if desired. For d = 2, the matching cost function in [22]simplifies to the difference between the lengths of edges.However, in the presence of noise, relying on edge-lengthsis not sufficient to find correct corresponding points and,according to [22], hyperedge matching is recommended.In this case, the time complexity of the algorithm wouldbe: O(|v|d.|v!|d), which is impractical when the numberof nodes is high. Zass and Shashua reduced the algorithmcomplexity to O(|v|.|v!|.z2(d"1)) by sampling the z clos-est hyperedges per vertex and used only the correlation be-tween the sampled Hyperedges.
However, in our mole-matching problem, with the pres-ence of appearing and disappearing moles, z could not befar from min(|v|, |v!|), which means that high running timeproblem still exists. In this work, we use d = 2 and adoptZass and Shashuas approach to solve for X from E!e .
6.2. Learning the optimal weights
Given a specific choice of weights of !!, !# , !$, theobjective function E!e is evaluated according to (2) or (3)and the matching probabilities X are computed as in [22].Clearly, different choices for the weights will result in adifferent objective function and, hence, a different opti-mal solution. It is, therefore, imperative to use appropriateweights.
In order to find the best choice of weights, we rely ongenerating comprehensive training data with ground truthcorrespondence and evaluating the matching performancegiven different choices of weights. In particular, we gener-ate multiple reference training data sets, where each trainingset consists of two groups of points: a reference set V and
a target set V !, mimicking the moles to be matched acrosstwo images. The total number of points in V and V ! arenV = ni
V +noV and nV ! = ni
V ! +noV ! , where the ni
V pointsin V correspond to the ni
V ! points in V ! (i.e. niV = ni
V !)and the positions of the latter set of points are generatedby displacing the former by random distances drawn fromuniform distributions with different support intervals #n.These perturbations in positions mimic the aforementionederrors (e.g. mole detection, anatomical landmark localiza-tion, etc.). no
V is the number of moles that exist only in Vbut not in V !, i.e. mimicking disappearing moles, whereasno
V ! exist in V ! but not in V , i.e. new appearing moles.As we control the generation of the two sets of points,
the ground truth matrix of matching between points, XReal,is known. Next, the dissimilarity between X , resulting fromthe matching algorithm, and XReal is calculated for differ-ent weights. Then, the best weights are chosen as the setgiving the minimum dissimialrity between X and XReal.
(!!, !# , !$) = argmin("!,"" ,"#)d(X, XReal) (5)
There are different ways to measure the dissimilarity be-tween X and XReal. We evaluate the following measuresfor the goodness of matching: Hamming distance error,HDE, between defuzzified (crisp mapping) X and XReal;the number of incorrect matching, NIM; and the spatial Eu-clidian distance, SED, between the mole position mapped toby X and by XReal. The distance between X and XReal,d(X, XReal) for each of these measurements is given by:
dHDE :"
i,j
X(i, j)*XReal(i, j)
dNIM :"
i,j
XReal(i, j)$X(i, j) +XReal(i, j)
dSED :"
{(i,j)|X(i,j)"X(i,j)#XReal(i,j)=1}
SED(i, j)
(6)
Figure 4 visualizes SED(i,j) for different cases. Note thatHDE and NIM are only defined for hard (crisp) matchingwhereas SED is defined for both hard and soft matchings.As it can be seen in Figure 5, there is a high correlationbetween NIM and HDE, but they are not perfectly corre-lated, $NIM,HDE = 0.89, whereas $SED,NIM = 0.46 and$SED,HDE = 0.61.
7. ResultsThe real data used in this study were obtained from color
slides taken from an epidemiologic study concerning theuse of broad-spectrum sunscreen and mole development.The images were digitized with 24-bit color at 2000 dpi,with a final resolution of about 0.25 mm/pixel. A set of 56pairs of digitized images containing moles was chosen to
2156
Authorized licensed use limited to: SIMON FRASER UNIVERSITY. Downloaded on September 26, 2009 at 17:09 from IEEE Xplore. Restrictions apply.
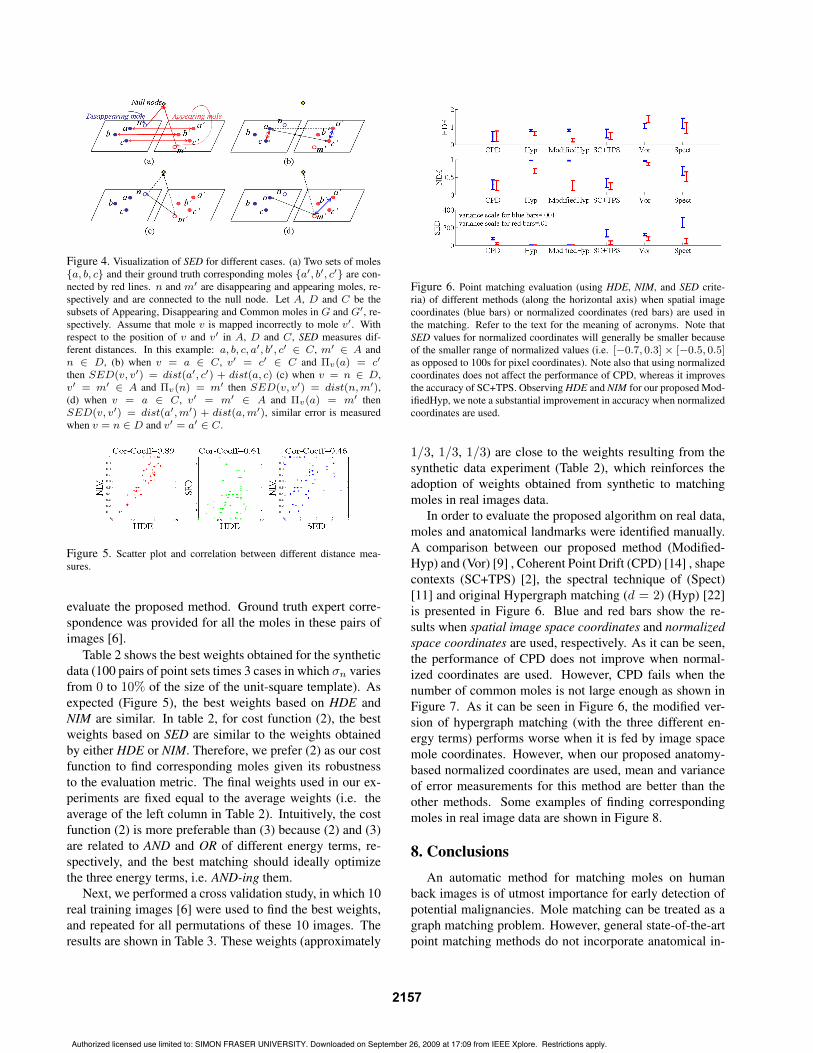
Figure 4. Visualization of SED for different cases. (a) Two sets of moles{a, b, c} and their ground truth corresponding moles {a!, b!, c!} are con-nected by red lines. n and m! are disappearing and appearing moles, re-spectively and are connected to the null node. Let A, D and C be thesubsets of Appearing, Disappearing and Common moles in G and G!, re-spectively. Assume that mole v is mapped incorrectly to mole v!. Withrespect to the position of v and v! in A, D and C, SED measures dif-ferent distances. In this example: a, b, c, a!, b!, c! ! C, m! ! A andn ! D, (b) when v = a ! C, v! = c! ! C and !v(a) = c!
then SED(v, v!) = dist(a!, c!) + dist(a, c) (c) when v = n ! D,v! = m! ! A and !v(n) = m! then SED(v, v!) = dist(n, m!),(d) when v = a ! C, v! = m! ! A and !v(a) = m! thenSED(v, v!) = dist(a!, m!) + dist(a, m!), similar error is measuredwhen v = n ! D and v! = a! ! C.
Figure 5. Scatter plot and correlation between different distance mea-sures.
evaluate the proposed method. Ground truth expert corre-spondence was provided for all the moles in these pairs ofimages [6].
Table 2 shows the best weights obtained for the syntheticdata (100 pairs of point sets times 3 cases in which #n variesfrom 0 to 10% of the size of the unit-square template). Asexpected (Figure 5), the best weights based on HDE andNIM are similar. In table 2, for cost function (2), the bestweights based on SED are similar to the weights obtainedby either HDE or NIM. Therefore, we prefer (2) as our costfunction to find corresponding moles given its robustnessto the evaluation metric. The final weights used in our ex-periments are fixed equal to the average weights (i.e. theaverage of the left column in Table 2). Intuitively, the costfunction (2) is more preferable than (3) because (2) and (3)are related to AND and OR of different energy terms, re-spectively, and the best matching should ideally optimizethe three energy terms, i.e. AND-ing them.
Next, we performed a cross validation study, in which 10real training images [6] were used to find the best weights,and repeated for all permutations of these 10 images. Theresults are shown in Table 3. These weights (approximately
Figure 6. Point matching evaluation (using HDE, NIM, and SED crite-ria) of different methods (along the horizontal axis) when spatial imagecoordinates (blue bars) or normalized coordinates (red bars) are used inthe matching. Refer to the text for the meaning of acronyms. Note thatSED values for normalized coordinates will generally be smaller becauseof the smaller range of normalized values (i.e. ["0.7, 0.3] # ["0.5, 0.5]as opposed to 100s for pixel coordinates). Note also that using normalizedcoordinates does not affect the performance of CPD, whereas it improvesthe accuracy of SC+TPS. Observing HDE and NIM for our proposed Mod-ifiedHyp, we note a substantial improvement in accuracy when normalizedcoordinates are used.
1/3, 1/3, 1/3) are close to the weights resulting from thesynthetic data experiment (Table 2), which reinforces theadoption of weights obtained from synthetic to matchingmoles in real images data.
In order to evaluate the proposed algorithm on real data,moles and anatomical landmarks were identified manually.A comparison between our proposed method (Modified-Hyp) and (Vor) [9] , Coherent Point Drift (CPD) [14] , shapecontexts (SC+TPS) [2], the spectral technique of (Spect)[11] and original Hypergraph matching (d = 2) (Hyp) [22]is presented in Figure 6. Blue and red bars show the re-sults when spatial image space coordinates and normalizedspace coordinates are used, respectively. As it can be seen,the performance of CPD does not improve when normal-ized coordinates are used. However, CPD fails when thenumber of common moles is not large enough as shown inFigure 7. As it can be seen in Figure 6, the modified ver-sion of hypergraph matching (with the three different en-ergy terms) performs worse when it is fed by image spacemole coordinates. However, when our proposed anatomy-based normalized coordinates are used, mean and varianceof error measurements for this method are better than theother methods. Some examples of finding correspondingmoles in real image data are shown in Figure 8.
8. ConclusionsAn automatic method for matching moles on human
back images is of utmost importance for early detection ofpotential malignancies. Mole matching can be treated as agraph matching problem. However, general state-of-the-artpoint matching methods do not incorporate anatomical in-
2157
Authorized licensed use limited to: SIMON FRASER UNIVERSITY. Downloaded on September 26, 2009 at 17:09 from IEEE Xplore. Restrictions apply.

Figure 7. Synthetic experiment with known ground truth. num and DisApp denote size of niV = ni
V ! and noV respectively. (left) errors for fixed value
of niV , no
V and noise for increasing values of noV ! . (middle) errors for fixed value of ni
V and noise for increasing values for noV = no
V ! . (right) errors forfixed value of ni
V and noV = no
V ! for increasing values for noise. As it can be seen, Modified Hypergraph matching gives better results.
Equation (2) Equation (3)Case Error (!!, !# , !$) e #2(e) Case Error (!!, !# , !$) e #2(e)
HDE (.30, .39, .30) 0.47 0.02 HDE (.10, .48, .40) 0.44 0.02case1 NIM (.32, .37, .30) 0.52 0.04 case1 NIM (.07, .50, .42) 0.43 0.04
SED (.34, .28, .36) 31.9 282.6 SED (.32, .28, .39) 36.51 566.16HDE (.31, .38, .29) 0.38 0.03 HDE (.08, .49, .41) 0.38 0.034
case2 NIM (.31, .38, .29) 0.61 0.03 case2 NIM (.08, .49, .42) 0.60 0.03SED (.34, .30, .35) 12.23 72.37 SED (.31, .32, .35) 16.01 166.77HDE (.35, .32, .32) 0.36 0.03 HDE (.09, .49, .40) 0.30 0.04
case3 NIM (.35, .32, .32) 0.64 0.03 case3 NIM (.10, .49, .40) 0.62 0.07SED (.34, .31, .33) 16.72 157.47 SED (.32, .32, .34) 12.64 207.66
Table 2. The best weights resulted from training on synthetic data for the two cost functions (in (2) and (3)). Synthetic data are generated under differentcases (case1-3) and each case is related to different values of the variables: case1 = {!n ! [0, .1], no
V ! [0, 7], noV ! ! [0, 7], ni
V = 10}, case2 =
{!n ! [0, .1], noV ! [0, 7], no
V ! = 0, niV = 10}, case3 = {!n ! [0, .1], no
V = noV ! = 0, ni
V = 10}. (100 random generations for each case). e and!2(e) represent mean and variance of the error.
Equation (2) Equation (3)Error (!!, !# , !$) Error (!!, !# , !$)HDE (.29, .40, .29) HDE (.01, .55, .42)NIM (.30, .40, .29) NIM (.01, .55, .42)SED (.32, .36, .31) SED (.23, .35, .41)
Table 3. The best weights resulting from the cross validation experimentwith 10 training images [6].
formation. We proposed the first human back template anddemonstrated, on large sets of both real and synthetic data,that the use of template-normalized spatial coordinates andadditional matching cost terms outperform several state-of-the-art matching algorithms. Further, we provided an exten-sive study on choosing the form of the objective function,learning its optimal weights, and evaluating the resultingmatching; issues often marginally addressed in the litera-ture. Our human back atlas is the first in the field and we are
already reaping the benefits of it by substantially improv-ing the mole matching. Nevertheless, we plan on exploringother template alternatives and anticipate other groups willdo too. One of the challenges, as observed in this study,will be to develop a robust definition of the hip anatomi-cal landmark, which we plan to address through discussionsand consultations with dermatologists. The mole matchingresults we obtained are very encouraging from the compu-tational and clinical perspectives. This encouraged us topursue a fully-automated back skin segmentation and moledetection algorithms to provide an end-to-end system ap-plied in clinical practice.
References[1] Canadian cancer society / national cancer institute of canada:
Canadian cancer statistics 2008. Toronto, Canada, 2008.[2] S. Belongie, J. Malik, and J. Puzicha. Shape matching
and object recognition using shape contexts. IEEE TPAMI,
2158
Authorized licensed use limited to: SIMON FRASER UNIVERSITY. Downloaded on September 26, 2009 at 17:09 from IEEE Xplore. Restrictions apply.

Figure 8. Each row is a different subject. The images in the right col-umn were captured 3 years later than the left column. The resulting molematching indicated by lines.
24(4):509–522, Apr 2002.[3] T. Cootes, C. Taylor, D. Cooper, and J. Graham. Active shape
models: Their training and application. CVIU, 61(1):38–59,Jan 1995.
[4] F. Ercal, M. Moganti, W. Stoecker, and R. Moss. Detec-tion of skin tumor boundaries in color images. IEEE TMI,12(3):624–626, Sep 1993.
[5] A. Evans, M. Kamber, D. Collins, and D. MacDonald. Anmri-based probabilistic atlas of neuroanatomy. MagneticResonance Scanning and Epilepsy, Plenum Press, pages263–274, 1994.
[6] R. P. Gallagher, J. K. Rivers, T. K. Lee, C. D. Bajdik, D. I.McLean, and A. J. Coldman. Broad-Spectrum SunscreenUse and the Development of New Nevi in White Children: ARandomized Controlled Trial. Journal of American MedicalAssociation, 283(22):2955–2960, 2000.
[7] S. Gold, A. Rangarajan, C. ping Lu, and E. Mjolsness.New algorithms for 2d and 3d point matching: Pose estima-
tion and correspondence. Pattern Recognition, 31:957–964,1998.
[8] E. A. Holly, J. W. Kelly, S. N. Shpall, and S. H. Chiu. Num-ber of melanocytic nevi as a major risk factor for malignantmelanoma. J. Am. Acad. Dermatol, 17:459–468, 1987.
[9] H. Huang and P. Bergstresser. A new hybrid technique fordermatological image registration. IEEE BIBE, pages 1163–1167, Oct 2007.
[10] T. Lee, M. Atkins, M. King, S. Lau, and D. McLean. Count-ing moles automatically from back images. IEEE TBE,52(11):1966–1969, Nov 2005.
[11] M. Leordeanu and M. Hebert. A spectral technique for cor-respondence problems using pairwise constraints. ICCV,2:1482–1489, Oct 2005.
[12] J. Maciel and J. Costeira. A global solution to sparse cor-respondence problems. IEEE TPAMI, 25(2):187–199, Feb2003.
[13] J. C. Mazziotta, A. W. Toga, A. Evans, P. Fox, and J. Lan-caster. A probabilistic atlas of the human brain: Theory andrationale for its development : The international consortiumfor brain mapping (icbm). NeuroImage, 2(2, Part 1):89–101,Jun 1995.
[14] A. Myronenko, X. Song, and M. Carreira-Perpinan. Non-rigid point set registration: Coherent point drift. InB. Scholkopf, J. Platt, and T. Hoffman, editors, Advancesin Neural Information Processing Systems. MIT Press, 2007.
[15] D. Perednia and R. White. Automatic registration of multipleskin lesions by use of point pattern matching. ComputerizedMedical Imaging and Graphics, 16:205–216, May 1992.
[16] J.-S. Pierrard and T. Vetter. Skin detail analysis for facerecognition. CVPR, pages 1–8, Jun 2007.
[17] L. Ries, D. Melbert, M. Krapcho, D. Stinchcomb,N. Howlader, M. Horner, A. Mariotto, B. Miller, E. Feuer,S. Altekruse, D. Lewis, L. Clegg, M. Eisner, M. Reich-man, B. Edwards, and M. Bethesda. Cancer statistics review,1975-2005. National Cancer Institute, 2008.
[18] J. Roning and M. Riech. Registration of nevi in successiveskin images for early detection of melanoma. ICPR, 1:352–357, Aug 1998.
[19] J. Talairach and P. Tournoux. Co-Planar Stereotaxic Atlas ofthe Human Brain: 3-Dimensional Proportional System : AnApproach to Cerebral Imaging. Thieme Medical Publishers,Jan 1988.
[20] L. Thurfjell, C. Bohm, and E. Bengtsson. Cba–an atlas-based software tool used to facilitate the interpretation ofneuroimaging data. Computer Methods and Programs inBiomedicine, 47(1):51 – 71, 1995.
[21] V. Vezhnevets, V. Sazonov, and A. Andreeva. A surveyon pixel-based skin color detection techniques. In Proc.Graphicon-2003, pages 85–92, 2003.
[22] R. Zass and A. Shashua. Probabilistic graph and hypergraphmatching. CVPR, Jun 2008.
[23] Y. Zheng and M. Doermann. Robust point matching fornonrigid shapes by preserving local neighborhood structures.IEEE TPAMI, 28(4):643, Apr 2006.
2159
Authorized licensed use limited to: SIMON FRASER UNIVERSITY. Downloaded on September 26, 2009 at 17:09 from IEEE Xplore. Restrictions apply.