a green fluorescent protein screen for identification of
TRANSCRIPT

A green fluorescent protein screen foridentification of well-expressedmembrane proteins from a cohort ofextremophilic organisms
Justus Hammon,† Dinesh V. Palanivelu,† Joy Chen, Chintan Patel,and Daniel L. Minor Jr.*
Cardiovascular Research Institute, Department of Biochemistry and Biophysics, Department of Cellular and Molecular
Pharmacology, California Institute for Quantitative Biosciences, University of California, San Francisco, California 94158-2330
Received 3 September 2008; Revised 10 October 2008; Accepted 15 October 2008DOI: 10.1002/pro.18
Published online 2 December 2008 proteinscience.org
Abstract: Green fluorescent protein (GFP) fusion proteins provide a potentially facile tool foridentification of well expressed, properly behaved membrane proteins for biochemical and
structural study. Here, we present a GFP-expression survey of >300 membrane proteins from 18
bacterial and archaeal extremophiles, organisms expected to be rich sources of membraneproteins having robust biophysical properties. We find that GFP-fusion fluorescence intensity is an
excellent indicator of over-expression potential. By employing a follow-up optimization protocol
using a suite of non-GFP constructs and different expression temperatures, we obtain 0.5–15mgL21 expression levels for 90% of the tested candidate proteins that pass the GFP screen.
Evaluation of the results suggests that certain organisms may serve as better sources of well-
expressed membrane proteins than others, that the degree to which codon usage matches theexpression host is uncorrelated with success rate, and that the combination of GFP screening and
expression optimization is essential for producing biochemically tractable quantities of material.
Keywords: membrane protein expression; GFP-screen; extremophile
Introduction
Membrane proteins are the gateways for signals that
pass between a cell and its surroundings and are cen-
tral to ionic signaling mechanisms and the material
transport required for nutrient uptake and toxin dis-
posal. Understanding membrane protein molecular
architecture remains one of the major challenges of
modern structural biology efforts. One of the main
obstacles is the difficulty associated with obtaining suf-
ficient quantities of pure material for biochemical and
structural analysis.1,2 Because most membrane pro-
teins are not found in readily accessible over-enriched
native sources, it is necessary to develop ways to
overproduce membrane protein constructs at will.
The ability to overproduce proteins in heterologous
systems has revolutionized structural biology studies
of soluble proteins but similar scale successes have
not yet been had for membrane proteins. Thus, pur-
suit of robust methods to express and characterize
membrane proteins remains an area of vigorous
research efforts.
The most rigorous test of whether a protein can
be crystallized is to overexpress, purify, and place the
Additional Supporting Information may be found in the onlineversion of this article.
yJustus Hammon and Dinesh V. Palanivelu contributed equallyto this work.
Grant sponsors: NIH-NIGMS (Membrane Protein ExpressionCenter and Center for the Structures of Membrane Proteins);American Heart Association.
*Correspondence to: Daniel L. Minor, Jr., CardiovascularResearch Institute, Department of Biochemistry and Biophysics,Department of Cellular and Molecular Pharmacology, CaliforniaInstitute for Quantitative Biosciences, University of California,San Francisco, California 94158-2330.E-mail: [email protected]
121 PROTEIN SCIENCE 2009 VOL 18:121—133 Published by Wiley-Blackwell. VC 2008 The Protein Society
protein of interest in crystallization trials. However,
taking any given protein through this procedure
requires a large investment of time and resources and
has a high probability of a negative outcome for any
given candidate. There have been ongoing efforts to
develop methods that serve as readily accessible prox-
ies to identify well-expressed, well-behaved protein
samples that should have a higher probability of lead-
ing to crystallizable material without the need for an
initial complete characterization of each candidate.
Such approaches attempt to leverage the power of
molecular biology to provide a rapid way to screen
large numbers of constructs in parallel and identify
the most promising for further, more intensive char-
acterization. A leading tactic in this regard has been
the use of fusion proteins bearing Green Fluorescent
Protein (GFP).3–9 Because of its spectral characteris-
tics, GFP fluorescence provides a unique and sensi-
tive means for detecting tagged proteins within a
cellular environment. Maturation of the GFP chromo-
phore and development of the unique GFP spectral
signal are directly coupled to proper GFP folding.10,11
Because of this property, there should be a correla-
tion between the fate of the target protein and the
fate of the GFP chromophore.3 Thus, the level of fluo-
rescence signal from a fused GFP molecule is
expected to provide a reasonable measure of the abil-
ity of the candidate protein to be expressed at high
levels in a properly folded form.
Here, we report the implementation of a E. coli-
based whole cell, GFP fluorescence assay to survey the
expression properties of a large cohort of membrane
proteins (314 candidates) from extremophilic organ-
isms. We show that measurement of the fluorescence
produced by a C-terminal GFP fusion of the candidate
protein relative to a set of benchmark GFP-fusion pro-
teins provides a reliable way to identify membrane
proteins that can be expressed in the 0.5–15 mgL�1
range in the membrane fraction following expression
optimization. The production of such quantities facili-
tates further characterization by detergent extraction
screens and size exclusion chromatography. Impor-
tantly, our results demonstrate that the use of the
whole-cell fluorescence detection method provides a
rapid way to assess the overexpression potential of
many membrane protein with a limited investment of
labor. This stands in sharp contrast to traditional,
labor-intensive methods for expression screening using
SDS-PAGE and Western blot. Analysis of candidate
protein expression behavior with respect to protein
properties suggests that although there appear to be
no particular limits on protein size or number of
transmembrane segments, proteins in the 20–50 kDa
range and having <7 transmembrane segments have a
higher success rate. Interestingly, we find no correla-
tion between expression level and the degree to which
the codon usage of the target gene matches the expres-
sion host.
Results
Fluorescence-based screening foridentifying membrane proteins having
overexpression potential
Following previous reports using GFP as a reporter for
membrane protein expression,4,7–9,12 we established an
E. coli GFP-based expression system (Supporting Fig.
1) to evaluate the expression potential of a large cohort
of membrane proteins from organisms found in
extreme and unusual environments. To allow rapid
clone generation, we constructed a ligase independent
cloning vector13 to facilitate direct cloning of PCR
products of the gene of interest (Supporting Fig. 1).
Target protein fusions contained a C-terminal tag that
bore in sequence, a Tobacco Etch Virus (TEV) protease
site,14 eGFP,15 and an octahistidine (His8) tag [Fig.
1(a)]. On the basis of previous studies,4,7–9,12 we
anticipated that there was likely to be a correlation
between proper folding and membrane insertion of the
target protein and GFP fluorescence. One limit to this
assay is that the C-terminal GFP moiety will only
mature if the C-terminus of the target protein is intra-
cellular.7 As a consequence, any well-expressed mem-
brane proteins having a topology that places the C-ter-
minus extracellularly will be missed. An estimated
70% of integral membrane proteins have their C-ter-
minus in the cytoplasm.16 Given the expected high
proportion of candidates with cytosolic C-termini, and
the possibility that a single error in transmembrane
protein prediction would eliminate potential candi-
dates by inadvertently switching the predicted topol-
ogy, we did not use topology prediction algorithms to
prescreen candidates.
We chose candidate membrane proteins from
organisms that live in extreme pH, high salt, the pres-
ence of high concentrations of heavy metals, high tem-
peratures, or some combination of these extremes,
based on the rationale that proteins found in such
organisms, and in particular those in the membrane,
which should have direct contact with the harsh envi-
ronment, are likely to be very stable and robust sub-
jects for biochemical and crystallographic studies.17
The criteria for selection of candidate organisms were
that in addition to living in an unusual environment
the selected organisms had to have a completely
sequenced genome and have genomic DNA that could
be obtained from the ATCC collection to be used as
template for PCR.
Membrane proteins were selected for the expres-
sion survey using a combination of annotation
searches for ion channel, transporter, exchanger, anti-
porter, carrier, and major facilitator superfamily mem-
bers, and by searching the genome of each candidate
organism with a generic transmembrane helix profile.
From an initial list of �400 selected candidates, we
succeeded in making 314 GFP fusion constructs and
tested their expression levels by measuring in cell GFP
GFP Screen of Extremophile Membrane Proteins PROTEINSCIENCE.ORG 122

Figure 1. GFP-based integral membrane protein expression screen. (a) Fluorescence measurements of 314 GFP fusions
assayed in E. coli. Dashed line indicates the cutoff threshold level based on the values obtained three benchmark proteins,
KvAP, AQPz, and YhjX. Inset shows schematic of GFP constructs. (b) SDS-PAGE analysis of the C41 E. coli membrane
fractions from several extremophile membrane protein candidates following expression optimization analyzed by
coomassie-blue staining (left) and anti-polyhistidine tag western blot (right). Lanes are: M, Marker; 1, Af27 (22 kDa); 2, Rm29
(30 kDa); 3, Rm8 (30 kDa); 4, Ph11 (29 kDa); 5, Sp2 (49 kDa); 6, Rm4 (25 kDa). (c) Tables showing the numbers of proteins
having optimal expression as H3C, CH, and HM3C affinity tagged constructs and showing the numbers of proteins having the
optimal expression at different expression temperatures. (d) Percentage of optimized candidates with expression >0.5 mgL�1
of culture, grouped according to their fluorescence values from the GFP screen. (e) Comparison of GFP fluorescence versus
final amount of protein following optimization. Expression levels were determined by following single-step metal affinity
purification in FC-12 and measurement of the amount of protein purified by absorbance (circles) or by comparison with a
protein standard by western blot (triangles).

fluorescence following induction and expression at
25�C (Supporting Table I).
Comparison of expression using a simple fluores-
cence assay that measured the GFP fluorescence signal
from a standardized density of cells of the 314 GFP
fusions yielded a wide distribution of fluorescence val-
ues, 20,000–180,000 F.A.U. (Fluorescence Arbitrary
Units) [Fig. 1(a), Supporting Table I]. Uninduced cells
grown to similar density yielded a background value of
�20,000 F.A.U. To set a criterion for the level of
expression that would indicate the most promising
candidates, we examined the performance of three
benchmark membrane protein-GFP fusions. Two of
the benchmark proteins were chosen because they
have had X-ray crystallographic structures determined
from E. coli expressed material, AQPz18,19 and
KvAP.20,21 The third benchmark protein, YhjX, was
the best expressed membrane protein in a GFP-based
expression survey of E coli membrane proteins.6 Our
rationale was that expression of any test protein-GFP
fusion at levels equivalent to or better than these
benchmarks should indicate the production of accepta-
ble levels of properly folded material for further char-
acterization. On the basis of the benchmark protein-
GFP fusion values, AQPz (73,000 F.A.U.), KvAP
(118,000 F.A.U.), and YhjX (97,000 F.A.U.), we
defined a positive threshold of 60,000 F.A.U. This
value was chosen to allow a generous lower bound for
candidates that should be as good or better than the
benchmark proteins. Sixty-four of the screened candi-
dates (20%) yielded fluorescence values at or above
the threshold (60,000 A.U.). Interestingly, we
obtained vast differences in success among the extrem-
ophilic organisms (Table I). C. tepidium, R. metalli-
durans, and S. pomeroyi were good sources of well-
expressed candidates, having success rates as high as
40–50%, whereas O. oeni, S. solfataricus, and T. vol-
canium proved to be very poor sources having very
low success rates, 0–6%. Further analysis revealed
that certain membrane protein classes express better
than others (Table II). For example, candidates from
the mechanosensitive ion channel and from the
Table I. List of Extremophilic Organisms Selected, Number of Candidates Screened, Number Positive,and Hit Rates in Each Organism
Organism EnvironmentCandidatesscreened
>60,000 F.A.U.
# Positive % Positive
Aeropyrum pernix Hydrothermal vent 8 1 13Archaeoglobus fulgidus Hydrothermal vent, oil deposits, hot springs 21 7 33Bacillus halodurans pH >9.5, high salt, Dead Sea 5 1 20Chlorobium tepidium New Zealand hot spring 6 3 50Deinococcus radiodurans Radiation resistant 14 3 21Desulfovibrio vulgaris Tolerates heavy metals 24 3 13Geobacter sulfurreducens Hydrocarbon contaminated soils,
tolerates heavy metals13 2 15
Oenococcus oeni Low pH, high alcohol 17 1 6Pyrococcus furiosus Geothermal marine sediments 6 1 17Pyrococcus horikoshii Hydrothermal vent 21 3 14Ralstonia metallidurans Heavy metal containing industrial wastes 25 11 44Shewanella oneidensis Heavy metal reducer 26 8 31Silicibacter pomeroyi Sea water, sulfur reducer 12 6 50Sulfolobus solfataricus Volcanic hot springs 19 0 0Streptococcus thermophilus Yoghurt, cheese, low pH 30 7 23Thermotoga maritima Geothermal marine sediments 20 3 15Thermus thermophilus Yellowstone hot spring 18 3 17Thermoplasma volcanium Hot springs, low pH 29 1 3Total 314 64 20
Table II. Expression Success Analyzed by Family
Membrane protein class Candidates tested % of total candidates >60,000 F.A.U.% of candidates>60,000 F.A.U.
Antiporter 25 8.0 3 12.0Exchanger 12 3.8 2 16.6Ion channel 24 7.6 6 25.0MATE transporter 6 1.9 2 33.3MotA proton channel 7 2.2 5 71.4Mechanosensitive ion channel 28 8.9 15 53.5Transporter 177 56.4 27 15.2Other 35 11.1 4 11.4Total 314 64 20.3
Analysis of success rate by membrane protein class.
GFP Screen of Extremophile Membrane Proteins PROTEINSCIENCE.ORG 124
flagellar motor MotA proton channel families had high
success rates (53.5% and 71.4%, respectively), whereas
candidates from the antiporter, exchanger, and trans-
porter families were less likely to express well (12.0%,
16.6%, and 15.2%, respectively). The origins of the dif-
ferences are unclear but may relate to a combination
of protein molecular weight, total number of trans-
membrane segments, toxic consequences of protein
activity from the overexpressed protein, and the poten-
tial requirement for auxiliary subunits that were not
included in the expression study.
Overexpression optimization without GFP
Initial attempts at direct purification of a number of
GFP constructs having high F.A.U. scores (Af11, Bh8,
Ct6, and Dr35) proved problematic and did not
directly yield sufficient quantities of purified material
for further characterization. In consideration of the
possibility that the GFP itself was proving a burden to
production of the candidate protein, we cloned 52 can-
didates from three different pools; 32 high-expressing
proteins (>60,000 F.A.U.), 12 medium to low express-
ing proteins (60,000–20,000 F.A.U.), and 8 low
expressing proteins (<20,000 F.A.U.) into three affin-
ity tag formats for protein expression optimization
experiments. These 156 constructs were subjected to
overexpression optimization trials in which each con-
struct was grown as a small scale culture (7 mL) and
tested for expression at three different induction tem-
peratures (18�C, 25�C, and 37�C). Expression levels for
each sample were assayed evaluating SDS-PAGE by
coomassie blue staining and western blot using an
anti-polyhistidine antibody.
The optimization experiments with non-GFP con-
structs caused clear improvements compared to the
temperature-optimized GFP fusion construct of the
same target (Supporting Fig. 2). Figure 1(b) shows
examples of membrane fractions for six of the candi-
date proteins following expression optimization.
Thirty-two candidates of the 52 showed expression by
both coomassie-staining and Western blot analysis.
Both the affinity tag and expression temperature were
important variables for expression optimization [Fig.
1(c)]. No particular tag predominated as the best
choice. In general, a low induction temperature, 18�C,proved most beneficial. Comparison of the amount of
protein produced under optimized expression condi-
tions by using single step using metal affinity purifica-
tion in Fos-choline-12 (FC-12), which was found as the
most robust detergent for membrane protein extrac-
tion (see below), followed by quantification of the
amount of protein expressed in the membrane fraction
showed clear differences between the ability to convert
proteins from different GFP score categories into
expressed material [Fig. 1(d,e)]. Strikingly, we were
able to produce 90% of the candidates from the high-
expressing category at levels of �0.5 mgL�1 [Fig. 1(d)]
with 50% of these made at �5 mgL�1. The success
rate for producing �0.5 mgL�1 of protein from the
medium to low expressing category was also good,
25%. None of the candidates from the category having
GFP values near the background fluorescence value
gave expression levels >0.5 mgL�1 following optimiza-
tion. Comparison of the amounts of expressed proteins
following optimization with the GFP screen fluores-
cence values shows that the fluorescence value served
as a reliable indicator of candidate proteins that could
be expressed in the membrane fraction at a level that
is useful for further biochemical characterization [Fig.
1(e)]. On the basis of these success rates, we estimate
that 90% of the candidates that passed the GFP screen
could be produced at �0.5 mgL�1 culture if subjected
to optimization experiments. These results highlight
the value of including benchmark standards in execu-
tion of GFP-based protein expression surveys and indi-
cate that a simple GFP screen should be sufficient for
initial identification of proteins with a high-likelihood
of overexpression potential.
Detergent screening by size
exclusion chromatographyDetergents are a necessary component of any mem-
brane protein purification effort and constitute a com-
plex variable that requires extensive investigation.22,23
Detergent choice has significant implications for pro-
tein oligomeric state, stability, homogeneity, and crys-
tallization. Unfortunately, it is impossible to predict
which detergent will be suitable for extraction, purifi-
cation, and crystallization of a given membrane pro-
tein. Having sufficient expressed material for a variety
of candidate proteins from different membrane protein
classes following our expression optimization experi-
ments, we screened candidates for detergent solubili-
zation and size exclusion profile behavior using a
panel of several different detergents. These experi-
ments were aimed at assessing whether the overex-
pressed material could yield protein that would be of
suitable quality for further biophysical characterization
and crystallization trails. We chose 24 well-expressed
membrane proteins and used a panel of six commonly
used detergents decyl-b-D-maltoside (DM), octyl-b-D-glucopyranoside (OG), dodecyl-b-D-maltoside (DDM),
Fos-choline-12 (FC-12), n-dodecyl-N,N-dimethyl-
amine-N-oxide (LDAO), and 3-[(3-cholamidopro-
pyl) dimethylammonio]-2-hydroxy-1-propanesulfonate
(CHAPSO). Following extraction from the membrane
fraction and a single metal affinity purification step, 21
of the 24 candidates gave an included peak in the gel
filtration profiles in at least one detergent (Fig. 2, Ta-
ble III). Ten of the 24 were found to be monodisperse
based on the presence of a single, symmetrical peak
(Fig. 2, Supporting Table II). The presence of a mono-
disperse size exclusion profile has been shown to be a
good indicator of membrane protein samples that are
of suitable quality for further biochemical, biophysical,
and crystallization studies.8,9,24–27 It is difficult to
125 PROTEIN SCIENCE VOL 18:121—133 Hammon et al.
estimate the oligomeric state of a membrane protein
from size exclusion results, particularly as the stand-
ards are soluble, globular proteins, and the exact bio-
logical assembly of the particular proteins we exam-
ined is unknown. Nevertheless, we found that all of
the monodisperse samples ran with apparent molecu-
lar weights that are larger than that expected for
monomers. This property was maintained regardless
of the detergent type in the cases where more than
one detergent yielded a monodisperse peak (Fig. 2,
Supporting Table II).
Interestingly, we found that FC-12 was the most
successful detergent in terms of both solubilization
and behavior in gel filtration. DDM was the second
most effective followed by LDAO, OG, and DM.
CHAPSO proved to be least effective at both solubiliza-
tion and in yielding protein samples having good size
exclusion chromatography behavior. The rank order of
effectiveness in terms of the ability of specific deter-
gents to produce samples having monodisperse pro-
files is FC12, DDM, LDAO and is similar to that
reported by Drew and colleagues for a recent survey of
eukaryotic membrane proteins.9
Fos-choline detergents have been used success-
fully to purify, crystallize, and determine membrane
protein structures,28,29 for membrane protein NMR
studies,30 and for electron microscopy studies of trans-
porter oligomers.31 FC12 has further been shown to be
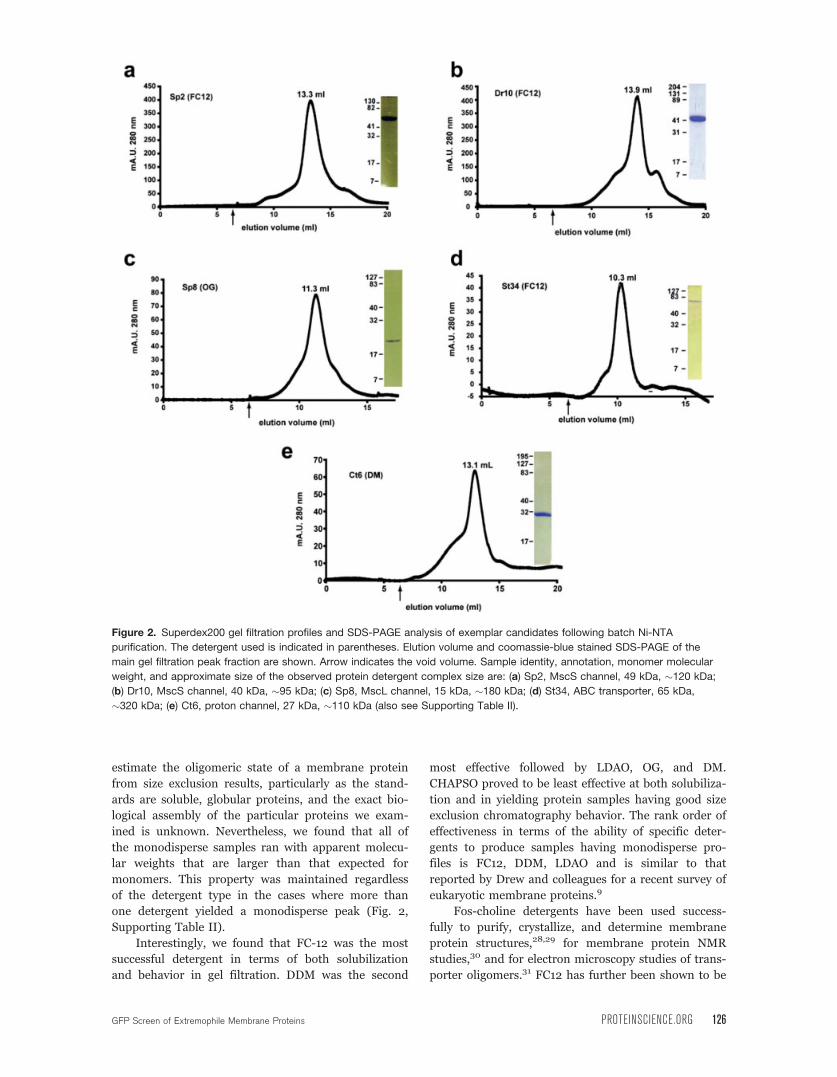
Figure 2. Superdex200 gel filtration profiles and SDS-PAGE analysis of exemplar candidates following batch Ni-NTA
purification. The detergent used is indicated in parentheses. Elution volume and coomassie-blue stained SDS-PAGE of the
main gel filtration peak fraction are shown. Arrow indicates the void volume. Sample identity, annotation, monomer molecular
weight, and approximate size of the observed protein detergent complex size are: (a) Sp2, MscS channel, 49 kDa, �120 kDa;
(b) Dr10, MscS channel, 40 kDa, �95 kDa; (c) Sp8, MscL channel, 15 kDa, �180 kDa; (d) St34, ABC transporter, 65 kDa,
�320 kDa; (e) Ct6, proton channel, 27 kDa, �110 kDa (also see Supporting Table II).
GFP Screen of Extremophile Membrane Proteins PROTEINSCIENCE.ORG 126
efficient at membrane protein solubilization and at
yielding monodisperse samples as judged by size
exclusion chromatography.7 Nevertheless, concerns
have been raised that even though Fos-choline deter-
gents are efficient at extracting proteins from mem-
brane, they may be harsh enough to need to be treated
with caution27 and may not always yield a stable sam-
ple.32 It is notable that 11 of the 19 proteins that gave
good gel filtration profiles in FC12 also gave similar
gel filtration profiles in at least one other more mild
detergent. This result suggests that, at least in these
cases, the samples were not likely to be simply solubi-
lized and denatured by FC12.
Our detergent extraction and gel filtration experi-
ments identify many candidates that were able to pro-
duce protein that gave good gel filtration behavior in
at least one detergent following a very simple purifica-
tion protocol (21/24 candidates) (see Fig. 4). This
observation provides further support for the idea that
the original GFP screen was a good proxy for identify-
ing membrane proteins that have the potential to
yield material of suitable quality for biophysical
experiments.
Discussion
Although there are now a number of reports in which
GFP-based screens have been used to identify proteins
or constructs that have appropriate biophysical charac-
teristics for structural biology experiments,3,5–9 there
have remained some questions regarding the fidelity of
the assay. Our results establish that there is an excel-
lent correspondence between the behavior of mem-
brane protein GFP-fusions and the potential of a given
candidate to be overproduced. Of the candidates that
pass the screen and were subjected to further charac-
terization, 90% can be produced at �0.5 mgL�1 of
culture, with half of these made at �5 mgL�1. These
expression scales are suitable for investing further
effort into purification, biophysical characterization,
and crystallization trials. An important feature of this
work is that the screening can be done manually and
requires no specialized robotic equipment. Thus, such
screens should be applicable in a wide range of
settings.
Membrane protein expression: influence of
molecular weight, transmembrane segmentnumber, and codon usage
Our survey of the expression behavior of a large num-
ber of membrane proteins from diverse sources pro-
vides a dataset that yields insight into the factors that
influence the ability to overproduce a candidate mem-
brane protein [Fig. 3(a,b)]. There are some clear gen-
eral lessons regarding the likelihood of success for a
candidate based on a few simple properties. In gen-
eral, the total molecular weight of the candidate
appears to be an important factor. We found many
well expressed membrane proteins in the 20–50 kDa
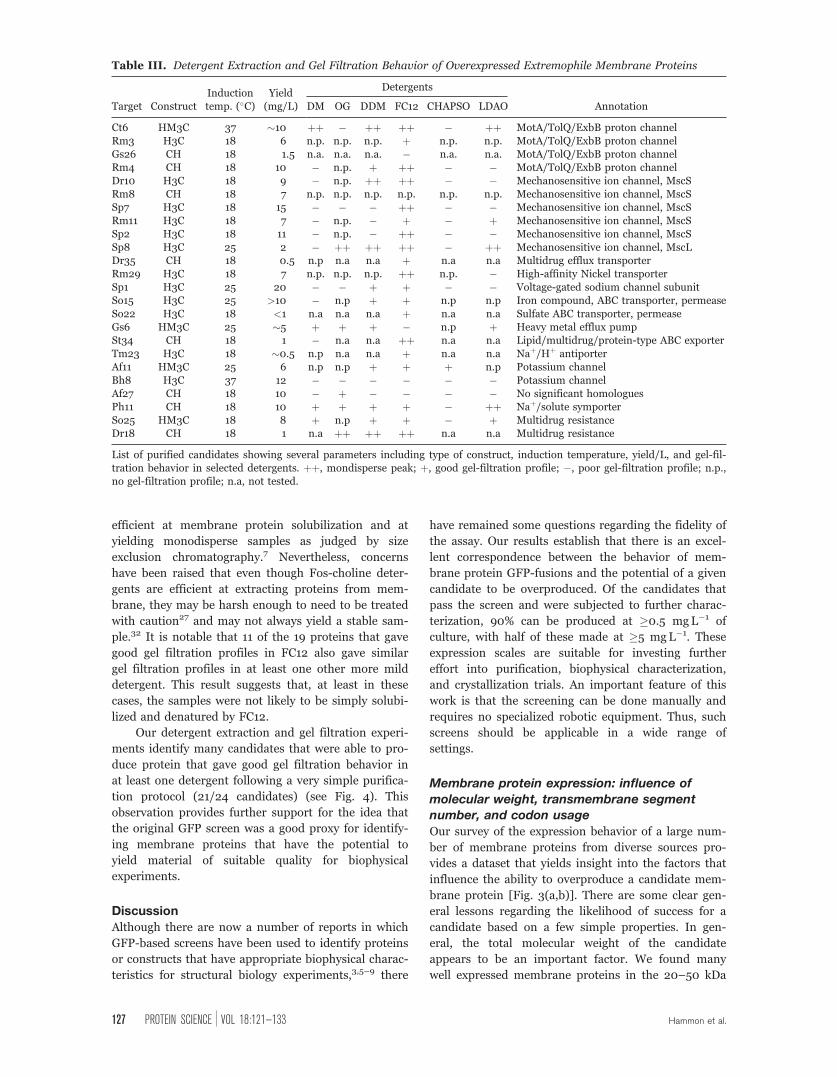
Table III. Detergent Extraction and Gel Filtration Behavior of Overexpressed Extremophile Membrane Proteins
Target ConstructInductiontemp. (�C)
Yield(mg/L)
Detergents
AnnotationDM OG DDM FC12 CHAPSO LDAO
Ct6 HM3C 37 �10 þþ � þþ þþ � þþ MotA/TolQ/ExbB proton channelRm3 H3C 18 6 n.p. n.p. n.p. þ n.p. n.p. MotA/TolQ/ExbB proton channelGs26 CH 18 1.5 n.a. n.a. n.a. � n.a. n.a. MotA/TolQ/ExbB proton channelRm4 CH 18 10 � n.p. þ þþ � � MotA/TolQ/ExbB proton channelDr10 H3C 18 9 � n.p. þþ þþ � � Mechanosensitive ion channel, MscSRm8 CH 18 7 n.p. n.p. n.p. n.p. n.p. n.p. Mechanosensitive ion channel, MscSSp7 H3C 18 15 � � � þþ � � Mechanosensitive ion channel, MscSRm11 H3C 18 7 � n.p. � þ � þ Mechanosensitive ion channel, MscSSp2 H3C 18 11 � n.p. � þþ � � Mechanosensitive ion channel, MscSSp8 H3C 25 2 � þþ þþ þþ � þþ Mechanosensitive ion channel, MscLDr35 CH 18 0.5 n.p n.a n.a þ n.a n.a Multidrug efflux transporterRm29 H3C 18 7 n.p. n.p. n.p. þþ n.p. � High-affinity Nickel transporterSp1 H3C 25 20 � � þ þ � � Voltage-gated sodium channel subunitSo15 H3C 25 >10 � n.p þ þ n.p n.p Iron compound, ABC transporter, permeaseSo22 H3C 18 <1 n.a n.a n.a þ n.a n.a Sulfate ABC transporter, permeaseGs6 HM3C 25 �5 þ þ þ � n.p þ Heavy metal efflux pumpSt34 CH 18 1 � n.a n.a þþ n.a n.a Lipid/multidrug/protein-type ABC exporterTm23 H3C 18 �0.5 n.p n.a n.a þ n.a n.a Naþ/Hþ antiporterAf11 HM3C 25 6 n.p n.p þ þ þ n.p Potassium channelBh8 H3C 37 12 � � � � � � Potassium channelAf27 CH 18 10 � þ � � � � No significant homologuesPh11 CH 18 10 þ þ þ þ � þþ Naþ/solute symporterSo25 HM3C 18 8 þ n.p þ þ � þ Multidrug resistanceDr18 CH 18 1 n.a þþ þþ þþ n.a n.a Multidrug resistance
List of purified candidates showing several parameters including type of construct, induction temperature, yield/L, and gel-fil-tration behavior in selected detergents. þþ, mondisperse peak; þ, good gel-filtration profile; �, poor gel-filtration profile; n.p.,no gel-filtration profile; n.a, not tested.
127 PROTEIN SCIENCE VOL 18:121—133 Hammon et al.
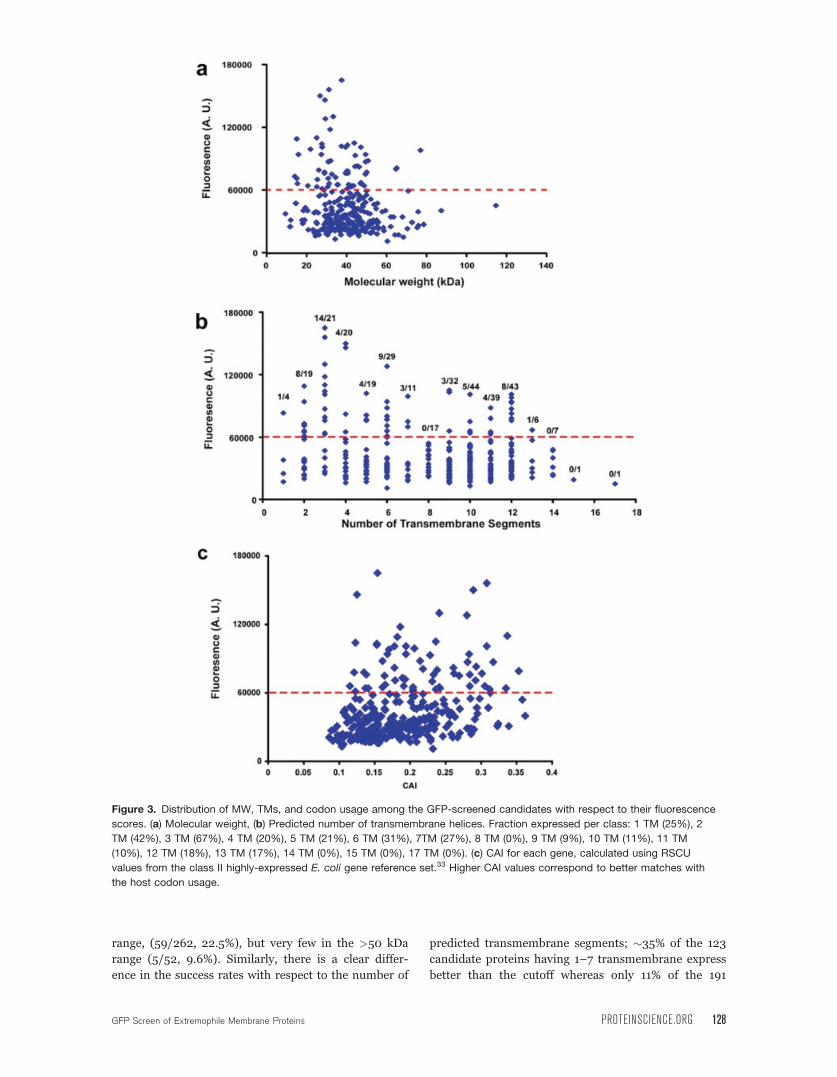
range, (59/262, 22.5%), but very few in the >50 kDa
range (5/52, 9.6%). Similarly, there is a clear differ-
ence in the success rates with respect to the number of
predicted transmembrane segments; �35% of the 123
candidate proteins having 1–7 transmembrane express
better than the cutoff whereas only 11% of the 191
Figure 3. Distribution of MW, TMs, and codon usage among the GFP-screened candidates with respect to their fluorescence
scores. (a) Molecular weight, (b) Predicted number of transmembrane helices. Fraction expressed per class: 1 TM (25%), 2
TM (42%), 3 TM (67%), 4 TM (20%), 5 TM (21%), 6 TM (31%), 7TM (27%), 8 TM (0%), 9 TM (9%), 10 TM (11%), 11 TM
(10%), 12 TM (18%), 13 TM (17%), 14 TM (0%), 15 TM (0%), 17 TM (0%). (c) CAI for each gene, calculated using RSCU
values from the class II highly-expressed E. coli gene reference set.33 Higher CAI values correspond to better matches with
the host codon usage.
GFP Screen of Extremophile Membrane Proteins PROTEINSCIENCE.ORG 128
proteins having 8–17 transmembrane segments
expressed well. It is particularly striking that 67% of
the proteins having three predicted transmembrane
segments expressed as well as or better than the
benchmark proteins.
There is a general notion that one of the parame-
ters that may have an impact on the ability to overex-
press a candidate protein in E. coli is how suited the
codon usage of the candidate gene is to well-expressed
proteins from host organism.34,35 However, data sup-
porting this belief are equivocal. There are anecdotal
reports of successes,36,37 failures,38 and variable out-
comes39 for particular cases of codon optimization.
Large scale study of a set of 1000 soluble proteins
from Plasmodium falciparum, an organism with pro-
teins that are known to be particularly challenging to
express in E. coli, found no significant correlation with
codon usage.40 As we had a diverse set of proteins
from many organisms that have a range codon usages,
we asked whether there was any correlation between
how well the candidate proteins expressed and the
similarity of their codon usage to that of well-
expressed E. coli genes as measured by the ‘‘codon
adaptation index,’’ CAI. This parameter gives a length
independent assessment of how well each test gene
matches the codon usage of well-expressed proteins
from the host.33 Strikingly, for those candidates that
pass our threshold GFP value, we find no correlation
between the CAI for a given gene and expression level
[Fig. 3(c)]. Indeed, a number of the proteins having
the highest GFP values can be produced at very high
levels following optimization in spite of having very
low CAI scores (Ph11, CAI ¼ 0.123, 10 mgL�1; So15,
CAI ¼ 0.153, >10 mgL�1; Bh8 CAI ¼ 0.154, 12
mgL�1). Even though individual rare codons may cer-
tainly cause expression difficulties,34,35 our data sup-
port the conclusion that codon optimization is not a
key parameter for heterologous membrane protein
expression in E. coli.
Comparisons other GFP-membraneprotein screens
Given the challenges associated with membrane pro-
tein biochemistry, there have been a number of
reports describing the implementation of GFP-based
screens as a means to identify potentially tractable
candidate proteins. Although large scale GFP screens
in E. coli,6 S. cereviseae9 have reported success in
identification of well-expressed candidates, multi-milli-
gram expression levels of non-host derived proteins
per liter of culture have not yet been generally demon-
strated. A key advance reported here is the use of
benchmark proteins to set a threshold level for well-
expressed candidates paired with construct and
expression temperature optimization protocol. To-
gether, this approach identifies a large number of can-
didate proteins that can be made at �0.5 mgL�1 with
some candidates expressing better than 10 mgL�1.
Similar to the recently reported S. cerevisiae survey,9
we find that Fos-choline 12 (FC-12) has the best suc-
cess at both solubilizing membrane expressed material
and producing material having a good gel filtration
profile (Table III). The high success with fos-choline
detergents in membrane protein solubilization has
raised some of the concern regarding the potential
destabilizing effects of this detergent class.27,32 Impor-
tantly, a large number of the expressed extremophile
membrane proteins that can be extracted from the
membrane using FC-12 are also extracted from the
membrane and give good gel filtration profiles in
other, more conventionally used detergents.
Methods
Target selection and sequence analysisAnnotation searches for membrane proteins denoted
as ion channels, transporters, exchangers, antiporters,
carriers and major facilitator superfamily in the
genomes of Aeropyrum pernix (Ap), Archaeoglobus
fulgidus (Af), Bacillus halodurans (Bh), Chlorobium
tepidium (Ct), Deinococcus radiodurans (Dr), Desulfo-
vibrio vulgaris (Dv), Geobacter sulfurreducens (Gs),
Oenococcus oeni (Oo), Pyrococcus furiosus (Pf), Pyro-
coccus horikoshii (Ph), Ralstonia metallidurans (Rm),
Shewanella oeneidensis (So), Silicibacter pomeroyi
(Sp), Streptococcus thermophilus (St), Sulfolobus
solfataricus (Ss), Thermotoga maritima (Tm), Thermus
thermophilus (Tt), and Thermoplasma volcanium (Tv)
were performed using the Integr8 protein database
(http://www.ebi.ac.uk/integr8). To find unannotated the
membrane proteins, each genome was searched with a
sequence representing a generic transmembrane helix
using BLASTP41 at the National Center for Biotechnology
Information (NCBI; http://www.ncbi.nlm.nih.gov). This
search yielded a list of membrane proteins in the chosen
organism from which we selected several proteins with
no homologues of known structure. All transmembrane
helix predictions were performed with TMHMM 2.016
(http://www.cbs.dtu.dk/services/TMHMM-2.0). A com-
plete list of screened proteins and values from the GFP
screen can be found in Supporting Table I.
Construct generation
All genes were cloned using ligation-independent clon-
ing (LIC)13 of PCR products containing LIC overhangs
and directly cloned into vector containing a comple-
mentary LIC cassette (Supporting Fig. 1). For the GFP
screening, genes encoding candidate membrane pro-
teins were cloned into a pET-based LIC vector that
harbors a Tobacco etch virus protease cleavage site fol-
lowed by a C-terminally His8 tagged GFP. The three
vectors used in overexpression optimization experi-
ments were H3C (N-terminal His8 tag-3C protease
cleavage site42 followed by the gene of interest),
HM3C (N-terminal His6 tag-maltose binding protein-
3C protease cleavage site followed by the gene of
129 PROTEIN SCIENCE VOL 18:121—133 Hammon et al.
interest), and CH (gene of interest followed by a TEV
protease cleavage site and a His8 tag). The GFP and
CH vectors share the same LIC cassette, whereas, the
H3C and HM3C vectors share a different LIC cassette
(Supporting Fig. 1). PCR reactions were done using
Phusion high-fidelity DNA polymerase (Finnzymes)
and genomic DNA for each parent organism. Genomic
DNA was obtained from ATCC (www.atcc.org).
Expression of GFP-fusion and non-GFP fusion
membrane proteinsTwo different cell types of E. coli were used. BL21
(DE3) pLysS were used for screening of GFP-fusion
candidates and C41 cells43 were used for expression
optimization and protein production. BL21 (DE3)
pLysS cells were used for the GFP screen owing to the
observation that they are reported to be less sensitive
to variations in OD600 nm of induction than the C41
strain.7
GFP screening
Individual E. coli BL21 (DE3) pLysS cultures for each
of the candidate GFP-fusions were grown in 7 mL
Luria-Bertani (LB) media at 37�C to OD600 nm �0.5.
Induction was done at 25�C using 0.4 mM IPTG. After
20 h of growth post-induction, the cell pellet was
recovered from 1 mL of culture (2 min at 13,000 rpm
in a bench top 5415D centrifuge (Eppendorf)) and
resuspended in 200 lL of 200 mM KCl, 20 mM Tris
pH 8.0. Samples were subjected to the whole-cell fluo-
rescence assay (465–485 nm excitation, 515–575 nm
emission) using a 20/20n luminometer with a Blue
fluorescent module (Turner Biosystems, U.S.A.). In
each experiment uninduced cells and cells expressing
the GFP fusion of BH8, a well-expressed candidate
protein, were run as controls. These controls have re-
producible fluorescence measurements over a number
of trials, F.A.U. of 23,667 � 1021, n ¼ 6, and 174,964
� 5397, n ¼ 6, for uninduced and BH8 expressing
cells, respectively.
Expression optimization using
non-GFP constructs
Proteins for overexpression optimization were selected
based on the fluorescence values from the GFP screen.
Genes for the selected proteins were cloned into H3C,
CH, and HM3C tag formats and transformed into C41
cells.43 Cultures were grown in 7 mL LB media at
37�C. Induction was performed at OD600 nm �0.5
using 0.4 mM IPTG. Immediately following induction,
cultures were moved to one of three different expres-
sion temperatures, 18�, 25�, or 37�C, and were grown
for 48, 20, and 3 h, respectively. Following expression,
500 lL of cells were harvested by centrifugation (2
min at 13,000 rpm in a bench top 5415D centrifuge
(Eppendorf), resuspended in 50 lL of 200 mM KCl,
20 mM Tris, pH 8.0, and lysed by the addition of 50
lL of 2% SDS, 20% glycerol, 0.05% bromophenol
blue, 125 mM Tris pH 6.8. Expression was assayed by
SDS-PAGE analysis with Coomassie staining and
Western blot using an anti-His5 HRP conjugate anti-
body (Qiagen). The best-optimized condition from this
assay was used for a scale-up.
Membrane preparationsC41 E. coli cells harboring the expression construct of
interest were grown in 1 L 2xYT (5 g NaCl, 16 g tryp-
tone, 10 g yeast extract) under conditions that were
determined to give the best expression for each indi-
vidual construct under investigation. Cell pellets
obtained from the 1 L culture were suspended in 90
mL lysis buffer (200 mM KCl, 20 mM Tris pH 8.0,
8% glycerol, 2 mM EDTA, 1 mM PMSF, 1 mM DTT)
and disrupted by sonication for 4 min on ice using a
Sonic Dismembrator model 500 (Fisher). Cell lysate
was centrifuged in a JA 25.50 rotor (Beckman Coulter)
at 7000g for 35 min at 4�C to remove unbroken cells
and debris. The supernatant was then centrifuged in a
Ti45 rotor (Beckman Coulter) at 40,000 rpm for 2 h
at 4�C to separate the membrane pellet. Pellets were
homogenized in a storage buffer (200 mM KCl, 20
mM Tris pH 8.0, 8% glycerol) with a Dounce Tissue
Grinder (Kimble Kontes LLC) and frozen at �80�C.
Membrane protein extraction, purification,and characterization
All extraction, purification, and characterization were
done at 4�C. Membrane extractions and purifications
were performed with six detergents (Anatrace, USA):
DM (40 mM), OG (200 mM), LDAO (2% v/v), DDM
(20 mM), CHAPSO (160 mM), and FC12 (40 mM),
added and incubated for 2 h at 4�C. Detergent-solubi-lized membrane proteins were separated from insolu-
ble material by ultracentrifugation for 45 min at
55,000 rpm at 4�C in a TLA 110 rotor on a bench-top
ultracentrifuge (Beckman Coulter). Following recovery,
the supernatant was incubated with a bed volume of
0.5 mL of pre-equilibrated Ni-NTA superflow beads
(Qiagen) at 4�C. Protein-bound beads were washed
with the appropriate detergent buffer consisting of
200 mM KCl, 30 mM imidazole, 8% glycerol (v/v),
detergent (3� critical micelle concentration (CMC),
except for LDAO which was used at 10� CMC), 20
mM Tris, pH 8.0 and eluted with the same detergent
buffer containing 300 mM imidazole. The eluted pro-
tein samples were >80–90% pure based on SDS-
PAGE analysis. Protein concentration was determined
by absorbance at 280 nm.44 Purified samples were
subjected to size exclusion chromatography on a
Superdex200 column (GE Healthcare) to assess the
homogeneity and stability in a running buffer of 200
mM KCl, 8% glycerol (v/v), detergent (3� CMC,
except for LDAO which was used at 10� CMC),
20 mM Tris, pH 8.0.
GFP Screen of Extremophile Membrane Proteins PROTEINSCIENCE.ORG 130
Codon adaptation index calculation
Codon adaptation index (CAI) values for each candi-
date gene were calculated according to Sharp and
Li33 using the webserver (http://www.evolvingcode.-
net/codon/cai/cais.php).45 CAI ¼ CAIobs/CAImax
where the observed CAI for a given gene sequence
CAIobs ¼ ðQLk¼1 RSCUkÞ1=L and the maximal CAI score
is CAImax ¼ ðQLk¼1 RSCUkmaxÞ1=L. RSCUk is the ‘‘rela-
tive synonymous codon usage’’ value for the kth
codon in the gene, RSCUkmax is the maximum RSCU
value for the amino acid encoded by the kth codon in
the gene, and L is the number of codons in the gene.
RSCUij ¼ xij
�1ni
Pni
j¼1 xij where xij is the number of
occurrences of the jth codon for the ith amino acid and
ni is the number (from 1–6) of alternative codons for
the ith amino acid. RSCUkmax values were calculated
from the class II highly-expressed E. coli gene refer-
ence set.33
ConclusionsProducing membrane proteins and membrane proteincomplexes for biochemical and structural studyremains a major challenge. The development of meth-
ods that provide a rapid way to identify membraneproteins that can be expressed in sufficient amountsand of sufficient quality is an area of intensiveeffort.4,6–9,46 This report provides strong evidence thatscreening GFP-fusions provides a fruitful approach foridentifying well-expressed candidate membrane pro-teins that display favorable biophysical behaviors suit-able for further functional and structural investigation,and that a key factor in success is the investmentin optimization of construct tags and inductiontemperature.
Structural and biochemical studies of integral
membrane proteins remains challenging because iden-
tifying a candidate protein that has good expression,
that can be readily purified, and that has suitable
behavior in detergent solution can require a
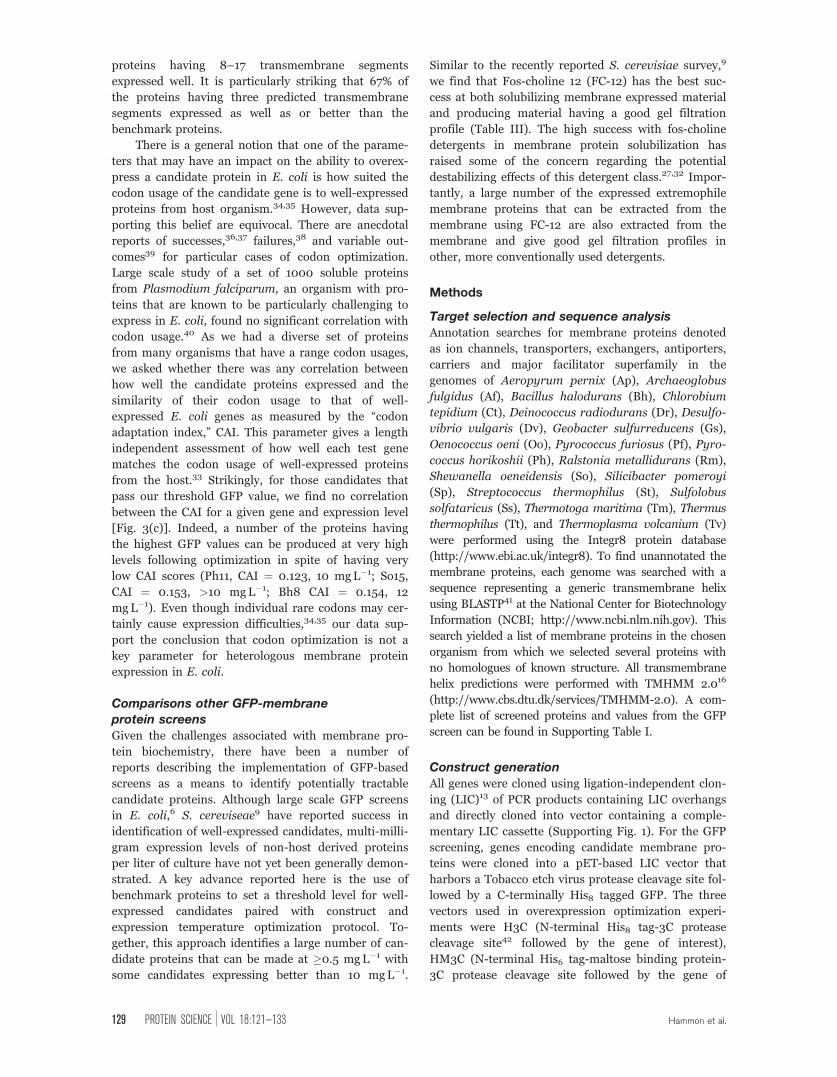
Figure 4. Summary of extremophile membrane protein GFP screen. Results are presented as a funnel. At each stage some
candidates are eliminated due to a failure to pass progressively more stringent tests. The exception is the step from GFP-
positive to expression optimization in which 32 GFP-positive proteins along with 20 representatives from categories having
lower GFP signals were chosen for expression optimization and further testing. Candidates passing the final stage of being
monodisperse and stable are suitable for immediate evaluation by crystallization trials, small-angle X-ray scattering (SAXS), or
other biophysical and functional analysis.
131 PROTEIN SCIENCE VOL 18:121—133 Hammon et al.

substantial investment in time and resources. By com-
bining a GFP-screen with a simple optimization proto-
col, we have been able to achieve a high success rate
identifying candidate proteins that can be well
expressed and that display desirable biophysical char-
acteristics. A key implementation was the use of
benchmark proteins to set a level of GFP fluorescence
that will identify a candidate with a high likelihood of
success. We anticipate that the large number of diverse
membrane proteins we identify here as having good
expression profiles will provide excellent starting points
for both functional and structural studies. A summary
of the outcome of the screen is shown in Figure 4. As
with other expression surveys of panels of membrane
proteins in which multiple levels of behavior are eval-
uated,27 the approach we report here functions as a
funnel in which the there is an attrition of candidates
as the stringency imposed at each step increases. It
may be possible to salvage some failed candidates by
additional exploration of alternate constructs that are
designed to eliminate regions of predicted polypeptide
disorder. Further, just as combination of mutagenesis
and GFP screens has proved useful for defining appro-
priate constructs of soluble proteins for crystallization
and structure determination,47,48 it is likely similar
combination mutagenesis/GFP screens should prove
fruitful for enhancing the production of crystal grade
membrane protein samples or for rescuing failed candi-
dates. Similarly, GFP-based studies using other expres-
sion hosts and as a means to identify well-expressed
complexes through co-expression strategies49–51 should
enable the structural investigation of an array of mem-
brane proteins and membrane protein complexes.
AcknowledgmentWe thank K. Brejc, J.M. Berger, and M. Pioletti for com-
ments on the manuscript and members of the Minor lab
for input at all stages of this work. DLM is an AHAEstab-
lished Investigator.
References1. Grisshammer R, Tate CG (1995) Overexpression of inte-
gral membrane proteins for structural studies. Q Rev Bio-phys 28:315–422.
2. Lacapere JJ, Pebay-Peyroula E, Neumann JM, EtchebestC (2007) Determining membrane protein structures: stilla challenge! Trends Biochem Sci32:259–270.
3. Waldo GS, Standish BM, Berendzen J, Terwilliger TC(1999) Rapid protein-folding assay using green fluores-cent protein. Nat Biotechnol 17:691–695.
4. Drew DE, von Heijne G, Nordlund P, de Gier JW (2001)Green fluorescent protein as an indicator to monitormembrane protein overexpression in Escherichia coli.FEBS Lett 507:220–224.
5. Cabantous S, Pedelacq JD, Mark BL, Naranjo C, Terwil-liger TC, Waldo GS (2005) Recent advances in GFPfolding reporter and split-GFP solubility reporter technol-ogies. Application to improving the folding and solubilityof recalcitrant proteins from Mycobacterium tuberculosis.J Struct Funct Genomics 6:113–119.
6. Drew D, Slotboom DJ, Friso G, Reda T, Genevaux P,Rapp M, Meindl-Beinker NM, Lambert W, Lerch M,Daley DO, Van Wijk KJ, Hirst J, Kunji E, De Gier JW(2005) A scalable, GFP-based pipeline for membraneprotein overexpression screening and purification. Pro-tein Sci 14:2011–2017.
7. Drew D, Lerch M, Kunji E, Slotboom DJ, de Gier JW(2006) Optimization of membrane protein overexpres-sion and purification using GFP fusions. Nat Methods 3:303–313.
8. Kawate T, Gouaux E (2006) Fluorescence-detection size-exclusion chromatography for precrystallization screeningof integral membrane proteins. Structure 14:673–681.
9. Newstead S, Kim H, von Heijne G, Iwata S, Drew D(2007) High-throughput fluorescent-based optimizationof eukaryotic membrane protein overexpression and puri-fication in Saccharomyces cerevisiae. Proc Natl Acad SciUSA 104:13936–13941.
10. Reid BG, Flynn GC (1997) Chromophore formation ingreen fluorescent protein. Biochemistry 36:6786–6791.
11. Wachter RM (2007) Chromogenic cross-link formation ingreen fluorescent protein. Acc Chem Res 40:120–127.
12. Drew D, Sjostrand D, Nilsson J, Urbig T, Chin CN, deGier JW, von Heijne G (2002) Rapid topology mappingof Escherichia coli inner-membrane proteins by predic-tion and PhoA/GFP fusion analysis. Proc Natl Acad SciUSA 99:2690–2695.
13. Aslanidis C, de Jong PJ (1990) Ligation-independentcloning of PCR products (LIC-PCR). Nucleic Acids Res18:6069–6074.
14. Kapust RB, Waugh DS (2000) Controlled intracellularprocessing of fusion proteins by TEV protease. ProteinExpr Purif 19:312–318.
15. Zhang G, Gurtu V, Kain SR (1996) An enhanced greenfluorescent protein allows sensitive detection of genetransfer in mammalian cells. Biochem Biophys Res Com-mun 227:707–711.
16. Krogh A, Larsson B, von Heijne G, Sonnhammer EL(2001) Predicting transmembrane protein topology with ahidden Markov model: application to complete genomes.J Mol Biol 305:567–580.
17. Jenney FE, Jr, Adams MW (2008) The impact of extrem-ophiles on structural genomics (and vice versa). Extremo-philes 12:39–50.
18. Savage DF, Egea PF, Robles-Colmenares Y, O’Connell JD,III, Stroud RM (2003) Architecture and selectivity inaquaporins: 2.5 a X-ray structure of aquaporin Z. PLoSBiol 1:E72.
19. Jiang J, Daniels BV, Fu D (2006) Crystal structure ofAqpZ tetramer reveals two distinct Arg-189 conforma-tions associated with water permeation through thenarrowest constriction of the water-conducting channel.J Biol Chem 281:454–460.
20. Jiang Y, Lee A, Chen J, Ruta V, Cadene M, Chait BT,MacKinnon R (2003) X-ray structure of a voltage-dependent Kþ channel. Nature 423:33–41.
21. Lee SY, Lee A, Chen J, MacKinnon R (2005) Structure ofthe KvAP voltage-dependent Kþ channel and its depend-ence on the lipid membrane. Proc Natl Acad Sci USA102:15441–15446.
22. Wiener MC (2004) A pedestrian guide to membrane pro-tein crystallization. Methods 34:364–372.
23. Prive GG (2007) Detergents for the stabilization andcrystallization of membrane proteins. Methods 41:388–397.
24. Michel H (1982) Three-dimensional crystals of a mem-brane protein complex. The photosynthetic reactioncentre from Rhodopseudomonas viridis. J Mol Biol 158:567–572.
GFP Screen of Extremophile Membrane Proteins PROTEINSCIENCE.ORG 132
25. Borths EL, Locher KP, Lee AT, Rees DC (2002) Thestructure of Escherichia coli BtuF and binding to its cog-nate ATP binding cassette transporter. Proc Natl Acad SciUSA 99:16642–16647.
26. Daniels BV, Jiang JS, Fu D (2004) Crystallization andpreliminary crystallographic analysis of the Escherichiacoli water channel AqpZ. Acta Crystallogr D Biol Crystal-logr 60:561–563.
27. Lewinson O, Lee AT, Rees DC (2008) The funnelapproach to the precrystallization production of mem-brane proteins. J Mol Biol 377:62–73.
28. Bass RB, Strop P, Barclay M, Rees DC (2002) Crystalstructure of Escherichia coli MscS, a voltage-modulatedand mechanosensitive channel. Science 298:1582–1587.
29. Wang W, Black SS, Edwards MD, Miller S, Morrison EL,Bartlett W, Dong C, Naismith JH, Booth IR (2008) Thestructure of an open form of an E. coli mechanosensitivechannel at 3.45 A resolution. Science 321:1179–1183.
30. Baker KA, Tzitzilonis C, Kwiatkowski W, Choe S, Riek R(2007) Conformational dynamics of the KcsA potassiumchannel governs gating properties. Nat Struct Mol Biol14:1089–1095.
31. McDevitt CA, Collins RF, Conway M, Modok S, Storm J,Kerr ID, Ford RC, Callaghan R (2006) Purification and3D structural analysis of oligomeric human multidrugtransporter ABCG2. Structure 14:1623–1632.
32. Carpenter EP, Beis K, Cameron AD, Iwata S (2008)Overcoming the challenges of membrane protein crystal-lography. Curr Opin Struct Biol 18:581–586.
33. Sharp PM, Li WH (1987) The codon Adaptation Index–ameasure of directional synonymous codon usage bias,and its potential applications. Nucleic Acids Res 15:1281–1295.
34. Gustafsson C, Govindarajan S, Minshull J (2004) Codonbias and heterologous protein expression. Trends Bio-technol 22:346–353.
35. Jana S, Deb JK (2005) Strategies for efficient productionof heterologous proteins in Escherichia coli. Appl Micro-biol Biotechnol 67:289–298.
36. Hernan RA, Hui HL, Andracki ME, Noble RW, Sligar SG,Walder JA, Walder RY (1992) Human hemoglobinexpression in Escherichia coli: importance of optimalcodon usage. Biochemistry 31:8619–8628.
37. Li A, Kato Z, Ohnishi H, Hashimoto K, Matsukuma E,Omoya K, Yamamoto Y, Kondo N (2003) Optimized genesynthesis and high expression of human interleukin-18.Protein Expr Purif 32:110–118.
38. Hedfalk K, Pettersson N, Oberg F, Hohmann S, GordonE (2008) Production, characterization and crystallizationof the Plasmodium falciparum aquaporin. Protein ExprPurif 59:69–78.
39. Burgess-Brown NA, Sharma S, Sobott F, Loenarz C,Oppermann U, Gileadi O (2008) Codon optimization canimprove expression of human genes in Escherichia coli: amulti-gene study. Protein Expr Purif 59:94–102.
40. Mehlin C, Boni E, Buckner FS, Engel L, Feist T, GelbMH, Haji L, Kim D, Liu C, Mueller N, Myler PJ, ReddyJT, Sampson JN, Subramanian E, Van Voorhis WC,Worthey E, Zucker F, Hol WG (2006) Heterologousexpression of proteins from Plasmodium falciparum:results from 1000 genes. Mol Biochem Parasitol 148:144–160.
41. Altschul SF, Gish W, Miller W, Myers EW, Lipman DJ(1990) Basic local alignment search tool. J Mol Biol 1215:403–410.
42. Cordingley MG, Callahan PL, Sardana VV, Garsky VM,Colonno RJ (1990) Substrate requirements of human rhi-novirus 3C protease for peptide cleavage in vitro. J BiolChem 265:9062–9065.
43. Miroux B, Walker JE (1996) Over-production of proteinsin Escherichia coli: mutant hosts that allow synthesis ofsome membrane proteins and globular proteins at highlevels. J Mol Biol 260:289–298.
44. Edelhoch H (1967) Spectroscopic determination oftryptophan and tyrosine in proteins. Biochemistry 6:1948–1954.
45. Wu G, Culley DE, Zhang W (2005) Predicted highlyexpressed genes in the genomes of Streptomyces coeli-color and Streptomyces avermitilis and the implicationsfor their metabolism. Microbiology 151:2175–2187.
46. Molina DM, Cornvik T, Eshaghi S, Haeggstrom JZ, Nor-dlund P, Sabet MI (2008) Engineering membrane pro-tein overproduction in Escherichia coli. Protein Sci 17:673–680.
47. Jacobs SA, Podell ER, Cech TR (2006) Crystal structureof the essential N-terminal domain of telomerase reversetranscriptase. Nat Struct Mol Biol 13:218–225.
48. Jacobs SA, Podell ER, Wuttke DS, Cech TR (2005)Soluble domains of telomerase reverse transcriptaseidentified by high-throughput screening. Protein Sci 14:2051–2058.
49. Fitzgerald DJ, Berger P, Schaffitzel C, Yamada K, Rich-mond TJ, Berger I (2006) Protein complex expression byusing multigene baculoviral vectors. Nat Methods 3:1021–1032.
50. Fitzgerald DJ, Schaffitzel C, Berger P, Wellinger R, Bien-iossek C, Richmond TJ, Berger I (2007) Multiproteinexpression strategy for structural biology of eukaryoticcomplexes. Structure 15:275–279.
51. Bieniossek C, Richmond TJ, Berger I (2008) MultiBac:multigene baculovirus-based eukaryotic protein complexproduction. Curr Protoc Protein Sci 5:Unit 5 20.
133 PROTEIN SCIENCE VOL 18:121—133 Hammon et al.