a grid and group explanation of students’...
TRANSCRIPT

A GRID AND GROUP EXPLANATION OF STUDENTS’ AND INSTRUCTORS’
PREFERENCES IN COMPUTER ASSISTED INSTRUCTION: A CASE STUDY OF
UNIVERSITY CLASSROOMS IN THAILAND
By
AREE LIMWUDHIKRAIJIRATH
Bachelor of Science Chulalongkorn University
Bangkok, Thailand 1980
Master of Science
National Institute Development Administration Bangkok, Thailand
1985
Submitted to the Faculty of the
Graduate College of the Oklahoma State University
in partial fulfillment of the requirements for
the Degree of DOCTOR OF EDUCATION
July, 2009

A GRID AND GROUP EXPLANATION OF STUDENTS’ AND INSTRUCTORS’
PREFERENCES IN COMPUTER ASSISTED INSTRUCTION: A CASE STUDY OF
UNIVERSITY CLASSROOMS IN THAILAND
Dissertation Approved:
Dr. Edward Harris
Dissertation Adviser
Dr. Cecil Dugger
Dr. Adrienne Hyle
Dr. Kathleen Kelsey
Dr. A. Gordon Emslie
Dean of the Graduate College
ii

ACKNOWLEDGEMENTS
First, I would like to express my gratitude to my first instructors, my parents.
Even though ENIAC (Electronic Numerical Integrator and Computer), built by Mauchly
and Eckert in 1946, was known as the first practical electronic computer, it was actually
the abacus invented and used in China since 3000 BC, that was the first tool for
calculation. The first instructor who trained me to use the abacus was my father. My
father gave me much knowledge and my mother paved the way for my learning. They
effectively motivated me to learn by setting the appropriate environment. They, however,
never forced me to learn. They both helped me to acquire knowledge and assisted me to
learn skills. They taught me to be a good person who can live happily in society and do
no harm to the environment.
I would like to thank my brothers and sisters, including my nephews, my nieces,
and all my relatives. They always gave me much help and encouragement in doing my
work as a teacher and as a doctoral student. Thank you for the hard cover dictionary.
Thank you for an electronic dictionary. Thank you for a Final Countdown arousing song.
Thank you for many pieces of valuable information. Thank you for keeping in touch with
me all the time.
I would like to say thank you my twin; not my identical twin, just my
“coincidental” twin. She was born the same day and month as me, but in a different year.
We were born in the same province, Nakhon Sri Thammarat, “the town of scholars.”
iii

She has more experience than me and always gives me more information and instruction.
She was born in the opposite zodiac sign of mine. She graduated from AUS. I graduated
from USA. Both of us are interested in the same thing, Computer Assisted Instruction.
She always gives me valuable assistance along with excellent friendship. Thank you Dr.
Waraporn Sripetpun.
I would like to acknowledge and thank my committee members: Dr. Cecil
Dugger, Dr. Adrienne Hyle, and Dr. Kathleen Kelsey, for their expertise and precious
time. A special thanks to my advisor, Dr. Edward Harris, for his generous guidance, and
his countless hours of patient reading, reviewing, revising, and reflecting.
I am grateful to all members of this cohort program. We had the opportunity to
share our memories and experiences together. A special thank to Dr. Edward Harris
(again), who managed this program from the first step to the end. Extraordinary thanks to
the people who initiated this program. Thank you former Prince of Songkla University
president and a senator of Thailand, Dr. Prasert Chitapong. Thank you former Oklahoma
State University president and Oklahoma State senator, Dr. Jim Halligan. Their
administration experiences in higher education gave me various valuable visions. Thank
you current PSU president, Dr. Boonsom Siribumrungsuk for allowing this program to
continue. Thank you PSU vice president, Waran Tanchaiswad, M.D., who managed this
program in Thailand throughout the entire process. Thank you the Dean of Faculty of
Management Sciences, Dr. Bussabong Chaijaroenwatana for allowing me to enter this
program.
I would like to express my thanks and appreciation to all of my professors at OSU
and all the knowledge they transferred to us. Dr. Timothy Pettibone paved the way for
iv

our effective teachings. We learned about many models of teaching, tact of teaching, and
art of teaching from Dr. Kathryn Castle. Dr. Kenneth Stern gave us opportunity to have
real experiences during the internships. Dr. Adrienne Hyle introduced us to recognize and
to know about change management. We learned about impact of college on students and
on society from Dr. Rhonda McClellan. I learned many benefits from studying statistics
with Dr. Laura Barnes. I learned about evaluation from Dr. Kathleen Kelsey. Dr. Hongyu
Wang’s instruction paved the way for us to appreciate Chinese aesthetic and the Tao of
Curriculum. I appreciated the first class with Dr. Kerry Kearney. It was interesting to
know that we could study people from the way they draw pictures. It may be my first step
for studying people from their cultural context. The second step was when I have
opportunity to practice doing my qualitative research at Aspen Coffee. Thank you Dr.
Harris again. It was certainly beneficial having the opportunity to read Dr. Harris’s book,
Key strategies to improve schools: how to apply them contextually, and having the
opportunity to ask him many questions until I understand enough to take the first step for
my study.
Thank you Dr. Stacy Otto. Theoretical foundations of inquiry may be not a “piece
of cake”, but your “cakes” were so delicious. Thank you Dr. James Key, the owner of the
phrase “teaching with 2 Keys.” Thank you Dr. Dugger. What we learned from you took
us “into space” (NASA - National Aeronautics and Space Administration) and “inside the
mind” (a frontier for kindness). Thanks to Dr. Robert Nolan, for his kindness and help.
Thanks to Dr. Stephen Wanger and Larry Shawn Bassham, for serving us magnificent
guides in New York City and in Washington D.C. I still remembered, “walk, walk,
v

walk.” Thanks also go to the OSU Thai students. Thank you Aarond Graham. Thank you
Val. Thank you Nui. There are so many names that I cannot name them all here.
Finally, I would like to express my appreciation to all my colleagues at the
Faculty of Management Sciences, especially all instructors and students who devoted
their time giving me valuable information. This study could not have been completed
without their help.
vi

TABLE OF CONTENTS
Chapter Page I. INTRODUCTION............................................................................................................1
Statement of the Problem...............................................................................................2 Purpose of the Study ......................................................................................................4 Research Questions........................................................................................................4 Theoretical Framework..................................................................................................5 Procedures/Methods.....................................................................................................10 Protection of Human Subjects ...............................................................................11 Instrumentation ......................................................................................................12 Data Sources ..........................................................................................................12 Data Collection ......................................................................................................13 Significance of the Study .............................................................................................16 Practice...................................................................................................................17 Research.................................................................................................................17 Theory ....................................................................................................................17 Limitations of the Study...............................................................................................17 Definitions of Terms ....................................................................................................18 Summary and Organization of the Study.....................................................................19 II. LITERATURE REVIEW ..............................................................................................21 CAI and Instruction......................................................................................................21 Definitions of Computer Assisted Instruction........................................................21 Varieties of Computer Assisted Instruction............................................................24 A Complete CAI System........................................................................................26 Why CAI is used? ..................................................................................................27 Ambiguous Terms ..................................................................................................28 Successful and Unsuccessful Usage of CAI ................................................................31 Successful CAI.......................................................................................................31 Unsuccessful CAI ..................................................................................................32 How to Develop a Successful CAI ..............................................................................34 Theoretical Framework................................................................................................35 What is Culture? ....................................................................................................36 Cultural Theory......................................................................................................39 Grid Dimension......................................................................................................39
vii

Chapter Page Group Dimension.........................................................................................................40 Summary ......................................................................................................................45 III. METHODOLOGY AND PROCEDURES ..................................................................46 Methodology................................................................................................................46 Data Collection Procedures..........................................................................................49 Protection of Human Subjects ...............................................................................49 Instrumentation ......................................................................................................49 Data Needs .............................................................................................................50 Data Sources ..........................................................................................................50 Data Collection ......................................................................................................51 Data Analysis ...............................................................................................................56 IV. PRESENTATION OF DATA .......................................................................................62 Prince of Songkla University .......................................................................................62 The Faculty of Management Sciences .........................................................................65 The Playing Field...................................................................................................66 The Players.............................................................................................................70 The Rules of the Game ..........................................................................................73 What Students and Instructors Do Using Computer in General ......................78 Point of View about CAI: What it is ................................................................82 The Game...............................................................................................................83 Modes of CAI that Instructors Liked Most......................................................83 Modes of CAI that Instructors Liked Least .....................................................83 Modes of CAI that Students Liked Most .........................................................84 Modes of CAI that Students Liked Least.........................................................84 The Calendar .........................................................................................................85 Summary ......................................................................................................................85 V. DATA ANALYSIS.....................................................................................................87 FMS Students...............................................................................................................92 FMS Students’ Survey Results.........................................................................92 FMS Students’ Work Environment (Playing Field and Players)......................95 FMS Students’ Practices and Preferences in CAI (Rules of the Game and the Game)............................................................96 FMS Students’ Time (Calendar) ......................................................................99 Grid and Group Summary of FMS Students........................................................101 FMS Instructors .........................................................................................................102 FMS Instructors’ Survey Results .........................................................................102 FMS Instructors’ Work Environment (Playing Field and Players) ......................105 FMS Instructors’ Practices and Preferences in CAI (Rules of the Game and the Game)................................................................106
viii

Chapter Page FMS Instructors’ Time (Calendar) .................................................................107 Grid and Group Summary of FMS Instructors ....................................................108 Comparison and Contrast of FMS Students and Instructors......................................111 Modes of CAI that Instructor Liked Most by Cultural Contexts ...............................111 Modes of CAI that Instructor Liked Least by Cultural Contexts...............................112 Modes of CAI that Students Liked Most by Cultural Contexts.................................113 Modes of CAI that Students Liked Least by Cultural Contexts ................................114 Summary ....................................................................................................................115 VI. FINDINGS, CONCLUSIONS, IMPLICATIONS, & RECOMMENDATIONS.......116 Summary of the Findings...........................................................................................117 Conclusions................................................................................................................122 Implications................................................................................................................124 Practice.................................................................................................................124 Research...............................................................................................................125 Theory ..................................................................................................................126 Recommendations......................................................................................................126 REFERENCES ................................................................................................................131 APPENDICES .................................................................................................................144 APPENDIX A – Institutional Review Board Approval…….. ...................................145 APPENDIX B - Letter to the Dean of FMS………………… ..................................147 APPENDIX C - Grid and Group Cultural Preference Tool English Version for Students................................................................................149 APPENDIX D - Grid and Group Cultural Preference Tool
Thai Version for Students.....................................................................................159 APPENDIX E - Grid and Group Cultural Preference Tool
English Version for Instructors ............................................................................169 APPENDIX F - Grid and Group Cultural Preference Tool
Thai Version for Instructors .................................................................................180 APPENDIX G - Consent Form to Interviewed Participants English Version ...........191 APPENDIX H - Consent Form to Interviewed Participants Thai Version ................194 APPENDIX I – Sample Questions for Interview ......................................................199
ix

LIST OF TABLES
Table Page
1. Methods used for data collection………………………………………….. 16 2. Acronyms, names and descriptions of CAI related terms………………… 30 3. Methods used for data collection…………………………………………. 55 4. Research Questions, Data Collection Methods, and Data Analyses……… 59 5. Number of Students in the Faculty of Management Sciences
by gender and year entered………………………………………………… 69
6. Number of Students in Survey Stage for Each Major…………………….... 70
7. Number of Instructors in Survey Stage for Each Major……………………. 70
8. Modes of CAI Instructors Liked Most …………………….……………….. 83
9. Modes of CAI Instructors Liked Least …………………….……………….. 84
10. Modes of CAI Students Liked Most …………………….………………….. 84
11. Modes of CAI Students Liked Least …………………….…………………. 85
12. Grid Item Number and Percent of Students in Low Grid Category………… 93
13. Group Item Number and Percent of Students in High Group Category……. 94
14. Grid Item Number and Percent of Instructors in Low Grid Category………. 103
15. Group Item Number and Percent of Instructors in High Group Category….. 104
16. Statistical Comparison of FMS students and FMS instructors……………... 111
17. Modes of CAI Instructors Liked Most by Cultural Contexts……………….. 112
18. Modes of CAI Instructors Liked Least by Cultural Contexts……………….. 113
x
19. Modes of CAI Students Liked Most by Cultural Contexts…………………. 113
20. Modes of CAI Students Liked Least by Cultural Contexts…………………. 114
xi

LIST OF FIGURES
Figure Page
1. Types of social environments and their social contexts………………….. 8
2. The Grid Dimension……………………………………………………… 40
3. The Group Dimension……………………………………………………. 41
4. Types of social environments and their social contexts………………….. 42
5. PSU Structural Administrative System ………………………………….. 65
6. Faculty of Management Sciences layout…………………………………. 67
7. PSU grid and group typology ……………………………………………. 89
8. Clustered Points of FMS students………………………………………… 92
9. FMS students’ grid and group typology………………………………….. 102
10. Clustered Points of FMS instructors……………………………………… 103
11. FMS instructors’ grid and group typology……………………………….. 109
12. FMS grid and group typology for school social environment………….… 110
13. FMS grid and group typology for CAI practices...……………………….. 110
xii

CHAPTER I
INTRODUCTION
Computer assisted instruction (CAI) and E-Learning have become increasingly
popular in all areas of education. Broadly speaking, CAI refers to the use of computers in
the educational process (ComputerUser, 2008; O’Neal, Kauffman & Smith, 1981-1982;
Roberts, 1984; The Resources for Electronics Training, 2008). E-Learning and web-
based learning are closely tied with CAI and involve the delivery of content via all
electronic media, including the Internet, intranets, extranets, satellite broadcast,
audio/video tape, interactive TV, and CD-ROM (Downey, Wentling, Wentling, &
Wadsworth, 2005; Mathew & Doherty-Poirier, 2008; McCarty, 2008; Rosenberg, 2001;
Stone & Koskinen, 2002). Many organizations are moving the delivery of training from
traditional instructor-led classroom training toward technology-based training because of
its cost-effectiveness and flexibility (Ravet & Layte, 1998; Thompson, Koon, Woodwell
& Beauvais, 2002).
CAI is the use of a computer in the actual instructional process. Implementation of
CAI uses any (or all) of the following six modes of CAI: (1) Tutorial, (2) Drill and
Practice, (3) Instructional Game, (4) Modeling, (5) Simulation, and (6) Problem Solving
(Wegener, 2008; Wenglinsky, 2005).
1

CAI is used because of its benefits: (1) Self-paced instruction, which allows
students to practice procedures to achieve defined competencies; (2) Immediate feedback
provided by CAI saves time and prevents learning the "wrong" concepts; (3) Assessment.
With CAI, students can determine their own weaknesses and concentrate efforts on
overcoming those weaknesses before moving on to more advanced concepts; (4) Good
CAI materials reward students instantly for correct responses and behaviors. This
encourages students to move confidently to more complex concepts. CAI can make
learning interesting and exciting; (5) CAI leaves the instructor more time to work with
students on an individual basis; and (6) Simulated experiences (Kulik, 1994; Resources
for Electronics Training, 2008; Venezky & Osin, 1991).
Statement of the Problem
The use of Computer-Assisted Instruction (CAI) or Computer-Based Training
(CBT) is increasing and creating a unique learning culture in higher educational
environments. CAI is one of the most widely used techniques in instruction and not
limited to courses taught in schools and colleges. It has an enormous range of potential
applications, from formal academic courses to on-line manuals and computer-user guides
(Adkins, 2002; Bassi & Buren, 1999; Bowles, 2004; Venezky & Osin, 1991).
Although CAI is becoming increasingly popular, there are questions about its
appropriateness and effectiveness in the teaching and learning process (Azevedo &
Bernard, 1995; Henke, 2001; Liao & Bright, 1991). Many researchers have reported the
positive effects of CAI (Apperson, Laws & Scepansky, 2006; Ash, 2005; Baker, Gearhart
& Herman, 1994; Clark, 1983; Kulik & Kulik, 1991; Kuttan and Peters, 2003; Liao,
2007; Schmidt, Weinstein, Niemiec, and Walberg, 1985; Walberg, 1985; Wang, Hinn &
2

Kanfer, 2001; Wenglinsky, 1998; Willett, Yamashita, and Anderson, 1983). However,
many researchers have also addressed problems associated with CAI (Liegle & Janicki,
2001; National Research Council, 2002; Ross & Schulz, 1999; Schenk & Silvia, 1984;
Siegfried & Fels, 1979). Stansberry (2001) stated:
This question highlights an important dilemma in higher education today: decades
ago universities spent very little to equip classrooms with chalkboards, and the
majority of faculty members used them a great deal. Today, universities are
spending a great deal of their budgets on IT tools, yet the majority of faculty
members are still firmly entrenched in the more traditional and less sophisticated
technology tools in instructional delivery, using only the chalkboard or a similar
substitute rather than new technologies to enhance teaching and learning (p.7).
The reasons for unsuccessful CAI are not only in human limitations, but also in the
media. Sun and Cheng (2007) concluded that the use of rich media in E-Learning should
fit the characteristics of the course unit under consideration. Moreover, many studies
showed that too much unnecessary multimedia elements in CAI may distract learners and
actually decrease learning performance (Bartscha & Cobern, 2003; Mayer, Heiser, &
Lonn, 2001; Rieber, 1996).
The results of many studies demonstrated consistently that technology has little
influence on learning without appropriate instructional strategies (Clark, 1994, 2001,
2005; O’Neil, Chen, Wainess & Shen, 2008). Saettler (1990) listed several reasons of
unsuccessful CAI, such as lack of support from certain sectors, technical problems in
implementation, lack of quality software, and most of all, cost.
3

One way to explain the varying results in CAI success is through Cultural Theory
or Douglas’s (1982) grid and group typology. Mary Douglas (1982) stated that peoples'
cultural preferences affect how they learn as well as what they are interested in learning.
Cultural Theory has become popular because of its utility in explaining a variety of
educational issues (Harris, 2005). Stansberry (2001) successfully used this theory to
study technology use in US-based institutions, and Harris (2005) employed this theory to
explain educational practice and learning preferences in a variety of settings. In this
study, Douglas's typology of grid and group will be used to explain the learning
preferences of students in a Thai university.
Purpose of the Study
This study was conducted at Prince of Songkla University (PSU) in the southern
part of Thailand in the first semester of 2008. The study had three overlapping purposes.
The first purpose was to use Douglas’s typology to explain the educational culture of the
Faculty of Management Sciences (FMS) at PSU. The second was to describe the
students’ and instructor’s preferences about CAI in FMS. The last purpose was to
describe CAI practices in FMS.
Research Questions
This study addressed the following research questions:
1. How does Douglas’s typology explain the educational culture of the FMS at
PSU?
2. What are the students and instructors attitudes toward CAI?
3. What is the interrelationship of CAI practice and educational preferences
among the students and the faculty?
4

4. How useful is Douglas’s typology of grid and group in understanding this
interrelationship?
5. What other realities are revealed in this study?
Theoretical Framework
The theoretical base for this study was drawn from multi-disciplinary exploration
and developed by integrating research from Cultural Theory and information technology.
A primary assumption of Cultural Theory is that life involves people (Chitapong, 2005).
Additionally, “Cultural Theory classifies different types of cultures based upon their
levels of individual autonomy” (Douglas, 1992, p. 187). Learning is an active,
constructive, cumulative, and goal-oriented process (Shuell, 1990). Technology plays a
vital role in everyday life, including learning, because “technology had changed the way
we work, communicate, and learn” (Yeh, 2005, p. 1).
Teachers use technology to help students learn best. However, technology as the
only means does not guarantee that students will learn as teachers hope. There are many
factors contributing to successful teaching using technology in teaching. Bowles (2004),
who presented various valuable findings about E-Learning stated in his book, that “the
effective and efficient implementation of E-Learning relies on complex interactions
between the needs and expectations of learners, facilitators and organizations, all of
which must be understood in order to maximize systems-wide competitive outcomes” (p.
49). Cultural Theory of risk, often referred to simply as Cultural Theory, aims to
understand why different people and social groups fear different risk. The main features
of the theory can be summarized in a few claims:
5

• Culture matters. Preferences and justifications shape the world of social relations.
Everything human beings do or want is culturally biased.
• It is possible to distinguish a limited number of cultural types. That can be done
by constructing a typology of cultures. This typology includes viable
combinations of patterns of social relations and patterns of cultural biases (or
cosmologies). These combinations are often called subcultures, ways of life or
rationalities, ways of organizing, social orders, solidarities, political cultures, or
simply types.
• The typology of viable combinations is universal. It can be applied anywhere
anytime because the two dimensions of sociality grasp the fundamental nature of
the social being (Mamadouh, 1999, pp. 396-397).
In short, Cultural Theory states that peoples’ cultural preferences affect how they
learn as well as what they are interested in learning (Douglas, 1982). The typology of
grid and group was developed by a social anthropologist Mary Douglas (1982). Harris
(2005) explained that Douglas’s typology of grid and group provides a matrix to classify
educational contexts and draw specific observations about individuals’ values, beliefs,
and behaviors. According to the typology, there are “four, and only four, distinctive
school contexts in which one may find him or herself, and only two dimensions, grid and
group, which define each of those four prototypes” (Harris, 2005, p. 34).
Grid is the dimension of individualization of members in the organization, and
group is the dimension of social incorporation of members in the organization (Douglas,
1982). The grid dimension refers to the degree of limitation of choices. Harris (2005)
pointed out that “In Douglas’s frame, grid refers to the degree to which an individual’s
6

choices are constrained within a social system by imposed prescriptions such as role
expectations, rules, and procedures” (p. 34). He further concluded:
In summary, grid refers to the degree to which individuals are constrained by role
differentiation, rules, and expectations. On the grid continuum, high-grid
educational contexts are those in which role and rule dominate individual life
choices, and low-grid environments are characterized by individual autonomy and
freedom in role choices. (Harris, 2005, p. 36)
Lingenfelter (1996) stated that group refers to “the degree to which people value
collective relationships with one another and define those relationships in terms of
insider/outsider distinctions” (p. 24). Harris (2005) added that group represents the
“extent to which they are committed to the larger social unit” (p. 36). Group can be
measured by the requirements on the individual to adapt and to comply with group
expectations (Spickard, 1989).
In strong-group social environments, specific membership criteria exist, and
explicit pressures influence group relationships. The survival of the group is more
important than the survival of individual members within it…Strong-group
environments are typically replete with prominent signs that display member
allegiance…Strong-group environments value the continued existence of the
school, and weak-group contexts value individual interest over the priority of
collective arrangements (Harris, 2005, pp. 36-38).
In simultaneous consideration of high or low strengths in both grid and group
dimensions, Douglas’s four distinct possibilities of social contexts emerge (Chitapong,
2005). The typology is a combination of a grid dimension and a group dimension. Figure
7

1 categorizes the four social contexts with their respective grid and group environments,
and each social context has its distinctive characteristics:
1. Bureaucratic environments (strong-grid and weak-group)
2. Individualist environments (weak-grid and weak-group)
3. Corporate environments (strong-grid and strong-group)
4. Collectivist environments (weak-grid and strong-group)
Figure 1. Types of social environments and their social contexts. From “Understanding the Culture of Schools,” by E. L. Harris, 2005, Key Strategies to Improve Schools, Lanham, Maryland: Rowman & Littlefield Education, p.41. Used with permission of the author.
Weak-Group Strong-Group
Weak-Grid
Strong-Grid
Bureaucratic Social context: Authoritarianism
Corporate Social context: Hierarchy
Individualist Social context: Individualism
Collectivist Social context: Egalitarianism
8

Ellis (2006) summarized that “these four systems are important to educators in
understanding the structure of their classroom and the roles and relationships of the
students (the culture)” (p. 36). This understanding can be helpful in resolving conflicts
and creating a conductive classroom learning environment. Douglas (1982) identified the
quadrant that best describes social context. Chitapong (2005) also noted that “in
analyzing an individual’s preferences, grid and group typology does not assume the
preferences, or choice, are predetermined. The method takes into consideration the
cumulative effect of individual choices on the social situation itself” (p. 14). Douglas
explained that “both can interact, the individual and the environment, and either can
move because the environment is defined to consist of all the other interacting individuals
and their choices” (p. 198). A more concise and complete conclusion about four social
contexts in four quadrants is listed below:
Bureaucratic environments
1. In the extreme, the individual has no scope for personal transactions.
2. There is little individual autonomy.
3. Roles and rules are defined without ambiguity.
4. Group goals and survival are not important.
5. The environment is hierarchical with predominately set criteria.
Individualist environments
1. The social experience of the individual is not constrained by group rules or
traditions.
2. Role status and rewards are competitive and based on merit.
3. There is little distinction between individual role statuses.
9

4. Long-term group survival is not emphasized.
Corporate environments
1. The group maintains boundaries against outsiders that limits social
relationships and experiences of its members.
2. The individual’s identification is derived from group membership.
3. Individual behavior is subject to controls exercised in the name of the
group.
4. A hierarchy pyramid of role levels exists with greater individual power at
the top of the pyramid.
5. Group survival and perpetuation of tradition are of utmost importance.
Collectivist environments
1. The individual’s identification is granted through group membership.
2. Individual behavior is subject to controls exercised in the name of the
group.
3. Authoritarian leadership and hierarchy are rejected.
4. The perpetuation of group goals and group survival is of utmost importance.
Procedures/Methods
This study was triangulated by multiple methods and data sources “to overcome
the intrinsic bias that comes from single-methods, single-observer, and single-theory
studies” (Denzin, 1989, p. 307). Moreover, Patton (2002) stated, “Qualitative findings
may be presented alone or in combination with quantitative data. Research and evaluation
studies employing multiple methods, including combinations of qualitative and
quantitative data are common” (p. 5).
10

In this study, a questionnaire, interviews, observation, and archives collection
allowed the researcher to develop a “picture” of participants’ experiences and
perceptions. These experiences and perceptions were then analyzed to form a description
of a specific situational phenomenon, or a case study (Stansberry, 2001).
Case studies are one of the most popular methods of conducting social science
research (Burton, 2000). Runyon (1982) stated that case study is the presentation and
interpretation of detailed information about a single subject, and event, culture or
individual. Yin (1994) presented five reasons for the case study to be a particularly good
means of educational research. Those five reasons can be called “DEEPS” for easy
remembrance. The case study research has the ability to describe, explore, exemplify,
provide a meta-evaluation, and surmise: (1) describe the real-life context in which an
intervention occurs; (2) explore situations in which an intervention exists but has no
clear, set outcomes; (3) exemplify specific topics in a descriptive mode; (4) provide a
meta-evaluation—a study of an evaluation study; and (5) surmise causality among
complex, real-life interventions.
Protection of Human Subjects
Besides ordinary programs which used Thai in teaching, FMS provided a special
program for the bachelor degree. It was bachelor of business administration program in
management (English). It used English in teaching, referred to as BBA. The researcher
invited students to answer the online questionnaire for students. The researcher sent e-
mail to e-mail loop of FMS instructors to ask for cooperation in answering online
questionnaire for instructor. From the questionnaire, any student or instructor who agreed
to be interviewed informed the researcher of his/her personal e-mail address or telephone
11

number so the researcher could contact him/her for the interview step. The researcher
conducted individual interviews according to their available times.
Instrumentation
The primary instrument used in the study was the researcher. In this study, the
researcher used the “Grid and Group Cultural Preference Tool” for students and the “Grid
and Group Cultural Preference Tool” for instructors. They were online questionnaires
adapted from the survey instrument constructed by Harris (2005). The English version of
the instrument for students and instructors can be seen in Appendix C and Appendix E
respectively. It has been used several times in schools located in the United States
(Harris, 2005) and also in Thai settings (Chitapong, 2005). The researcher received
permission from Harris (2005) to use this instrument in the study conducted at FMS in
Thailand. The researcher translated the survey from English to Thai, and then Mrs.
Sinlapamethakul translated it back to English to assure that the translation corresponds to
the original version. The Thai version instrument for students and instructors can be seen
in Appendix D and Appendix F respectively.
Data sources
A total of 133 students answered the online questionnaire for students and 39
instructors answered the online questionnaire for instructors. After that, purposive
sampling technique was utilized to select 14 students and 9 instructors from the initial
group of participants. Purposive sampling requires a procedure that is “governed by
emerging insights about what is relevant to the study based on the focus determined by
the problem and purposively seeks both the typical and divergent data to maximize the
12

range of information obtained about the context” (Erlandson, Harris, Skipper & Allen,
1993, p. 148). An in-depth interview method was used at this stage.
Observations of the general environment were another data source. They included
two classroom observations. The documents or artifacts related to CAI such as teaching
materials, brochures, news of the FMS, field notes also served as valuable data sources.
Data Collection
Creswell (1994) explained that the data collection procedures in a qualitative
design are composed of “ (a) setting the boundaries for the study, (b) collecting
information through observations, interviews, documents, and visual materials, and (c)
establishing the protocol for recording information” (p. 148). The target populations were
undergraduate students and faculties in the faculty of Management Sciences (FMS),
Prince of Songkla University (PSU). They were asked to be volunteers in this study. The
exploratory research was conducted in the third week of the first semester of the year
2008 (from June 16, 2008 to July 11, 2008).
The researcher asked for permission from the Dean of FMS to do the study.
Students who volunteer to be a participant went to the website
http://frontpage.okstate.edu/coe/aree1 to answer the “Grid and Group Cultural Preference
Tool” questionnaire which was already uploaded to the website. The address for the
instructors’ questionnaire was available on another website
(http://frontpage.okstate.edu/coe/aree2). Even though the main part of both
questionnaires was the same, the “Grid and Group Cultural Preference Tool”, the needed
demography for students and instructors were different. Therefore, the researcher put the
questionnaires in different websites.
13

The researcher used “Grid and Group Cultural Preference Tool” as an instrument
to classify participants in the quadrants. The survey results allowed the researcher to
purposively select participants from each quadrant for a qualitative interview.
The selected participants for interview were 14 students and 9 instructors of FMS.
A Thai consent form giving permission to be interviewed was given to each participant.
All participants were encouraged to give honest information to the interview questions.
Babbie (2008) stated that “a qualitative interview is essentially a conversation in which
the interviewer establishes a general direction for the conversation and pursues specific
topics raised by the respondent.” (p. 336). The interview process provided the
interviewees with the opportunity to discuss their experiences, attitudes and preferences
about CAI, pattern they like most as instructors and students, and other general
information about CAI. The interview questions can be seen in Appendix I.
The Survey Instrument
The questionnaire survey study occurred in the third through the sixth week of the
first semester of the year 2008 (from June 16, 2008 through July 11, 2008). This time
period was chosen because it was an appropriate time for the students. They could settle
all their subjects at least in the third week, and the last day of the second week was the
last day that students can add up or withdraw subject with money refund. The eighth
week would be midterm exam and final exam was on the sixteenth week.
Interviews
After the survey data of phase 1 were gathered and plotted on the grid/group
quadrant, twelve students (two from each quadrant of social context) were contacted to
set up a qualitative interview schedule. All of them were willing to provide the needed
14

valuable information. The interview took place on site; all the interviewees had
completed the survey. Each participant was previously given a Thai consent form. All
interviewed participants were encouraged to give honest information to the interview
questions. The interview process provided the researcher the opportunity to discuss the
learning preferences of students and the teaching preferences of instructors. Interview
questions can be seen in Appendix I.
Document analysis
At the beginning of the study, the most public and easily accessed documents were
gathered. The Faculty of Management Sciences website (http://www.mgt.psu.ac.th) was
accessed and analyzed. Brochures in the office of the faculty secretary, the Department of
Business Administration, and the Department of Public Administration were collected
and analyzed. During each of the interviews, participants were asked if they would
provide documents such as course descriptions, press releases, and descriptions of
information technology tools, that would contribute to the study.
Observations
Two crucial strategies used in this study were observations of students’
interactions, instructors’ interactions and collection of field notes. Weimer (1979) noted
that observation is “a skill over and above passive reception of the raw data of sensory
experience” (p. 21). Patton (2002) stated that the purpose of observation analysis is to
take the reader into the setting that was observed, which means that “the reader can
understand what occurred and how it occurred” (p. 23). Another important research tool
used in participation observation was “a notebook into which you enter your
15

observations” (Dane, 1990, p. 161), the field journal. Field notes in the field journal were
taken during observations and used for analysis along with interviews and documents.
A summary of methods used is in the table below.
Table 1 Methods used for data collection Method Overall purpose Advantages Challenges Online survey
To obtain measurable data within time constraints.
Easily obtained large amounts of data. Very inexpensive Less time consuming and easy to analyze
Systematic (non-sampling error), which is error resulting from some imperfect aspect of the research design that causes response error or from a mistake in the execution of the research; error that comes from such sources as sample bias, mistakes in recording responses, and non-responses from persons not contacted or refusing to participate.
Interview To gather qualitative information that cannot be directly observed.
Allowed researchers to gather additional information that could not be captured in the survey. Allows interaction amongst the participants.
Interviewer error, which is administrative error caused by failure of an interviewer to perform tasks correctly.
Document analysis
To constitute part of the repertoire of field research
Documents prove valuable not only because of what can be learned directly from them but also as stimulus for paths of inquiry that can be pursued only through direct observation and interviewing.
Learning to use, study, and understand documents and files is part of the repertoire of skills needed for qualitative inquiry.
Observation To take the reader into the setting that was observed
Direct data collection. It directly records what people do, as distinct from what they say they do.
Behavior, not intentions. Its focus on overt behavior describes what happens, but not why it happens. It does not deal with the intentions that motivated the behavior.
(Table adapted from Denscombe, 2007, Kelsey, 2005, Patton, 2002, and Zikmund, 2000)
Significance of the Study
Information obtained from this study will provide better understanding about
16

interrelationship of students and instructors’ preferences in CAI. The knowledge gained
will have significance for the following:
Practice
This study may benefit teachers and students involved in CAI in Thailand, because
it will give insight into how the classroom environment affects the education practices of
students by:
1. Reporting and examining the learning preferences of students about CAI
2. Identifying appropriate patterns of CAI to be developed
3. Determining the extent to which student perceive CAI in their specific cultural
context using Douglas’s grid and group typology (1982) model.
Research
By asking about students’ and instructors’ preferences in CAI, this study used a
case study method, to examine students preferences in CAI. This study contributes to the
current body of literature, because it provides another example of how grid and group
typology classifies students’ preferences in CAI.
Theory
The study tested the usefulness of Douglas’s framework in classroom settings in a
Thai institution. The explanation of Douglas’s framework as well as the way it was
utilized in this study can provide a model for other studies using this theory.
Limitations of the Study
The participants of the study were students and faculties from the faculty of
Management Sciences, Prince of Songkla University, Hatyai campus in the first semester
of 2008. The students’ population may not have been representative of the general
17

students of Thailand or Prince of Songkla University due to purposive sampling
strategies. Therefore, while generalizations cannot be inferred, transferability of findings
may occur depending on the likeness of receiving contexts.
Definitions of Terms
1. Cultural pluralism: A state of equal co-existence and mutually supportive
relationship within the framework of one set (i.e., nation, school system, city, etc.) of
people of diverse cultures with significantly different patterns of belief, behavior, color,
and in many cases, with different languages (Hazard & Stent, 1973).
Definitions for the following terms are taken from Lincoln and Guba (1985).
2. Naturalistic inquiry: A paradigm for inquiry based upon the assumption that
multiple realities exist, that inquiry will diverge rather than converge as more and more is
known, and that all parts of reality are integrated.
3. Natural setting: The setting in which the phenomena being observed occurs
without artificial inducement or adjustment.
4. Trustworthiness: The establishment that the data and interpretations produced by
the study are dependable and reliable. In a naturalistic inquiry, trustworthiness is reflected
by the presence of four major components: credibility (truth value); transferability
(applicability); dependability (consistency); and confirmability (neutrality).
5. Credibility: The assurance that the findings and interpretations produced by the
study will be considered worthy of belief by the human sources from which they have
come.
6. Transferability: A quality which depends on the degree of similarity between
sending and receiving contexts. The phenomena studied are intimately tied to the time
18

and context in which they are found; thus, applicability to other times and contexts may
not be possible. However, some transferability may occur when essential similarities
exist between sending and receiving contexts.
7. Dependability: The assurance of consistency through the seeking of a means for
taking into account both factors of instability and factors of phenomenal or design
induced change. Dependability is not based on invariance but "trackable variance" which
can be ascribed to sources such as error, reality shifts, and increased instrumental
proficiency.
8. Confirmability: The establishments that the data produced through the research
are reliable and factual as determined through examination by an inquiry auditor.
9. Thick Description: The communication of sufficient information about the
context in which an inquiry is carried out so that anyone else interested in transferability
has a base of information appropriate to the judgment.
10. Triangulation: A variety of data sources, different perspectives or theories, and
different methods pitted against one another in order to cross-check data and
interpretation.
Summary and Organization of the Study
This dissertation is organized in six chapters. Chapter I offers an overview of the
study. Chapter II reviews the literature. Chapter III provides an explanation of the
qualitative research methodology. Chapter IV presents the data collected from the
selected setting, the Faculty of Management Sciences, Prince of Songkla University, in
the southern part of Thailand. Chapter V provides an analysis and interpretation of the
19

data. Chapter VI presents recommendations for future research, and includes a summary,
implications, conclusions, and discussion.
20

CHAPTER II
LITERATURE REVIEW
The purpose of this qualitative study was to explain the learning preferences of
students and computer aided instruction (CAI) using Douglas's typology of grid and
group. Therefore, the review of literature addresses the conceptual areas of CAI and
instruction, successful and unsuccessful usage of CAI, and Douglas’ (1982) grid and
group typology as the conceptual/theoretical framework for this study.
CAI and Instruction
Definitions of computer assisted instruction
The ComputerUser (2008) definition of computer aided instruction (CAI) is “using
computers as aids for instructional purposes”. The Access Center (2008) explains:
Computer-assisted instruction (CAI) refers to instruction or remediation presented
on a computer. Many educational computer programs are available online and from
computer stores and textbook companies. They enhance teacher instruction in
several ways. (p. 3)
The Resources for Electronics Training (2008) emphasizes the same meaning of
CAI, referring to any use of computers that interacts with students in any way in the
educational process.
21

CAI was initially conceived as a direct descendent of programmed instruction “and
many early uses of computers for teaching purposes constituted adaptations of the
teaching machine” (Knapper, 1980, p. 27). In the beginning, most definitions of CAI
referred to pertinent hardware at that time. For example, O’Neal, Kauffman, and Smith
(1981-1982) characterized CAI as “a process in which the learner interacts directly with
lessons displayed on a cathode-ray tube (CRT) or…printed by a terminal that provides
hard copy” (p. 160).
In the mid-1950s and early 1960s a group effort of educators at Stanford University
in California and International Business Machines Corporation (IBM) introduced CAI
into selected elementary schools (Arnold, 2007). CAI was first developed on a large
mainframe computer and began to flourish (Johnston, 1987). The early CAI systems were
limited by the cost and difficulty of obtaining, maintaining, and using the computers that
were available at that time (Arnold, 2007):
Programmed Logic for Automatic Teaching Operations (PLATO) system, another
early CAI system initiated at the University of Illinois in the early 1960s and
developed by Control Data Corporation, was used for higher learning. It consisted
of a mainframe computer that supported up to 1000 terminals for use by individual
students. By 1985 over 100 PLATO systems were operating in the United States.
From 1978 to 1985 users logged 40 million hours on PLATO systems. PLATO also
introduced a communication system between students that was a forerunner of
modern electronic mail (messages electronically passed from computer to
computer). The Time-shared Interactive Computer-Controlled Information
Television (TICCIT) system was a CAI project developed by Mitre Corporation
22

and Brigham Young University in Utah. Based on personal computer and television
technology, TICCIT was used in the early 1970s to teach freshman-level
mathematics and English courses (p. 4).
Besides TICCIT which was a CAI system developed at the MITRE Corporation,
the University of Texas and Brigham Young University, there was TOAM, a multi-
terminal CAI system developed at the Centre for Educational Technology in Tel Aviv.
Moreover, there was TUTOR, a CAI authoring language developed in 1967 at the
University of Illinois for PLATO III (Venezky & Osin, 1991).
With the arrival of cheaper and more powerful personal computers in the 1980s,
CAI use increased dramatically. “In 1980 only 5 percent of elementary schools and 20
percent of secondary schools in the United States had computers for assisting instruction.
Three years later, both numbers had roughly quadrupled, and by the end of the decade
nearly all schools in the United States, and in most industrialized countries, were
equipped with teaching computers” (Arnold, 2007, p. 4) . In 1987, there were more than
8,000 instructional software programs listed in TESS: The Educational Software Selector
published by the Educational Products Information Exchange (EPIE) Institute (Johnston,
1987). Most of them were still the drill-and practice variety, but with “considerable
variation and ingenuity” (Rosenberg, 1997, p. 176). Other kinds of CAI instructional
mode were created later. “True tutorial software – a more complex instructional and
programming task, requiring fairy sophisticated computer systems – is only beginning to
appear in the mid 1980s” (Johnston, 1987, p. 64).
23
Varieties of computer assisted instruction
There were many instructional modes of CAI. The “Apple Computers of
Tomorrow (ACOT) was one of the most comprehensive attempts to move educational
computing from drill- and practice activities to more complex skills, known as higher
order or critical-thinking skills” (Wenglinsky, 2005, p. 34). ACOT was initiated in
classrooms on five school sites in 1985 (Apple Education, 2008; Baker, Gearhart &
Herman, 1994) and introduced a very different kind of intervention into the classroom as
Wenglinsky (2005) stated:
CAI was, for the most part, a set of drill-and-practice activities that students
undertook individually, without much interaction with teachers or other students.
When students were not on computers, the balance of time was typically spent on
“direct instruction,” meaning lectures and some discussion between the teacher and
the class as a whole. ACOT sought to change the role of computers in the
classroom and, in so doing, also change the interactions between students and
teachers and among students. Rather than involving drill and practice, ACOT
focused on student-initiated work, long-term projects, access to multiple learning
resources, and small group work (p. 37).
Truett and Gillespie (1984) noted that “Lesson formats in CAI can be tutorial, in
which basic information is imparted; standard drill-and-practice; problem solving;
simulation; games; or a combination of two or more of this format” (p. 11).
There are many terms with similar meaning. Wegner (2008) explained clearly that
CAI is a component in a computer based training (CBT). CBT is used if the writer wants
to emphasize training. Computer based education (CBE) is used to emphasize education
24

while computer based learning (CBL) is used to highlight learning, and computer based
instruction (CBI) is used to stress instruction. The term Technology Based Training
(TBL) is used to deflect attention away from the computer, to emphasize training, and to
recognize that in reality any form of CBT uses several different technologies. All these
terms have the same meaning with CBT which contains three components: (1) Computer
Assisted Instruction (CAI), (2) Computer Managed Instruction (CMI), and (3) Computer
Supported Learning Resources (CSLR).
CAI is the use of a computer in the actual instructional process. Implementation of
CAI includes any (or all) of the following six modes of CAI: (1) Tutorial, (2) Drill and
Practice, (3) Instructional Game, (4) Modeling, (5) Simulation, and (6) Problem Solving
(Wegner, 2008).
Rosenberg (1997) explained the basic mode of drill and practice:
The computer asks a question, receives the answer, and provides an appropriate
response. If the student’s answer is correct, positive feedback is provided, usually
in the form of an affirming comment to the student. If the answer is incorrect but
belongs in a class of expected answers, a variety of responses may be selected.
Finally, if the answer is incorrect and the system cannot deal with it, it must repeat
the original question and supply the answer, or go on to a new but similar question.
In the second case, the question may be repeated with an encouraging remark, or
new question is posed based on the student’s perceived difficulty. (pp.175-176)
Alessi and Trollip (1991) suggested that simulations should be used instead of
actual experience when the latter is “unsafe, costly, very complex, or logistically
25

difficult” (p. 161). Moreover, simulations should be used instead of other modes of CAI
when there is a need to increase motivation, transfer of learning, or efficiency.
CMI is the use of a computer to manage instruction and involves each of the
following three modes of CMI: (1) Testing, (2) Prescription Generation, and (3) Record
keeping (Wegner, 2008). Truett and Gillespie (1984) explained that “CMI can be used to
diagnose, prescribe, present, evaluate, inform, and keep track of student progress just as
the individual teacher would”, and “CAI has generally come to loosely include these CMI
applications as well” (p. 12).
CSLR is the use of a computer to provide access to information by a learner in the
learning process. The four modes of CSLR are: (1) Data bases, (2) Telecommunications,
(3) Expert Systems, and (4) Hypermedia (Wegner, 2008).
With varieties of CAI, Rosenberg (1997) summarized that “drill and practice are
helpful when simple facts are to be learned in a structured context” (p. 176). Rosenberg
(1997) emphasized that “the major contribution of the computer to education is to
facilitate traditional skills practice and rote drill in a flashier style than that provided by
traditional textbooks” (p. 177).
A complete CAI system
There must be many functional components to compose together to create a
complete CAI system, which is reflected in the following statement by Venezky and Osin
(1991):
The core of CAI is an instructional system, something that interacts with a learner
and that generally, but not always, follows a script. CAI also involves a verbal
exchange, with movement, background, and even, occasionally, music. And like
26

theater, CAI may have a support system, authoring facility, library, and
administrative facilities. But surprisingly enough, the student is not the audience, he
is the first actor. Furthermore we have a problem: the first actor does not master his
lines, so the company must improvise to keep the performance going. (pp. 119-120)
For a teacher, using CAI-Computer assisted instruction for students’ benefit is
good. However, without a good design, CAI will not help students achieve their learning
goal (O’ Neil, Chen, Wainess & Shen, 2008; Stone & Koskinen, 2002).
Human-computer interaction (HCI) is a discipline concerned with the design,
evaluation and implementation of interactive computing systems for human use and with
the study of major phenomena surrounding them. It arose as a field from intertwined
roots in computer graphics, operating systems, human factors, ergonomics, industrial
engineering, cognitive psychology, and the systems part of computer science (ACM
SIGCHI, 2008).
A complete CAI system includes four main subsystems: (1) the instructional
facility (2) the administration facility (3) the library includes all the computerized
instructional materials in any possible form and (4) the authoring facility serves primarily
to create, update, and improve the library (Venezky and Osin , 1991).
Why is CAI used?
CAI is used because of its benefits. There are many benefits using CAI: (1) Self-
paced instruction. CAI allows students to practice procedures as long as required to
achieve defined competencies, (2) Immediate feedback provided by CAI saves time and
prevents learning the "wrong" concepts, (3) Assessment. With CAI, students can
determine their own weaknesses and concentrate efforts on overcoming those weaknesses
27

before moving on more advanced concepts, (4) Good CAI materials reward students
instantly for correct responses and behaviors. This encourages students to confidently
move to more complex concepts. CAI can make learning interesting and exciting, (5)
CAI leaves the instructor more time to work with students on an individual basis and (6)
Simulated experiences (Kulik, 1994; Resources for Electronics Training, 2008; Venezky
& Osin, 1991).
Another considerable benefit of using CAI is about cost, because “with more
modest goals, CAI can be a cost-effective approach to instruction in a wide variety of
learning contexts” (Venezky & Osin, 1991, p. 49). Access Center (2008) added another
benefit of using CAI, “computer-assisted instruction improves instruction for students
with disabilities because students receive immediate feedback and do not continue to
practice the wrong skills.”
The infinite progress of information and communication technology is a factor that
facilitates using CAI, as Arnold (2007) acknowledged:
A recent development with far ranging implications for CAI is the vast expansion
of the Internet, a consortium of interlinked computers. By connecting millions of
computers worldwide, these networks enable students to access huge stores of
information, which greatly enhances their research capabilities. (p.4)
Ambiguous terms
According to Arnold (2007), it is implied that CAI on the Internet, or CAI on web,
or Web-based instruction (WBI), or Web-based training (WBT) still is CAI. Thai
Educational Technology (2008) also informed the same content that there are some CAI
developments that transform CAI into the format that can be published through the
28

Internet, which is called Web-based instruction (WBI) or Web-based training (WBT).
However, ThaiWBI (2008) argued that WBI is not CAI, but it is an instructional
management tool for E-Learning which is a part of E-Education, which is a subsystem of
E-Commerce. Mathew and Doherty-Poirier (2008) supported the idea that WBI evolved
from CAI:
Web-based instruction has evolved from any number of computer-based
instructional methods, often referred to as Computer-Assisted Instruction (CAI),
Computer-aided Instruction (CaI), Computer-Managed Instruction (CMI), Internet-
Based Instruction (IBI), or Web-Based Instruction (WBI), but collectively called
Computer-Based Education (CBE).
Dabbagh and Bannan-Ritland (2005) pointed out that WBI comes in many forms
and incorporates various types of delivery technologies, “ranging from the posting of
instructional resources for students, such as syllabi and instructor course notes, to the use
of text-based communication tools to promote collaborative discussion and shared
activities and documents among learners and instructors” (p. 21).
Stone and Koskinen (2002) explained the relevant term, web-based training:
Web-based training (WBT) refers to on-line learning delivered over the World
Wide Web (WWW) via the public Internet or a private, corporate intranet.
Although on-line learning is not actually new – it has been around since the 1960s –
it is the Internet’s user-friendly interface, coupled with improved technology that
has brought the Web into the mainstream of current culture.
WBT is one specific delivery method within the larger category of computer-based
training (CBT). Like WBT, the term CBT has evolved along with technological
29

advancements. Originally, CBT encompassed any training delivered via a
computer, but that did not mean much, and CBT did not initially develop into the
broad category it was intended to become because there were few practical ways to
deliver CBT. In practice, corporations relied almost solely on CD-ROM because of
its ability to store large, media-rich files, and the term CBT became almost
synonymous with training delivered via CD-ROM.
Therefore, you will hear industry professionals refer to technology-delivered
training as “E-Learning.” WBT is one of the most popular forms of E-Learning.
WBT includes both synchronous and asynchronous instruction. Synchronous WBT
includes real-time interactions between instructors and students in virtual
classrooms, chat rooms, or on-line videoconferences. Asynchronous WBT includes
the use of on-line lessons that students can use anytime and anywhere. The most
effective WBT combines both synchronous and asynchronous elements.
As with other forms of E-Learning, the constraints of WBT are diminishing and
options are increasing as the Web becomes increasingly easy to use and technology
becomes better and less expensive. As the ease of execution increases, corporations
are discovering the benefits of delivering training via the Web (pp. XIII-XIV).
The summary of acronyms, names and descriptions of CAI related terms is in the
table below.
Table 2 Acronyms, names and descriptions of CAI related terms Acronym Name Description PI Programmed instruction PI provides computer-based programs consisting of
text, graphics, and perhaps multimedia enhancements that are stored and connected to one another electronically. PI may be computer based but it is also found in printed material and interactive videos
30

CAI Computer-aided instruction Computer-assisted instruction
CAI refers to any use of computers that interacts with students in any way in the educational process.CAI is the term used for employee training in government sector.
MCAI MultimediaCAI CAI that use media that utilizes a combination of different content forms. In general, multimedia includes a combination of text, audio, still images, animation, video, and interactivity content forms.
CAL Computer-assisted learning CAL covers a range of computer-based packages, which aim to provide interactive instruction usually in a specific subject area, and many predate the Internet.
CBT Computer-based training Learning that uses computers to deliver training. CBT is the term used for training in private industry.
CMI Computer-managed instruction The computer is used for administrative functions such as registration, record keeping, scoring, and grading.
ICAI Intelligent computer-assisted instruction ICAI system applies principles of artificial intelligence in the representation of domain knowledge, natural language dialogues, and methods of inferences.
ITS Intelligent tutoring systems ITS make use of artificial intelligence to provide tutoring that is more advance than ICAI type tutoring.
IBI Internet-Based Instruction On-line learning delivered over WWW via the Internet or Intranet.
WBI Web-Based Instruction On-line learning delivered over WWW via the Internet or Intranet.
WBT Web-Based Training On-line learning delivered over WWW via the Internet or Intranet.
CBE Computer-Based Education On-line learning delivered over WWW via the Internet or Intranet.
(Table adapted from Blanchard & Thacker, 1999, Educational technology, 2008, Marquardt & Kearsley, 1999, The Resources for Electronics Training, 2008, Roberts, 1984 and Stone & Koskinen, 2002)
Successful and Unsuccessful Usage of CAI
Successful CAI
Many studies revealed the positive impacts of using CAI. Kuttan and Peters (2003)
stated that “where the research exists, it shows that computers have positive effects for
disadvantaged students” (p.78). An Educational Testing Service study also discovered
that those students working on problem solving rather than drill and practice registered
the greatest gains (Wenglinsky, 1998). Schmidt, Weinstein, Niemiec, and Walberg
31

(1985) found that students learned more in classes in which they receive CAI; the same
result was found in Willett, Yamashita, and Anderson (1983). Kulik and Kulik (1991)
found that students learned their lessons in less time with CAI; moreover, students
developed more positive attitudes toward computers and liked their class more when they
receive computer help in them.
The Apple Classrooms of Tomorrow (ACOT) project was originally conceived as a
program to study what happens when “tomorrow’s” resources are routinely available in
classroom (Baker, Gearhart & Herman, 1994). From 1987 through 1990, University of
California, Los Angeles (UCLA) conducted a series of evaluation studies focused on five
original ACOT sites. Baker, Gearhart and Herman (1994) summarized that the ACOT
program appeared as successful in promoting commonly measured student outcomes as
more typical instructional programs provided by the comparison sites. ACOT students at
least maintained their performance levels on standard measures of educational
achievement in basic skills and sustained optimistic attitudes.
Many studies reported the success of CAI, but in a lesser degree. They showed
consistency that media have little influence on learning without appropriate instructional
strategies (Clark, 1994, 2001, 2005; O’ Neil, Chen, Wainess & Shen, 2008).
Unsuccessful CAI
Many researchers have addressed problems associated with CAI. The survey
concluded that CAI had been unsuccessful in improving economic education. CAI
appeared to generate no more or less cognitive achievement, but probably cost more than
conventional pedagogical methods, but CMI was moderately successful (Siegfried and
32

Fels, 1979). Schenk and Silvia (1984) stated that Siegfried and Fels distinguished two
categories of computer instruction:
Computer assisted instruction (CAI)-"games, simulation models, and demonstration
routines."
Computer managed instruction (CMI)-material which is "mainly review routines
(short quizzes) with instant feedback to students and individualized instruction to
students wanting to know the most efficient study strategy to pursue."(p. 239)
Schenk and Silvia (1984) gave the reasons about ineffective result in using CAI:
One reason for the scarcity of positive results in economics may be that the
computer materials, not the method, are poorly developed. Evaluating a set of
instructional materials that utilizes a computer involves not just an evaluation of the
computer as an instructional tool, but also specific materials and their method of
use. There is always a possibility that the material itself may be of poor quality. A
second possible explanation of the scarcity of positive results is that even when the
computer programs are of good quality, they have been improperly used. (p.240)
Improperly used CAI could be counted as unsuccessful. CAI that was not used was
also unsuccessful. Stansberry (2001) stated:
This question highlights an important dilemma in higher education today: decades
ago universities spent very little to equip classrooms with chalkboards, and the
majority of faculty members used them a great deal. Today, universities are
spending a great deal of their budgets on IT tools, yet the majority of faculty
members are still firmly entrenched in the more traditional and less sophisticated
33

technology tools in instructional delivery, using only the chalkboard or a similar
substitute rather than new technologies to enhance teaching and learning (p.7).
How to develop a successful CAI
The Resources for Electronics Training (2008) define CAI as any use of computers
that interacts with students in any way in the educational process. The main users are
students, so a crucial strategy to make CAI successful is developing the CAI that students
prefer to use. It can be summarized in short that “CAI in need is the CAI indeed”. Hence,
the first step to develop a successful CAI is, knowing students’ preferences in CAI.
Moreover, the results of many researches showed consistency that media have little
influence on learning without appropriate instructional strategies (Clark, 1994, 2001,
2005; O’ Neil, Chen, Wainess & Shen, 2008). So, the second step to develop a successful
CAI is using appropriate instructional strategies in CAI software.
Alessi and Trollip (1991) suggested appropriate tricks and tips for producing each
mode of CAI. They commented that tutorial CAI should allow the student more than one
try to answer a question. They recommended that drill CAI should allow temporary
termination at any time based on a student request, and allow restarting. For simulation
CAI, do not use overly detailed graphics. Provide just as much detail as is necessary to
convey the necessary information. For an instructional game, the producer should make
the game the motivator, not the reward. Moreover, the use of violence should be
minimized. Test CAI should inform the student of time constraints before the test, let the
student know how much time remains during the test, and give detailed feedback after the
test.
34

Rosenberg (1997) gave an acute comment that “technology will not be effective
unless the people issues are taken into account in a meaningful way” (p. 189). The design
of CAI is another important thing. Stone and Koskinen (2002) stated that CAI products
are commonly converted for use in different countries. In designing CAI, cultural
differences must be considered. Stone and Koskinen (2002) noted “Colors, slang, humor,
gestures, units of measure, law, taboos, and etiquette and among the elements that must
be evaluated and, if necessary, modified” (p. 180). They further explained the concept
about colors and language:
In China, for example, red is the most popular and auspicious color. Some believe
that it helps to keep evil away. By contrast, those from a European cultural
background may associate red with evil (e.g., a red devil). For the Chinese, yellow
connotes royalty, prosperity, and luck. However, for English speakers, yellow
denotes cowardice and weakness.
When an American beer company translated into Spanish its advertising slogan to
“Get Loose,” the advertising agency failed to realize that the translation was a
Mexican colloquialism that means to have diarrhea.(p.180)
Obviously, cultural differences must be considered circumspectly in designing CAI.
Theoretical Framework
A framework that used to explain interrelationship of student learning preferences
and CAI instruction is a cultural theory of organization or Douglas’s Typology of Grid
and Group. One important thing that we should know is culture, and then we can
understand why cultural theory can help in explaining students’ preferences in CAI.
35

What is Culture?
There are hundreds of different ways to define culture (Adler, 1986; Weaver,
2000). Culture is “a system of interrelated parts and it is shared with others. People in the
same society have roughly the same values, beliefs, behaviors, perceptions of reality and
ways of communicating. Culture causes this to happen” (Weaver, 2000, p. 72). Culture is
“that complex whole which includes knowledge, belief, art, morals, law, custom, and any
other capabilities and habits acquired by man as a member of society” (Tyler, 1920, p.1).
Adler and Jelinek (1986) stated that “culture, whether organizational or national, is
frequently defined as a set of taken-for-granted assumptions, expectations, or rules for
being in the world” (p. 126). Kroeber and Kluckhohn (1952) gave the most commonly
used definition of culture:
Culture consists of patterns, explicit and implicit of and for behavior acquired and
transmitted by symbols, constituting the distinctive achievement of human groups,
including their embodiment in artifacts; the essential core of culture consists of
traditional (i.e. historically derived and selected) ideas and especially their attached
values; culture systems may, on the one hand, be considered as products of action,
on the other as conditioning elements of further action (p. 181).
We can explain why people behave as they do if we have a more comprehensive
understanding of their culture. The influence of culture can be looked at as a circle.
Culture affects values, which affect attitudes, which affect behavior, which in turn affects
the culture itself (Rhinesmith, 1970). However, although the influence of the collective
culture within a particular ethnic group can be significant, it is not all-determining.
Individual differences exist within all cultures (Adler, 1986). Cultural descriptions are
36
never intended to describe perfectly the behavior of any single member of the group. But
“cultural descriptions strictly describe central tendencies, or norms. Cultural descriptions
portray what the majority of people do, not what all people do” (Adler, 1986, p. 118).
Besides the popular term “culture”, the terms “climate,” and “ethos” also describe
the same organizational phenomenon (Peterson & Deal, 2002). While culture is a
concept, we know that it exists based upon inference. We infer that people have a
particular set of values or beliefs when we examine their artifacts (Weaver, 2000). Hall
(1976) suggested that culture is like an iceberg, the tip (or external culture) is really the
smallest part. The internal culture is the largest part which is inside our heads and
unconscious – beneath the water level of awareness. Internal culture or “mind” is
dominant over external culture. If we want to understand what motivates behavior, we
must explore internal culture (Weaver, 2000).
The culture influences and shapes the way students, instructors, and administrators
think, feel, and act. Peterson and Deal (2002) listed many aspects of the social
expectations and values of the staff in a school:
Whether they think improvement is important
How motivated they are to work hard
How they feel when students do not perform well
How they act in hallways, lounges, and at faculty meetings
How they dress for different occasions
What they talk about in public or in private
The degree of support they give to innovative colleagues
Whom they go to for ideas or help
37

How they feel about their students and colleagues who are different
Whether they assume student learning capacity is determined by background
The degree to which student learning is dependent on teaching and the curriculum
Whether they believe collaboration and teamwork is a good thing
Whether state standards are potentially useful
Whether they see their daily work as a calling or a job
Every aspect of the school is shaped, formed, and molded by underlying symbolic
elements. Although not all cultural aspects are easily shaped by leaders, over time
leadership can have a powerful influence on emerging cultural patterns. Being
reflective can help reinforce cultural patterns that are positive and transform those
that are negative or toxic.(pp.9-10)
Culture is a powerful web of rituals and traditions, norms, and values that affects
every corner of school life. School culture influences four crucial issues: focus,
commitment, motivation, and productivity. It influences what people pay attention to,
how they identify with the school, how hard they work, and the degree to which they
achieve their goals (Deal and Peterson, 1999). The key features of culture composed of
(1) a share sense of purpose and vision, (2) norms, values, beliefs, and assumptions, (3)
rituals, traditions, and ceremonies, (4) history and stories, and (5) architecture, artifacts,
and symbols (Peterson and Deal, 2002). One of the key tasks of leaders is shaping culture
(Schein, 1985) through many daily interactions, watchful reflection, and conscious efforts
to lead people to a better future.
38

Cultural theory
Grid and group analysis, a cultural theory of organization, is a conceptual
framework for examining organizations and change (Gross & Rayner, 1985; Ellis, 2006).
It was offered by a social anthropologist Mary Douglas (Douglas, 1982). Harris (2005)
explained that Douglas’s typology of grid and group “provides a matrix to classify school
contexts and draw specific observations about individuals’ values, beliefs, and behaviors”
(p. 33). According to the typology, there are “four, and only four, distinctive school
contexts in which one may find him or herself, and only two dimensions, grid and group,
which define each of those four prototypes” (Harris, 2005, p. 34).
Grid dimension
Grid is a dimension of individualization of members in the organization, and group
is a dimension of social incorporation of members in the organization (Douglas, 1982).
The grid dimension refers to the degree of limitation of choices by an individual based on
the social constraints of the organization’s imposed rules, role expectation, management,
and procedures (Harris, 1995). Harris (2005) explained that “In Douglas’s frame, grid
refers to the degree to which an individual’s choices are constrained within a social
system by imposed prescriptions such as role expectations, rules, and procedures” (p. 34).
In summary, grid refers to the degree to which individuals are constrained by role
differentiation, rules, and expectations. On the grid continuum, high-grid educational
contexts are those in which role and rule dominate individual life choices, and low-grid
environments are characterized by individual autonomy and freedom in role choices.
(Harris, 2005, p. 36)
Some of the salient features of grid can be seen in figure 2.
39
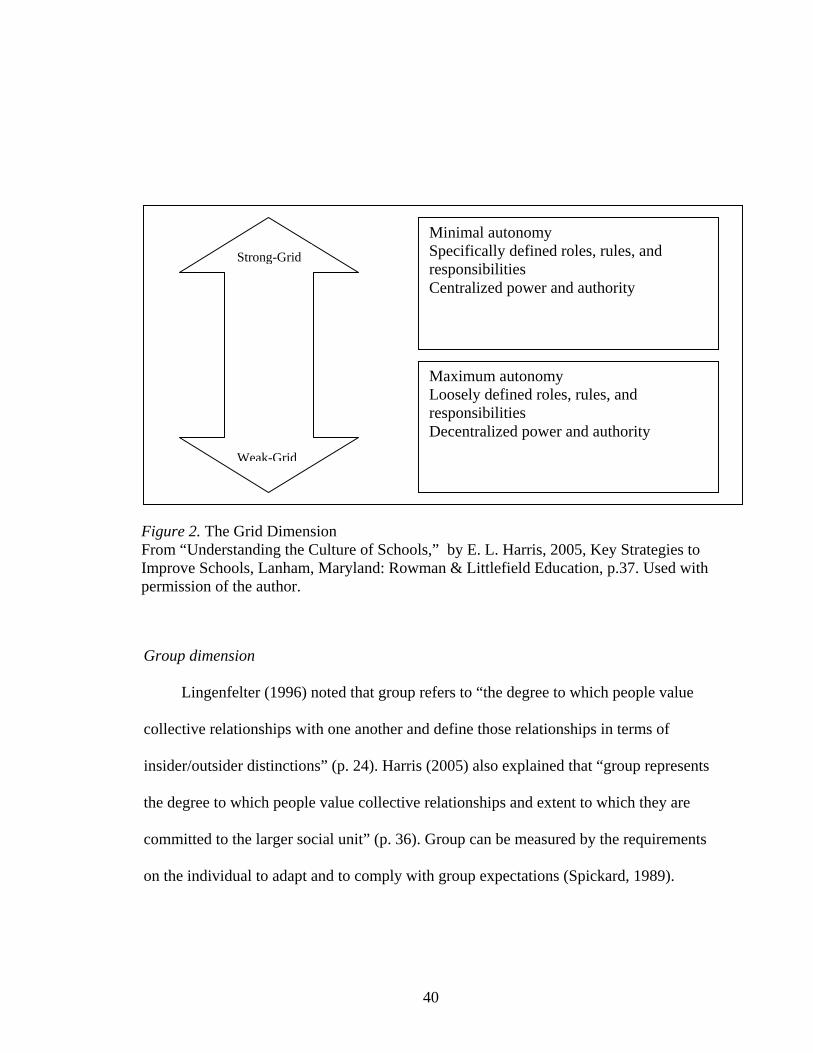
Figure 2. The Grid Dimension From “Understanding the Culture of Schools,” by E. L. Harris, 2005, Key Strategies to Improve Schools, Lanham, Maryland: Rowman & Littlefield Education, p.37. Used with permission of the author.
Minimal autonomy Specifically defined roles, rules, and responsibilities Centralized power and authority
Maximum autonomy Loosely defined roles, rules, and responsibilities Decentralized power and authority
Strong-Grid
Weak-Grid
Group dimension
Lingenfelter (1996) noted that group refers to “the degree to which people value
collective relationships with one another and define those relationships in terms of
insider/outsider distinctions” (p. 24). Harris (2005) also explained that “group represents
the degree to which people value collective relationships and extent to which they are
committed to the larger social unit” (p. 36). Group can be measured by the requirements
on the individual to adapt and to comply with group expectations (Spickard, 1989).
40

In strong-group social environments, specific membership criteria exist, and
explicit pressures influence group relationships. The survival of the group is more
important than the survival of individual members within it…Strong-group
environments are typically replete with prominent signs that display member
allegiance…Strong-group environments value the continued existence of the
school, and weak-group contexts value individual interest over the priority of
collective arrangements (Harris, 2005, pp. 36-38).
Some pertinent features on the group continuum can be seen in figure 3.
• Weak allegiance to school
• Minimal pressure to consider group goals and activities
• Minimal social incorporation
• Individual’s interests prioritized over group’s
Weak-Group Strong-Group
Figure 3. The Group Dimension From “Understanding the Culture of Schools,” by E. L. Harris, 2005, Key Strategies to Improve Schools, Lanham, Maryland: Rowman & Littlefield Education, p.39. Used with permission of the author.
• Strong allegiance to school
• Strong pressure to consider group goals and activities
• Strong social incorporation
• Group’s interests prioritized over individual’s
41

When simultaneously considering high or low strength in both grid and group
dimensions, Douglas’s four distinct possibilities of social contexts emerge (Chitapong,
2005) as displayed in figure 4.
Weak-Grid
Strong-Grid
Bureaucratic Social context: Authoritarianis
Corporate Social context:
Individualist Social context: Individualism
Collectivist Social context:
Weak-Group Strong-Group
Figure 4. Types of social environments and their social contexts From “Understanding the Culture of Schools,” by E. L. Harris, 2005, Key Strategies to Improve Schools, Lanham, Maryland: Rowman & Littlefield Education, p.41. Used with permission of the author.
Douglas’s grid and group typology is a combination of grid dimension and group
dimension. Figure 4 categorizes the four social contexts with their respective grid and
group environments, and each social context has its distinctive characteristics:
42

1. Bureaucratic environments (strong-grid and weak-group)
2. Individualist environments (weak-grid and weak-group)
3. Corporate environments (strong-grid and strong group)
4. Collectivist environments (weak-grid and strong group)
Ellis (2006) summarized that “these four systems are important to educators in
understanding the structure of their classroom and the roles and relationships of the
students (the culture)” (p. 36). This understanding can be helpful in resolving conflicts
and creating a conductive classroom learning environment. Douglas (1982) identified the
quadrant that best describes social context. Chitapong (2005) stated that “in analyzing an
individual’s preferences, grid and group typology does not assume the preferences, or
choice, are predetermined. The method takes into consideration the cumulative effect of
individual choices on the social situation itself” (p. 14). Douglas (1982) explained
undoubtedly that “both can interact, the individual and the environment, and either can
move because the environment is defined to consist of all the other interacting individuals
and their choices” (p. 198). The more concise and complete summary of all four social
contexts in four quadrants is listed below:
Bureaucratic environment
1. In the extreme, the individual has no scope for personal transactions.
2. There is little individual autonomy.
3. Roles and rules are defined without ambiguity.
4. Group goals and survival are not important.
5. The environment is hierarchical with predominately set criteria.
Individualist environment
43

1. The social experience of the individual is not constrained by group rules or
traditions.
2. Role status and rewards are competitive and based on merit.
3. There is little distinction between individual role statuses.
4. Long-term group survival is not emphasized.
Corporate environment
1. The group maintains boundaries against outsiders that limits social relationships
and experiences of its members.
2. The individual’s identification is derived from group membership.
3. Individual behavior is subject to controls exercised in the name of the group.
4. A hierarchy pyramid of role levels exists with greater individual power at the top
of the pyramid.
5. Group survival and perpetuation of tradition are of utmost importance.
Collectivist environment
1. The individual’s identification is granted through group membership.
2. Individual behavior is subject to controls exercised in the name of the group.
3. Authoritarian leadership and hierarchy are rejected.
4. The perpetuation of group goals and group survival is of utmost importance.
Douglas’s (1982) framework enables the researcher to analyze specific
organizations that are influenced by grid and group considerations. The advantage of this
grid and group typology lies in its potential to help explain individual preferences within
the cultural context of a particular setting.
44

Summary
The use of CAI in education is increasing and creating unique learning cultures in
higher education environments. Even though the forms of media are more different from
the past, the concept of CAI is still the same – to use computer as aids for instructional
purposes.
One important thing that we should not neglect is that students are the consumers
of CAI, and they should gain knowledge from CAI by using it by themselves. Glasser
(1998) reminds that we learn 10 percent of what we read, 20 percent of what we hear, 30
percent of what we see, 50 percent of what we both see and hear, 70 percent of what we
discuss with others, and 80 percent of what we experience personally. An important role
of teachers is to assist students to be happy to learn, which will make students gain
knowledge joyfully and realize that they can get education and entertainment,
Edutainment, in the same time. But how can teacher encourage students to use CAI
willingly. The answer is that teacher must know students’ preferences in CAI. Mary
Douglas (1982) states that peoples’ cultural preferences affect how they learn as well as
what they are interested in learning.
45

CHAPTER III
METHODOLOGY AND PROCEDURES
This chapter describes the methodology and data collection procedures used to
complete the study. The selection of methodology and data collection procedures
depended on the type of study pursued (Stansberry, 2001). Since this study featured
closed interaction with participants and their preferences of specific situations, processes,
and occurrences, qualitative research was the most appropriate.
Methodology
In the literature, qualitative research is referred to by many terms, including
naturalistic inquiry, ethnographic research, field research or field work, unobtrusive
measures, observation, grounded theory research, and interpretive procedures (Glazier &
Powell, 1992). Qualitative research employs methods of data collection and analysis that
are non-quantitative, aims towards the exploration of social relations, and describes
reality as experienced by the participants (Adams, Khan, Raeside, & White, 2007). A
questionnaire, interviews, observation, and archives collection in this study allowed the
researcher to develop a “picture” of participants’ experiences and perceptions. These
experiences and perceptions were then analyzed to form a description of a specific
situational phenomenon, or a case study (Stansberry, 2001).
Case studies are one of the most popular methods of conducting social science
research (Burton, 2000). There are many definitions for the term “case study
46

research.” Becker (1968) gave the definition of case study as participant observation of
groups and group behavior. Runyon (1982) stated that case study is the presentation and
interpretation of detailed information about a single subject, and event, culture or
individual. Doing case studies means “making extensive observations of a single group or
person” (Graziano & Raulin, 2004, p. 124). The case study “provides an opportunity for
the intensive analysis of many specific details often overlooked by other methods”
(Kumar, 2005, p. 113).
In order to make the study rich and thick, the researcher used case study. Yin
(1994) defined case study research is as an empirical enquiry that investigates a
contemporary phenomenon in context. When the boundaries between the phenomenon
and the context are not clearly evident, multiple sources of evidence are used. Yin (1994)
presented five reasons the case study is a particular good means of educational research.
Those five reasons can be called “DEEPS” for easy remembrance. The case study
research has the ability to describe, explore, exemplify, provide a meta-evaluation, and
surmise: (1) describe the real-life context in which an intervention occurs; (2) explore
situations in which an intervention exists but has no clear, set outcomes; (3) exemplify
specific topics in a descriptive mode; (4) provide a meta-evaluation—a study of an
evaluation study; and (5) surmise causality among complex, real-life interventions.
Graziano and Raulin (2004) described that case study is research in which minimal
constraints are placed on participants’ behavior. By placing constraints, case studies
narrow the focus, but “retain the essential interest in participants’ natural behavior” (p.
129). Yin (1994) defined case studies as “an all-encompassing method – with the logic of
design incorporating specific approaches to data collection and to data analysis” (p. 13).
47

The case study report involves an investigator who makes a detailed examination of a
single subject, group, or phenomenon. However, the case study should not be confused
with a narrative, which is “much less complex than a case study and is written from one
viewpoint” (Erlandson et al., 1993, p. 163).
According to Yin (1994), there are three types of case studies – descriptive,
explanatory, and exploratory. Each type has distinctive characteristics, but there is an
overlap among them. Descriptive case study attempts to “describe systematically a
situation, problem, phenomenon, service or program, or provides information about, say,
the living conditions of a community, or describes attitudes towards an issue” (Kumar,
2005, p. 10). Explanatory case study attempts to “clarify why and how there is a
relationship between two aspects of a situation or phenomenon” (Kumar, 2005, p. 10).
Exploratory case study is “undertaken with the objective either to explore an area where
little is known or to investigate the possibilities of undertaking a particular research
study” (Kumar, 2005, p. 10).
This study was considered an explanatory case study because its main objective
was to explain the educational culture of the Faculty of Management Sciences at PSU,
exploring both instructors and students cultural context. The purpose of this study was to
provide explicit experiences of the educational culture of FMS, to describe the students’
and instructor’s preferences in CAI, to describe CAI practices in FMS. Moreover, the
study introduced guidance for future consideration about providing appropriate CAI for
students.
48

Data Collection Procedures
The population in this study consisted of 62 instructors and 2270 students of the
Faculty of Management Sciences. There are two departments in the faculty, which are the
Department of Business Administration and the Department of Public Administration.
There are five majors in the Department of Business Administration: (1)
Information Technology Management, (2) Human Resource Management, (3) Marketing,
(4) Finance and, (5) Accounting. There are three majors in the Department of Public
Administration: (1) Public Policy, (2) Rural Administration, and (3) Human Resource
Management. Each department was administered independently. Students in each major
had their own characteristics.
Protection of Human Subjects
The researcher asked for permission from the Dean to conduct the research at
FMS. The researcher met the instructors and students of FMS, and asked for their
permission to participate in the study.
Instrumentation
The researcher used Grid and Group Cultural Preference Tool as questionnaires
for students and for instructors. They were online questionnaires adapted from the survey
instrument constructed by Harris (2005). The English version of the instrument for
students and instructors can be seen in Appendix C and Appendix E respectively. It has
been used several times in schools located in the United States (Harris, 2005) and also in
Thai school context (Chitapong, 2005). The researcher received permission from Harris
(2005) to use this instrument in the study conducted at FMS in Thailand. The researcher
translated the survey from English to Thai; then Mrs. Sinlapamethakul translated it back
49

to English to assure that translation corresponds the original version. The Thai version
instrument for students and instructors can be seen in Appendix D and Appendix F
respectively.
After the researcher developed a questionnaire for students and a questionnaire
for instructors, 5-10 students and 2-3 instructors were asked to participate in the pilot
study of the questionnaire. A pilot study is a small-scale trial of the proposed procedures.
Its purpose is to “detect any problems so that they can be remedied before the study
proper is carried out” (Fraenkel & Wallen, 1993, p. 470). Gay (1990) stated the benefit of
the pilot study is that “even a small-scale pilot study, based on a small number of
subjects, can help in refining procedures, such as instrument administration and scoring
routines, and in trying out analysis techniques” (p. 90). The pilot study occurred in June
2008. The results of the pilot study ended up with no changes to the instrument.
Data needs
The data needed in this study are the expression of beliefs and values about
personal preferences of each individual student and instructor on CAI, including teaching
strategies, and teaching environment.
Data sources
Participants of the study were FMS students and instructors. The data sources
were organized in two stages. At the first stage, all students and instructors of FMS who
wanted to participate in this study became data sources. At this stage 133 students
answered the online questionnaire for students and 39 instructors answered the online
questionnaire for instructors. At the second stage, 14 students and 9 instructors were
chosen from the first group of participants. A purposive sampling technique was used.
50

Purposive sampling requires a procedure that is “governed by emerging insights about
what is relevant to the study based on the focus determined by the problem and
purposively seeks both the typical and divergent data to maximize the range of
information obtained about the context” (Erlandson et al., 1993, p. 148). An in-depth
interview method was used at this stage. Observations were done for the general
environment of the setting, for example, how many classrooms were there? How many
computer lab rooms were there? Can students access the Internet easily? Moreover, there
were 2 classrooms observations. In addition to the participants, the documents or artifacts
related to CAI such as teaching materials, brochure, news of the FMS, field notes were
taken into account as valuable data sources.
Data Collection
Creswell (1994) explained that the data collection procedures in a qualitative
design are composed of “ (a) setting the boundaries for the study, (b) collecting
information through observations, interviews, documents, and visual materials, and (c)
establishing the protocol for recording information” (p. 148). The target populations were
undergraduate students and the faculty of Management Sciences (FMS), Prince of
Songkla University (PSU). They were asked to be volunteers in this study. The
exploratory research was conducted in the third week of the first semester of the year
2008 (from June 16, 2008 to July 11, 2008). It lasted for four weeks.
The researcher asked for permission from the Dean of FMS to do the study.
Students who volunteered to be a participant went to a website to answer the Grid and
Group Cultural Preference Tool questionnaire which was already uploaded to the
website. The address for the instructors’ questionnaire was available on another website.
51

Even though the main part of both questionnaires was the same, the Grid and Group
Cultural Preference Tool, the needed demography for students and instructors were
different. Therefore the researcher put the questionnaires in different websites. The
participants in the first phase composed of 120 students. The researcher used Grid and
Group Cultural Preference Tool as an instrument to classify participants in the quadrants,
and from each quadrant, the researcher purposively selected participants from each
quadrant for a qualitative interview.
Fourteen students and 9 instructors were selected for interview. A Thai consent
form giving permission to be interviewed was given to each participant. All interviewed
participants were encouraged to give honest information to the interview questions. The
interview process provided the interviewees with the opportunity to discuss their
experiences, attitudes and preferences about CAI, pattern they like most as instructors
and students, and other general information about CAI. The interview questions can be
seen in Appendix I.
The researcher got the data about FMS students and instructors cultural contexts
using questionnaires. The researcher got the data about students and instructors cultural
contexts from interviews with the key informant participants too. There are three
alternatives for interviewing which are (1) the informal conversational interview (2) the
general interview guide approach, and (3) the standardized open-ended interview (Patton,
2002). Themes extracted from questionnaires and interview texts were triangulated with
FMS documents and observation of the research settings. Moreover the researcher also
became one of many instruments, as Erlandson et al. (1993) stated, “the researcher him-
or herself becomes the most significant instrument for data collection and analysis” (p.
52

39). Interview excerpts were aligned with the grid and group typology, using Douglas’s
(1992) criteria.
The Survey Instrument
The questionnaire survey study occurred in the third through the sixth week of the
first semester of the year 2008 (from June 16, 2008 through July 11, 2008). This time
period was chosen because it was an appropriate time for the students. They could settle
all their subjects at least in the third week, and the last day of the second week was the
last day that students can add up or withdraw subject with the money refund. The eighth
week would be a midterm exam and the final exam was on the sixteenth week.
The researcher uploaded the Grid and Group Cultural Preference Tool
questionnaire to the website http://frontpage.okstate.edu/coe/aree1 for students and
http://frontpage.okstate.edu/coe/aree2 for instructors. The participants who volunteered
completed the instruments from that website. The researcher then analyzed the data on
the questionnaires that could explain classroom culture. Culture is a human creation
comprised of human interactions and relationships with all of their complexities and
flaws (Harris, 2005). FMS culture can be analyzed. As Harris (2005) stated, “a school
district, a school site, or an academic classroom can each be viewed as a unit of analysis
for a social system” (p. 33). The researcher used Douglas’s typology of grid and group to
classify classroom contexts and draw specific observations about the individuals’ values,
beliefs, and behaviors. The researcher then categorized which one of the four prototypes
the classroom culture should fit in. The English version survey instrument for students
and instructors can be seen in Appendix C and Appendix E respectively. The Thai
53

version of the survey for students and instructors can be seen in Appendix D and
Appendix F respectively.
Interviews
After the survey data of phase 1 were gathered and plotted on the grid/group
quadrant, twelve students (two from each quadrant of social context) were contacted to
set up a qualitative interview schedule. All of them were willing to provide the needed
valuable information. The interview took place on site; all the interviewees had
completed the survey. Each participant was previously given a Thai consent form. All
interviewed participants were encouraged to give honest information to the interview
questions. The interview process provided the researcher with the opportunity to discuss
the learning preferences of students and the teaching preferences of instructors. Interview
questions can be seen in Appendix I.
Document analysis
Document and artifact analyses or archives collection such as gathering field notes,
brochures, website of the setting was a method that helped in discovering remarkable
findings. Erlandson et al. (1993) listed possible examples of documents: “historical or
journalistic accounts, works of art, photographs, memos, accreditation records, television
transcripts, newspapers brochures, meeting agendas and notes, audio or videotapes,
budget or accounting statements, notes from students or teachers, speeches, and other
case studies” (p. 99).
At the beginning of the study, the most public and easily accessed documents were
gathered. The Faculty of Management Sciences website (http://www.mgt.psu.ac.th) was
accessed and analyzed. Brochures in the office of the faculty secretary, the Department of
54

Business Administration, and the Department of Public Administration were collected
and analyzed. During each of the interviews, participants were asked if they would
provide documents such as course descriptions, press releases, and descriptions of
information technology tools, that would contribute to the study.
Observations
Two crucial strategies used in this study were observations of students’
interactions, instructors’ interactions, and collection of field notes. Weimer (1979) noted
that observation is “a skill over and above passive reception of the raw data of sensory
experience” (p. 21). Patton (2002) stated that the purpose of observation analysis is to
take the reader into the setting that was observed, which means that “the reader can
understand what occurred and how it occurred” (p. 23). Another important research tool
used in participation observation was “a notebook into which you enter your
observations” (Dane, 1990, p. 161), the field journal. Field notes in the field journal were
taken during observations and used for analysis along with interviews and documents.
The summary of methods used is presented in the table below.
Table 3 Methods used for data collection Method Overall purpose Advantages Challenges Online survey
To obtain measurable data within time constraint.
Easily obtained large amounts of data. Very inexpensive Less time consuming and easy to analyze
Systematic (nonsampling error), which is error resulting from some imperfect aspect of the research design that causes response error or from a mistake in the execution of the research; error that comes from such sources as sample bias, mistakes in recording responses, and nonresponses from persons not contacted or refusing to participate.
Interview To gather Allowed researchers to Interviewer error, which is
55

qualitative information that cannot directly observe.
gather additional information that could not be captured in the survey. Allows interaction amongst the participants.
administrative error caused by failure of an interviewer to perform tasks correctly.
Document analysis
To constitute part of the repertoire of field research
Documents prove valuable not only because of what can be learned directly from them but also as stimulus for paths of inquiry that can be pursued only through direct observation and interviewing.
Learning to use, study, and understand documents and files is part of the repertoire of skills needed for qualitative inquiry.
Observation to take the reader into the setting that was observed
Direct data collection. It directly records what people do, as distinct from what they say they do.
Behavior, not intentions. Its focus on overt behavior describes what happens, but not why it happens. It does not deal with the intentions that motivated the behavior.
(Table adapted from Denscombe, 2007, Kelsey, 2005, Patton, 2002 and Zikmund, 2000) Data Analysis
Data analysis happened in the same time of data collection as Erlandson et al.
(1993) explained, “the analysis of the data gathered in a naturalistic inquiry begins the
first day the researcher arrives at the setting” (p. 111).
Multiple methods were triangulated in this study to improve the validity of the
measurement. Fitzpatrick, Sanders and Worthen (2004) explained triangulation as the
term “coined to refer to the process of using multiple methods to measure a construct
validly.” (p. 305). Validity, in the most basic sense, refers to how true or accurately
claims or important concerns are measured (Burns & Grove, 1997). Erlandson et al.
(1993) also added up that “different questions, different sources, and different methods
should be used to focus on equivalent set of data. Alternative explanations should be
considered” (p. 31). Two important concepts in educational research are validity and
reliability. Validity refers to the appropriateness, meaningfulness, and usefulness of the
56

inferences researchers make based on the data they collect, while reliability refers to the
consistency of these inferences over time. Fraenkel and Wallen (1993, p. 400) listed
many valuable procedures for checking on or enhancing validity and reliability including
the following:
1. Using a variety of instruments to collect their data. This kind of checking is
often referred to as triangulation.
2. Checking one informant’s descriptions of something against another
informant’s descriptions of that same thing.
3. Learning to understand and speak the vocabulary of the group being studied.
4. Writing down the question they ask.
5. Recording their own thoughts as they go about their observations and
interviews.
6. Documenting the sources of remarks whenever possible and appropriate.
7. Documenting the bases for inferences they make.
8. Describing the context in which questions are asked and situations are
observed.
9. Using audiotapes and videotapes when possible and appropriate.
10. Drawing conclusions based on one’s understanding of the situation being
observed and then acting on these conclusions.
11. Interviewing individuals more than once.
12. Observing the setting or situation of interest over a period of time.
This study followed most of these procedures. It used a variety of methods to
collect data, which were surveys, interviews, observations, and document analysis.
57

Data obtained from survey were analyzed using Microsoft Word 2003 and
Microsoft Excel 2003. Even though there were many statistical packages that can be used
for analyzing. It was the researcher’s personal preference to use Excel. The researcher
followed the scoring procedures and plotting procedures stated in Harris (2005). In the
scoring procedure, the researcher used average function of Excel to calculate average of
grid scores and group scores. In plotting procedures, the researcher inserted chart XY
(Scatter), each point for each participant. Finally, the researcher knew FMS students and
FMS instructors’ preference cultural context as Harris (2005) stated, “you will likely see
a dominant theme based on a stronger cluster of points in one of the four quadrants” (p.
79).
According to Lincoln and Guba (1985), “Data analysis involves taking
constructions gathered from the context and reconstructing them into meaningful
wholes.”(p.333). Erlandson et al. (1993) summarized:
This process has three elements: (1) unitizing data, (2) emergent category
designation, and (3) negative case analysis. A fourth element is added to analysis
that is done between periods of data collection: (4) bridging, extending, and
surfacing data (p.116).
According to Erlandson et al. (1993), unitizing data, “may be defined as
disaggregating data into the smallest pieces of information that may stand alone as
independent thoughts in the absence of additional information other than a broad
understanding of the context” (p. 117). Emergent category designation, “involves taking
all of the units of data and sorting them into categories of ideas” (p. 118). Negative case
analysis, “involves addressing and considering alternative interpretations of the data”
58

(p.121).
The researcher entered the verbatim transcript of each interview into Word. The
researcher read each interview. If a new theme emerged, the researcher put it in new
column. Each row represented the information from each participant. With this
procedure, the researcher categorized the data according to an emergent classification
system.
The survey responses provided primary data to understand the cultural context of
the selected setting (FMS). Using Douglas’s (1982) grid and group typology, data
collected through interviews, observations, and document analysis reinforced classroom’s
placement into an appropriate quadrant of cultural context.
The summary of data collection methods and data analyses which relate to each
research question is in table 4.
Table 4
Research Questions, Data Collection Methods, and Data Analyses
Research Question Data
Collection Data Analysis 1. How does Douglas’s typology explain the educational culture of the FMS at PSU?
1. Interviews with FMS students and FMS instructors
1. Uncover themes in verbatim transcript
2. Observation 2. Field notes written immediately after observation
3. Document, artifact, and web page information regarding school cultural environment
3. Study of documents, web pages, and artifacts that provide insight into school culture
59

2. What are the students and instructors attitudes toward CAI?
1. Interviews with FMS students and FMS instructors
1. Uncover themes in verbatim transcript
2. Observation 2. Field notes written immediately after observation
3. Document, artifact, and web page information regarding school cultural environment
3. Study of documents, web pages, and artifacts that provide insight into students and instructors attitudes toward CAI
3. What is the interrelationship of CAI practice and educational preferences among the students and the faculty?
1. Interviews with FMS students and FMS instructors
1. Uncover themes in verbatim transcript
2. Observation 2. Field notes written immediately after observation
3. Document, artifact, and web page information regarding school cultural environment
3. Study of documents, web pages, and artifacts that provide insight into students and instructors practices in CAI
4. Grid and Group Cultural Preference Tool (Harris, 2005)
4. Scores from FMS students' and FMS instructors' responses plotted on vertical and horizontal axes to determine preference foe cultural environment, using Douglas' (1982) Cultural Theory
4. How useful is Douglas’s typology of grid and group in understanding this interrelationship?
1. Interviews with FMS students and FMS instructors
1. Uncover themes in verbatim transcript
60

2. Observation 2. Field notes written immediately after observation
3. Document, artifact, and web page information regarding school cultural environment
3. Study of documents, web pages, and artifacts that provide insight into students and instructors practices in CAI
4. Grid and Group Cultural Preference Tool (Harris, 2005)
4. Scores from FMS students' and FMS instructors' responses plotted on vertical and horizontal axes to determine preference foe cultural environment, using Douglas' (1982) Cultural Theory
5. What other realities are revealed in this study?
1. Interviews with FMS students and FMS instructors
1. Uncover themes in verbatim transcript
2. Observation 2. Field notes written immediately after observation
3. Document, artifact, and web page information regarding school cultural environment
3. Study of documents, web pages, and artifacts that provide insight into students and instructors practices in CAI
4. Grid and Group Cultural Preference Tool (Harris, 2005)
4. Scores from FMS students' and FMS instructors' responses plotted on vertical and horizontal axes to determine preference foe cultural environment, using Douglas' (1982) Cultural Theory
61

CHAPTER IV
PRESENTATION OF DATA
This study was conducted at Prince of Songkla University (PSU) in the southern
part of Thailand in the first semester of 2008. The study had three overlapping purposes.
The first purpose was to use Douglas’s typology to explain the educational culture of the
Faculty of Management Sciences (FMS) at PSU. The second was to describe the
students’ and faculties’ preferences about Computer Assisted Instruction (CAI) in FMS.
The last purpose was to describe CAI practices in FMS.
Lingenfelter (1996) recommends that if one desires to understand the people, the
society, and the culture of a group, it is essential that he or she engage in a program of
systematic observation and research, focusing on five interrelated features of the social
environment: (1) the playing field (space) (2) the players (people) (3) the rules of the
game (relationships) (4) the game (activities) and (5) the calendar (time). Data collected
through online questionnaires, interviews, observations and documents from FMS are
presented in this chapter in a case study format.
Prince of Songkla University
Prince of Songkla University was established in 1967 as the first university in
southern Thailand. The university’s early years were characterized by a steady expansion
of academic disciplines and establishment of high academic standards. Today, PSU is
considered to be one of the most highly accredited institutions throughout Thailand
(Prince of Songkla University, 2007).
62

The name “Prince of Songkla” was bestowed upon the university by His Majesty
King Bhumibol Adulyadej in honor of his late father, His Royal Highness Prince Mahidol
of Songkla, who is known as “The Father of Modern Medicine” in Thailand (Prince of
Songkla University, 2005). His Royal Highness Prince Mahidol of Songkla expressed his
wish that all who are affiliated with PSU should be imbued with a sense of gratitude and
each person should “let consideration of personal gains take second place to the overall
benefit of mankind; prestige and prosperity are the natural rewards of dedication to work”
(Prince of Songkla University, 2005, p. 3). PSU has five campuses located in Hatyai,
Pattani, Phuket, Surat Thani and Trang. Each campus not only serves the needs of the
local communities but also offers variety of fields of study to serve the development of
the nation as a whole.
As a multi-campus university, PSU has its own administrative system, which may
be different from other campuses in Thailand. According to the PSU Act, the university
council, comprising of well-known scholars in various fields and politicians, played a key
role in guiding and supervising the university affairs both administratively and
academically. The Ministry of Education has decentralized its authority to university
council in many ways. For example, the university council has full authority to approve
courses or degrees offered by the university. Establishment of a new department, even
faculty, has to be approved by this body. PSU president acts as a secretary-general in the
University Council board. Within the university, the executive staff led by the president
administers the university. The president, who is officially appointed by the King,
appointed a number of vice presidents and deputy presidents, to be responsible in various
university affairs and campus branches.
63

Under the 2008 administration, there are six vice presidents who were assigned to
bear the responsibility for different affairs, such as, academic, students’, and planning.
Every vice president has to report the progress to the president on the assigned
responsibilities. As PSU has five campuses, each campus has its own campus vice
president to manage and oversaw campus affairs.
Likewise, the other campuses have their respective vice presidents. They work
like a president in the respective campuses because he or she was given certain authority
from the president in making decision administratively and academically. The role of the
president is to coordinate, monitor, and create connections among these vice presidents
and makes final decision on certain matters. In each campus, there is a set of executive
members to handle various campus affairs, comprising of vice presidents and deputy
presidents. The number of the executive team depends on how large the campus is.
All the executive members ranking from president, vice presidents, deputy
presidents, and school deans from 28 faculties of all five campuses had a monthly
meeting called a “Dean Meeting.” The meeting was scheduled to rotate the meeting
venue from one campus to another. Even the location of each campus was far apart.
These administrators were obliged to attend the meeting. Figure 5 depicts the
organizational structure of PSU.
64

Figure 5. PSU Structural Administrative System.
A University uniform was mandatory in all PSU campuses including Pattani,
especially when students attended class and met faculty members in the office. Male
students wore white button-down shirts, either long or short sleeves, with dark-color
pants. Females wore white short-sleeve blouses with PSU logo on it, black skirts and
black shoes. Students wore this typical uniform to class, attended any university activities
or event to contact department officials or faculty members in PSU.
The Faculty of Management Sciences
The Faculty of Management Sciences was established in 1976 as the seventh
65

faculty of PSU, and as the fifth faculty in Hatyai campus. There are two departments in
the faculty, which are the department of Business Administration and the Department of
Public Administration.
There are five majors in the Department of Business Administration: (a)
Information Technology Management, (b) Human Resource Management, (c) Marketing,
(d) Finance, and (e) Accounting. There are three majors in the Department of Public
Administration: (a) Public Policy, (b) Rural Administration, and (c) Human Resource
Management. Each department is administered independently and students in each major
have their own characteristics.
The Playing Field
Prince of Songkla University, Hatyai campus is located on Karnjanawanit Road,
Hatyai District, Songkla Province. There are many gateways, but for security reasons,
there are normally only three entrance gateways that are open. The FMS’s main facilities
are comprised of four buildings: an Administrative Building, Conference Hall, Classroom
Building 1, and Classroom Building 2. Figure 6 depicts a satellite view of FMS.
In the 2009, the faculty received a budget to build a new building, which will be
completed in 2011. This new facility has already been named the Research and
Knowledge Development for Management Building. Anyone who is interested in
learning about the new building can communicate with the FMS administrative team
communicated at the URL http://www.mgt.psu.ac.th/proj/. The information about the
new building, including its objective, construction concept, and the plans for all eight
floors can be accessed.
66

Figure 6. Faculty of Management Sciences layout.
The first floor of the Administrative Building is used for administrative work.
There are rooms for the Dean, the associate deans, the secretary office of the Faculty,
inventory unit, office of the department of Business Administration (BA), office of the
department of Public Administration (PA), office of students’ training, office of
Accounting (continuing program), office of student affairs unit, office of educational
service unit, and document unit. The second floor of the Administrative Building is used
for instructors’ offices, meeting rooms, the office of Security Market Information Center
(SMIC), the office of the Doctor of Philosophy Program in Management, and the office
of the International MBA (iMBA) program. The third floor is used for teaching and the
office of individual computer lab, named as UsableLabs.
The first floor of Classroom Building 1 is like a patio. It is a wide area where the
faculty normally place about seven tables where anyone can sit and work. The faculty
67

provides wireless internet access at this place. There is also an area called “the custom
corner” where students can gather for activities and read. The Office of Institute for
Small and Medium Enterprises Development (SMEs) is in Classroom Building 1. The
rooms on the second floor of Classroom Building 1 include a computer project room for
the fourth-year students majoring in business computing, a network control room for all
staff in the Faculty, an office of a female computer staff, classrooms, and teachers’
offices. The third floor of a Classroom Building 1 is used primarily for an international
program: Bachelor of Business Administration Program in Management. This English
program has usually been called in short, BBA. The other programs are taught in Thai.
On the first floor of a Classroom Building 2, there are four classrooms; each room
can be used for teaching about 120 students. On the second floor, there are six
classrooms. Some rooms can be used for about 100 students, while the other rooms can
be used for about 60 students. On the third floor there are 4 computer labs.
The administration of FMS consists of the Dean, an Associate Dean in
Administration, an Associate Dean in Academic Affairs, an Associate Dean in Student
Affair, and an Assistant Dean in Student Affairs. All administrators also have teaching
responsibilities. The officers who started their work before the year 2003 were
government officers. The officers who started their work after that were not government
officers; they were only officers. There are 32 government officers and 13 officer
instructors in the department of BA. Two government officers and three officers are
pursuing doctoral degrees. There are 13 government officers and 4 officer instructors in
PA; the Dean, an Associate Dean in Academic Affair, and the head of BA hold doctoral
degrees. There are eight instructors in BA and four instructors in PA hold doctoral
68

degrees and the rest have master’s degrees. There are 30 female and 15 male instructors
in BA, while there are five female and 12 male instructors in PA. FMS offers education
for a continuing program, bachelor degree, and master’s degree. This study would
concentrate on only students in ordinary majors of a bachelor’s degree. In the academic
year 2008, there are 2270 students in FMS, which is displayed in Table 5.
Table 5
Number of Students in the Faculty of Management Sciences by Gender and Year Entered
2004 2005 2006 2007 2008 Major M F T M F T M F T M F T M F T
Total
BC 4 1 5 38 87 125 26 56 82 212 ITM 33 72 105 32 71 103 208 FIN 2 2 14 83 97 12 46 58 15 63 78 17 63 80 315
MKT 1 2 3 36 78 114 16 48 64 27 65 92 18 66 84 357 HRM 1 2 3 15 76 91 14 45 59 26 61 87 25 63 88 328 ACC 2 2 23 107 130 15 77 92 224 ACC 14 94 108 13 98 111 219 BPA
(HRM) 1 1 13 23 36 26 41 67 14 41 55 159 BPA (PP) 7 5 12 15 13 28 14 17 31 71 BPA (RA) 2 1 3 13 17 30 8 15 23 56 BPA 8 8 2 2 48 63 111 121 Total 10 9 19 159 476 635 132 326 458 153 428 581 153 424 577 2270
BC: Business Computing
ITM: Information Technology Management
FIN: Finance
MKT: Marketing
HRM: Human Resource Management)
ACC: Accounting
BPA: Bachelor of Public Administration
PP: Public Policy
RA: Rural Administration
69

Note. From Prince of Songkla University, Registration Unit (2008). Retrieved October
16, 2008, from http://www.reg.psu.ac.th
The Player
Two groups of FMS participants, students and instructors, are identified in this
study. The data sources were organized in two stages. In the first stage, all students and
instructors of FMS who wanted to participate in this study became data source. In this
stage, there were 133 students and 39 instructors, and these participants were surveyed.
Information from students in the first stage is displayed in Table 6, while Information
from instructors is displayed in Table 7.
Table 6
Number of Students in Survey Stage for Each Major
Major Total Accounting 26 Finance 27 Marketing 14 ITM 2 HRM…BA 51 Business Computing 10 HRM…PA 3
Total 133
Table 7
Number of Instructors in Survey Stage for Each Major
Major Total Accounting 6 Finance 4 Marketing 5 ITM 5
70

Marine merchant 2 HRM…BA 5 HRM…PA 6 Rural Administration 3 Public Policy 2 Economics 1
Total 39
Individuals in the second stage, 14 students and 9 instructors, were purposively
chosen from the participants in the first stage to have about equal numbers of participants
in four cultural contexts. In-depth interviews and observations were used in this stage.
The students in this stage are identified as the following:
Student01 was a 21 year old, second year student in Information Technology
Management.
Student02 was a second year student majoring in Marketing.
Student03 was a second year student majoring in Marketing.
Student04 was a second year student majoring in Human Resource Management.
Student05 was a first year student majoring in Human Resource Management.
Student06 was a first year student majoring in Human Resource Management.
Student07 was a first year student majoring in Human Resource Management.
Student08 was a first year student majoring in Human Resource Management.
Student09 was a second year student majoring in Finance.
Student10 was a first year student majoring in Human Resource Management.
Student11 was a second year student majoring in Marketing.
Student12 was a second year student majoring in Accounting.
Student13 was a second year student majoring in Accounting.
71

Student14 was a second year student majoring in Accounting.
Nine instructors were interviewed. Seven of them earned their master’s degree
from a university in Thailand. Two of them earned their doctoral degrees: one from
Thailand and one from USA. There were four males and five females. One was in the age
interval 26-30, one was 31-35, three were 46-50, two were 51-55, and two were 56-60.
There was one finance, one economics, three accounting, two information technology
management, and two human resource management majors from the Department of
Public Administration. All except two instructors started their work as instructors at
FMS. The instructors are identified as the following:
Instructor01 was an information technology management major. He started his
career here as a teacher about 5 years ago.
Instructor02 has been teaching for many years at PSU.
Instructor03 has been teaching at PSU for about 11-15 years.
Instructor04 has taught at PSU for about 11-15 years. He got his Master’s degree
from a university in Thailand.
Instructor05 was a certified public accountant (CPA). She started her career as a
teacher at FMS for about 6-10 years ago.
Instructor06 has taught at FMS for more than 25 years.
Instructor07 has taught at FMS for more than 25 years and is an accomplished
researcher.
Instructor08 has taught at FMS for only about 6-10 years and earned a Master’s
degree from Prince of Songkla University, Hatyai, Thailand.
72

Instructor09 has taught at FMS for about 21-25 years. She got her doctoral degree
from Washington State University, USA.
The Rules of the Game
While FMS has its own vision and mission, it is part of PSU. The vision of PSU is
“to be one of the leading universities in Asia, with its commitment to research-based
teaching, outreach and conversation of local arts and culture” (Prince of Songkla
University, 2007, p. 6).
The missions of PSU are:
(1) To be knowledge-based university, based on its unique multicultural
characteristics and the principle of sufficiency economy, with a view to
making variety of information and cultural activities accessible to the
populace from all walks of life.
(2) To promote an academic leadership based on issues related to the potentials of
the southern Thailand, which will be subsequently linked to the global
network.
(3) To link knowledge based on practical and international experience to teaching
so that our students will be exposed to the real world as well as being well
equipped with wisdom, ethics, international awareness and global competence
(Prince of Songkla University, 2007, p. 6).
For FMS, in front of the faculty secretary’s office, there were 2 signs that showed
the vision and mission of the faculty. The vision of FMS is “to be a leading management
school in teaching and research for private and public sectors both for national and
international standards by 2012.”
73

The mission of FMS states:
Striving for academic excellence on management education in theory and
application for both private and public sectors:
(1) To provide qualified graduates;
(2) To initiate applied research and academic services for the community and
society.
To support the faculty to be a leading management school, the curricula has been
improved. The new curricula for undergraduate students started to be used in the
academic year 2007. Some of the names of programs were also changed, as student01
said “Major, Information Technology Management, in the past was called Business
Computer.” She realized the usefulness of computers, which is why she chose to study in
the major of Information Technology Management. She said she likes studying
computers, “because no matter what I do…any work…in the future, or in business, no
matter what I do, I mostly use computer.”
The curriculum of Doctor of Philosophy Program in Management was set up in
the last quarter of the year 2008. There was an “Open House” day on Thursday,
December 18, 2008 at 9am to 11am. The objective of that day was to introduce the office,
personnel, and the curriculum. They invited both the personnel of FMS and whoever was
interested in the curriculum. They used many kinds of communication, including sending
email, advertising in the FMS newsletter, and putting it on the website of the faculty.
Instructor01 said that he studied in this major “because I graduated in bachelor
degree in Computer Science.” It was his preference to study in this major. He thought
74

that the content that he learned in bachelor’s degree level was only basics, “I would like
to learn more in detail.”
Instructor08 said, “Indeed this major is an interesting major. It originated from the
concept of computer applications, which is the way I like.” He articulated that “I was
interested in this major since the beginning, especially when it is used to apply in
business, it increased my interest more. So I think that this major is really interesting
major.”
Student02 said that marketing “is the major that most fits me. I can mostly use it
in a daily regular life.”
Student03 told an interesting long story about why he chose to study marketing.
After he finished studying in the secondary school, “the only thing I knew about PSU was
that the faculty of management sciences is famous and this track is related to the track I
learned, the art track.” Moreover, he expressed loyalty for his homeland: “In my deep
heart, I want to be in Hatyai more than Bangkok.”
When student03 was asked to describe what the student in marketing major study
about, he answered, “We study about demand of customers, so we can know how to serve
their need.”
Student11 told about her reason, “Because I like marketing and marketing is one
part of many kinds of business.”
Student04 expressed his reason, “Because I can use to apply in real life in human
resource management, recruit personnel to work in the organization.”
Student05 said that “Because I can practice human relationship and manage
efficiently human resource.”
75

Student06 answered in detail that “Because this major, human resource
management, manage about personnel who will come to work with us and we must
recruit people who have personality and property which appropriate with works that they
will do.”
Student07 told her reason, “I am interested in business administration and in
personnel management…in working.”
Student08 answer hesitatingly that “It is a subject that relates with business
administration…my family want me to study in the faculty of management sciences.” But
when the researcher asked to clarify why he chose this major, not the other major, he
answered with more confidence, “Oh, yes, because this major should manage on both
personnel and business.”
Instructor06 was in major finance too. She will be retired in the year 2011. She
was a teacher here since the early year of the faculty foundation. She always explained
everything in detail because “it is a spirit of teacher to explain clearly until students
understand.” She gave her reason “It was fashion in that period of time that learning in
finance will show potential of learner. So I learned [finance].”
Student12 answered why he studied in accounting “In the first time I was
interested in accounting, and I considered trend in the future…work…I considered first
that what I will want to do as my occupation in the future, and I also considered that I
have competency to study or not. I studied information first a little bit.”
Student14 answered, “Because people who graduated from this major can do
many varieties of jobs.” For the question that did she already planed what she will work
after she graduate, she answered that “about accounting, in a company.”
76

Instructor02 commented:
When I learn accounting, I found that I like it. I prefer accounting since I started
my first subject in accounting, Financial Accounting. I was interested and eager to
know, and I can make good score in that subject. I just found myself that I like
these subjects because subjects in accounting are about collecting data
systematically. There must be system that comes from good studying for a long
time. There are accounting systems that collecting data correctly and completely.
Instructor03 was a CPA and taught subjects that relate to accounting. About his
higher education, he answered:
I made up my mind to change track. Subjects that I wanted to learn are about
business administration. So I chose the most difficult of the business
administration track, which is accounting. Once I graduated in accounting, I have
freedom to do professional occupation.
Both instructor04 and instructor09 were in the major of human resource
management of the department of Public Administration. Instructor04 answered that
“First, I graduated from this major. They let we set ourselves into preferable group, I
graduated in human resource management, so I am in human resource management
major.”
Instructor09 said that she taught her courses because “the department assigned me
to teach, moreover, I learned about them. I learned about regional planning and about
community management, both urban and rural community. Moreover, about
constitutional law, I am interested in it and regularly follow it, so I have responsibility to
teach these subjects.”
77

What Students and Instructors Do Using Computers in General
All participant interviewed used computer in general for their work. Work for
students means doing any work instructors assign. Work for instructors means doing
anything related to their teaching. Only two instructors told about using a computer in
their other duties or administrative responsibilities. Only one student told about her part
time job using computer to earn some money with her team.
Indeed, communication and information searches were some parts of ordinary
work, but the main duties at work included typing, printing, presentation, and calculation.
Almost all the participants told about preparing assignments and presentation. The
university provided a website for submitting grades at the URL https://grade.psu.ac.th,
and all instructors must submit grades electronically using this web site including paper
results passed through the department head. While all instructors should use computer for
submitting grades, only Instructor02 and Instructor06 stated that they actually did it. The
university provided virtual classroom version 2 (VCR2), but users preferred to call it
VCR. Only two students and three instructors explicitly stated that they used VCR.
Work
All participants interviewed used computer in general for their work. Instructors
used the computer for preparing their teaching, which included preparing PowerPoint
slide presentations. Moreover, Instructor02 said, “I use Excel for keying in score and
calculate students’ grade.” Instructor06 also said, “We use computer for submitting
grades.” Instructor05 said, “Sometimes I use Excel for calculation about depreciation,
interest something like this. I use Word and Excel. For teaching I use PowerPoint. The
main things are these 3 programs that I usually use.”
78

They used computer for saving data such as reports, instructional materials, and
exams. Instructor06 gave a reason why she typed exams by herself:
In the past I asked typing officers to print them, I accepted in limitation that there
were many subjects and my handwriting was so scrawled. Having them read my
handwriting and I recheck whatever they typed… and sometimes they must type
again. Sometimes I had to inform students about corrections of exams in the
testing room. I had compassion with students that they should not be disturbed
with this thing. So it is very useful that I type exams by myself.
Saving files in computer made them feel more comfortable to work. They realized
in benefit of using computer. They could edit, delete, insert, or update texts without
difficulty. Instructor09 noted, “We can save so many papers”.
All students used Microsoft Word for their assignments. Student01 said that “I
almost used only ordinary Microsoft Office. But after I learned in information technology
management, I used Microsoft Access…databases…Swish Max…create questionnaires.”
Student13 said, “I do works, print works, and play the Internet, search for general
knowledge. I sometimes contact with friends, and I search information about…for
working.”
Extra Work
Besides using computer in teaching, some instructors who had administrative
team roles used computer for administrative work, too. Instructor08 said, “The second
work I do using computer is in administration… in receiving and sending varieties of
documents, or preparing varieties of information to help in making decision in
administrative team”.
79

Communication
Both students and instructors used computer for communication. They used both
e-mail and web board. Instructor01 said, “Some students may not feel comfortable to talk
with me in class. They can contact me via web board”. He said, “I told students the
deadline for submitting their works. Student can see the exercises and the set dead line
for each exercise”.
Instructor03 expressed his preferences, “I use it for checking e-mail and
communication with friends instead of using telephone through MSN”. Instructor07 said
that she “communicated to make appointment for additional class or calculation class,
talk with students”.
Instructors used also the computer for assigning students assignments via VCR2.
Instructor09 gave her opinion about virtual classroom that “we could post teaching
materials in computer and students came in to copy files something like that to use them
and they could learn backward”. From the first semester of the year 2008, there was no
more VCR2. But there was LMS@PSU instead. It was an MOODLE open source course
management system that PSU adopted to use in the university.
Students also communicate electronically with instructors, friends and relatives.
Student06 said that “I enter to look at web, read web, search more knowledge, and
sometimes talk with friends”.
Search Information
Using computer for communication and searching information came along
together. They searched for tools, equipment, materials other than textbooks. Instructor04
said that “I search the Internet, e-mail, e-mail [he stressed what he preferred to use most],
80

searching information and prepare [PowerPoint presentation] slides, prepare documents
for teachings, documents, and texts”. Instructor08 said that “in this time using computer
is connected with data communication, network, the Internet. Using computer can help us
know sources of information easily”. Instructor09 supported it that “sometimes the books
that we read are OK but we want to know that at present, what will be trend in the future
in the topics that we are teaching…what are new things happened”
Student03 whose experience with the computer started since he was in
kindergarten using Paint program for editing pictures said that “When I studied at the
sixth year of primary school, my father bought computer for me. I used it almost for
playing game, no any other work”. Time flew, his computer practices changed. He said
that “about in the last period of secondary school, I started to learn how to use the
Internet for searching information. I almost used Word. If there were assignments in
VCR, I entered VCR to see assignments. I almost searched information more than played
game”.
Entertainment
They expressed their thought that there were many interesting sources that did not
relate to their ordinary work, teaching or learning. Instructor08 informed that “I use
computer for recreation…entertainment…see movies…listen songs…or as a source for
novel something like that”.
Student02 used computer for his pleasure. He said that “sometimes I want to
know about stock. I play SetTrade… Click2Win too”.
Student07 described his experience, “umm…do reports, and … do reports for
presentation, and play games, and check mail, something like that”.
81

Student08 was the first student who told about playing games in the first inquiry.
He said “I use it for searching information and doing works, doing reports, or maybe
sometimes playing games for relaxation”.
Student09 also said, “I usually use for e-mail and for entertainment and games”.
Student10 was the third student who told about playing games in the first inquiry.
All three students who told about playing games in the first inquiry were males. While
student07, who did not talk about playing games in the first inquiry, told the researcher
that she played games after having conversation for a while, was a female. Student10 said
that he “search for works and play the Internet, talk with friends, play game, and listen to
songs”.
Point of View about CAI: What It Is
Instructors viewed CAI as a tool that helps the instructor in teaching, giving
lectures and making them more interesting. Instructors assigned students to search
information for given topics Students submitted their works using computer and then
instructors evaluated their works. It helped instructors to prepare for teaching, including
giving students assignments and information in advance. If students had questions in
contents or scores, they could communicate with instructors via e-mail, VCR, or web
pages.
Students viewed CAI like exercises or tests. They learned with computer and took
exams by using information that they learned with computer. Using CAI was easy, just
only clicking, or doing tiny duty like student01 said that “students just enter the
password. They can use any available computer, just enter password”. CAI helped
students learn many things and understood more. Students could do self study. Instructors
82

may record what they had taught in computer files and upload them to the Internet which
where students could retrieve those files. Moreover, computer use helped the instructors
to draw more students’ attention.
The Game
In this study, the game in FMS was students’ and instructors’ preferences in CAI,
concentrated in modes of CAI.
Modes of CAI that Instructor Liked Most
Most of instructors (3 of 9) liked CAI most in simulation. Most of instructors (3
of 9) liked CAI most in tutorial. One instructor decided not to declare which mode of
CAI she liked most (see Table 8).
Table 8
Modes of CAI Instructors Liked Most
Like Most Grand Total
drill and practice 1 instructional game 1 N/A 1 simulation 3 tutorial 3 Grand Total 9
Modes of CAI that Instructors Liked Least
One instructor decided not to declare which mode of CAI he liked least. He liked
CAI most in tutorial. Most of them liked CAI least in demonstration, instructional game,
and testing (see Table 9).
83

Table 9
Modes of CAI Instructors Liked Least
Like Least Grand Total
Demonstration 2 Instructional game 2 N/A 1 Simulation 1 Testing 2 Tutorial 1 Grand Total 9
Modes of CAI that Students Liked Most
Half of the students (7 of 14) like CAI most in drill and practice (see Table 10).
Table 10
Modes of CAI Students Liked Most
Like Most Grand Total
Drill and practice 7 Instructional game 2 Simulation 3 Tutorial 2 Grand Total 14
Modes of CAI that Students Liked Least
The first three modes of CAI that students liked least are tutorial, simulation, and
demonstration respectively. More than four tenth of students (6 of 14) liked CAI least in
tutorial (see Table 11).
84

Table 11
Modes of CAI Students Liked Least
Like Least Grand Total
Demonstration 2 Problem solving 1 Simulation 3 Testing 2 Tutorial 6 Grand Total 14
The Calendar
FMS has a semester schedule. Indeed there are two academic calendars: ordinary
calendar for all programs except BBA program, and calendar for BBA program. Both
calendars have a semester schedule. For BBA, the first semester is from August to middle
of December and the second semester is from January to middle of May. For an ordinary
program, the first semester is from June to September and the second semester is from
November to February. There are 16 weeks for each semester. The Midterm exam is on
the eighth week and the final exam is after the sixteenth week.
Summary
This chapter presented the descriptions of FMS, which emphasizes the workplace
contexts, FMS participation, CAI practices, and CAI preferences. All participants used
computers in doing work. Instructors’ work included teaching materials and students’
exercises. Students’ work included instructors’ assignments. Only nine of the twenty-
three participants used the computer for entertainment. Editing files with a computer is
easier than with paper. The participants could insert, delete, or update texts easily.
Instructors viewed CAI as a tool, while students viewed it like exercises or tests. Modes
85

of CAI that instructor liked most were simulation and tutorial. Students liked drill and
practice most, the latter was simulation. The mode of CAI that students liked least was
tutorial. In the following chapter, the perceptions of students and instructors will be
viewed through the lens of Douglas’s (1982) grid and group typology.
86

CHAPTER V
DATA ANALYSIS
The purpose of the study was to use Douglas’s typology to explain the educational
culture of the Faculty of Management Sciences (FMS) at PSU, to describe the students’
and instructors’ preferences about CAI in FMS, and to describe CAI practices in FMS.
In an effort to get a holistic picture of students’ and instructors’ practices and
preferences in CAI, a case study research strategy was utilized. The study was limited to
one setting; however, it provided adequate information to accurately assess the culture.
The words of students and instructors portrayed their practices and preferences in CAI
and assisted in understanding the goals, roles, responsibilities, and requirements of
students and instructors of FMS.
The previous chapter provided the descriptions of students’ and instructors’
practices in CAI, which was developed from the survey, interviews, observations, and
relevant documents. The questionnaires used for surveys, Thai versions of grid and group
cultural preference tool for students (Appendix D) and for instructors (Appendix F), were
utilized as a preliminary data source to assist in determining the grid and group typology
of both groups. The questionnaire was adapted from the survey instrument constructed by
Harris (2005).
87

According to Douglas’s terminology, the overall structure of PSU can be
categorized as a strong-grid and low-group (Bureaucratic) environment. The high-grid
environment is clearly seen from the university administration system. There are five
campuses of PSU where the president’s office is in the main campus. Other four
campuses are administered by vice presidents appointed by the president. The vice
presidents share some authority to handle certain affairs but a report should appear on the
president’s desk. In many cases the president makes the final decision. The
administration of the president however is under the guide and supervision of the
university council.
The whole administration in the organization is guided by the PSU Act which
explicitly states the authority of each position and boundary of the administration. It is
obvious that there are multiple layers of administration ranking from the section office,
department, faculty, campus, and university levels. This is a hierarchical administration
system. The formal communication is only through written and official letters. For
example, it takes several days or even weeks for a piece of letter from one faculty
member to arrive to the president’s desk.
PSU administration system, ranking from the top to departments, has a clear chain
of command and rules. Job titles and descriptions are highly important. Faculty members
are considered as final experts in instruction. A top-down communication flow with
formal written and explicit letters is mainly practiced. Achievement of students is only
measured by time and final outcomes. All are bounded with Thai hierarchical culture.
Figure 7 illustrated the grid and group typology categorizing the working culture of PSU.
88

high grid
low grid
low group high group
Bureaucratic Environment Hierarchical structure Faculty = instructional experts Formal communication system Multiple campuses
Individualist Environment
Corporate Environment
Collectivist Environment
Figure 7. PSU grid and group typology.
In this study to assure the results about cultural contexts, the researcher used two
methods. In the first method, the researcher followed Harris’s (2005) “scoring
procedures” (p. 72) and “plotting procedures” (p. 76). The researcher used the mean of
each grid item as a grid score for each participant, and used the mean of each group item
as a group score of each participant, then plotted the clustered points. After conducting
this analysis, the cultural context quadrants could be easily determined.
The second method emerged after reading about each item of each assessment tool
in Harris (2005):
For each item, there is a continuum of one to eight (1-8). The number one (1)
signifies the weakest level of analysis, or extreme “low,” and the number eight (8)
89

represents the strongest level, or extreme “high.” The intermediate numbers (2-6)
provide a continuous scale between these extremes.(p. 72)
To differentiate clearly between low grid response items and high grid response
items and to obviously discriminate between low group response items and high group
response items, the researcher modified the scores on both grid and group continuums:
(a) score 1, 2 and 3 were considered as Low (b) score 4 was considered as Mid Low (c)
score 5 was considered as Mid High (d) score 6, 7 and 8 were considered as High.
The Information from the first method showed that FMS students’ preferred
cultural context was Collectivist (low grid and high group). FMS instructors’ preference
cultural context was also Collectivist (low grid and high group).
The Information from the second method for students was grid items frequently
indicating low grid, and group items frequently indicating high group from the survey
results. The researcher concentrated only on low grid and high group because the results
from the first method showed that FMS students’ prefered cultural context was
Collectivist (low grid and high group).
The Information from the second method for instructors was grid items frequently
indicating low grid, and group items frequently indicating high group from the survey
result. The researcher concentrated only on low grid and high group because the results
from the first method showed that FMS instructors’ preference cultural context was
Collectivist (low grid and high group).
The researcher counted the frequency of the low scores (score 1, 2 and 3) for grid
and high score (score 6, 7 and 8) for group from students’ data. The researcher calculated
percentage. Only the items with percentage greater than 50 were considered. After sorting
90

them by descending order, the researcher knew which items frequently indicated low grid
and high group for students.
The researcher counted the frequency of the low scores (score 1, 2 and 3) for grid
and high score (score 6, 7 and 8) for group from instructors’ data. The researcher
calculated percentage. Only the items with percentage greater than 50 were considered.
After sorting them by descending order, the researcher knew which items frequently
indicated low grid and high group for instructors.
The presentation of analysis was divided into the following:
1. FMS students, which included:
(1) FMS students’ survey results
(2) FMS students’ work environment (Playing Field and Players)
(3) FMS students’ practices and preferences in CAI (Rule of the Game and
the Game)
(4) FMS students’ time (Calendar)
(5) Grid and Group summary of FMS students
2. FMS instructors, which included:
(1) FMS instructors’ survey results
(2) FMS instructors’ work environment (Playing Field and Players)
(3) FMS instructors’ practices and preferences in CAI (Rule of the Game and
the Game)
(4) FMS instructors’ time (Calendar)
(5) Grid and Group summary of FMS instructors
91

The survey results would be primarily discussed for FMS students and instructors
to have clear picture about their grid and group category. The following presentation will
be on the schools’ culture, in Lingenfelter’s (1996) format, focusing on the social context
which included:
(1) The playing field (FMS physical resources)
(2) The players (FMS students and instructors participated in the case)
(3) The rules of the game (relationships between and among players in the
playing field)
(4) The game (FMS students and instructors practices and preferences in CAI)
FMS Students
FMS Students’ Survey Results
A total of 133 out of 2270 (5.86%) FMS students answered the survey. From the
clustered points, there were 92, 28, 11, and 2 students in the collectivist, corporate,
individualist, and bureaucratic quadrants respectively, which were 69.17%, 21.05%,
8.27%, and 1.50% respectively (see Figure 8).
Figure 8. Clustered points of FMS students.
92

Grid continuum. Most of the students’ responses were in the low grid category
(score 1, 2 or 3). The following table showed only the percent greater than 50% of
students who answered in low grid category and the corresponding number of grid item
(see Table 12).
Table 12
Grid Item Number and Percent of Students in Low Grid Category
Grid Item # Percent 4 69.9 5 67.7 6 66.2 3 52.6 9 52.6 10 51.9
The questions frequently indicating low grid included the following items:
Item # 4 - I prefer a work atmosphere where individual teachers have:
full autonomy in generating their educational goals.
Item # 5 - I prefer a work atmosphere where individual teachers have:
full autonomy in choosing instructional methods/strategies.
Item # 6 - I prefer a teaching and learning atmosphere where students are:
encouraged to participate/take ownership of their education.
Item # 3 - I prefer a work atmosphere where teachers have:
full autonomy in textbook selection.
Group continuum. Most of the students’ responses were in the high group
category (score 6, 7 or 8). The following table showed only the percent that greater than
93

50% of students that answered in high group category and the corresponding number of
group item (see Table 13).
Table 13
Group Item Number and Percent of Students in High Group Category
Group Item # Percent 10 88.7 11 87.2 1 82.7 3 79.7 7 75.9 2 74.4 9 74.4 12 74.4 6 67.7 13 67.7 4 65.4 8 64.7 5 63.9
The questions frequently indicating high group included:
Item # 10 - I prefer a work atmosphere where educators and students have:
much allegiance / loyalty to the school.
Item # 11 - I prefer a work atmosphere where responsibilities of teachers and
administrators are:
clear / communal with much accountability.
Item # 1 - I prefer a work atmosphere where instructional activities are initiated /
planned by:
all educators working collaboratively.
Item # 3 - I prefer a work atmosphere where intrinsic rewards primarily benefit:
94

everyone at the school site.
Item # 7 - I prefer a work atmosphere where curricular goals are generated:
collaboratively
Item # 2 - I prefer a work atmosphere where socialization and work are:
incorporated / united activities.
FMS Students’ Work Environment (Playing Field and Players)
Grid considerations. There were few formal specialized roles and regulations.
Students were encouraged to take ownership in their own education. For example,
student06 mentioned about his work that he did in a group with his friends for human and
social course when they used a program for editing video. He said, “My friends had
responsibilities in doing it”. He told details of his work, “Some parts of contents came
from books, the other parts came from collecting data by ourselves, from the real place,
the real event, for example event about game shops, we went to take photographs of
game shops. We assigned work [in our group] that who will do which part”. There were
about six to seven students in each group. These sentences supported an argument that
FMS students’ cultural context was low-grid and high-group.
Group considerations. Individual behavior was subject to control exercised in the
name of the group. For example student03 expressed a high group characteristic when he
told the reason why he studied in marketing major “in that time I think that I would not
come to take exam here because I would like to take exam at ABAC. But my friends
applied to take exam here so I tried the exam too. The only thing I knew was for PSU, the
faculty of management sciences is famous and this track is related to the track I learned,
the art track.” Finally, he studied at FMS because “in my deep heart, I want to be in
95

Hatyai more than Bangkok.” Hatyai was his hometown. He added more reason why in
the first time he wanted to take exam at ABAC in Bangkok because he wanted to practice
English even though “I wanted to be in Hatyai more than Bangkok.” His story should
represent high group. Perpetuation of corporate goals and group survival was also
important.
FMS environment was a good example of a high-group social system that
organized and managed all resources for the benefit of students. Student01 compared
using computer at the faculty to the ones at the computer center “using computer at the
faculty is more convenient.”
Harris (2005) stated, “Strong-group environments are typically replete with
prominent signs that display member allegiance” (p. 38). FMS had a motto. It was
“management science is a pride.” There was a sign in the vinyl hung on a pathway to a
classroom building 1 inviting students to dress in FMS uniform. There was a sign made
from wood that anyone who came to FMS administrative building from the west side will
see from the first step he or she came in. Content in that sign was the same as in the vinyl.
This motto appeared in the website of FMS student affairs unit too. These sentences
supported the evidence that FMS students’ cultural context was high-group.
FMS Students’ Practices and Preferences in CAI (Rules of the Game and the Game)
Grid considerations. The game, as described in this study, was students’ and
instructors’ practices and preferences in CAI. Harris (2005) stated, “At the low, or weak,
end of the grid continuum, teachers experience much more independence and employ
considerable freedom in choosing curriculum, texts, and methods” (p. 35). Student01
expressed the “freedom” of studying in law course. The instructor gave URLs that
96

students could visit to study but it depended on students themselves whether they would
go to visit that web site. Student01 admired this instructor. She preferred his teaching
when students were motivated more by self-defined interests:
It looked like students read book and answer question concurrently… at least
students already scanned contents. He taught like… he did not talk out off the
contents so much… even though he might talk out off track but still in the main
contents… he gave examples about laws that relate with whatever really
happened in social… current issues… argument cases…politics…he had ability to
give examples that relate with laws so students could understand more.
Harris (2005) noted that educational spaces “can take multiple forms, including
the home and community, classrooms, laboratories, sports fields, gyms, auditoriums,
cafeterias, band halls, and playgrounds, as well as the virtual environment of cyberspace”
(p. 67). FMS provided variety of educational spaces for students. They could use
computer labs from 8:00 am to 10:30 pm if no instructors used them for teaching. There
were four computer labs the students could use. The Students who have their own
computers could connect to the internet using PSU wireless network on the first floor of
classroom building 1 and the first floor of classroom building 2. This “freedom” of
studying environment gave the clear evidence for low grid cultural context.
In low-grid environment, people were motivated to join in activities by self-
defined interest (Harris, 2005). Instructor09 answered the question about her students to
posting on the web board as follows:
I did not force them but I encouraged them to do. I told them that this was a way
of communication. Sometimes we read or are interested in any issue, especially in
97

public administration; different people can think in different ways in the same
issue…politics…policy…or region development tendency. I told them that they
must respect in the other’s opinion and they must listen to the other’s idea. Indeed
it is good in this part that they can listen to the other’s idea. Democracy means
everyone has freedom in speaking, in thinking…but this is the principle, everyone
is equal. But in practical, how can we do that because in Thai culture there is
structure…patronizing system…seniority and youth…it is overlapped…if
students remove this thing away they can have more freedom in thinking and
expressing their ideas.
These combined activities provide good evidence for a low-grid, high-group
environment for FMS students.
Group considerations. A high group context was strongly represented in students’
practices and preferences in CAI. Students06 told about his presentations in “Science…
that I must present. And sociology…These two subjects are almost subjects that I must
present works. For another subjects, I must do reports as volumes…anything that are
fixed and have no enough time to present in the class, for example, economics can not be
presented in front of the class, because there are many students enrolled in the same
section”. He always presented as group work. There were about 80 to 150 students
enrolled in that class. So there were about 10 to 15 groups.
In strong-group environment, the school calendar had much influence over
activities. In the first week of each semester, students did not spend their time much in
computer labs. But in about four weeks before the final exam, they spent more time in
computer labs because they had many assignments from the courses to submit. There
98

were more students working both in groups and individually until the close time of the
labs, which evidenced a strong group environment.
FMS Students’ Time (Calendar)
Grid considerations. FMS academic calendar is fixed with PSU calendar. There
are two ordinary semesters. The first semester is around June to September. The second
semester is around November to February. Each year the PSU registration unit was
responsible to announce the exact start and end date of each semester.
Learning does not mean that the students should only sit and listen whatever
knowledge instructors conveyed in classes. Having some time to join the university
activities is part of learning in the university too. So, PSU specified that all PSU
undergraduate students must have at least 60 hours attending PSU activities all four years
of their study. However, they can attend any activity, any time they prefer. Students can
start searching for PSU activities and recording their activities at
http://student.psu.ac.th/ts2 or they may prefer starting from website which provides news
from PSU student affair unit. Its URL is http://student.psu.ac.th/news/
FMS students are PSU students. So they have responsibility to attend at least 60
hours of PSU activities as any other students. They also have freedom to attend any
activity at any time that they prefer. What they really practiced in the past was they tried
to complete this responsibility in the first two years of their studies. They planned to
study hard in the last two years. They planned to have training or internship at the end of
the third year. They planned to be job seekers at the end of the fourth year. Considering
from their freedom to attend any activity at any time they prefer, this is evidence of low
grid environment.
99

Group considerations. FMS provides many activities appropriate to students’
status every year. For the first-year student, there is orientation. This activity is managed
by the student affairs unit. The Dean and all available staff, including all available
instructors join this activity. Students are important “actors” in this activity. The Dean
gives some advice. Finally, there is a sacred parade performed by representative students.
Most of the representative students work in committees in FMS student association. The
smiling leading student holds the sign made from wood with the name of FMS in Thai.
The following student holds the FMS flag. Two students hold a frame with a picture of
Prince of Songkla. Four students carry a wood-frame. There are eight students in the last
group. Each of them holds the FMS flag. They play a PSU song and FMS song along the
parade too. This activity strengthens students’ allegiance to the university and the faculty.
Some part of the song stated, “To join the same blood, Songkla Nagarind.” Some part
avowed clearly about their faithfulness, “We will have loyalty. We will cooperate to do
good things.”
One of activities for the first-year students is teacher adoration day. It is another
sacred ceremony. Students decorated their pair of trays. Male students hold candles and
joss sticks trays. Female students hold flower trays. They create and decorate a new style,
new design every year. This activity gives students opportunity to display their respect to
their teacher. Students from FMS Thai music club have an opportunity to show their
potential in this day. They play Thai musical instruments while each group of students
gives their decorated trays to teachers. Each group of students almost comes from each
major or each program.
100

In the beginning of the teacher adoration day ceremony, all committees of old
FMS student association will be given certificate for their work. There is an election for
FMS student associations every year. Any group who wants to be the winner in the
election must work well in group enough to win. After the ceremony, there will be
announcements which pair of trays get the first, second and third prize. There are the
other kinds of prizes too. Any group who wants to be the winner in competition must
work well in group enough to win. These activities support the evidence that FMS is in
high-group environment.
Grid and Group Summary of FMS Students
In summation, FMS students’ practices and preferences in CAI were:
(1) A low grid/high group work environment (collectivist)
(2) Individual student’s identification was derived from group membership
(3) There were few formal specialized roles and regulations
(4) An inclusive, team approach to assignments
(5) Working cooperatively for group was important
The categorizing of FMS students in Douglas’s grid and group typology was
presented in Figure 9.
101

Figure 9. FMS students’ grid and group typology.
FMS Instructors
FMS Instructors’ Survey Results
A total of 39 out of 62 (62.90%) FMS instructors answered the survey. From the
clustered points, there were twenty six, ten, three, and zero instructors in collectivist,
individualist, corporate, and bureaucratic quadrant respectively, which were 66.67%,
25.64%, 7.69%, and 0.00% respectively (see Figure 10). It should be noted that while
some instructors and students were individualist, the significant cultural bias of students
and instructors was collectivist.
102

Figure 10. Clustered points of FMS instructors.
Grid continuum. Most of instructors’ responses were in low grid category (score
1, 2 or 3). The following table showed only the percent greater than 50% of the
instructors who answered in low grid category and the corresponding number of grid item
(see Table 14).
Table 14
Grid Item Number and Percent of Instructors in Low Grid Category
Grid Item # Percent 5 94.9 4 92.3 3 84.6 6 84.6 9 69.2 10 69.2 1 61.5
The questions frequently indicating low grid included:
Item # 5 - I prefer a work atmosphere where individual teachers have:
full autonomy in choosing instructional methods/strategies.
103

Item # 4 - I prefer a work atmosphere where individual teachers have:
full autonomy in generating their educational goals.
Item # 3 - I prefer a work atmosphere where teachers have:
full autonomy in textbook selection.
Item # 6 - I prefer a teaching and learning atmosphere where students are:
encouraged to participate/take ownership of their education.
Group continuum. Most of the instructors’ responses were in the high-group
category (score 6, 7 or 8). The following table showed only the percent greater than 50%
of instructors that answered in high group category and the corresponding number of
group item (see Table 15).
Table 15
Group Item Number and Percent of Instructors in High Group Category
Group Item # Percent 11 84.6 10 76.9 2 66.7 7 61.5 1 56.7 3 56.4 6 56.4 9 53.8 8 51.3 12 51.3
The questions frequently indicating high group included the following items:
Item # 11 - I prefer a work atmosphere where responsibilities of teachers and
administrators are:
clear / communal with much accountability.
104

Item # 10 - I prefer a work atmosphere where educators and students have:
much allegiance / loyalty to the school.
Item # 2 - I prefer a work atmosphere where socialization and work are:
incorporated / united activities. .
Item # 7 - I prefer a work atmosphere where curricular goals are generated:
collaboratively
Item # 1 - I prefer a work atmosphere where instructional activities are initiated /
planned by:
all educators working collaboratively.
Item # 3 - I prefer a work atmosphere where intrinsic rewards primarily benefit:
everyone at the school site.
FMS instructors’ Work Environment (Playing Field and Players)
Grid considerations. Many of the instructors had the freedom to establish their
own work goals and activities. For example, instructor04 told the reason why he changed
his slides that he used in the past:
One…the contents were changed. One…about teaching, I started from knowing
nothing to teach…molding from nothing, thinking that what contents I should set
them in this subject. I gradually modify what I do in the first round. It did not
mean that whenever you accept to teach any subject you will already had all
information needed immediately. After the first round, I already taught that
subject till the end of the semester, I found that there still were some drawbacks. I
could not find slides…or I could not find contents in time. Then I thought that
next time I must improve some parts. So I must teach at least three times before I
105

had a clear picture that what contents of each subject will looks like. Having
taught three rounds…three years, I must spend time for ordering and improving
contents and slides. After teaching for three years, some teacher was absent, some
teacher was transferred, [there was no one to teach in some subject, so] I must
throw away the old subject I taught to teach the new subject. The subjects that I
teach are not fixed. For example, Arjarn Ray go to study, I must start my first step
with organization theory. I had to imagine that what I will teach. Start from only
three lines of course description. I had to elaborate it to be solid contents. As I
told you, I prepare in the morning to teach at noon…prepare in the morning to
teach at noon.
Group considerations. Individual behavior was subject to controls exercised in
the name of the group. Instructor04 had the freedom to establish his own work goals and
activities (low grid), but he still maintained a communal mindset (high group). He
showed his flexibility when he told about the new subject which he was assigned to
teach:
I used to teach evaluation. They said that ‘you are a new teacher, so you teach this
subject’. [Indeed he taught for about 11 to 15 years, but he just returned from
leaving to study in Doctoral degree]. So I taught new subject. Indeed I…I taught
old subjects repeatedly. So I thought that teaching new subject was good as well.
But [drawback was that] I had to start the first step [for new subject] again.
FMS Instructors’ Practices and Preferences in CAI (Rules of the Game and the Game)
Grid considerations. The game, as described in this study, was the students’ and
instructors’ practices and preferences in CAI. In low-grid environments, teachers have
106

full autonomy in textbook selection. Instructor07 told about the book and teaching
material which she used for master’s degree students. She bought a package from a
publisher which provided the convenience tools. She said “there are CDs of PowerPoint.
We need not to prepare them. They are beautiful. Exercises also provided”.
There was another evidence of low-grid environment. In low grid environments,
people are motivated to join in activities by self-defined interest (Harris, 2005). FMS
instructors could attend any training the faculty provided for them based on their
interests.
Group consideration. In high-group environment, instructors and students have
much allegiance / loyalty to the school. Instructor06 expressed her gratitude in trainings
set by the faculty. She took many benefit attending that training, “I joined that training
and knew how to use e-mail and how useful it was”. She articulated her impression, “I
created PowerPoint even though I had no basic in typing”. She has much loyalty to FMS.
She worked at FMS for a long time and will get retired in a couple of year. But she still
keeps on updating her teaching material. She enjoys having training, if FMS will provide.
“I like it. If I have time, I will not miss any training.”
FMS Instructors’ Time (Calendar)
Grid considerations. There is a general rule that each instructor must sign a paper
every working day. FMS officer append paper in a signature file each day. However,
instructors prefer to wait for a while (every week, every month, or every semester for
some instructors) and sign them in the same time. As long as they do their job well, the
FMS administrative team does not want this little thing to obstruct core accountability.
This is evidence that FMS is low-grid environment.
107

Group considerations. In the same time that students work in group, instructors
work in group too. They join in FMS orientation for the first-year students. They join in a
teacher adoration day for the first-year students. They join in meetings for training or
internship of the third-year students. They join a job seeker day for the fourth-year
students. They keep traditions, for example, Songkran festival. Songkran is a Thai
traditional New Year. It starts on April 13 every year and lasts for 3 days. It is also
known as the water festival because people believe that water will wash away bad luck.
So, the younger people will express their respect to the older people by pouring scented
water onto the hands of the older people. The older person will bless the younger people
to have good luck and prosperity. Ordinary Songkran festival is on April 13. It is a
holiday. People always go back to their home towns to express their respect to their
parents. So, FMS set Songkran festival for FMS people on the working day before April
13. Even though just only the available instructors join each activity, not all instructors,
this is evidence that FMS is high-group environment.
Grid and Group Summary of FMS Instructors
In summation, FMS instructors’ practices and preferences in CAI were:
(1) A low grid/high group work environment (Collectivist)
(2) Individual instructor’s identification was derived from group membership
(3) There were few formal specialized roles and regulations
(4) An inclusive, team approach to assignments
(5) Working cooperatively for group was important
The categorizing of FMS instructors in Douglas’s grid and group typology is
presented in Figure 11.
108

Figure 11. FMS instructors’ grid and group typology.
Based on interview, observation, and document analysis, FMS as a whole
appeared to be in collectivist (low-grid, high-group) school social environment.
Moreover, their practices in CAI most closely looked a lot like collectivist environment
too. Therefore, there was a match between the school social environment and its practices
in CAI. FMS administrative team gradually developed the faculty. Because there was a
match between the school social environment and its practices in CAI, it should be
implied that they took the right track for CAI development in FMS. Figure 12 illustrated
FMS grid and group typology for school social environment. Figure 13 illustrated FMS
grid and group typology for CAI practices.
109

high grid
low grid
low group high group
Bureaucratic Environment
Individualist Environment
Corporate Environment
Collectivist Environment Decentralized power and authority Instructors experience much more
independence Lateral coordination schemes that are
informal and flexible Strong allegiance to school Strong social incorporation Global linkages
Figure 12. FMS grid and group typology for school social environment.
high grid
low grid
low group high group
Bureaucratic Environment
Individualist Environment
Corporate Environment
Collectivist Environment Virtual environment of cyberspace Instructors employ considerable freedom
in choosing curriculum, texts, and methods Students’ academic achievements are
important sources of pride to the whole school
Teamwork is important Decision making is governed largely by
group consensus
Figure 13. FMS grid and group typology for CAI practices.
110

Comparison and Contrast of FMS Students and Instructors
This study looked at the organizational cultures and practices and preferences in
CAI of FMS students and FMS instructors. Based on the data, both FMS students and
FMS instructors were categorized as collectivist culture according to Douglas’ (1982)
grid and group typology. They were in the low-grid/high-group quadrant. The obvious
similarities were in their overall cultural context. Their differences were percentage of
participations in each step. Even though there was a small number of students who
participated in the survey stage, there was a rather high percentage of students from the
survey stage who agreed to join the interview stage. Table 16 presented the statistical
comparison of FMS students and FMS instructors.
Table 16
Statistical Comparison of FMS Students and Instructors
Total Survey Responses
% of Survey
Responses
Agree for
Interview
% of Agree
for Interview
Culture
Students 2270 133 5.86 96 72.18 Collectivist Instructors 62 39 62.90 20 51.28 Collectivist
Modes of CAI that Instructor Liked Most by Cultural Contexts
No instructor was in the bureaucratic quadrant. One third of the instructors (3 of
9) liked simulation the best. Most of the collectivist instructors (3 of 4) liked simulation
the best. It was obvious from the findings that only one corporate instructor liked
instructional game the best, and only one collectivist instructor liked drill and practice the
best. A corporate instructor liked instructional game and tutorial the best. One female
111

individualist decided not to declare which mode of CAI she liked most. She liked least in
tutorial the least. She was an accounting major (see Table 17).
Table 17
Modes of CAI Instructors Liked Most by Cultural Contexts
Like Most Collectivist Corporate IndividualistGrand Total
Drill and practice 1 0 0 1 Instructional game 0 1 0 1 N/A 0 0 1 1 Simulation 3 0 0 3 Tutorial 0 1 2 3 Grand Total 4 2 3 9
If only one mode of CAI should be provided, it should be simulation that
instructors like most. Especially, all interviewed collectivist instructors liked simulation
most. The number of instructors who liked tutorial most may be equal to the number of
instructors who liked simulation, but their cultural context was not the overall FMS
instructor cultural context, which was collectivist.
Modes of CAI that Instructor Liked Least by Cultural Contexts
Only collectivist instructors liked instructional game the least. Half of them (2 of
4) liked CAI least in instructional game. It was apparent that only corporate instructor
liked CAI least in simulation. One of them liked CAI least in testing and one of them
liked CAI least in simulation. It was further apparent that only individualist instructor
liked CAI least in tutorial. One male individualist decided not to declare which mode of
CAI he liked least. He liked most in tutorial. He was in human resource management of
department of public administration. It was surprising that male individualist liked CAI
most in tutorial and decided not to declare which mode he liked least, while female
112

individualist liked CAI least in tutorial and decided not to declare which mode she liked
most (see Table 18). This remark was evidence to support that they were individualists
who showed obviously their own high individual autonomy.
Table 18
Modes of CAI Instructors Liked Least by Cultural Contexts
Like Least Collectivist Corporate IndividualistGrand Total
Demonstration 1 0 1 2 Instructional game 2 0 0 2 N/A 0 0 1 1 Simulation 0 1 0 1 Testing 1 1 0 2 Tutorial 0 0 1 1 Grand Total 4 2 3 9
The data supported the idea about appropriate CAI mode for FMS instructors that
it should be simulation because only one corporate instructor liked CAI least in
simulation. The other instructors liked the other modes of CAI the least.
Modes of CAI that Students Liked Most by Cultural Contexts
Half of the students (7 of 14) like drill and practice the best. Most of the
collectivist students (3 of 5) like simulation the best. Most of the corporate students (3 of
5) like most drill and practice (see Table 19).
Table 19
Modes of CAI Students Liked Most by Cultural Contexts
Like Most Bureaucratic Collectivist Corporate Individualist Grand Total
Drill and practice 1 1 3 2 7 Instructional game 0 0 1 1 2 Simulation 0 3 0 0 3 Tutorial 0 1 1 0 2
113
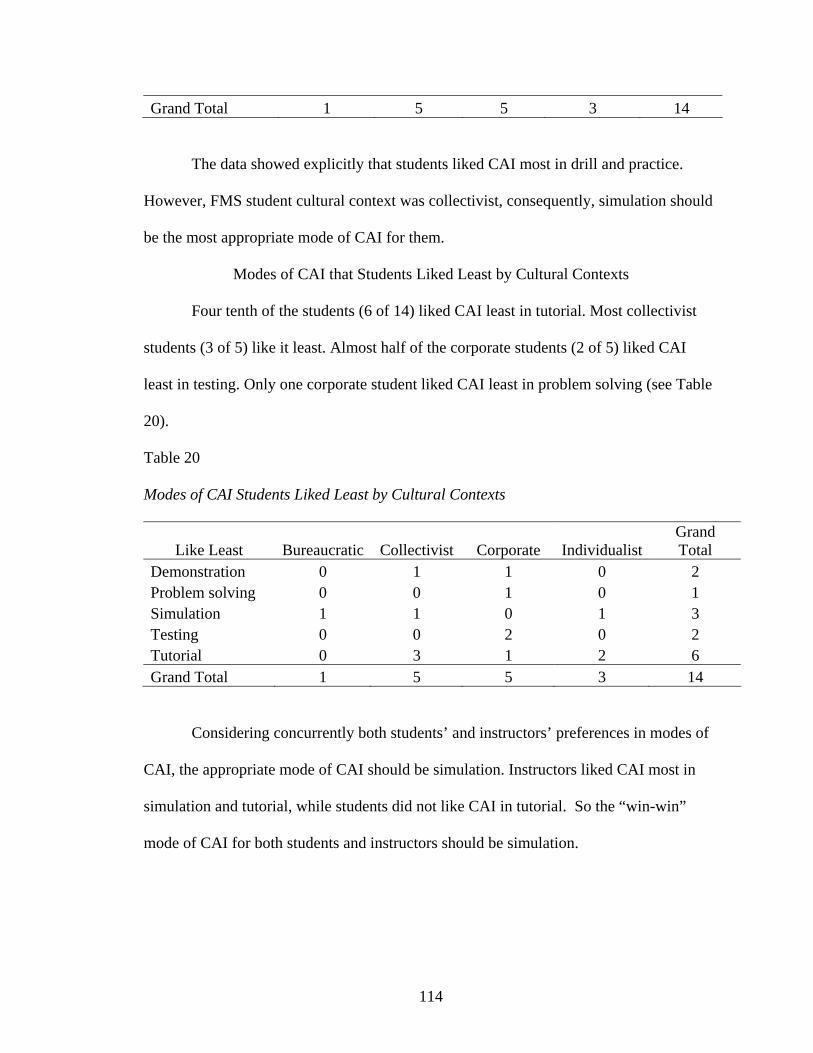
Grand Total 1 5 5 3 14
The data showed explicitly that students liked CAI most in drill and practice.
However, FMS student cultural context was collectivist, consequently, simulation should
be the most appropriate mode of CAI for them.
Modes of CAI that Students Liked Least by Cultural Contexts
Four tenth of the students (6 of 14) liked CAI least in tutorial. Most collectivist
students (3 of 5) like it least. Almost half of the corporate students (2 of 5) liked CAI
least in testing. Only one corporate student liked CAI least in problem solving (see Table
20).
Table 20
Modes of CAI Students Liked Least by Cultural Contexts
Like Least Bureaucratic Collectivist Corporate Individualist Grand Total
Demonstration 0 1 1 0 2 Problem solving 0 0 1 0 1 Simulation 1 1 0 1 3 Testing 0 0 2 0 2 Tutorial 0 3 1 2 6 Grand Total 1 5 5 3 14
Considering concurrently both students’ and instructors’ preferences in modes of
CAI, the appropriate mode of CAI should be simulation. Instructors liked CAI most in
simulation and tutorial, while students did not like CAI in tutorial. So the “win-win”
mode of CAI for both students and instructors should be simulation.
114

Summary
The grid and group typologies associated with FMS students and instructors were
apparent. According to Douglas’ (1982) grid and group typology, both FMS students and
FMS instructors could be identified as a collectivist culture. For the grid consideration,
both FMS students and FMS instructors were placed low in the continuum. For the group
consideration, both FMS students and FMS instructors were placed high in the
continuum. From the information shown, FMS as a whole should be identified as a
collectivist culture.
Most participants were in the collectivist quadrant of cultural context. From 133
students who answered the grid and group cultural preference tool, there were 92
collectivist, 28 corporate, 11 individualist, and 2 bureaucratic students. From 39
instructors who answered the grid and group cultural preference tool, there were 26
collectivist, 10 individualist, and 3 corporate instructors. No instructor was in a
bureaucratic cultural context. It was apparent that participants in different cultural
contexts preferred different modes of CAI.
The grid and group typology was very useful in describing the cultural context of
FMS students and instructors. Moreover, the typology was broad enough to identify
appropriate patterns of CAI to be developed for FMS considered from FMS culture. In
the next chapter, implication and further explanation of students and instructors
preferences were presented.
115

CHAPTER VI
FINDINGS, CONCLUSIONS, IMPLICATIONS, & RECOMMENDATIONS
Although computer assisted instruction (CAI) is becoming increasingly popular,
there are still questions about its appropriateness and whether it is an effective strategy in
all situations. While a number of explanations may address this dilemma, one reason for
the varying results in CAI effectiveness can be explained through Douglas’s (1982) grid
and group typology.
This qualitative case study used Douglas’s typology. The participants in this case
study included students and instructors from the Faculty of Management Sciences (FMS)
at Prince of Songkla University (PSU). Multiple qualitative methods, including survey,
interviews, observations, and document analysis, were used for data collection. The
purposes of data collection and analysis were to characterize each person within the
cultural contexts presented in Douglas’ (1982) grid and group typology, present the data
findings in reference to the framework and literature, and specifically answer the research
questions.
In some stages of the research, data analysis and data collection occurred
simultaneously. Data were triangulated by multiple sources, such as questionnaire
responses, interview transcripts, observation field notes, and documents. Peer review
116

techniques were also used to ensure trustworthiness, as the researcher allowed other peer
researchers to review the final data presentation.
The purpose of this study was to answer the following questions:
1. How does Douglas’ (1982) grid and group typology explain the educational
culture of the FMS at PSU?
2. What are students’ and instructors’ attitudes toward CAI?
3. What is the interrelationship of CAI practice and educational preferences
among students and faculty?
4. How useful is Douglas’ (1982) grid and group typology in understanding this
interrelationship?
5. What other realities are revealed in this study?
Findings to these questions are summarized in the following section.
Summary of Findings
The first research question asks “How does Douglas’ (1982) grid and group
typology explain the educational culture of the FMS at PSU?” PSU is predominantly a
strong grid institution. Explicit rules and roles are necessary to manage a large
comprehensive university with several campuses. PSU has both high and low group
characteristics; however, the dominant low-group characteristics place it more in the
bureaucratic (high-grid/low-group) than the corporate (high-grid/high-group) category.
As explained in chapter V, both FMS students and FMS instructors are mostly collectivist
(low-grid/high-group) in the approach to their work and activities as well as their cultural
preferences. Both actions and preferences are important to understand, as Kogan (1988)
stated that “people’s actions are based on a connection between how they think they
117

ought to behave and what they ought to aim towards, and how they feel about themselves
and what they want” (p. 94).
From the beginning of the study, the researcher found indications of collectivist
cultural traits. For example, when asking permission to contact participants, the Dean
advised the researcher to contact instructors directly, rather than going through the
bureaucratic structure. She suggested that the survey response rate should be high enough
if the researcher contacted instructors straightforwardly. The Dean did not want to send a
note to participants, because she felt the top down communication might cause them to
question the research. This supports Harris (2005) view that collectivist contexts are
characterized by lateral coordination schemes that are informal and flexible, and that
hierarchical schemes are questionable to collectivist cultural members.
FMS’s collectivist culture promotes cohesiveness and helps maintain values and
standards in the existing group. Douglas (1982) posits that this type of cohesiveness often
promotes a positive and collaborative work environment, because:
1. The individual’s identification is granted through group membership.
2. Individual behavior is subject to controls exercised in the name of the group.
3. Authoritarian leadership and hierarchy are rejected.
4. The perpetuation of group goals and group survival is of utmost importance.
To support FMS to be a leading management school, new curricula were
collaboratively developed by the faculty in each major. In order to create innovative and
appropriate curricula, they had meetings several times for brain storming. Faculty
collaborated and used consensus decision making, a process that not only seeks the
118

agreement of most participants, but also the resolution or mitigation of minority
objections (Harris, 2005).
The second research question asks “What are students and instructors attitudes
toward CAI?” While there were a small number of exceptions, the findings of this study
showed that both students and instructors had a very positive attitude toward the use of
CAI. They used computers to search for information, so they could retrieve it “quickly,
easily, and comfortably.” Instructors communicated with students via e-mail and VCR.
Students could communicate with others by means of the web board of VCR. In general,
they used computers for searching information, both for teaching and personal interests,
creating PowerPoint slides, preparing documents, as well as communicating via e-mail.
One instructor’s comments are a good representation of many who use CAI:
Some information is the information that you must pay for, for example
information from Reuters. This is beneficial that we can retrieve the up-to-date
information day by day from Reuters, especially information that I searched for
were financial information. I searched exchange rate, baht currency, something
like that.
They also expressed disadvantage in using CAI. One instructor provided hard
copy sheets for students but did not upload them to VCR. She said she did this because,
“I do not prefer gazing the screen, so I should not assign students to fix their eyes on the
screen.” She was the only one who raised this point to be a disadvantage of using CAI.
The third research question asks “What is the interrelationship of CAI practice
and educational preferences among students and faculty?” It is not wise to draw specific
cause and effect relationships between grid-group preferences and practices among
119

students and faculty. However, data did provide some insight into organizational culture
and CAI use. For example, while some participants in the student and faculty population
indicated a variety of preferences, the educational preference for the majority of both
groups was collectivist. It was gleaned from the data that corporate instructors liked
instructional games and tutorials, and collectivist instructors liked simulation, drills and
practice.
One female individualist decided not to declare which mode of CAI she liked
most, which in itself gives indication of an individualist, autonomous cultural mindset.
One male individualist also chose not to declare which mode of CAI he liked least. He
commented:
I can’t answer that I like least because I do not use. I do not do anything about
problem solving. I do not use simulation as well. I do not use game too. In my
opinion, I think that for testing I must have knowledge in high level enough to
create imagination to use it. After using it, if it is not work, it will be improved
later. But now I can imagine only it can help me do my work more convenient. So
it’s stop only in [tutorial] teaching. I still do not step to drill and practice.
Moreover I am not interest to follow them [changes of technology]. I use
computer just as an easy tool.
It was somewhat interesting that a male individualist liked the tutorial the most
and decided not to declare which mode he liked least, while female individualist liked
tutorial the least and decided not to declare which mode she liked most. From another
point of view, this remark provided evidence to support that they were individualists who
showed high individual autonomy.
120

Considering concurrently both students’ and instructors’ points of view, the
appropriate mode of CAI should be simulation, because instructors liked most simulation
and tutorial, while students like least tutorial. So, the mutually beneficial and satisfying
solution for both students and instructors should be simulation.
The fourth research question asks “How useful is Douglas’ (1982) grid and group
typology in understanding this interrelationship?” Douglas’s typology is useful in
explaining preferences and behaviors as they occur in cultural contexts. The literature
showed that the typology has been proven useful in studying technology use in higher
education settings in the United States (Stansberry, 2001). It also proved useful in
looking at a higher education environment in Thailand.
Grid and group theory offered the language to explain similarities and differences
in various settings, and consequently, the researcher could anticipate forms of activity
and within the typological categories, the variance in intra-organizational behavior.
In relation to CAI, grid-group theory provided a way to explain technology
preferences and cultural behavior. This is important because many CAI formats are
focused on who gets or uses technology and why. In addition to this focus, grid-group
theory allowed the researcher to explain who prefers certain technology and why. So, as
the theory argues, while persons pursue their interests efficiently as a rational choice,
their preferences, interests, and behaviors can be somewhat distinctive and predictable.
The last research question asks “What other realities are revealed in this study?”
Data collected from FMS proved to be somewhat easy to determine placement on the grid
and group continuum. Triangulation of data was very helpful to support all findings
which showed the same results in each method of collecting data. However, actions and
121

behaviors are not determined only by the culture. For example, there are other factors
such as emotional maturity, personality, and family background that help shape behavior.
Grid and group did not explain the factor of age in relation to CAI use. Data
indicated that most instructors prefer using computers for work, while most students
prefer playing games. The younger students obviously grew up with this type of
technology and were more familiar with it. Some instructors informed me that they used
the computer for entertainment too, but only after completing their work. For instructors,
work comes first. For some students, play comes first, and for others, work and play
occurs simultaneously.
Grid and group theory was useful in categorizing and indicating the differences in
various preferences and behaviors. However, it does not give clear indication as to how to
bridge a gap between those differences. In order to bring about change, it could be useful
to supplement grid and group theory with other theories that better explain step by step
methods.
Conclusions
Weaver (2000) defined culture as a system of interconnected parts where
“people…have roughly the same values, beliefs, behaviors, perceptions of reality and
ways of communicating” (p. 72). It was very important to use cultural theory in
explaining CAI because it encompassed not only behaviors, but preferences as well. In
understanding CAI, a big consideration is what subjects and modes are most suitable.
There were many suitable criteria for selecting a mode of CAI as well as subjects that
could be taught using computers. As instructor05 said “it depends on subject that you
teach too. Some mode may fit with some subject while it is not fit with some subject.”
122

Instructor08 said that “indeed I want in all subjects”, and “all subjects need computer
assisted instruction.” But if only one subject will be provided with CAI, “it should be the
fundamental subject, subject for the first year students.” The reason was “because more
students can use it.”
FMS instructors gradually created their own CAI. Most instructors created and
updated their PowerPoint presentations to make them easy to understand. Moreover, the
information from the students revealed that a male individualist recorded the content
related to the subjects he taught. He uploaded his files to VCR. The students could
download them and did their self study.
The findings showed the modes of CAI that students and instructors liked most
and liked least. If the FMS administrators have to choose only one mode to provide CAI
for students, the findings suggested simulation to be an appropriate mode of CAI for
FMS students and instructors. Simulation also fits the collectivist cultural mindset and
can be used instead of other modes of CAI when there is a need to increase motivation,
transfer of learning, or efficiency (Alessi & Trollip, 1991). However, faculty should “not
hesitate to experiment with new practices or technologies that might enhance the teaching
and learning environment” (Harris, 2005, p. 85).
The students said that the instructors in the Faculty of Science recorded videos of
their lectures and uploaded them to VCR that the students could download to do their self
study or review whatever they learned in class. The Students preferred having them. One
of the quick and easy ways to have CAI is recording video of ordinary lecture classes and
then uploads them to VCR as they did. However, a male collectivist instructor from
123

information technology management major commented that “Teacher who use video
recording must prepare many steps. It consumes so much time to create a good CAI.”
One instructor with collectivist preferences suggested that the first step that FMS
management should do is “they should let teachers realize the significance of CAI first. If
some teachers are old, or someone anti using CAI, training can help them understand
this.” All FMS instructors realized the significance of CAI. In their opinion, every subject
should have CAI. They always used computer for their work. The researcher thought that
FMS already passed the realization step. However, the training step was considerable.
There was some training in the past, but the time may not be appropriate. Only a few
instructors joined the training. The appropriate date and time, presenters, and content
were the important things that should be considered.
Implications
The findings from this case study impacted theory, research, and practice.
Following is a discussion of these areas.
Practice
While the purpose of qualitative research is not to generalize, the results of this
study may possibly be transferable to other similar contexts. To enhance the
transferability aspects of this study, the researcher provided a detailed description of the
FMS at Prince of Songkla University. It was to this population that the findings and
conclusions have the most applicability.
This study may benefit teachers and students involved in CAI in Thailand, because
it will give insight how the classroom environment affects the education practices of
students by:
124

1. Reporting and examining the learning preferences of students about CAI;
2. Identifying appropriate patterns of CAI to be developed;
3. Identifying the appropriate method for acquiring CAI;
4. Determining the extent to which student perceive CAI to their specific cultural
context using Douglas’s grid and group typology (1982) model.
Regarding policy and practice, this study also offers a good example of different
grid and group mindsets functioning in a productive way. The suggestion about
simulation may be considered from the collectivist point of view. However, the policy
analysis was severely challenged. “The challenge is to cope intelligently and creatively
with pluralism and diversity. One important way of doing this is to develop a kind of
policy analysis that respects cultural differences and makes them allies instead of
enemies” (Hoppe, 2002, p. 235).
Research
This study used a case study method to examine students’ preferences in CAI. It
contributes to the current body of literature, because it provides another example of how
grid and group typology classifies students’ preferences and practices regarding CAI.
Moreover, this study helps to fill the information gap and add more information to
research from the western view to the eastern context. This study was one of the first
comprehensive explanations of CAI use in a Thai university. Thus, the study adds to the
body of literature providing a vivid case study of CAI and preferences among faculty and
students at a Thai university.
125

Theory
This study demonstrated how the cultural theory of grid and group can be used in
a Thai educational institution. The translation of the grid and group questionnaires from
English to Thai serves to benefit the theory base as well. The study tested this
framework’s usefulness in classroom settings to determine its theoretical significance for
future case studies regarding learning culture. Moreover, it is believed that the study
contributes to development of the theory by expanding the propositions. The explanation
of Douglas’s framework as well as the way it was utilized in this study can provide a
model for other studies using this theory.
Recommendations
FMS is part of a larger cultural context. This cultural context, PSU, which is also
part of the overall Thai educational cultural context, is predominately a bureaucratic
high-grid, low-group environment with explicit institutional rules and roles, which are
necessary to manage a large multi-campus university. FMS on the other hand, is
primarily a low-grid and high-group work environment. The evidence supported a
collectivist (low-grid, high-group) cultural context. Thus, in Douglas’s typology, these
two cultural settings are in opposite or diagonal quadrants of the cultural scale.
According to the theory, differences may sometimes result in prevalence of both
grid and group differences. However, difference can support good working environments,
as Harris (2005) states, “conflict does not have to be inevitably destructive and can, in
fact, be very helpful in decision making and organizational enhancement” (p. 172).
Each type of culture has its strengths and weaknesses (Douglas, 1996).
Collectivists (low-grid, high-group) will likely oppose some bureaucratic (high-grid, low-
126

group) practices because both factions differ on fundamental value orientations (Harris,
2005). In understanding these organizational variations and continuing to promote good
working atmospheres, Harris’s (2005, p. 177) suggests:
Embrace the belief that conflict is a means to promote positive health in your
school. If everyone is thinking the same way, no one is thinking very much.
Seek to identify the roots of conflict and tension through contextually
appropriate information channels and by understanding prevalent social
games.
Consider both individual and group interests.
Value all people in the conflict.
Strive for win-win solutions when possible.
Computers and communication are so strongly related that one cannot break them
apart. Students used mobile phones all the time to communicate with their friends or
relatives. There are many ways that they can use their tools to help in learning, for
example, they can make their own CAI by recording instructors’ lectures. They can
transfer files from their mobile phones to computers for further study. Moreover, students
and instructors can communicate easier with each other. Whatever the researcher
recommended, it is absolutely based on the reality that their mobile phones support these
features.
However, one thing instructors should not forget is the KISS principle. KISS, or
“Keep It Short and Simple,” states that design simplicity should be a key goal and that
unnecessary complexity should be avoided. According to Coombs (2005), “The simpler
the technology, the less it intrudes on the communication” (p. 58). Animation in CAI
127

makes it interesting. But there should be an appropriate amount, as Coombs (2005)
suggested,” to avoid using powerful and exciting tools merely to impress the student with
your technical mastery” (p. 58). The researcher agrees with him that the crucial things
that instructors should do are communicating content to the students and having
interactions with the students. Instructors should be concerned not only with the amount
but also the quality of interactions (Kelsey, 1999).
Interaction between instructor and students requires a two-way intentional
relationship, which is both an art and a tact of teaching. Van Manen (1991) stated:
The teacher intends the students, to learn and grow with respect to the kinds of the
things that the teacher teaches. In turn, the students need to have a desire,
willingness, and a preparedness to learn.(p. 77)
CAI solely is only a medium or tool. Instructors can use it to assist students to
gain and grow in knowledge. Instructors should seek the most appropriate technology
available.
Harris (2005) stated that institutions should include “business and community
leaders in helping to define authentic learning strategies that require the application of
various skills and subject areas” (p. 160). FMS has many alumni which are owners or
administrators of companies or factories nearby the province. PSU and FMS should
continue to develop linkages with those entities.
Harris (2005) suggested that “a new metaphor has emerged that expands the
teacher’s role behavior to more than just teaching” (p. 7). McKeachie and Svinicki (2006)
recommended that “teachers should create conditions that enable students to expect to
succeed” (p. 149). Motivation is important to consider if we want to enhance student
128

learning. Knowing more about how students are motivated and what teacher can do to
structure a class that positively affects student motivation can make a significant
difference in student engagement and learning. (McKeachie & Svinicki, 2006). Whatever
teachers do should be done for students’ benefit. Teachers hope that it will make students
be skillful graduates who can serve their organization’s need in their career in the future.
Instructors use computer assisted instruction with hope to make students be skillful.
However, human connection among students at university level is still the crucial part of
education. Face-to-face learning should not completely replaced by online learning.
Machine still has no real feeling at all.
In my opinion, instructors should use both face-to-face learning and online learning
to convey the feeling of care, share, love, and respect through the way they teach. Using
both machine and human to enhance students’ achievement should be a considerably
inevitable duty of instructors. It is an art of teaching. Finally, I would like to present an
acronym that looks like my name “AREE- Aesthetic Relationship Engender Edification”.
It means that after instructors think for a while and try to use art of teaching and blend
new technology with good relationship with students, the students will gain knowledge
and accomplishment they expected.
Research that could add to the current body of knowledge includes the following:
1. Quantitative studies that focus on factors that promote student learning in CAI
use.
2. Studies that include other theories to frame the research. For example, Fullan
(2001) can be used to see how the stages of change can bring about a stronger
learning atmosphere.
129

3. Teaching and learning theories should also be incorporated in further research.
4. Stansberry (2005) also incorporates a type of contingency theory in
understanding technology and learning. Her approach allows researchers to
assess teaching styles and technology integration, identify instructional
strategies that match teaching styles, and accommodate instructional technology
to instructional strategies.
130

References
Access Center (2008). Improving Outcomes for all students K-8. In Computer-assisted
instruction and Mathematics. Retrieved April 19, 2008, from
http://www.k8accesscenter.org/training_resources/computeraided_math.asp
ACM SIGCHI (2008). The ACM's Special Interest Group on Computer-Human
Interaction. Retrieved April 19, 2008, from http://sigchi.org/
Adams, J., Khan, H. T.A., Raeside, R., & White, D. (2007). Research methods for
graduate business and social science students. Response, Business books from
SAGE.
Adkins, S. (2002). The 2002 U.S. Market for E-learning simulation. Sunnyvale, CA:
Brandon-Hall.
Adler, N. J. (1986). Domestic multiculturalism: Cross-cultural management in the public
sector. In G. R. Weaver (Ed.) Culture, communication and conflict: Readings in
intercultural relations (2nd ed.), (pp. 110-125). Boston, MA: Pearson Publishing.
Adler, N. J., & Jelinek, M. (1986). Is “organization culture” culture bound? In G. R.
Weaver (Ed.) Culture, communication and conflict: Readings in intercultural
relations (2nd ed.), (pp. 126-137). Boston, MA: Pearson Publishing.
Alessi, S. M., & Trollip, S. R. (1991). Computer-based instruction: Methods and
development (2nd ed.). Englewood Cliffs, NJ: Prentice-Hall, Inc.
131

Apperson, J. M., Laws, E. L., & Scepansky, J. A. (2006). The impact of presentation
graphics on students' experience in the classroom. Computers & Education, 47(1),
116-126.
Apple Education (2008). Leadership in K-12 Education. Retrieved April 16, 2008, from
http://www.apple.com/education/k12/leadership/acot/
Arnold, D. N. (2007). Computer-Aided Instruction, Microsoft Encarta Online
Encyclopedia 2007. Retrieved April 19, 2008, from
http://encarta.msn.com/encyclopedia_761553343/computer-
aided_instruction.html
Ash, J. E. (2005). The effects of computer-assisted instruction on middle school
mathematics achievement .Doctoral dissertation, Tennessee State University,
2005. (UMI No. 3187584)
Azevedo, R., & Bernard, R. (1995). Assessing the effects of feedback in computer-
assisted learning. British Journal of Educational Technology, 26(1), 57-58.
Babbie, E. (2008). The basics of social research (4th ed.). Belmont, CA: Thomson
Wadsworth.
Baker, E. L., Gearhart, M., & Herman, J. L. (1994). Evaluating the Apple Classrooms of
TomorrowSM. In E. L. Baker & H. F. O’Neal. Jr (Eds.) Technology assessment in
education and training, (pp. 173-197). Hillsdale, NJ: Lawrence Erlbaum
Associates, Inc.
Bartscha, R. A., & Cobern, K. M. (2003). Effectiveness of PowerPoint presentations in
lectures. Computers & Education, 41, 77–86.
132

Bassi, L. J. & Buren, M.E. V. (1999). The 1999 ASTD state of the industry report
American society for training and development. New York, NY: McGraw Hill
Book Company.
Becker, H. S. (1968). Observation: social observation and social case studies. In D. L.
Sills (Ed.) International Encyclopedia of the Social Sciences, vol. 2. New York:
NY: Macmillan.
Blanchard, P. N, & Thacker, J. W. (1999). Effective training: Systems, strategies, and
practices. Upper Saddle River: NJ. Prentice-Hall, Inc.
Bowles, M. S. (2004). Relearning to e-learn: Strategies for electronic learning and
knowledge. Carlton, Victoria 3053 Australia: Melbourne University Press.
Burton, D. (2000). The use of case studies in social science research. In D. Burton (Ed.)
Research training for social scientists, (pp. 215-225). Thousand Oaks, CA: SAGE
Publications Inc.
Chitapong, P. (2005). A grid and group explanation of teachers’ attitudes toward in-
service professional development practices in selected schools in Thailand.
Doctoral dissertation, Oklahoma State University, 2005. (UMI No. 3167399)
Clark, R. E. (1983). Reconsidering research on learning from media. Review of
educational research, 53(4), 445-459.
Clark, R. E. (1994). Media will never influence learning. Educational Technology
Research and Development, 42(2), 21-30.
Clark, R. E. (Ed.). (2001). Learning from media: Arguments, analysis, and evidence.
Greenwich, CT: Information Age.
133

Clark, R. E. (2005). What works in distance learning: Instructional strategies. In H. F.
O’Neil (Ed.) What works in distance learning. Guidelines, (pp. 25-39).
Greenwich, CT: Information Age Publishing.
ComputerUser (2008). The most comprehensive high-tech dictionary on the Internet. In
Computer aided instruction. Retrieved April 19, 2008, from
http://www.computeruser.com/resources/dictionary/definition.html?lookup=41
Coombs, N. (2005). Transcending distances and differences with online learning. In G.
Kearsley (Ed.), Online learning: Personal reflections on the transformation of
education. (pp. 53-65). Englewood Cliffs, NJ: Educational Technology
Publications, Inc.
Creswell, J. W. (1994). Research design: Qualitative and quantitative approaches.
Thousand Oaks, CA: Sage Publications, Inc.
Dabbagh, N., & Bannan-Ritland, B. (2005). Online learning: Concepts, strategies, and
application. Upper Saddle River, NJ: Pearson Education, Inc.
Dane, F. C. (1990). Research methods. Belmont, CA: Brooks/Cole Publishing Company.
Deal, T. E., & Peterson, K. D. (1999). Shaping school culture: The heart of leadership.
San Francisco, CA: Jossey-Bass.
Denscombe, M. (2007). The good research guide for small-scale social research
projects. (3rd ed.). New York, NY: Open University Press.
Denzin, N. K. (1989). The research act: A theoretical introduction to sociological
methods. (3rd ed.). Englewood Cliffs, NJ: Prentice Hall.
Douglas, M. (1982). In the active voice. London: Routledge & Kegan Paul.
Douglas, M. (1992). Risk and blame: Essays in cultural theory. Routledge.
134

Douglas, M. (1996). Thought styles: Critical essays on good taste. Thousand Oaks, CA:
Sage Publications..
Downey, S., Wentling, R. M., Wentling, T., & Wadsworth, A. (2005). The Relationship
between National Culture and the Usability of an E-learning System. Human
Resource Development International, 8(1), 47-64.
Educational Technology (2008). Centre for academic practice. In Computer assisted
learning. Retrieved April 19, 2008, from
http://www.warwick.ac.uk/ETS/Publications/Guides/cal.htm
Ellis, M. L. (2006). A grid and group explanation of at-risk student culture in an
alternative middle school. Doctoral dissertation, Oklahoma State University,
2006. UMI No. 3211649.
Erlandson, D. A., Harris, E. L., Skipper, B. L., & Allen, S. D. (1993). Doing naturalistic
inquiry: A guide to methods. Newbury Park, CA: Sage Publications, Inc.
The Faculty of Management Sciences (2008). Retrieved April 19, 2008, from
http://www.mgt.psu.ac.th
Fitzpatrick, J. L., Sanders, J. R., & Worthen, B. R. (2004). Program evaluation:
Alternative approaches and practical guidelines (3rd ed.). Boston, MA: Allyn and
Bacon.
Fraenkel, J. R., & Wallen, N. E. (1993). How to design and evaluate research in
education (2nd ed.). McGraw-Hill Inc.
Fullan, M. (2001). Leading in a culture of change. San Francisco, CA: Jossey-Bass.
Gay, L. R. (1990). Educational research: Competencies for analysis and application (3rd
ed.). New York, NY: Macmillan Publishing Company.
135

Glasser, W. (1998). Choice theory: A new psychological freedom. New York: Harper-
Perennial.
Glazier, J. D., & Powell, R. R. (1992). Qualitative research in information management.
Englewood, CO: Libraries Unlimited, Inc.
Graziano, A. M., & Raulin, M. L. (2004). Research methods: a process of inquiry (5th
ed.). Pearson Education Group, Inc.
Gross, J. L., & Rayner, S. (1985). Measuring culture: A paradigm for the analysis of
social organization. New York, NY: Columbia University Press.
Harris, E. L. (1995). Toward a grid and group interpretation of school culture. Journal of
School Leadership, 5(6), 617-646.
Harris, E. L. (2005). Key strategies to improve schools: How to apply them contextually.
Oxford, UK: Rowman & Littlefield Education.
Hazard, W. R., & Stent, M.D. (1973). Cultural pluralism and schooling: Some
preliminary observations. In M.D. Stent, W.R. Hazard, & H.N. Rivlin (Eds.)
Cultural pluralism in education. New York: Appleton-Century-Crofts.
Henke, H. (2001). Learning theory: Applying Kolb's learning style inventory with
computer based training. Retrieved April 24, 2007, from
www.chartula.com/learningtheory.pdf
Hoppe, R. (2002). Guest Co-Editor’s Introduction: Cultural Theory’s Gift for Policy
Analysis. Journal of Comparative Policy Analysis: Research and Practice, 4,
235-241.
Johnston, J. (1987). Electronic learning: From audiotape to videodisc. Hillsdale, NJ:
Lawrence Erlbaum Associates, Inc.
136
Kelsey, K. (1999). A case study of interaction, student satisfaction, communication
apprehension, and an orientation workshop in an animal genetics course delivered
by interactive compressed video technology. Doctoral dissertation, Cornell
University, 1999. (UMI No. 9923815)
Kelsey, K. (2005). Evaluating distance education programs using best practices. In K.
Dooley, J. Lindner, & L. Dooley (Eds.), Advanced methods in distance education:
Applications and practices for educators, trainers, and learners. Hershey, PA:
Idea Group.
Knapper, C. K. (1980). Evaluating instructional technology. London: Croom Helm.
Kogan, M. (1988). Education accountability: An analytic overview. London: Hutchinson.
Kroeber, A. L., & Kluckhohn, C. (1952). Culture: A Critical Review of Concepts and
Definitions. The Peabody Museum of American Archaeology and Ethnology,
XLVII(1), Cambridge, MA: Harvard University, 181.
Kulik, J. A. (1994). Meta-Analytic Studies of Findings on Computer-Based Instruction.
In E. L. Baker, & H. F. O’Neal. Jr (Eds.) Technology assessment in education and
training, (pp. 9-33). Hillsdale, NJ: Lawrence Erlbaum Associates, Inc.
Kulik, C.-L. C., & Kulik, J. A. (1991). Effectiveness of computer-based instruction: An
updated analysis. Computers in Human Behavior, 7, 75-94.
Kumar, R. (2005). Research methodology: a step-by-step guide for beginners (2nd ed.).
Thousand Oaks, CA: Sage Publications Inc.
Kuttan, A., & Peters, L. (2003). From digital divide to digital opportunity. Lanham, ML:
Scarecrow Education.
137

Liao, Y. C. (2007). Effects of computer-assisted instruction on students' achievement in
Taiwan: A meta-analysis. Computers & Education, 48(2), 216-233.
Liao, Y. C., & Bright, G. W. (1991). Effects of computer programming on cognitive
outcomes: A meta-analysis. Journal of Educational Computing Research, 7(3),
251-268.
Liegle, J. O., & Janicki, T. N. (2001). Effect of learning styles on the navigational needs
of Computer-Based Training module learners.
Lincoln, Y. S., & Guba, E. G. (1985). Naturalistic inquiry. Beverly Hills, CA: Sage.
Lingenfelter, S. G. (1996). Agent of transformation: A guide for effective cross-cultural
ministry. Grand Rapids, MI: Baker Books.
Mamadouh, V. (1999). Grid-group cultural theory: an introduction. GeoJournal, 47, 395-
409.
Marquardt, M. J, & Kearsley, G. (1999). Technology-based learning: Maximizing human
performance and corporate success. Boca Raton, FL: CRC Press LLC.
Mathew, N., & Doherty-Poirier, M. (2008). First Monday: Peer-Reviewed Journal on the
Internet. In Using the World Wide Web to Enhance Classroom Instruction.
Retrieved April 20, 2008, from
http://www.firstmonday.org/issues/issue5_3/mathew/index.html#m2
Mayer, R. E., Heiser, J., & Lonn, S. (2001). Cognitive constraints on multimedia
learning: When presenting more material results in less understanding. Journal of
Educational Psychology, 93(1), 187–198.
McCarty, S. (2008). ACM e-Learn Magazine: Education and Technology in Perspective.
In Cultural, disciplinary and temporal contexts of e-learning an English as a
138

foreign language. Retrieved April 9, 2008, from
http://www.elearnmag.org/subpage.cfm?section=research&article=4-1
McKeachie, W.J. & Svinicki, M. (2006). McKeachie’s Teaching Tips (12rd ed.). New York:
Houghton Mifflin Company.
National Research Council. (2002). Enhancing undergraduate education with
information technology: A workshop summary. Washington, DC: National
Academy Press.
O’Neil, H. F., Chen, H., Wainess, R. & Shen, C. D. (2008). Assessing problem solving in
simulation games. In E. Baker, J. Dickieson, W. Wulfeck, & H. F. O’Neil (Eds.)
Assessment of problem solving using simulations, (pp. 157-176). New York, NY:
Taylor & Francis Group, LLC.
O’Neal, S., Kauffman, D., & Smith, D. L. (1981-82). Cost effectiveness of computerized
instruction. International journal of instructional media, 9, 159-165.
Patton, M.Q. (2002). Qualitative research and evaluation methods (3rd ed.). Thousand
Oaks, CA: Sage Publications, Inc.
Peterson, K. D. & Deal, T. E. (2002). The shaping school culture fieldbook. San
Francisco, CA: Jossey-Bass.
Prince of Songkla University. (2005). Prince of Songkla University 2004-2005 in brief.
Prince of Songkla University. (2007). Prince of Songkla University in brief 2007.
Prince of Songkla University Registration Unit (2008). Retrieved October 16, 2008, from
http://www.reg.psu.ac.th
139

Ravet, S. & Layte, M. (1998). Technology-based training: A comprehensive guide to
choosing, implementing, managing, and developing new technologies in training.
Houston, TX: Gulf Publishing Company.
Resources for Electronics Training (2008). Retrieved April 16, 2008, from
http://www.datasync.com/~etcai/training.htm
Rhinesmith, S. H. (1970). Cultural-organizational analysis: Theinterrelationship of value
orientation and managerial behavior. Cambridge, MA: McBer.
Rieber, L. P. (1996). Animation as a distractor to learning. International Journal of
Instructional Media, 23, 53–57.
Roberts, F. C. (1984). An overview of intelligent CAI systems. Peabody journal of
education, 62(1), 40-51.
Rosenberg, M. (2001). E-learning: Strategies for delivering knowledge in the digital age.
McGraw-Hill, NY.
Rosenberg, R. S. (1997). The social impact of computers. (2nd ed.). Chestnut Hill, MA:
Academic Press.
Ross, J., & Schulz, R. (1999). Can computer-aided instruction accommodate all learners
equally? British journal of educational technology, 31, 5-24.
Runyon, W. M. (1982). Life histories and psychobiography. Oxford: Oxford University
Press.
Schein, E. H. (1985). Organizational culture and leadership. San Francisco, CA: Jossey-
Bass.
Schenk, R., & Silvia, J. E. (1984). Why has CAI not been more successful in economic
education. The Journal of economic education, 15(3), 239-242.
140

Schmidt, M., Weinstein, T., Niemiec, R., & Walberg, H. J. (1985, April). Computer-
assisted instruction with exceptional children: A meta- analysis of research
findings. Paper presented at the annual meeting of the American Educational
Research Association, Chicago.
Saettler, P. (1990). The evolution of American educational technology. Englewood, CO:
Libraries Unlimited, Inc.
Shuell, T. J. (1990). Phases of learning. Review of educational research, 60, 531-547.
Siegfried, J. J., & Fels, R. (1979). Teaching college economics: A survey. Journal of
economic literature, 940-942.
Spickard, J. V. (1989). A guide to Mary Douglas’s three versions of grid/group theory.
Sociological Analysis, 50(2), 151-170.
Stansberry, S. L. J. (2001). A grid and group description of higher education faculty
preferences toward instructional technology use. Doctoral dissertation, Oklahoma
State University. (UMI No. 3033601)
Stansberry, S. (2005). Take AIM: Improving Professional Education Instructors’ use of
Instructional Technology. In C. Crawford et al. (Eds.) Proceedings of Society for
Information Technology and Teacher Education International Conference 2005,
(pp. 1606-1611). Chesapeake, VA: AACE.
Stone, D. E., & Koskinen, C. L. (2002). Planning and design for high-tech web-based
training. Norwood: MA. Artech House.
Sun, P. C., & Cheng, H. K. (2007). The design of instructional multimedia in e-Learning:
A Media Richness Theory-based approach. Computers & Education 49(2007),
662-676.
141

ThaiWBI (2008). WBI(Web-based instruction). Retrieved April 20, 2008, from
http://www.thaiwbi.com/topic/WBI/
Thompson, C., Koon, E., Woodwell, W.H., & Beauvais, J. (2002). The 2002 ASTD state
of the industry report. American society for training and development. New York,
NY: McGraw Hill Book Company.
Truett, C., & Gillespie, L. (1984). Choosing educational software: A buyer’s guide.
Littleton, CL: Libraries Unlimited, Inc.
Van Manen, M. (1991). The tact of teaching: The meaning of pedagogical
thoughtfulness. Albany: State University of New York Press.
Venezky, R., & Osin, L. (1991). The intelligent design of computer-assisted instruction.
NY: Longman.
Wang, C., Hinn, M., & Kanfer, A. (2001). Potential of computer-supported collaborative
learning for learners with different learning styles. Journal of Research on
Technology, 341, 75-85.
Weaver, G. R. (2000). Contrasting and comparing cultures. In G. R. Weaver (Ed.),
Culture, communication and conflict: Readings in intercultural relations (2nd ed.),
(pp. 72-77). Boston, MA: Pearson Publishing.
Wegener, D. P. (2008). Basic terms of computer based training. Retrieved April 16, 2008,
from http://www.cp-info.com/library/cbtwing/cbtmain.htm
Weimer, W. B. (1979). Notes on the methodology of scientific research. Hillsdale, NJ:
Erlbaum.
Wenglinsky, H. (1998). Does it compute? The relationship between education technology
and student achievement in Mathematics. Educational Testing Service.
142

Wenglinsky, H. (2005). Using technology wisely: The keys to success in schools. New
York, NY: Teachers College Press.
Willett, J. B., Yamashita, J. J., & Anderson, R. D. (1983). A meta-analysis of
instructional systems applied in science teaching. Journal of Research in Science
Teaching, 20, 405-417.
Yeh, W. P. (2005). Learning styles, learner characteristics, and preferred instructional
activities in computer-based technical training for adults. Doctoral dissertation,
Oklahoma State University. (UMI No. 3162513)
Yin, R. K. (1994). Case study research: design and methods (2nd ed.). London: Sage.
Zikmund, W.G. (2000). Business research methods (6th ed.). Mason, OH: Thomson
Learning.
143

Appendices
144

Appendix A
Institutional Review Board Approval
145

146

Appendix B
Letter to the Dean of FMS
147

บันทึกขอความ ที่ มอ 460/ วันที่ 16 มถิุนายน 2551
เรื่อง ขอความอนุเคราะหประชาสัมพนัธใหนักศึกษาตอบแบบสอบถามเพื่อใหขอมูลวิจัย -----------------------------------------------------------------------------------------------------------------------------------------------------------
เรียน คณบดี คณะวิทยาการจัดการ ตามที่อ. อารีย ล้ิมวุฒิไกรจิรัฐ ภาควิชาบริหารธุรกิจ คณะวิทยาการจัดการ
มหาวิทยาลัยสงขลานครินทร ไดรับอนุมัติใหลาไปศึกษาระดบัปริญญาเอก สาขาวิชาการสอนในระดับอุดมศึกษา ณ OKLAHOMA STATE UNIVERSITY ประเทศสหรัฐอเมริกา
ดวยทุนมหาวิทยาลัยสงขลานครินทร (ทุนประเภท 1 ก) มีกําหนด 5 ป (โดยในแตละปจะลาไปศึกษาตางประเทศเปนชวง ๆ ครั้งละ 3-4 เดือน) น้ัน
บัดน้ีถึงเวลาของการเก็บขอมูลวิจัยสาํหรับ Dissertation แลว
จึงขอความรวมมือจากทานชวยประชาสัมพันธใหนักศึกษาปริญญาตรีหลักสูตรปกติ ทุกสาขาวิชา ของคณะวิทยาการจัดการ ชวยใหขอมูลวิจัยสําหรบั Dissertation ของ อ. อารีย ล้ิมวุฒิไกรจิรัฐ หัวขอวิจัยคือ "A Grid and Group Explanation of Students' and Instructors' Preferences in CAI: A Case
Study of University Classrooms in Thailand"โดยไปตอบแบบสอบถามที่ http://frontpage.okstate.edu/coe/aree1/
ในหนาแรก จะเปนภาษาอังกฤษ ตามรูปแบบมาตรฐานของแบบสอบถาม Online ของ
Oklahoma State University ถาทานยอมรับที่จะตอบแบบสอบถาม กรุณาคลิกท่ี Agree to participate
ก็จะเขาสูหนาแบบสอบถามที่เปนภาษาไทย จึงเรียนมาเพื่อขอความรวมมือในการประชาสัมพนัธใหนักศึกษาปริญญาตรี หลักสูตรปกติ ทุกสาขาวชิา ของคณะวิทยาการจัดการ ชวยใหขอมูล โดยการ ตอบแบบสอบถาม ดวย จักขอบคุณยิง่
อารีย ล้ิมวุฒิไกรจิรัฐ ผูวิจัย
148

Appendix C
Grid and Group Cultural Preference Tool
English Version for Students
149

150

151

152

153

154

155

156

157

158

Appendix D
Grid and Group Cultural Preference Tool
Thai Version for Students
159
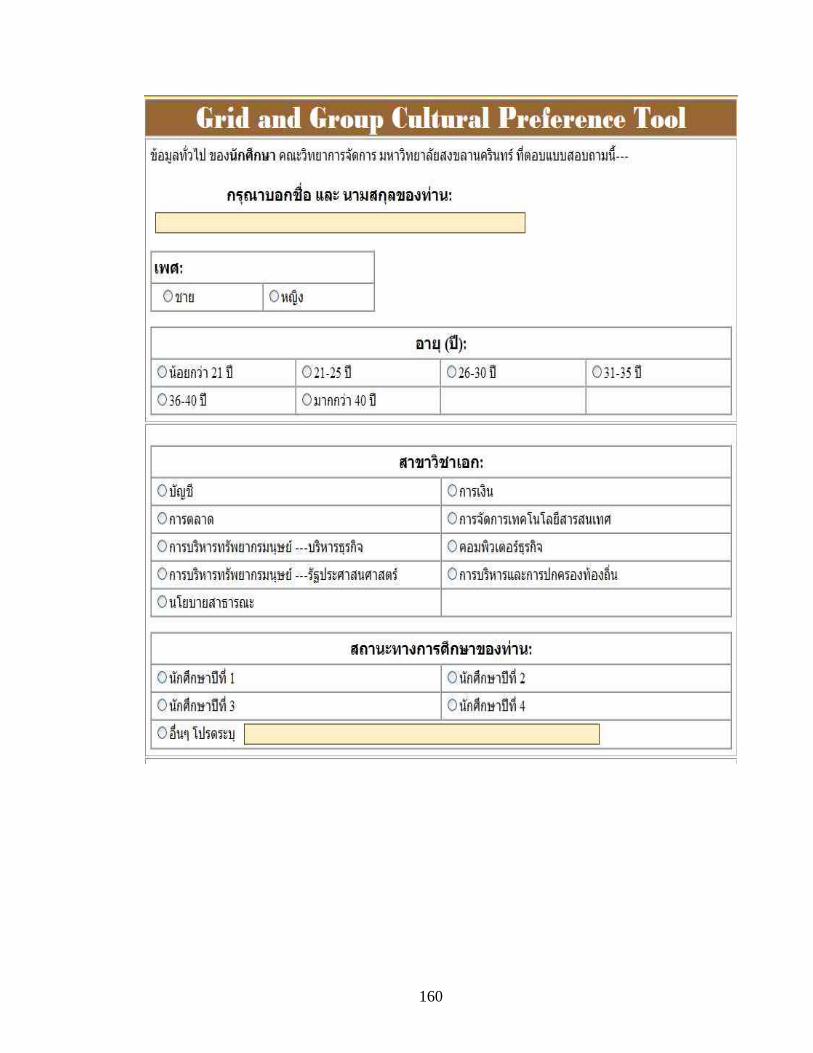
160

161
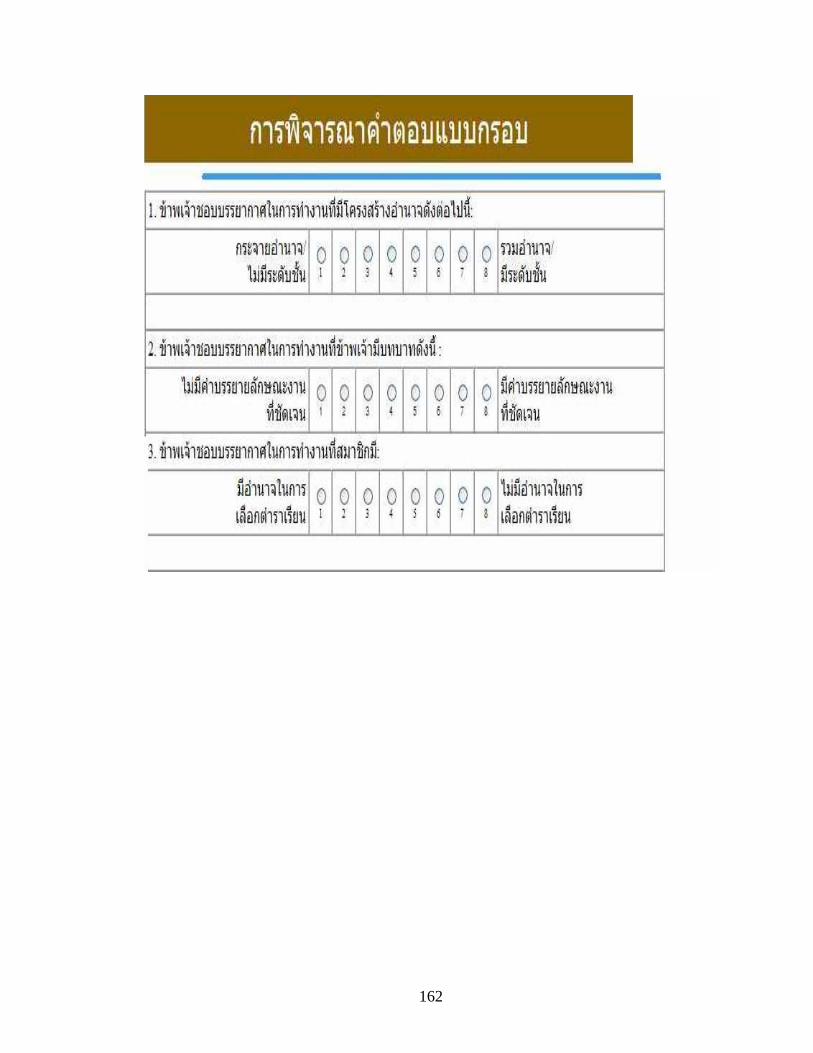
162

163

164

165

166

167

168

Appendix E
Grid and Group Cultural Preference Tool
English Version for Instructors
169

170

171

172

173

174

175

176

177

178

179

Appendix F
Grid and Group Cultural Preference Tool
Thai Version for Instructors
180

181

182

183

184

185

186

187

188

189

190

Appendix G
Consent Form to Interviewed Participants
English Version
191

192

193

Appendix H
Consent Form to Interviewed Participants
Thai Version
194
195

196

197

198

Appendix I
Sample Questions for Interview
199

SAMPLE QUESTIONS FOR INTERVIEW
Questions for students
1. Please describe your major study?
2. Why are you in this major?
3. What do you do with computer in general?
4. Please explain your definition of computer aided instruction?
5. Please explain your experience using computer aided instruction? (If they talk
about whether the experience was good or bad: Why was it a good experience?
Why was it a bad experience?)
6. What kinds of computer aided instruction you like most? Why? Least like? Why?
7. Please explain characteristics of effective computer aided instruction?
8. What subject matter is your in-need computer aided instruction? Why?
9. Do you have any other comments or suggestions about computer aided
instruction?
200

VITA
Aree Limwudhikraijirath
Candidate for the Degree of
Doctor of Education Dissertation: A GRID AND GROUP EXPLANATION OF STUDENTS’ AND
INSTRUCTOR’ PREFERENCES IN COMPUTER ASSISTED INSTRUCTION: A CASE STUDY OF UNIVERSITY CLASSROOMS IN THAILAND
Major Field: Applied Educational Studies/College Interdisciplinary Biographical:
Personal Data: Born in Chawang, Nakhon Sri Thammarat, Thailand. Education: Graduated from Trium Udom Suksa School, Phayathai, Bangkok,
Thailand in 1975; received Bachelor of Science in Mathematics from Chulalongkorn University, Bangkok, Thailand in 1980. Received Master of Science in Applied Statistics, major Computer Science from National Institute Development Administration, Bangkok, Thailand in 1985. Completed the requirements for the Doctor of Education in Applied Educational Studies/College Interdisciplinary at Oklahoma State University, Stillwater, Oklahoma in July, 2009.
Experience: Government officer teacher of mathematics, Nakhon Sri
Thammarat Technical College, Nakhon Sri Thammarat, Thailand, 1980-1990. Government officer teacher of statistics and computer, Faculty of Management Sciences, Prince of Songkla University, Hatyai, Songkhla, Thailand, 1990-present. Major head of Information Technology Management, Faculty of Management Sciences, Prince of Songkla University.
Professional Memberships: The Computer Association of Thailand under the
Royal Patronage of His Majesty the King.

ADVISER’S APPROVAL: Dr. Edward Harris
Name: Aree Limwudhikraijirath Date of Degree: July, 2009 Institution: Oklahoma State University Location: Stillwater, Oklahoma Title of Study: A GRID AND GROUP EXPLANATION OF STUDENTS’ AND
INSTRUCTORS’ PREFERENCES IN COMPUTER ASSISTED INSTRUCTION: A CASE STUDY OF UNIVERSITY CLASSROOMS IN THAILAND
Pages in Study: 200 Candidate for the Degree of Doctor of Education
Major Field: Applied Educational Studies/College Interdisciplinary Scope and Method of Study: This study was a case study which had three overlapping
purposes. The first purpose was to use Douglas’s typology to explain the educational culture of the Faculty of Management Sciences (FMS) at Prince of Songkla University (PSU) Hatyai, Songkhla, Thailand. The second purpose was to describe the students’ and instructor’s preferences about computer assisted instruction (CAI) in FMS. The last purpose was to describe CAI practices in FMS. The participants in this case study included students and instructors of FMS. Participants completed a questionnaire called the Grid and Group Cultural Preference Tool. The results from the tool aligned each participant with the corresponding quadrant of their own cultural context. Participants in the interview stage were selected because of their different cultural contexts. Data were triangulated by multiple sources: questionnaire responses, interview transcripts, classroom observations and observation field notes, as well as documents.
Findings and Conclusions: Findings in this study indicated that there were some similarities in the cultures of FMS students and FMS instructors, and some differences in their practices and preferences in CAI. Both FMS students and instructors were collectivist (low grid, high group). For instructors, work comes first. For some students, they worked and played computer games at the same time. Age may be the crucial factor of the level of their responsibility. FMS indicated a compromised low-grid environment. It exhibited strong influences from history and tradition and had excellent linkages with its communities. The findings also showed the modes of CAI that students and instructors liked most and liked least. If the FMS administrators have to choose only one mode to provide CAI for students, it should be simulation which fits with the collectivist cultural context. However, there were many suitable criteria for selecting mode of CAI. It depends on subject which was taught too. Douglas is useful in explaining behaviors in a cultural context. However, actions and behaviors are not determined only by the culture. There are other factors such as personality and family background that help shape behavior, but Douglas is helpful in offering cultural language to explain those actions and behaviors.