a ground validation network for the global precipitation ... · pdf filea ground validation...
TRANSCRIPT
A Ground Validation Network for the Global Precipitation Measurement Mission
MATHEW R. SCHWALLER
Global Precipitation Measurement Project, NASA Goddard Space Flight Center, Greenbelt, Maryland
K. ROBERT MORRIS
Global Precipitation Measurement Project, NASA Goddard Space Flight Center, Greenbelt,
and Science Applications International Corporation, Beltsville, Maryland
(Manuscript received 9 October 2009, in final form 20 October 2010)
ABSTRACT
A prototype Validation Network (VN) is currently operating as part of the Ground Validation System for
NASA’s Global Precipitation Measurement (GPM) mission. The VN supports precipitation retrieval algo-
rithm development in the GPM prelaunch era. Postlaunch, the VN will be used to validate GPM spacecraft
instrument measurements and retrieved precipitation data products.
The period of record for the VN prototype starts on 8 August 2006 and runs to the present day. The VN
database includes spacecraft data from the Tropical Rainfall Measuring Mission (TRMM) precipitation radar
(PR) and coincident ground radar (GR) data from operational meteorological networks in the United States,
Australia, Korea, and the Kwajalein Atoll in the Marshall Islands. Satellite and ground radar data products
are collected whenever the PR satellite track crosses within 200 km of a VN ground radar, and these data are
stored permanently in the VN database. VN products are generated from coincident PR and GR observations
when a significant rain event occurs.
The VN algorithm matches PR and GR radar data (including retrieved precipitation data in the case of the
PR) by calculating averages of PR reflectivity (both raw and attenuation corrected) and rain rate, and GR
reflectivity at the geometric intersection of the PR rays with the individual GR elevation sweeps. The algo-
rithm thus averages the minimum PR and GR sample volumes needed to ‘‘matchup’’ the spatially coincident
PR and GR data types. The result of this technique is a set of vertical profiles for a given rainfall event, with
coincident PR and GR samples matched at specified heights throughout the profile.
VN data can be used to validate satellite measurements and to track ground radar calibration over time. A
comparison of matched TRMM PR and GR radar reflectivity factor data found a remarkably small difference
between the PR and GR radar reflectivity factor averaged over this period of record in stratiform and convective rain
cases when samples were taken from high in the atmosphere. A significant difference in PR and GR reflectivity was
found in convective cases, particularly in convective samples from the lower part of the atmosphere. In this case, the
mean difference between PR and corrected GR reflectivity was 21.88 dBZ. The PR–GR bias was found to increase
with the amount of PR attenuation correction applied, with the PR–GR bias reaching 23.07 dBZ in cases where the
attenuation correction applied is .6 dBZ. Additional analysis indicated that the version 6 TRMM PR retrieval
algorithm underestimates rainfall in case of convective rain in the lower part of the atmosphere by 30%–40%.
1. Introduction
In collaboration with its international partners, Na-
tional Aeronautics and Space Administration (NASA)
is developing a Ground Validation System (GVS) as a
contribution to the Global Precipitation Measurement
(GPM) mission. In the United States, GPM has been rec-
ognized as a key weather and climate mission for provid-
ing uniform, global precipitation products that leverage
all available satellites capable of precipitation measure-
ment (NAS 2007). In achieving these goals, GPM ad-
dresses the call for ‘‘essential climate variables,’’ as
defined by the Global Climate Observing System (GCOS
2006). The GPM framework is also intended to be a re-
alization of a ‘‘precipitation constellation’’ of satellites and
ground-based assets that will deliver fundamental climate
data records for social benefit (Neeck and Oki 2007).
Corresponding author’s address: Mathew R. Schwaller, Mail
Code 422/587, Global Precipitation Measurement Project, NASA
Goddard Space Flight Center, Greenbelt, MD 20771.
E-mail: [email protected]
VOLUME 28 J O U R N A L O F A T M O S P H E R I C A N D O C E A N I C T E C H N O L O G Y MARCH 2011
DOI: 10.1175/2010JTECHA1403.1
301
The international GPM mission extends observations of
the Tropical Rainfall Measuring Mission (TRMM; Simpson
et al. 1996; Kummerow et al. 2000) to precipitation at higher
latitudes, with more frequent sampling, and with research
focused on a more complete understanding of the global
hydrological cycle. It is expected that the dual-frequency
precipitation radar (DPR) instrument on board GPM will be
capable of measuring rain rates from ;0.2 to 110 mm h21.
GPM DPR products will estimate the sizes of precipitation
particles and the drop size distribution (DSD) of rain, using
the attenuation difference between the Ka- and Ku-band
frequencies in the DPR, and they will also discriminate be-
tween snow and rain. Mission requirements specify that
GPM precipitation products will be available with a 3-h
average revisit time over 80% of the globe, and data will be
available to users within 3 h of observation (Hou et al. 2008).
In support of the international GPM, NASA is plan-
ning to launch a GPM core satellite into a medium (658)
inclination orbit no later than July 2013. Current plans
call for the GPM GVS to support the GPM satellite
mission. In the prelaunch era, the GPM GVS provides
data to support the development of precipitation re-
trieval algorithms. In the postlaunch era, the GPM GVS
provides an independent means for evaluation, diagnosis,
and ultimately improvement of GPM space-borne mea-
surements and precipitation products.
This paper specifically describes one component of the
GPM GVS: a Validation Network (VN) that compares
GPM DPR data products to similar measurements and
products from national networks of operational weather
radars. The main focus of the VN work described below is
the direct comparison of radar reflectivity factor data gen-
erated by ground- and space-based radars. Reflectivity
factor was selected because it is the fundamental product
used in radar precipitation retrievals. The ultimate goal of
the VN is to understand and resolve the first-order vari-
ability and bias of precipitation retrievals in different me-
teorological and hydrological regimes at large scales.
Although the VN is intended for GPM validation, an initial
version of the system is now in operation that uses TRMM
satellite data. The current version of the VN is built on
methods, research results, and computer code described by
Anagnostou et al. (2001), Bolen and Chandrasekar (2000),
Liao et al. (2001), and Bolen and Chandrasekar (2003).
As part of the international GPM mission, the VN
is designed to incorporate and exploit data contributed
by an arbitrary number of national meteorological net-
works of ground radars. At present, the VN includes
contributions from ground radars located in Australia,
South Korea, the Kwajalein Atoll in the Marshall Is-
lands, and the southeastern United States. However, the
system, as described below, was designed to be readily
scalable. Thus, the VN allows for the inclusion of new
radars and additional national networks with only minor
modification to the VN code and database tables. Future
plans call for the inclusion of spacecraft microwave ra-
diometer data into the VN.
2. VN data sources
The current period of record for the VN data starts on
8 August 2006 and runs to the present day. The current
VN database includes spacecraft data from the TRMM
precipitation radar (PR) and coincident ground radar
(GR) data from several sources, as described below.
Satellite and ground radar data products are collected
whenever the PR satellite track crosses within 200 km
of a VN ground radar, and these data are stored per-
manently in the VN database. The generation of VN
products from the coincident PR and GR datasets, how-
ever, occurs only when there is a ‘‘significant rain event,’’
as defined in section 3. Because many of the ground
radar datasets are quality controlled by a human analyst
prior to ingest into the VN, there is a variable time lag
between observation and VN product creation.
a. TRMM PR
PR data are extracted from standard TRMM version 6
data products—1C-21, 2A-23, 2A-25, and 2B-31—for
orbital overpass events where the instrument ground
track coincides with a VN ground radar. The extracted
PR data include radar reflectivity (both raw and attenu-
ation corrected), near-surface rain rate, and other vari-
ables (see section 4). The VN acquires these data as orbit
subset products directly from NASA’s Precipitation Pro-
cessing System (PPS; online at http://pps.gsfc.nasa.gov/
pps). The PR data, along with detailed product descrip-
tions, are also available to the public via NASA’s Goddard
Earth Sciences (GES) Data and Information Services
Center (DISC; online at http://disc.sci.gsfc.nasa.gov).
At the current TRMM orbital altitude of 402 km, the
13.8-GHz (Ku band) PR data are characterized by a
ground-level instantaneous field of view of approximately
5 km. The instrument scans along the satellite cross-track
direction to yield a 247-km swath, with 49 ray samples in
each cross-track scan. Within each ray, the PR samples
a column of the atmosphere in series of range bins, each
with a vertical resolution of 250 m, from ground level up
to 20 km (Kozu et al. 2001).
b. WSR-88D
At present, the VN acquires ground radar data for
21 of the 59 National Oceanic and Atmospheric Ad-
ministration (NOAA)- and Department of Defense
(DoD)-operated Weather Service Radar-1988 Doppler
[WSR-88D; Next Generation Weather Radar (NEXRAD)]
302 J O U R N A L O F A T M O S P H E R I C A N D O C E A N I C T E C H N O L O G Y VOLUME 28
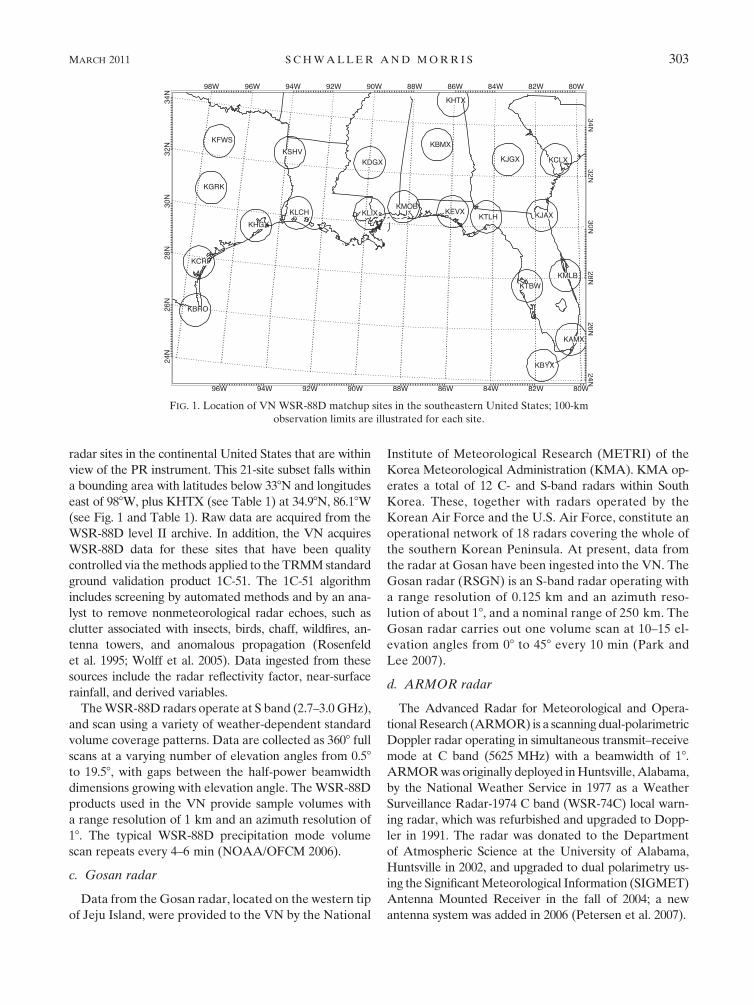
radar sites in the continental United States that are within
view of the PR instrument. This 21-site subset falls within
a bounding area with latitudes below 338N and longitudes
east of 988W, plus KHTX (see Table 1) at 34.98N, 86.18W
(see Fig. 1 and Table 1). Raw data are acquired from the
WSR-88D level II archive. In addition, the VN acquires
WSR-88D data for these sites that have been quality
controlled via the methods applied to the TRMM standard
ground validation product 1C-51. The 1C-51 algorithm
includes screening by automated methods and by an ana-
lyst to remove nonmeteorological radar echoes, such as
clutter associated with insects, birds, chaff, wildfires, an-
tenna towers, and anomalous propagation (Rosenfeld
et al. 1995; Wolff et al. 2005). Data ingested from these
sources include the radar reflectivity factor, near-surface
rainfall, and derived variables.
The WSR-88D radars operate at S band (2.7–3.0 GHz),
and scan using a variety of weather-dependent standard
volume coverage patterns. Data are collected as 3608 full
scans at a varying number of elevation angles from 0.58
to 19.58, with gaps between the half-power beamwidth
dimensions growing with elevation angle. The WSR-88D
products used in the VN provide sample volumes with
a range resolution of 1 km and an azimuth resolution of
18. The typical WSR-88D precipitation mode volume
scan repeats every 4–6 min (NOAA/OFCM 2006).
c. Gosan radar
Data from the Gosan radar, located on the western tip
of Jeju Island, were provided to the VN by the National
Institute of Meteorological Research (METRI) of the
Korea Meteorological Administration (KMA). KMA op-
erates a total of 12 C- and S-band radars within South
Korea. These, together with radars operated by the
Korean Air Force and the U.S. Air Force, constitute an
operational network of 18 radars covering the whole of
the southern Korean Peninsula. At present, data from
the radar at Gosan have been ingested into the VN. The
Gosan radar (RSGN) is an S-band radar operating with
a range resolution of 0.125 km and an azimuth reso-
lution of about 18, and a nominal range of 250 km. The
Gosan radar carries out one volume scan at 10–15 el-
evation angles from 08 to 458 every 10 min (Park and
Lee 2007).
d. ARMOR radar
The Advanced Radar for Meteorological and Opera-
tional Research (ARMOR) is a scanning dual-polarimetric
Doppler radar operating in simultaneous transmit–receive
mode at C band (5625 MHz) with a beamwidth of 18.
ARMOR was originally deployed in Huntsville, Alabama,
by the National Weather Service in 1977 as a Weather
Surveillance Radar-1974 C band (WSR-74C) local warn-
ing radar, which was refurbished and upgraded to Dopp-
ler in 1991. The radar was donated to the Department
of Atmospheric Science at the University of Alabama,
Huntsville in 2002, and upgraded to dual polarimetry us-
ing the Significant Meteorological Information (SIGMET)
Antenna Mounted Receiver in the fall of 2004; a new
antenna system was added in 2006 (Petersen et al. 2007).
FIG. 1. Location of VN WSR-88D matchup sites in the southeastern United States; 100-km
observation limits are illustrated for each site.
MARCH 2011 S C H W A L L E R A N D M O R R I S 303
e. Darwin radar
The Australian Bureau of Meteorology (BOM) oper-
ates the Darwin (DARW) C-band (5625 MHz) dual-
polarization Doppler radar (C-POL; Keenan et al. 1998),
with a beamwidth of 18 and polarimetric capability.
f. Kwajalein radar
The Kwajalein radar (KWAJ) is a modified Weather
Surveillance Radar-1993 (WSR-93) S-band (2780 MHz)
scanning radar with a beamwidth of 1.128 and Doppler and
dual-polarization capability upgrades. It is described in detail
in Schumacher and Houze (2000) and Wolff et al. (2005).
3. VN software description
The VN software suite consists of the following three
major components: 1) data ingest and preprocessing,
2) the resampling of PR and GR to common three-
dimensional data volumes (the creation of matchup data
products), and 3) the statistical analysis and display of the
matching data volumes.
The data ingest and preprocessing component of the
VN software ingests and stores TRMM PR and co-
incident ground radar data whenever an ‘‘overpass event’’
occurs. Such an event takes place any time the TRMM
PR ground track passes within 200 km of a VN GR site.
For each overpass event, the earliest GR volume scan,
beginning within a 9-min window centered on the satellite
overpass time, is acquired, along with its corresponding
PR data. GR data are acquired for the WSR-88D sites
on a routine, operational basis by the VN, via NASA’s
TRMM Ground Validation Office. Data for other the
ground radar sites are currently acquired by the VN on
an ad hoc basis from the data providers. Subsets of the
full-orbit PR data provided by the PPS for single radars
or adjacent groups of radars are acquired by the VN. All
data acquired by the VN are stored permanently in the
VN file system, unmodified and in their native format. All
of the acquired data files are cataloged in the VN in a
PostgreSQL relational database.
Selected fields of the PR products are analyzed upon
receipt to temporary 75 3 75 point Cartesian grids of
4-km resolution aligned to local north, with one centered
on each ground radar site overpassed by the TRMM
satellite in the given orbit. The VN software harvests
metadata parameters for each site-overpass event from
the temporary grids. These parameters serve to char-
acterize the precipitation and radar echo characteristics
of the event, and the gridding method allows for back-
ward compatibility with legacy grid-based methods of
PR and GR volume matching. Metadata are stored in
the VN relational database and are linked through the
database to the associated PR orbit subset and GR data
files. The stored metadata parameters include the av-
erage height of the bright band over the analysis area
and the number of grid points, as follows:
d total, in a horizontal grid slice;d covered by the PR data swath: total for grid, and total
within a 100-km radius of the GR site;d indicating rain certain: total, and within 100 km;d indicating convective rain type: total, and within 100 km;d indicating stratiform rain type: total, and within 100 kmd indicating rain type ‘‘other’’: total, and within 100 km;d indicating no rain: total, and within 100 km; andd indicating bright band exists: total, and within 100 km.
The time and distance of the nearest approach of the
TRMM orbit track to the ground radar site and the start
time of the GR volume scan are also stored in the data-
base. Queries to the database allow an analyst to easily
identify events with significant areal precipitation, events
of a given predominant rain type (convective, stratiform,
or unknown), or precipitation events where the orbital
track is within a threshold distance of the ground radar.
All associated PR and GR data files are cataloged in the
database and linked to the site-overpass events, making
it easy to identify and assemble associated data files for
significant events. Most site-overpass events will have
no occurrence of precipitation echoes. The preprocessed
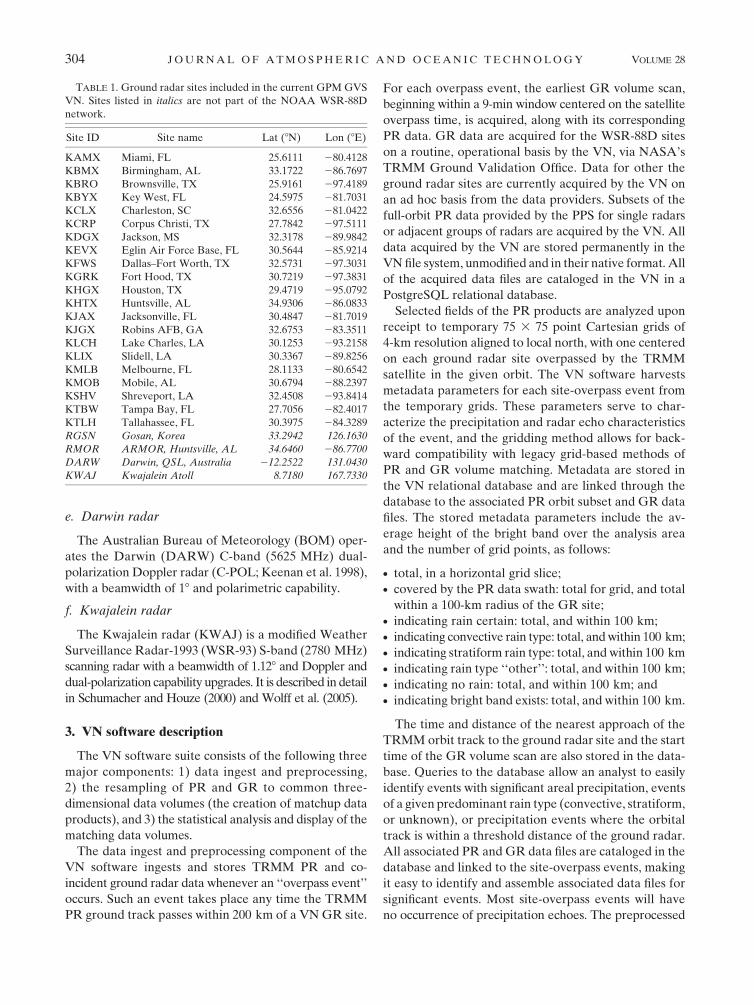
TABLE 1. Ground radar sites included in the current GPM GVS
VN. Sites listed in italics are not part of the NOAA WSR-88D
network.
Site ID Site name Lat (8N) Lon (8E)
KAMX Miami, FL 25.6111 280.4128
KBMX Birmingham, AL 33.1722 286.7697
KBRO Brownsville, TX 25.9161 297.4189
KBYX Key West, FL 24.5975 281.7031
KCLX Charleston, SC 32.6556 281.0422
KCRP Corpus Christi, TX 27.7842 297.5111
KDGX Jackson, MS 32.3178 289.9842
KEVX Eglin Air Force Base, FL 30.5644 285.9214
KFWS Dallas–Fort Worth, TX 32.5731 297.3031
KGRK Fort Hood, TX 30.7219 297.3831
KHGX Houston, TX 29.4719 295.0792
KHTX Huntsville, AL 34.9306 286.0833
KJAX Jacksonville, FL 30.4847 281.7019
KJGX Robins AFB, GA 32.6753 283.3511
KLCH Lake Charles, LA 30.1253 293.2158
KLIX Slidell, LA 30.3367 289.8256
KMLB Melbourne, FL 28.1133 280.6542
KMOB Mobile, AL 30.6794 288.2397
KSHV Shreveport, LA 32.4508 293.8414
KTBW Tampa Bay, FL 27.7056 282.4017
KTLH Tallahassee, FL 30.3975 284.3289
RGSN Gosan, Korea 33.2942 126.1630
RMOR ARMOR, Huntsville, AL 34.6460 286.7700
DARW Darwin, QSL, Australia 212.2522 131.0430
KWAJ Kwajalein Atoll 8.7180 167.7330
304 J O U R N A L O F A T M O S P H E R I C A N D O C E A N I C T E C H N O L O G Y VOLUME 28
metadata in the database makes it easy to select rainy
overpass events without the need to process all of the
data or make complicated time–space associations to
external data sources.
On average, about 48 coincident events with available
matching PR and GR data are collected each month for
each of the WSR-88D ground radars listed in Table 1.
Because of their proximity to the top of the TRMM or-
bit, the northernmost sites in the table experience about
twice the number of coincident overpasses as the south-
ernmost sites.
Although PR and GR data products from every over-
pass event are acquired and stored, PR-to-GR matchup
products are generated only when an overpass event oc-
curs during a ‘‘significant precipitation event,’’ as indicated
in the stored metadata for the event. A significant pre-
cipitation event is defined as one in which at least 100 grid
points (in total; not necessarily contiguous) within 100 km
of the radar indicate ‘‘rain certain’’ (as defined in the PR
product 2A-25). In the period from 8 August 2006 through
25 March 2009, a total of 32 244 coincident overpass events
at the WSR-88D sites were recorded by the VN. Of these,
2478 events met the significant precipitation criteria, and
2292 of these had matching GR data available. Thus,
per site and per month, about four coincidence events
meet the criteria for a VN rainfall event, and about 3.5
per month of these have both PR and GR data.
The resampling component of the VN software suite
performs a geometric matchup of the PR and GR data
for the significant precipitation events. In this method,
described in detail in section 4, common 3D volumes are
defined by the intersection of the individual PR rays
with the each of the conical elevation sweeps of the
ground radar for the time—space-coincident GR volume
scan. Thus, the resampled volume elements of the VN
PR and ground radars can be directly compared. An
earlier ‘‘legacy’’ version of the VN software involves re-
sampling the data to a fixed 3D Cartesian grid centered
on the radar site, following the analysis procedures de-
scribed in Liao et al. (2001). Both the legacy and the
current matchup software store the resulting PR-to-GR
‘‘matchups’’ as Network Common Data Form (netCDF)
files in the VN file system. The remainder of this paper is
restricted to descriptions and results pertaining to the
current geometric matchup version of the VN algorithm.
A statistical analysis and display component of the VN
software suite generates statistical comparisons and graph-
ical displays of PR and GR reflectivity factor and rain rate
from the volume-matched data for a wide variety of data
classifications. In many of the analysis and display pro-
grams, the data and results may be classified by individual
attributes or combinations of attributes stored as, or derived
from, variables stored within the netCDF files or the VN
database. Attributes may apply to the entire data file, to
a subset of the data in the file, or to an individual matchup
sample volume. The primary attributes on which the data
are classified typically include the following:
d GR site,d date–time ranges,d height above the surface,d proximity to the bright band (above, below, within),d precipitation type (stratiform, convective, other),d underlying surface (land, water, coast/mixed),d range from the ground radar,d percent completeness of the data volumes (expected
versus rejected gates, based on detection thresholds),
andd time difference between the PR and GR observations.
4. VN netCDF product generation
The current algorithm to match PR and GR reflec-
tivity data is based on calculating PR and GR averages
at the geometric intersection of the PR rays with the
individual GR radar elevation sweeps. By convention,
the intersection points processed in the matchup are re-
stricted to those where the intersection of the PR ray
with the earth surface is within a 100-km radius of the
GR site (Fig. 1). By 115-km range, radar systems such as
WSR-88D (18 beamwidth) will have a vertical resolution
.2 km, which is considered too coarse for meaningful
comparisons with the PR data.
The matchup method averages PR and GR full-
resolution space and ground radar bins within the min-
imum volume needed to produce a spatially coincident
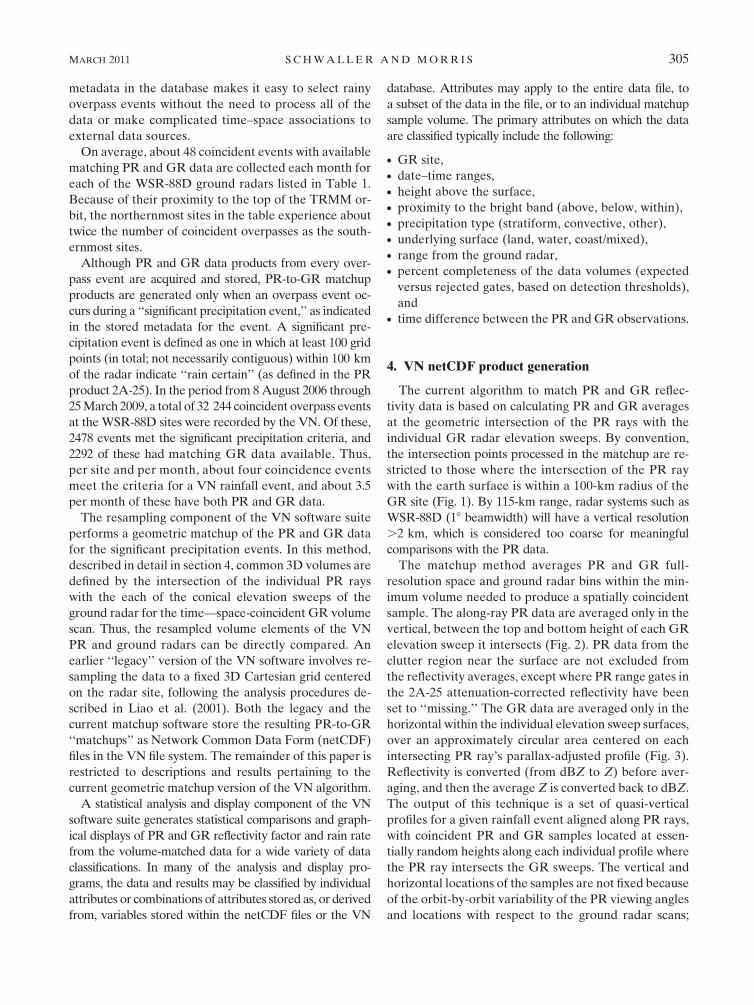
sample. The along-ray PR data are averaged only in the
vertical, between the top and bottom height of each GR
elevation sweep it intersects (Fig. 2). PR data from the
clutter region near the surface are not excluded from
the reflectivity averages, except where PR range gates in
the 2A-25 attenuation-corrected reflectivity have been
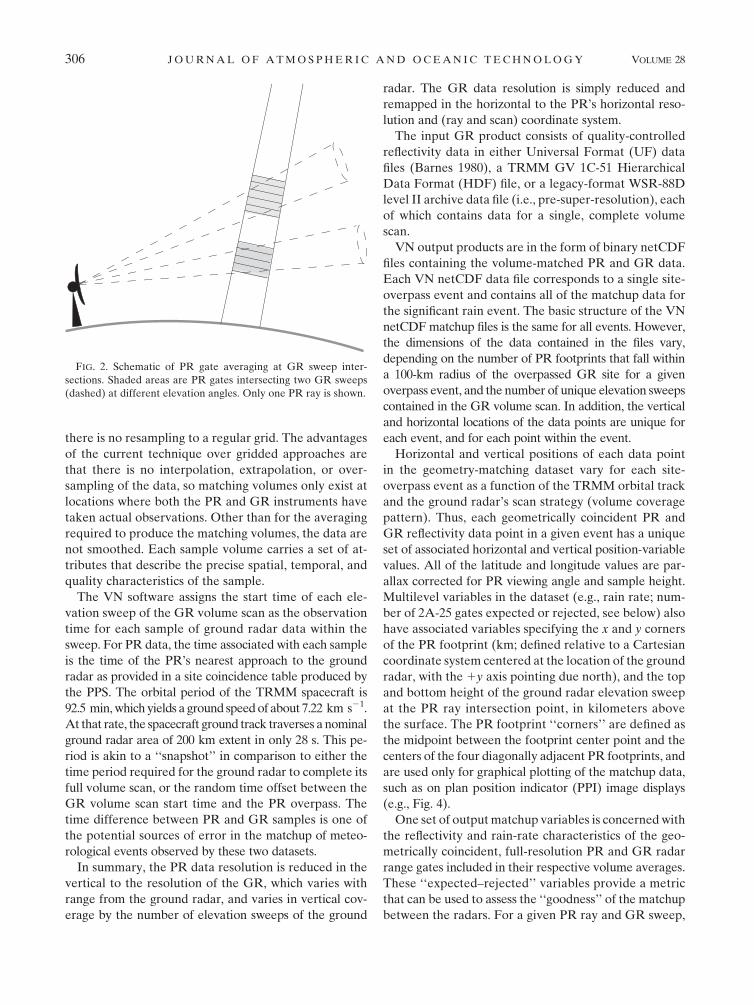
set to ‘‘missing.’’ The GR data are averaged only in the
horizontal within the individual elevation sweep surfaces,
over an approximately circular area centered on each
intersecting PR ray’s parallax-adjusted profile (Fig. 3).
Reflectivity is converted (from dBZ to Z) before aver-
aging, and then the average Z is converted back to dBZ.
The output of this technique is a set of quasi-vertical
profiles for a given rainfall event aligned along PR rays,
with coincident PR and GR samples located at essen-
tially random heights along each individual profile where
the PR ray intersects the GR sweeps. The vertical and
horizontal locations of the samples are not fixed because
of the orbit-by-orbit variability of the PR viewing angles
and locations with respect to the ground radar scans;
MARCH 2011 S C H W A L L E R A N D M O R R I S 305
there is no resampling to a regular grid. The advantages
of the current technique over gridded approaches are
that there is no interpolation, extrapolation, or over-
sampling of the data, so matching volumes only exist at
locations where both the PR and GR instruments have
taken actual observations. Other than for the averaging
required to produce the matching volumes, the data are
not smoothed. Each sample volume carries a set of at-
tributes that describe the precise spatial, temporal, and
quality characteristics of the sample.
The VN software assigns the start time of each ele-
vation sweep of the GR volume scan as the observation
time for each sample of ground radar data within the
sweep. For PR data, the time associated with each sample
is the time of the PR’s nearest approach to the ground
radar as provided in a site coincidence table produced by
the PPS. The orbital period of the TRMM spacecraft is
92.5 min, which yields a ground speed of about 7.22 km s21.
At that rate, the spacecraft ground track traverses a nominal
ground radar area of 200 km extent in only 28 s. This pe-
riod is akin to a ‘‘snapshot’’ in comparison to either the
time period required for the ground radar to complete its
full volume scan, or the random time offset between the
GR volume scan start time and the PR overpass. The
time difference between PR and GR samples is one of
the potential sources of error in the matchup of meteo-
rological events observed by these two datasets.
In summary, the PR data resolution is reduced in the
vertical to the resolution of the GR, which varies with
range from the ground radar, and varies in vertical cov-
erage by the number of elevation sweeps of the ground
radar. The GR data resolution is simply reduced and
remapped in the horizontal to the PR’s horizontal reso-
lution and (ray and scan) coordinate system.
The input GR product consists of quality-controlled
reflectivity data in either Universal Format (UF) data
files (Barnes 1980), a TRMM GV 1C-51 Hierarchical
Data Format (HDF) file, or a legacy-format WSR-88D
level II archive data file (i.e., pre-super-resolution), each
of which contains data for a single, complete volume
scan.
VN output products are in the form of binary netCDF
files containing the volume-matched PR and GR data.
Each VN netCDF data file corresponds to a single site-
overpass event and contains all of the matchup data for
the significant rain event. The basic structure of the VN
netCDF matchup files is the same for all events. However,
the dimensions of the data contained in the files vary,
depending on the number of PR footprints that fall within
a 100-km radius of the overpassed GR site for a given
overpass event, and the number of unique elevation sweeps
contained in the GR volume scan. In addition, the vertical
and horizontal locations of the data points are unique for
each event, and for each point within the event.
Horizontal and vertical positions of each data point
in the geometry-matching dataset vary for each site-
overpass event as a function of the TRMM orbital track
and the ground radar’s scan strategy (volume coverage
pattern). Thus, each geometrically coincident PR and
GR reflectivity data point in a given event has a unique
set of associated horizontal and vertical position-variable
values. All of the latitude and longitude values are par-
allax corrected for PR viewing angle and sample height.
Multilevel variables in the dataset (e.g., rain rate; num-
ber of 2A-25 gates expected or rejected, see below) also
have associated variables specifying the x and y corners
of the PR footprint (km; defined relative to a Cartesian
coordinate system centered at the location of the ground
radar, with the 1y axis pointing due north), and the top
and bottom height of the ground radar elevation sweep
at the PR ray intersection point, in kilometers above
the surface. The PR footprint ‘‘corners’’ are defined as
the midpoint between the footprint center point and the
centers of the four diagonally adjacent PR footprints, and
are used only for graphical plotting of the matchup data,
such as on plan position indicator (PPI) image displays
(e.g., Fig. 4).
One set of output matchup variables is concerned with
the reflectivity and rain-rate characteristics of the geo-
metrically coincident, full-resolution PR and GR radar
range gates included in their respective volume averages.
These ‘‘expected–rejected’’ variables provide a metric
that can be used to assess the ‘‘goodness’’ of the matchup
between the radars. For a given PR ray and GR sweep,
FIG. 2. Schematic of PR gate averaging at GR sweep inter-
sections. Shaded areas are PR gates intersecting two GR sweeps
(dashed) at different elevation angles. Only one PR ray is shown.
306 J O U R N A L O F A T M O S P H E R I C A N D O C E A N I C T E C H N O L O G Y VOLUME 28
several GR range gates and rays will typically intersect
several PR range gates, as illustrated in the vertical cross
section in Fig. 3. The geometry-matching algorithm com-
putes separate PR and GR volume-averaged values for
all such intersecting PR and GR range gates, with the
limitation that only those gates at or above specified re-
flectivity or rain-rate thresholds are included in the PR
and GR gate averages. This reflectivity threshold, while
selectable, is typically set at 18 dBZ for PR (the mini-
mum sensitivity level of the TRMM PR) and 15 dBZ for
ground radars. Individual PR or GR samples falling
below this threshold are ‘‘rejected,’’ that is, they are not
included in the matchup volume averages. When gener-
ating volume average reflectivity and rain-rate values for
each matchup volume, the VN algorithm calculates (i)
the number of PR and GR gates expected to be included
in the averages from a strictly geometric standpoint, and
(ii) the number of these PR and GR gates falling below
the applicable measurement threshold and rejected from
inclusion in the averages. These metrics are stored in
variables in the matchup netCDF file. In statistical anal-
yses of the data, effects of nonuniform beam filling and
biases related to the detection threshold of the PR may
be minimized by limiting the data points to those where
the number of rejected gates is zero for both the GR and
PR volume averages. See Fig. 4 for an example of the
effect of limiting the matchup data based on the percent
of rejected points in the sample averages.
The GPM validation network data product user’s guide
(NASA 2009) provides detailed descriptions of the VN
netCDF matchup data file format and content, includ-
ing a more detailed description of the gates expected–
rejected variables. Copies of the user’s guide are available
online from the GPM ground validation web site (online
at http://gpm.gsfc.nasa.gov/groundvalidation.html).
5. VN software and operations requirements
The VN software system exists as a set of Linux shell
scripts, PostgreSQL database utilities, SQL commands,
and a body of code written in Interactive Data Language
(IDL; online at http://www.ittvis.com). The PR subset
product and coincidence table data acquisition from the
PPS, and cataloging, preprocessing, metadata extrac-
tion, and storage for these products are automated within
the VN software. GR data receipt and cataloging are
FIG. 3. (top) Illustration of the intersection of TRMM PR and WSR-88D GR sample volumes in the (left) near
and (right) far range. (bottom) The projection of these intersections along a PR ray.
MARCH 2011 S C H W A L L E R A N D M O R R I S 307
automated for the WSR-88D sites, internal to the VN
system, while WSR-88D data acquisition, quality control,
and transmission to the VN system is a mix of automated
and manual procedures, and is externally handled for the
VN by the TRMM Ground Validation Office at NASA
Goddard Space Flight Center (GSFC). Primarily because
of security constraints, GR data acquisition and pro-
cessing for other GR sites are currently performed man-
ually on an ad hoc basis as data are made available by the
provider, and use supporting scripts written for this pur-
pose. Generation of the VN PR–GR matchup products
is also performed on an ad hoc basis, though it may be
readily automated to meet timeliness requirements for
the data in the GPM era.
The driving system requirements for the ability to run
the VN software are IDL running under Linux, UNIX,
or Mac OS X. The PostgreSQL relational database
management system (RDBMS) is required only for the
operational data ingest, cataloging, and preprocessing
component of the VN software suite, and is optional for
the matchup product generation and statistical analysis
and graphical display components. A different RDBMS
could be substituted for PostgreSQL with minor soft-
ware modifications. The Windows operating system is not
supported by the baseline VN software. All VN pro-
cessing and visualization software are designated ‘‘open
source,’’ and are available from the NASA GSFC In-
novative Partnerships Program Office Web site (online at
http://opensource.gsfc.nasa.gov).
The VN data processing system and database are
designed with the flexibility to add additional data prod-
ucts, ground radar sites, and metadata parameters. Any
ground radar sites within the TRMM PR area of cov-
erage may be supported within the current system as
long as the reflectivity data are available in a format
compatible with the TRMM Radar Software Library in
IDL (online at http://trmm-fc.gsfc.nasa.gov/index.html).
6. Visualization tools for case studies
A suite of visualization tools was developed for viewing
and analyzing the VN geometry matchup datasets for
individual site-overpass events. The two primary tools are
the statistical analysis tool and the vertical cross-sectional
tool. Noting that the matchup data are organized in the
vertical by the elevation sweeps of the ground radar, with
the horizontal sampling defined by the (ray and scan)
coordinates of the TRMM PR, the data lend themselves
to rendering as traditional PPI images. As with traditional
PPI images from a scanning ground radar, the height
above ground and the vertical depth of the matchup
samples plotted in the PPI display increase with distance
from the ground radar.
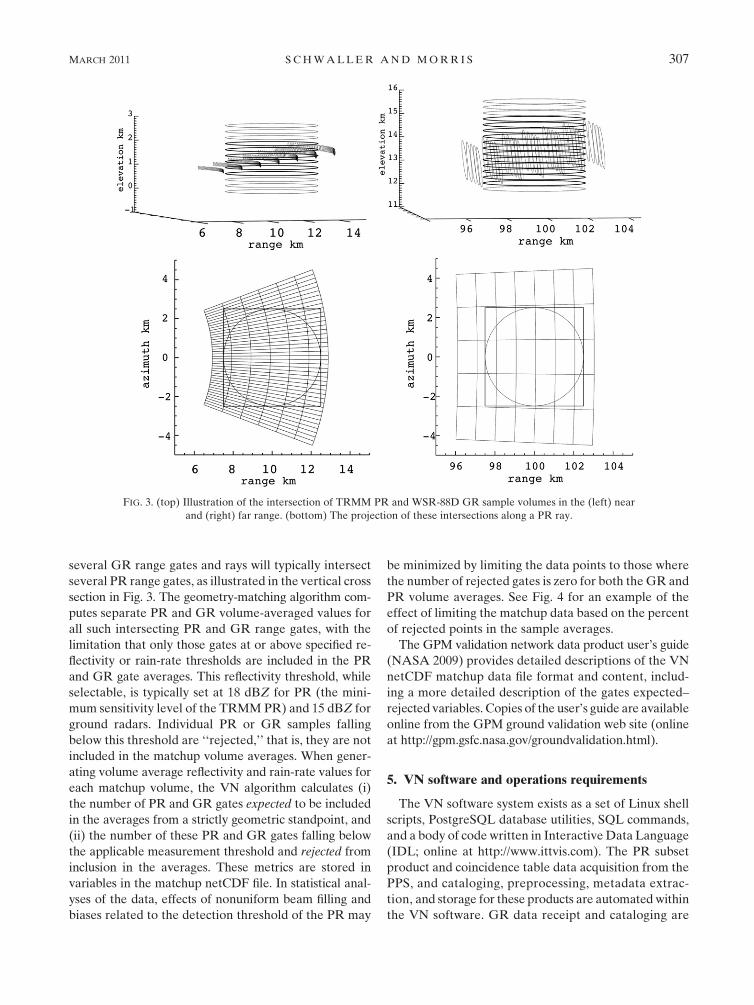
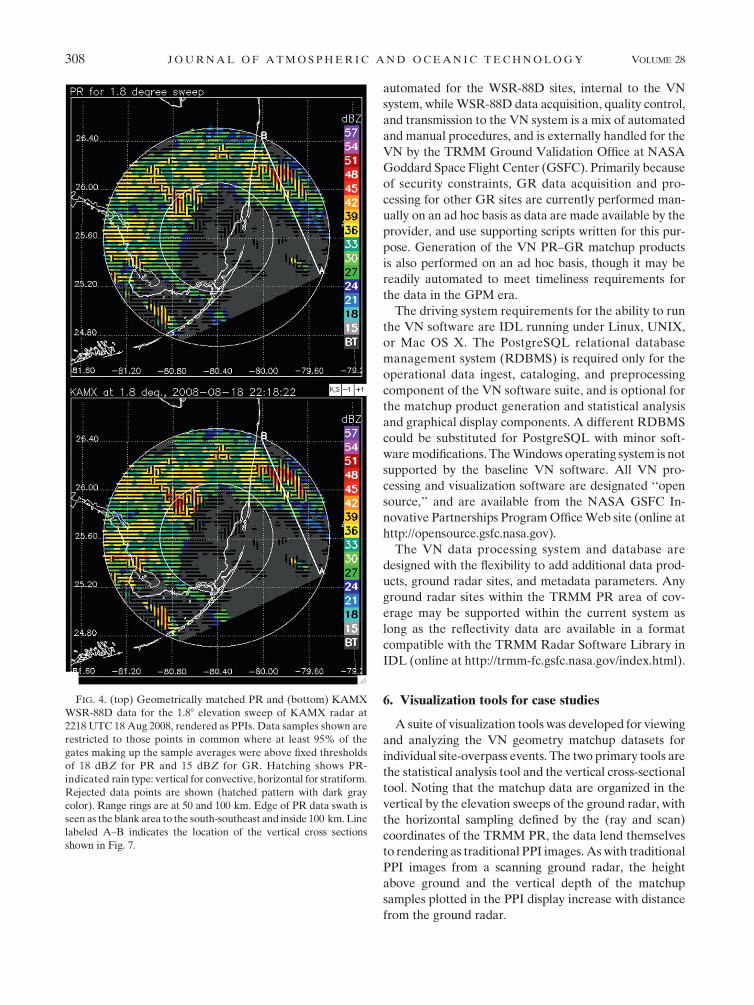
FIG. 4. (top) Geometrically matched PR and (bottom) KAMX
WSR-88D data for the 1.88 elevation sweep of KAMX radar at
2218 UTC 18 Aug 2008, rendered as PPIs. Data samples shown are
restricted to those points in common where at least 95% of the
gates making up the sample averages were above fixed thresholds
of 18 dBZ for PR and 15 dBZ for GR. Hatching shows PR-
indicated rain type: vertical for convective, horizontal for stratiform.
Rejected data points are shown (hatched pattern with dark gray
color). Range rings are at 50 and 100 km. Edge of PR data swath is
seen as the blank area to the south-southeast and inside 100 km. Line
labeled A–B indicates the location of the vertical cross sections
shown in Fig. 7.
308 J O U R N A L O F A T M O S P H E R I C A N D O C E A N I C T E C H N O L O G Y VOLUME 28
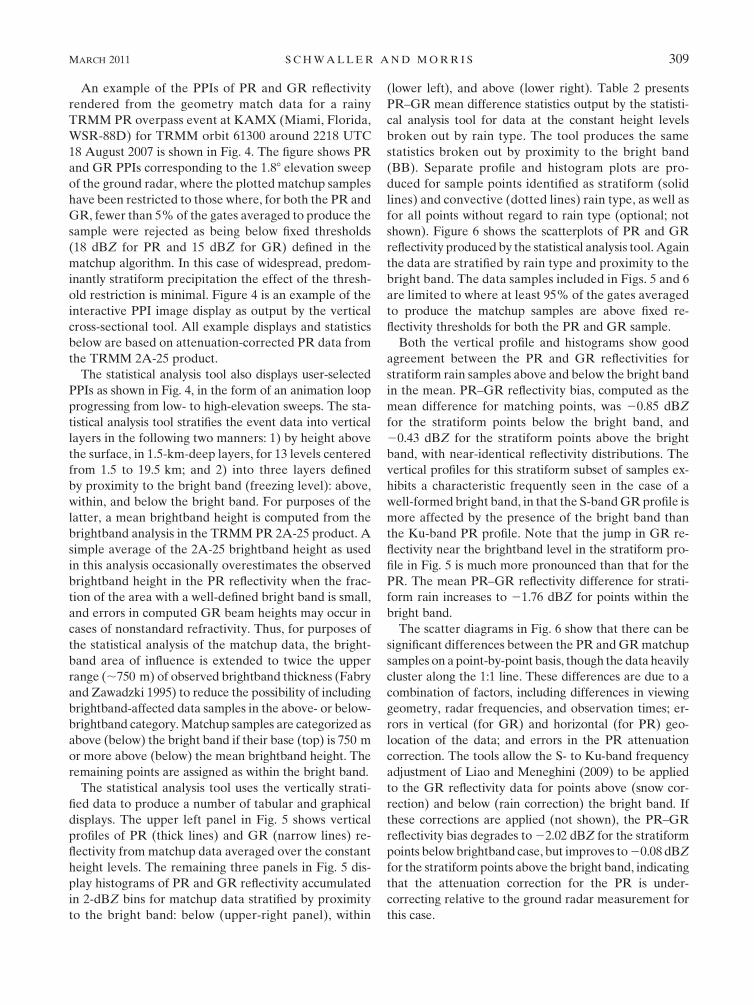
An example of the PPIs of PR and GR reflectivity
rendered from the geometry match data for a rainy
TRMM PR overpass event at KAMX (Miami, Florida,
WSR-88D) for TRMM orbit 61300 around 2218 UTC
18 August 2007 is shown in Fig. 4. The figure shows PR
and GR PPIs corresponding to the 1.88 elevation sweep
of the ground radar, where the plotted matchup samples
have been restricted to those where, for both the PR and
GR, fewer than 5% of the gates averaged to produce the
sample were rejected as being below fixed thresholds
(18 dBZ for PR and 15 dBZ for GR) defined in the
matchup algorithm. In this case of widespread, predom-
inantly stratiform precipitation the effect of the thresh-
old restriction is minimal. Figure 4 is an example of the
interactive PPI image display as output by the vertical
cross-sectional tool. All example displays and statistics
below are based on attenuation-corrected PR data from
the TRMM 2A-25 product.
The statistical analysis tool also displays user-selected
PPIs as shown in Fig. 4, in the form of an animation loop
progressing from low- to high-elevation sweeps. The sta-
tistical analysis tool stratifies the event data into vertical
layers in the following two manners: 1) by height above
the surface, in 1.5-km-deep layers, for 13 levels centered
from 1.5 to 19.5 km; and 2) into three layers defined
by proximity to the bright band (freezing level): above,
within, and below the bright band. For purposes of the
latter, a mean brightband height is computed from the
brightband analysis in the TRMM PR 2A-25 product. A
simple average of the 2A-25 brightband height as used
in this analysis occasionally overestimates the observed
brightband height in the PR reflectivity when the frac-
tion of the area with a well-defined bright band is small,
and errors in computed GR beam heights may occur in
cases of nonstandard refractivity. Thus, for purposes of
the statistical analysis of the matchup data, the bright-
band area of influence is extended to twice the upper
range (;750 m) of observed brightband thickness (Fabry
and Zawadzki 1995) to reduce the possibility of including
brightband-affected data samples in the above- or below-
brightband category. Matchup samples are categorized as
above (below) the bright band if their base (top) is 750 m
or more above (below) the mean brightband height. The
remaining points are assigned as within the bright band.
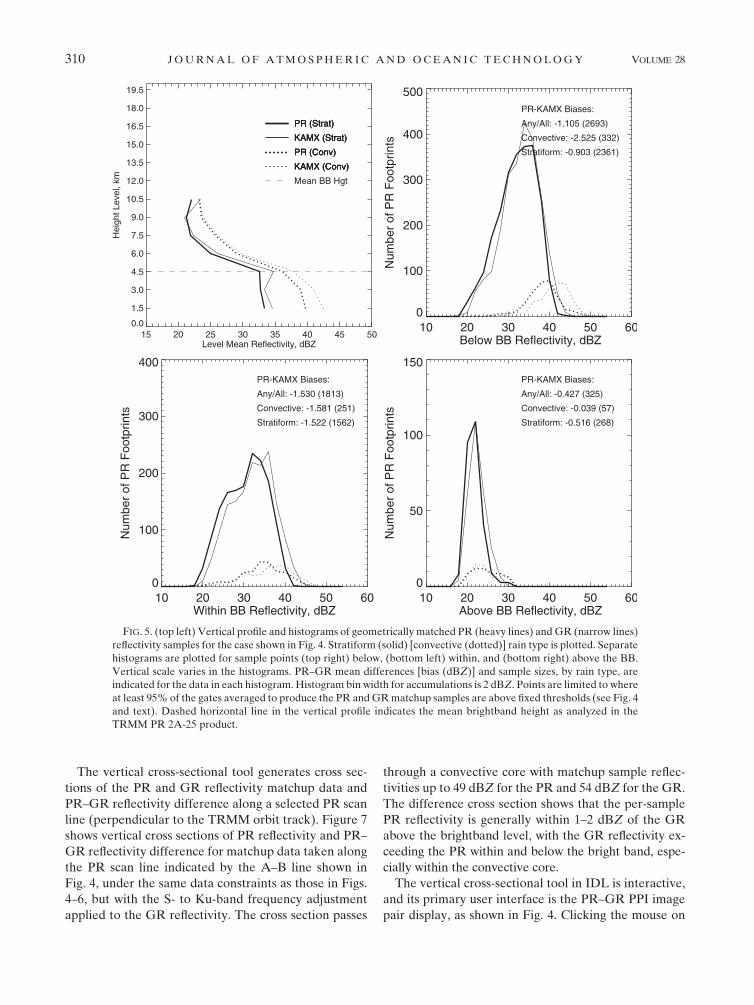
The statistical analysis tool uses the vertically strati-
fied data to produce a number of tabular and graphical
displays. The upper left panel in Fig. 5 shows vertical
profiles of PR (thick lines) and GR (narrow lines) re-
flectivity from matchup data averaged over the constant
height levels. The remaining three panels in Fig. 5 dis-
play histograms of PR and GR reflectivity accumulated
in 2-dBZ bins for matchup data stratified by proximity
to the bright band: below (upper-right panel), within
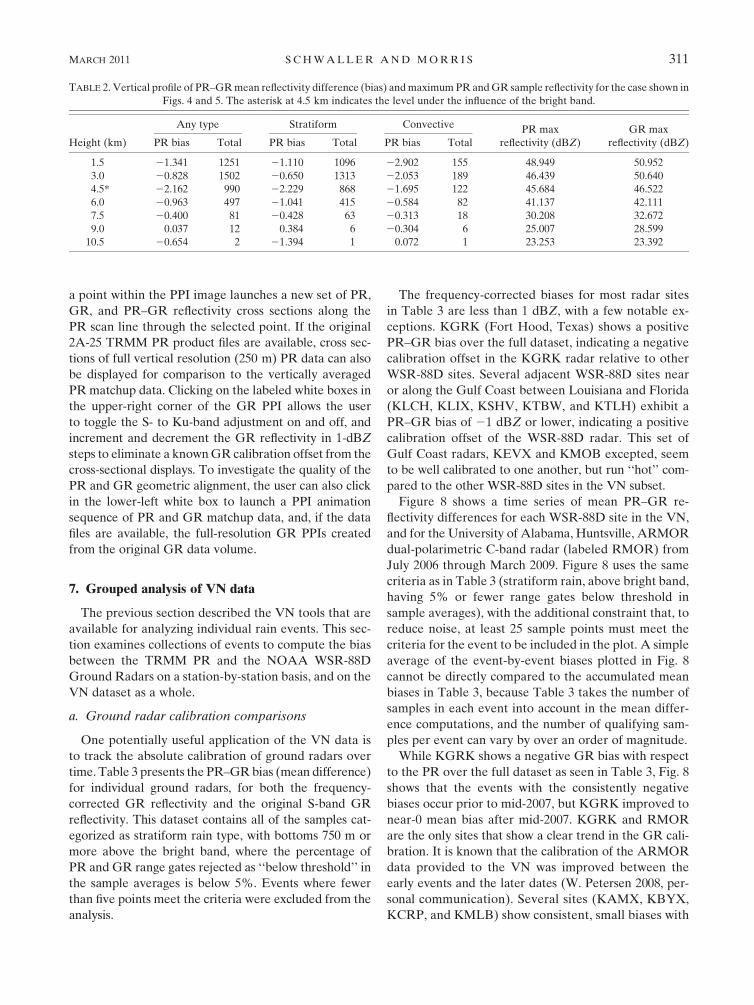
(lower left), and above (lower right). Table 2 presents
PR–GR mean difference statistics output by the statisti-
cal analysis tool for data at the constant height levels
broken out by rain type. The tool produces the same
statistics broken out by proximity to the bright band
(BB). Separate profile and histogram plots are pro-
duced for sample points identified as stratiform (solid
lines) and convective (dotted lines) rain type, as well as
for all points without regard to rain type (optional; not
shown). Figure 6 shows the scatterplots of PR and GR
reflectivity produced by the statistical analysis tool. Again
the data are stratified by rain type and proximity to the
bright band. The data samples included in Figs. 5 and 6
are limited to where at least 95% of the gates averaged
to produce the matchup samples are above fixed re-
flectivity thresholds for both the PR and GR sample.
Both the vertical profile and histograms show good
agreement between the PR and GR reflectivities for
stratiform rain samples above and below the bright band
in the mean. PR–GR reflectivity bias, computed as the
mean difference for matching points, was 20.85 dBZ
for the stratiform points below the bright band, and
20.43 dBZ for the stratiform points above the bright
band, with near-identical reflectivity distributions. The
vertical profiles for this stratiform subset of samples ex-
hibits a characteristic frequently seen in the case of a
well-formed bright band, in that the S-band GR profile is
more affected by the presence of the bright band than
the Ku-band PR profile. Note that the jump in GR re-
flectivity near the brightband level in the stratiform pro-
file in Fig. 5 is much more pronounced than that for the
PR. The mean PR–GR reflectivity difference for strati-
form rain increases to 21.76 dBZ for points within the
bright band.
The scatter diagrams in Fig. 6 show that there can be
significant differences between the PR and GR matchup
samples on a point-by-point basis, though the data heavily
cluster along the 1:1 line. These differences are due to a
combination of factors, including differences in viewing
geometry, radar frequencies, and observation times; er-
rors in vertical (for GR) and horizontal (for PR) geo-
location of the data; and errors in the PR attenuation
correction. The tools allow the S- to Ku-band frequency
adjustment of Liao and Meneghini (2009) to be applied
to the GR reflectivity data for points above (snow cor-
rection) and below (rain correction) the bright band. If
these corrections are applied (not shown), the PR–GR
reflectivity bias degrades to 22.02 dBZ for the stratiform
points below brightband case, but improves to 20.08 dBZ
for the stratiform points above the bright band, indicating
that the attenuation correction for the PR is under-
correcting relative to the ground radar measurement for
this case.
MARCH 2011 S C H W A L L E R A N D M O R R I S 309
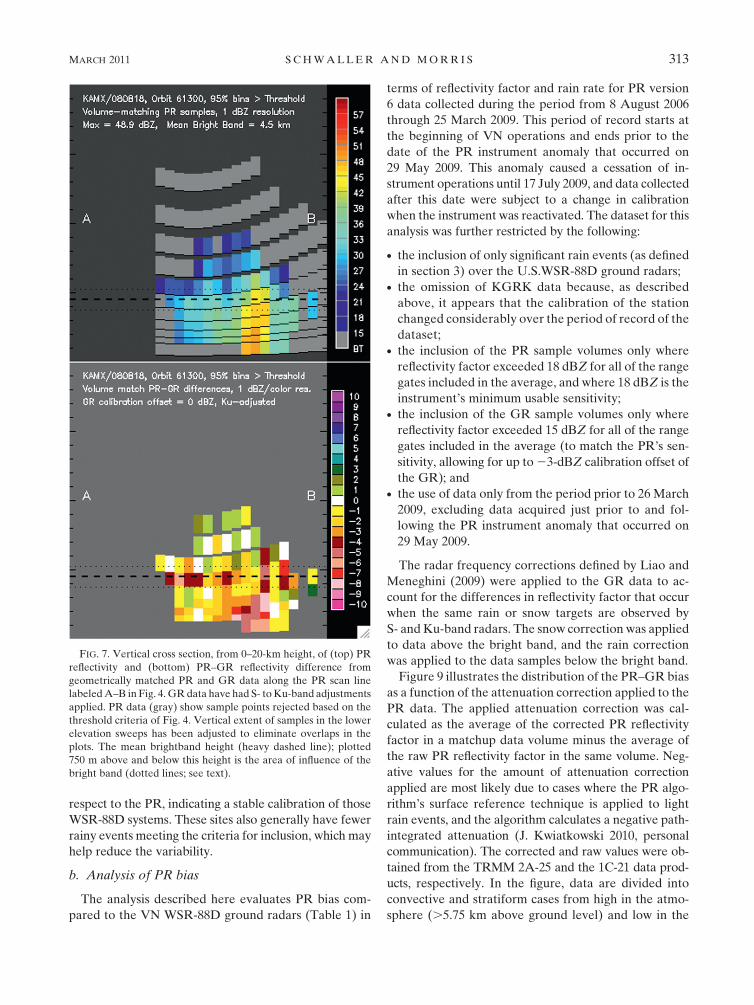
The vertical cross-sectional tool generates cross sec-
tions of the PR and GR reflectivity matchup data and
PR–GR reflectivity difference along a selected PR scan
line (perpendicular to the TRMM orbit track). Figure 7
shows vertical cross sections of PR reflectivity and PR–
GR reflectivity difference for matchup data taken along
the PR scan line indicated by the A–B line shown in
Fig. 4, under the same data constraints as those in Figs.
4–6, but with the S- to Ku-band frequency adjustment
applied to the GR reflectivity. The cross section passes
through a convective core with matchup sample reflec-
tivities up to 49 dBZ for the PR and 54 dBZ for the GR.
The difference cross section shows that the per-sample
PR reflectivity is generally within 1–2 dBZ of the GR
above the brightband level, with the GR reflectivity ex-
ceeding the PR within and below the bright band, espe-
cially within the convective core.
The vertical cross-sectional tool in IDL is interactive,
and its primary user interface is the PR–GR PPI image
pair display, as shown in Fig. 4. Clicking the mouse on
FIG. 5. (top left) Vertical profile and histograms of geometrically matched PR (heavy lines) and GR (narrow lines)
reflectivity samples for the case shown in Fig. 4. Stratiform (solid) [convective (dotted)] rain type is plotted. Separate
histograms are plotted for sample points (top right) below, (bottom left) within, and (bottom right) above the BB.
Vertical scale varies in the histograms. PR–GR mean differences [bias (dBZ)] and sample sizes, by rain type, are
indicated for the data in each histogram. Histogram bin width for accumulations is 2 dBZ. Points are limited to where
at least 95% of the gates averaged to produce the PR and GR matchup samples are above fixed thresholds (see Fig. 4
and text). Dashed horizontal line in the vertical profile indicates the mean brightband height as analyzed in the
TRMM PR 2A-25 product.
310 J O U R N A L O F A T M O S P H E R I C A N D O C E A N I C T E C H N O L O G Y VOLUME 28
a point within the PPI image launches a new set of PR,
GR, and PR–GR reflectivity cross sections along the
PR scan line through the selected point. If the original
2A-25 TRMM PR product files are available, cross sec-
tions of full vertical resolution (250 m) PR data can also
be displayed for comparison to the vertically averaged
PR matchup data. Clicking on the labeled white boxes in
the upper-right corner of the GR PPI allows the user
to toggle the S- to Ku-band adjustment on and off, and
increment and decrement the GR reflectivity in 1-dBZ
steps to eliminate a known GR calibration offset from the
cross-sectional displays. To investigate the quality of the
PR and GR geometric alignment, the user can also click
in the lower-left white box to launch a PPI animation
sequence of PR and GR matchup data, and, if the data
files are available, the full-resolution GR PPIs created
from the original GR data volume.
7. Grouped analysis of VN data
The previous section described the VN tools that are
available for analyzing individual rain events. This sec-
tion examines collections of events to compute the bias
between the TRMM PR and the NOAA WSR-88D
Ground Radars on a station-by-station basis, and on the
VN dataset as a whole.
a. Ground radar calibration comparisons
One potentially useful application of the VN data is
to track the absolute calibration of ground radars over
time. Table 3 presents the PR–GR bias (mean difference)
for individual ground radars, for both the frequency-
corrected GR reflectivity and the original S-band GR
reflectivity. This dataset contains all of the samples cat-
egorized as stratiform rain type, with bottoms 750 m or
more above the bright band, where the percentage of
PR and GR range gates rejected as ‘‘below threshold’’ in
the sample averages is below 5%. Events where fewer
than five points meet the criteria were excluded from the
analysis.
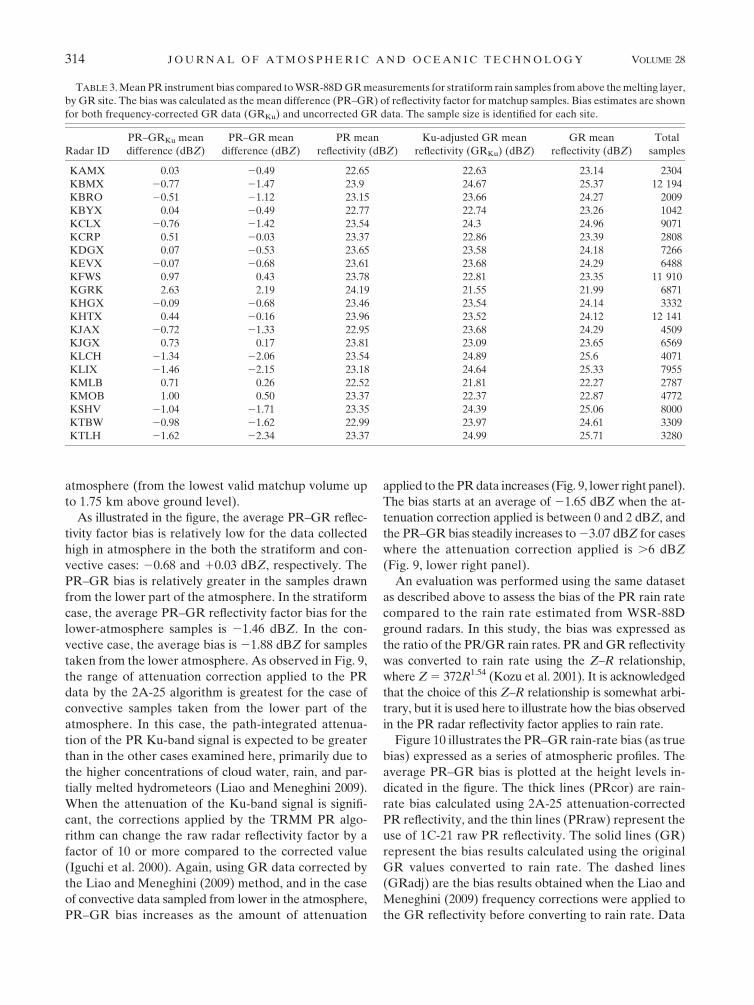
The frequency-corrected biases for most radar sites
in Table 3 are less than 1 dBZ, with a few notable ex-
ceptions. KGRK (Fort Hood, Texas) shows a positive
PR–GR bias over the full dataset, indicating a negative
calibration offset in the KGRK radar relative to other
WSR-88D sites. Several adjacent WSR-88D sites near
or along the Gulf Coast between Louisiana and Florida
(KLCH, KLIX, KSHV, KTBW, and KTLH) exhibit a
PR–GR bias of 21 dBZ or lower, indicating a positive
calibration offset of the WSR-88D radar. This set of
Gulf Coast radars, KEVX and KMOB excepted, seem
to be well calibrated to one another, but run ‘‘hot’’ com-
pared to the other WSR-88D sites in the VN subset.
Figure 8 shows a time series of mean PR–GR re-
flectivity differences for each WSR-88D site in the VN,
and for the University of Alabama, Huntsville, ARMOR
dual-polarimetric C-band radar (labeled RMOR) from
July 2006 through March 2009. Figure 8 uses the same
criteria as in Table 3 (stratiform rain, above bright band,
having 5% or fewer range gates below threshold in
sample averages), with the additional constraint that, to
reduce noise, at least 25 sample points must meet the
criteria for the event to be included in the plot. A simple
average of the event-by-event biases plotted in Fig. 8
cannot be directly compared to the accumulated mean
biases in Table 3, because Table 3 takes the number of
samples in each event into account in the mean differ-
ence computations, and the number of qualifying sam-
ples per event can vary by over an order of magnitude.
While KGRK shows a negative GR bias with respect
to the PR over the full dataset as seen in Table 3, Fig. 8
shows that the events with the consistently negative
biases occur prior to mid-2007, but KGRK improved to
near-0 mean bias after mid-2007. KGRK and RMOR
are the only sites that show a clear trend in the GR cali-
bration. It is known that the calibration of the ARMOR
data provided to the VN was improved between the
early events and the later dates (W. Petersen 2008, per-
sonal communication). Several sites (KAMX, KBYX,
KCRP, and KMLB) show consistent, small biases with
TABLE 2. Vertical profile of PR–GR mean reflectivity difference (bias) and maximum PR and GR sample reflectivity for the case shown in
Figs. 4 and 5. The asterisk at 4.5 km indicates the level under the influence of the bright band.
Height (km)
Any type Stratiform Convective PR max
reflectivity (dBZ)
GR max
reflectivity (dBZ)PR bias Total PR bias Total PR bias Total
1.5 21.341 1251 21.110 1096 22.902 155 48.949 50.952
3.0 20.828 1502 20.650 1313 22.053 189 46.439 50.640
4.5* 22.162 990 22.229 868 21.695 122 45.684 46.522
6.0 20.963 497 21.041 415 20.584 82 41.137 42.111
7.5 20.400 81 20.428 63 20.313 18 30.208 32.672
9.0 0.037 12 0.384 6 20.304 6 25.007 28.599
10.5 20.654 2 21.394 1 0.072 1 23.253 23.392
MARCH 2011 S C H W A L L E R A N D M O R R I S 311
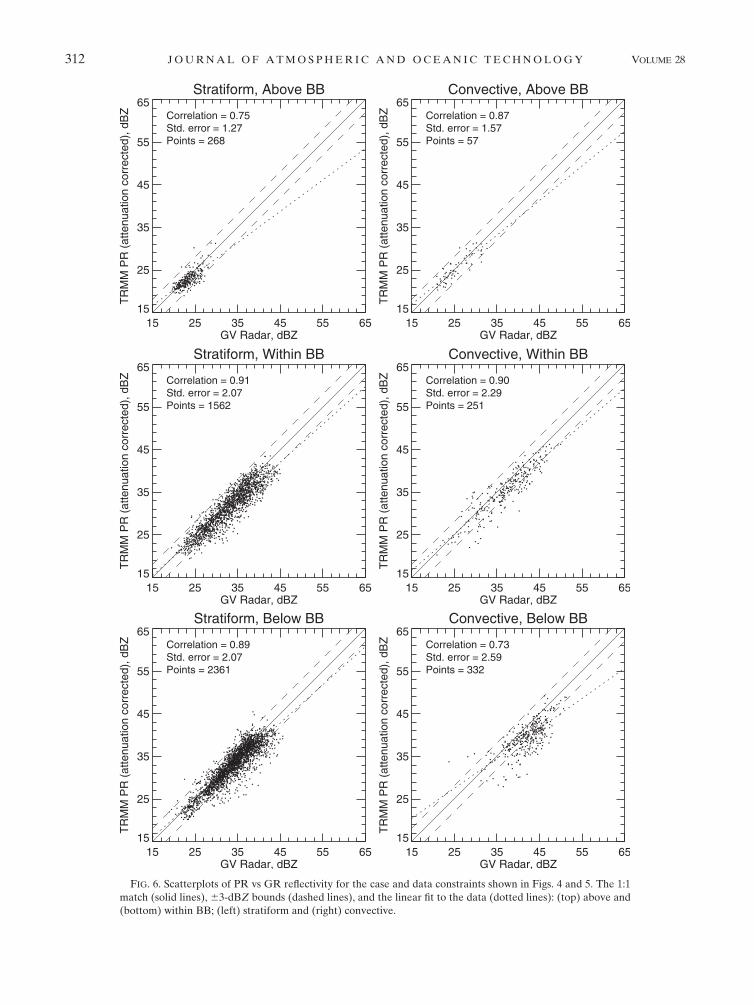
FIG. 6. Scatterplots of PR vs GR reflectivity for the case and data constraints shown in Figs. 4 and 5. The 1:1
match (solid lines), 63-dBZ bounds (dashed lines), and the linear fit to the data (dotted lines): (top) above and
(bottom) within BB; (left) stratiform and (right) convective.
312 J O U R N A L O F A T M O S P H E R I C A N D O C E A N I C T E C H N O L O G Y VOLUME 28
respect to the PR, indicating a stable calibration of those
WSR-88D systems. These sites also generally have fewer
rainy events meeting the criteria for inclusion, which may
help reduce the variability.
b. Analysis of PR bias
The analysis described here evaluates PR bias com-
pared to the VN WSR-88D ground radars (Table 1) in
terms of reflectivity factor and rain rate for PR version
6 data collected during the period from 8 August 2006
through 25 March 2009. This period of record starts at
the beginning of VN operations and ends prior to the
date of the PR instrument anomaly that occurred on
29 May 2009. This anomaly caused a cessation of in-
strument operations until 17 July 2009, and data collected
after this date were subject to a change in calibration
when the instrument was reactivated. The dataset for this
analysis was further restricted by the following:
d the inclusion of only significant rain events (as defined
in section 3) over the U.S.WSR-88D ground radars;d the omission of KGRK data because, as described
above, it appears that the calibration of the station
changed considerably over the period of record of the
dataset;d the inclusion of the PR sample volumes only where
reflectivity factor exceeded 18 dBZ for all of the range
gates included in the average, and where 18 dBZ is the
instrument’s minimum usable sensitivity;d the inclusion of the GR sample volumes only where
reflectivity factor exceeded 15 dBZ for all of the range
gates included in the average (to match the PR’s sen-
sitivity, allowing for up to 23-dBZ calibration offset of
the GR); andd the use of data only from the period prior to 26 March
2009, excluding data acquired just prior to and fol-
lowing the PR instrument anomaly that occurred on
29 May 2009.
The radar frequency corrections defined by Liao and
Meneghini (2009) were applied to the GR data to ac-
count for the differences in reflectivity factor that occur
when the same rain or snow targets are observed by
S- and Ku-band radars. The snow correction was applied
to data above the bright band, and the rain correction
was applied to the data samples below the bright band.
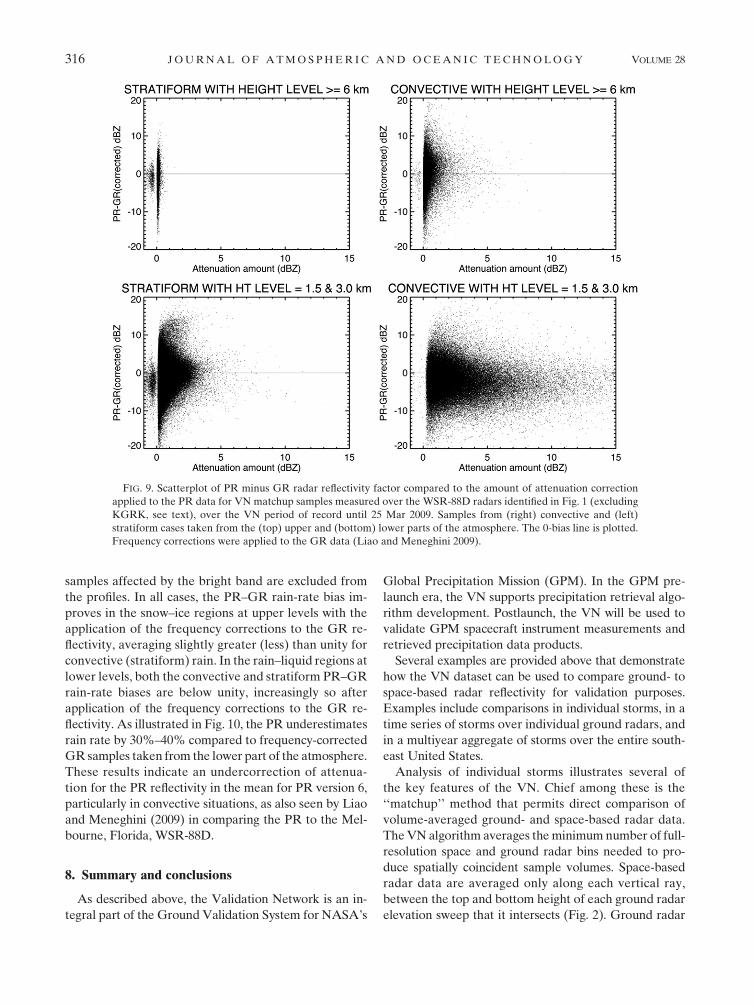
Figure 9 illustrates the distribution of the PR–GR bias
as a function of the attenuation correction applied to the
PR data. The applied attenuation correction was cal-
culated as the average of the corrected PR reflectivity
factor in a matchup data volume minus the average of
the raw PR reflectivity factor in the same volume. Neg-
ative values for the amount of attenuation correction
applied are most likely due to cases where the PR algo-
rithm’s surface reference technique is applied to light
rain events, and the algorithm calculates a negative path-
integrated attenuation (J. Kwiatkowski 2010, personal
communication). The corrected and raw values were ob-
tained from the TRMM 2A-25 and the 1C-21 data prod-
ucts, respectively. In the figure, data are divided into
convective and stratiform cases from high in the atmo-
sphere (.5.75 km above ground level) and low in the
FIG. 7. Vertical cross section, from 0–20-km height, of (top) PR
reflectivity and (bottom) PR–GR reflectivity difference from
geometrically matched PR and GR data along the PR scan line
labeled A–B in Fig. 4. GR data have had S- to Ku-band adjustments
applied. PR data (gray) show sample points rejected based on the
threshold criteria of Fig. 4. Vertical extent of samples in the lower
elevation sweeps has been adjusted to eliminate overlaps in the
plots. The mean brightband height (heavy dashed line); plotted
750 m above and below this height is the area of influence of the
bright band (dotted lines; see text).
MARCH 2011 S C H W A L L E R A N D M O R R I S 313
atmosphere (from the lowest valid matchup volume up
to 1.75 km above ground level).
As illustrated in the figure, the average PR–GR reflec-
tivity factor bias is relatively low for the data collected
high in atmosphere in the both the stratiform and con-
vective cases: 20.68 and 10.03 dBZ, respectively. The
PR–GR bias is relatively greater in the samples drawn
from the lower part of the atmosphere. In the stratiform
case, the average PR–GR reflectivity factor bias for the
lower-atmosphere samples is 21.46 dBZ. In the con-
vective case, the average bias is 21.88 dBZ for samples
taken from the lower atmosphere. As observed in Fig. 9,
the range of attenuation correction applied to the PR
data by the 2A-25 algorithm is greatest for the case of
convective samples taken from the lower part of the
atmosphere. In this case, the path-integrated attenua-
tion of the PR Ku-band signal is expected to be greater
than in the other cases examined here, primarily due to
the higher concentrations of cloud water, rain, and par-
tially melted hydrometeors (Liao and Meneghini 2009).
When the attenuation of the Ku-band signal is signifi-
cant, the corrections applied by the TRMM PR algo-
rithm can change the raw radar reflectivity factor by a
factor of 10 or more compared to the corrected value
(Iguchi et al. 2000). Again, using GR data corrected by
the Liao and Meneghini (2009) method, and in the case
of convective data sampled from lower in the atmosphere,
PR–GR bias increases as the amount of attenuation
applied to the PR data increases (Fig. 9, lower right panel).
The bias starts at an average of 21.65 dBZ when the at-
tenuation correction applied is between 0 and 2 dBZ, and
the PR–GR bias steadily increases to 23.07 dBZ for cases
where the attenuation correction applied is .6 dBZ
(Fig. 9, lower right panel).
An evaluation was performed using the same dataset
as described above to assess the bias of the PR rain rate
compared to the rain rate estimated from WSR-88D
ground radars. In this study, the bias was expressed as
the ratio of the PR/GR rain rates. PR and GR reflectivity
was converted to rain rate using the Z–R relationship,
where Z 5 372R1.54 (Kozu et al. 2001). It is acknowledged
that the choice of this Z–R relationship is somewhat arbi-
trary, but it is used here to illustrate how the bias observed
in the PR radar reflectivity factor applies to rain rate.
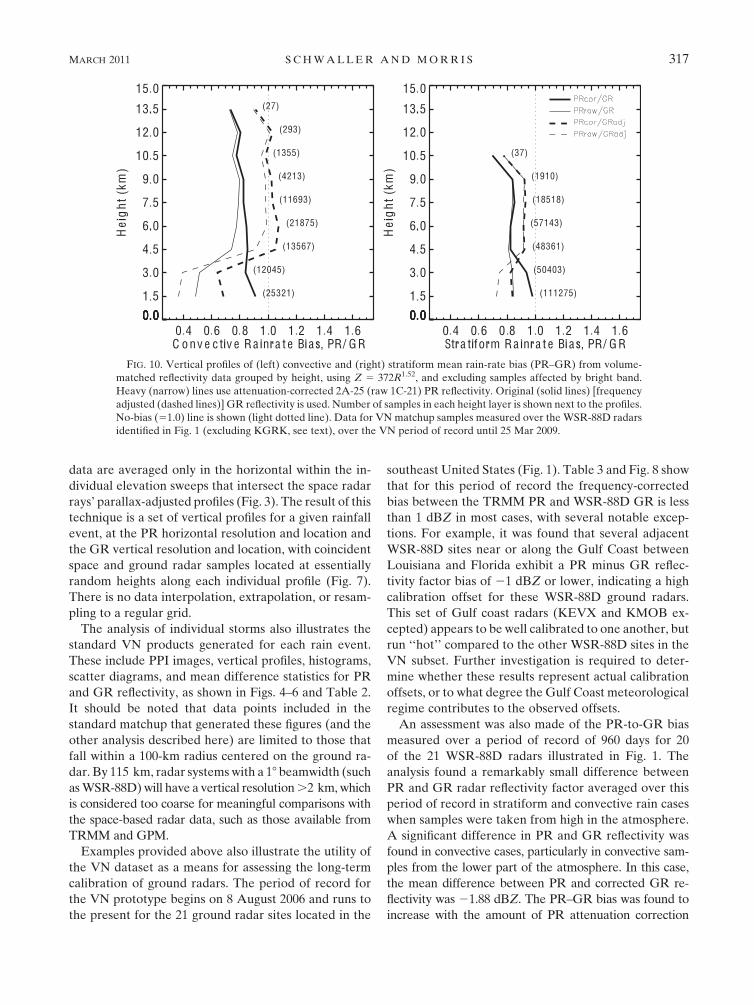
Figure 10 illustrates the PR–GR rain-rate bias (as true
bias) expressed as a series of atmospheric profiles. The
average PR–GR bias is plotted at the height levels in-
dicated in the figure. The thick lines (PRcor) are rain-
rate bias calculated using 2A-25 attenuation-corrected
PR reflectivity, and the thin lines (PRraw) represent the
use of 1C-21 raw PR reflectivity. The solid lines (GR)
represent the bias results calculated using the original
GR values converted to rain rate. The dashed lines
(GRadj) are the bias results obtained when the Liao and
Meneghini (2009) frequency corrections were applied to
the GR reflectivity before converting to rain rate. Data
TABLE 3. Mean PR instrument bias compared to WSR-88D GR measurements for stratiform rain samples from above the melting layer,
by GR site. The bias was calculated as the mean difference (PR–GR) of reflectivity factor for matchup samples. Bias estimates are shown
for both frequency-corrected GR data (GRKu) and uncorrected GR data. The sample size is identified for each site.
Radar ID
PR–GRKu mean
difference (dBZ)
PR–GR mean
difference (dBZ)
PR mean
reflectivity (dBZ)
Ku-adjusted GR mean
reflectivity (GRKu) (dBZ)
GR mean
reflectivity (dBZ)
Total
samples
KAMX 0.03 20.49 22.65 22.63 23.14 2304
KBMX 20.77 21.47 23.9 24.67 25.37 12 194
KBRO 20.51 21.12 23.15 23.66 24.27 2009
KBYX 0.04 20.49 22.77 22.74 23.26 1042
KCLX 20.76 21.42 23.54 24.3 24.96 9071
KCRP 0.51 20.03 23.37 22.86 23.39 2808
KDGX 0.07 20.53 23.65 23.58 24.18 7266
KEVX 20.07 20.68 23.61 23.68 24.29 6488
KFWS 0.97 0.43 23.78 22.81 23.35 11 910
KGRK 2.63 2.19 24.19 21.55 21.99 6871
KHGX 20.09 20.68 23.46 23.54 24.14 3332
KHTX 0.44 20.16 23.96 23.52 24.12 12 141
KJAX 20.72 21.33 22.95 23.68 24.29 4509
KJGX 0.73 0.17 23.81 23.09 23.65 6569
KLCH 21.34 22.06 23.54 24.89 25.6 4071
KLIX 21.46 22.15 23.18 24.64 25.33 7955
KMLB 0.71 0.26 22.52 21.81 22.27 2787
KMOB 1.00 0.50 23.37 22.37 22.87 4772
KSHV 21.04 21.71 23.35 24.39 25.06 8000
KTBW 20.98 21.62 22.99 23.97 24.61 3309
KTLH 21.62 22.34 23.37 24.99 25.71 3280
314 J O U R N A L O F A T M O S P H E R I C A N D O C E A N I C T E C H N O L O G Y VOLUME 28
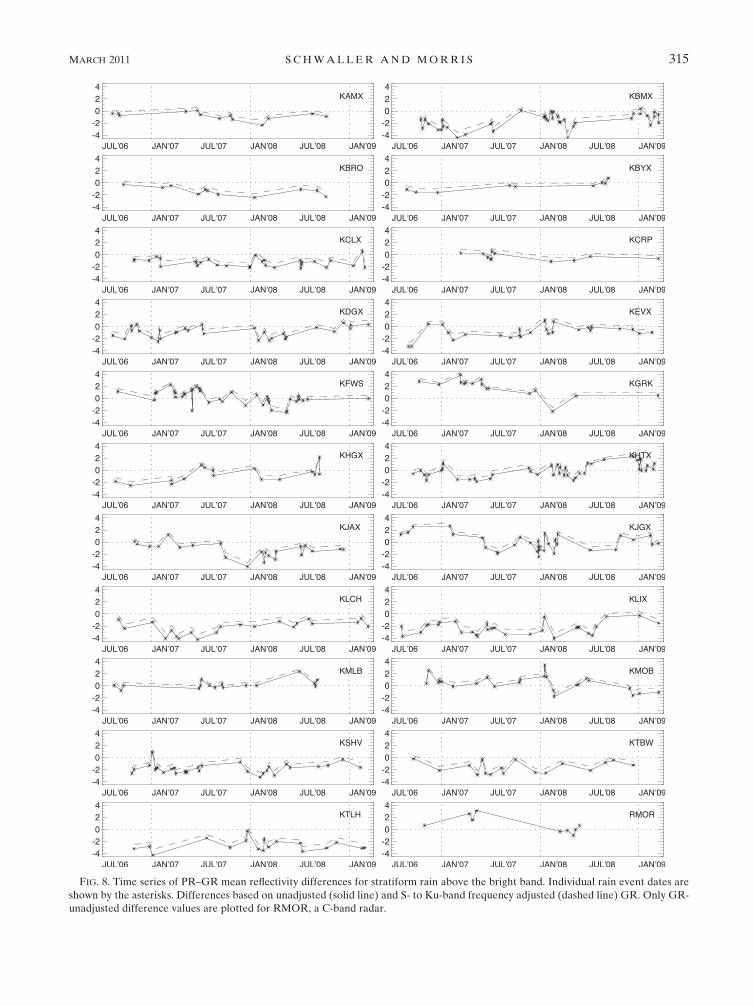
FIG. 8. Time series of PR–GR mean reflectivity differences for stratiform rain above the bright band. Individual rain event dates are
shown by the asterisks. Differences based on unadjusted (solid line) and S- to Ku-band frequency adjusted (dashed line) GR. Only GR-
unadjusted difference values are plotted for RMOR, a C-band radar.
MARCH 2011 S C H W A L L E R A N D M O R R I S 315
samples affected by the bright band are excluded from
the profiles. In all cases, the PR–GR rain-rate bias im-
proves in the snow–ice regions at upper levels with the
application of the frequency corrections to the GR re-
flectivity, averaging slightly greater (less) than unity for
convective (stratiform) rain. In the rain–liquid regions at
lower levels, both the convective and stratiform PR–GR
rain-rate biases are below unity, increasingly so after
application of the frequency corrections to the GR re-
flectivity. As illustrated in Fig. 10, the PR underestimates
rain rate by 30%–40% compared to frequency-corrected
GR samples taken from the lower part of the atmosphere.
These results indicate an undercorrection of attenua-
tion for the PR reflectivity in the mean for PR version 6,
particularly in convective situations, as also seen by Liao
and Meneghini (2009) in comparing the PR to the Mel-
bourne, Florida, WSR-88D.
8. Summary and conclusions
As described above, the Validation Network is an in-
tegral part of the Ground Validation System for NASA’s
Global Precipitation Mission (GPM). In the GPM pre-
launch era, the VN supports precipitation retrieval algo-
rithm development. Postlaunch, the VN will be used to
validate GPM spacecraft instrument measurements and
retrieved precipitation data products.
Several examples are provided above that demonstrate
how the VN dataset can be used to compare ground- to
space-based radar reflectivity for validation purposes.
Examples include comparisons in individual storms, in a
time series of storms over individual ground radars, and
in a multiyear aggregate of storms over the entire south-
east United States.
Analysis of individual storms illustrates several of
the key features of the VN. Chief among these is the
‘‘matchup’’ method that permits direct comparison of
volume-averaged ground- and space-based radar data.
The VN algorithm averages the minimum number of full-
resolution space and ground radar bins needed to pro-
duce spatially coincident sample volumes. Space-based
radar data are averaged only along each vertical ray,
between the top and bottom height of each ground radar
elevation sweep that it intersects (Fig. 2). Ground radar
FIG. 9. Scatterplot of PR minus GR radar reflectivity factor compared to the amount of attenuation correction
applied to the PR data for VN matchup samples measured over the WSR-88D radars identified in Fig. 1 (excluding
KGRK, see text), over the VN period of record until 25 Mar 2009. Samples from (right) convective and (left)
stratiform cases taken from the (top) upper and (bottom) lower parts of the atmosphere. The 0-bias line is plotted.
Frequency corrections were applied to the GR data (Liao and Meneghini 2009).
316 J O U R N A L O F A T M O S P H E R I C A N D O C E A N I C T E C H N O L O G Y VOLUME 28
data are averaged only in the horizontal within the in-
dividual elevation sweeps that intersect the space radar
rays’ parallax-adjusted profiles (Fig. 3). The result of this
technique is a set of vertical profiles for a given rainfall
event, at the PR horizontal resolution and location and
the GR vertical resolution and location, with coincident
space and ground radar samples located at essentially
random heights along each individual profile (Fig. 7).
There is no data interpolation, extrapolation, or resam-
pling to a regular grid.
The analysis of individual storms also illustrates the
standard VN products generated for each rain event.
These include PPI images, vertical profiles, histograms,
scatter diagrams, and mean difference statistics for PR
and GR reflectivity, as shown in Figs. 4–6 and Table 2.
It should be noted that data points included in the
standard matchup that generated these figures (and the
other analysis described here) are limited to those that
fall within a 100-km radius centered on the ground ra-
dar. By 115 km, radar systems with a 18 beamwidth (such
as WSR-88D) will have a vertical resolution .2 km, which
is considered too coarse for meaningful comparisons with
the space-based radar data, such as those available from
TRMM and GPM.
Examples provided above also illustrate the utility of
the VN dataset as a means for assessing the long-term
calibration of ground radars. The period of record for
the VN prototype begins on 8 August 2006 and runs to
the present for the 21 ground radar sites located in the
southeast United States (Fig. 1). Table 3 and Fig. 8 show
that for this period of record the frequency-corrected
bias between the TRMM PR and WSR-88D GR is less
than 1 dBZ in most cases, with several notable excep-
tions. For example, it was found that several adjacent
WSR-88D sites near or along the Gulf Coast between
Louisiana and Florida exhibit a PR minus GR reflec-
tivity factor bias of 21 dBZ or lower, indicating a high
calibration offset for these WSR-88D ground radars.
This set of Gulf coast radars (KEVX and KMOB ex-
cepted) appears to be well calibrated to one another, but
run ‘‘hot’’ compared to the other WSR-88D sites in the
VN subset. Further investigation is required to deter-
mine whether these results represent actual calibration
offsets, or to what degree the Gulf Coast meteorological
regime contributes to the observed offsets.
An assessment was also made of the PR-to-GR bias
measured over a period of record of 960 days for 20
of the 21 WSR-88D radars illustrated in Fig. 1. The
analysis found a remarkably small difference between
PR and GR radar reflectivity factor averaged over this
period of record in stratiform and convective rain cases
when samples were taken from high in the atmosphere.
A significant difference in PR and GR reflectivity was
found in convective cases, particularly in convective sam-
ples from the lower part of the atmosphere. In this case,
the mean difference between PR and corrected GR re-
flectivity was 21.88 dBZ. The PR–GR bias was found to
increase with the amount of PR attenuation correction
FIG. 10. Vertical profiles of (left) convective and (right) stratiform mean rain-rate bias (PR–GR) from volume-
matched reflectivity data grouped by height, using Z 5 372R1.52, and excluding samples affected by bright band.
Heavy (narrow) lines use attenuation-corrected 2A-25 (raw 1C-21) PR reflectivity. Original (solid lines) [frequency
adjusted (dashed lines)] GR reflectivity is used. Number of samples in each height layer is shown next to the profiles.
No-bias (51.0) line is shown (light dotted line). Data for VN matchup samples measured over the WSR-88D radars
identified in Fig. 1 (excluding KGRK, see text), over the VN period of record until 25 Mar 2009.
MARCH 2011 S C H W A L L E R A N D M O R R I S 317

applied, with the PR–GR bias reaching 23.07 dBZ in
cases where the attenuation correction applied is .6 dBZ
(Fig. 9, lower-right panel). Additional analysis indicated
that the version 6 TRMM PR retrieval algorithm under-
estimates rainfall in case of convective rain in the lower
part of the atmosphere by 30%–40% (Fig. 10).
Several steps have been taken to make the VN dataset
as accessible as possible for GPM algorithm development
and for data product validation. Summary data products
are available for each precipitation event. Ground radar
data in several common formats can be ingested into the
VN, including Universal Format (UF) and the WSR-88D
level II archive data format. The volume-matched VN
data are output in netCDF, a portable, self-describing
data format that is commonly used in the atmospheric
sciences. A data user’s guide is available, which details
the VN netCDF data file-naming conventions, format,
and contents. Space- and ground-radar matchup data
are available for each significant rain event, and all orig-
inal PR and WSR-88D GR data products are available
for these and all other overpass events. VN data and
documentation are available via NASA’s GPM ground
validation Web site (online at http://gpm.gsfc.nasa.gov/
ground_direct.html). VN data visualization tools are
available that render the matchup data in vertical ‘‘plan
position indicator’’ slices through the data or as verti-
cal cross sections, and provide reflectivity difference
statistics and additional graphical renderings. The VN
volume matching code and visualization tools, written
in Interactive Data Language (IDL), are available as
open source software from the NASA GSFC Innovative
Partnerships Program Office Web site (online at http://
opensource.gsfc.nasa.gov).
Additional data will certainly be added to the VN as the
period of record expands. Enhancements to the VN are
also planned, with the possibility of expanding the period
of record to dates earlier than 8 August 2006, and with the
possibility of adding additional data types, including space-
based microwave radiometer data, as well as additional
data derived from various precipitation retrieval methods.
Community contributions that improve and enhance the
open source VN software are welcome, as are contribu-
tions of ground radar data from additional sites. Updates to
the VN will be documented on the GPM ground validation
Web site (http://gpm.gsfc.nasa.gov/groundvalidation.html).
This site provides a portal to VN contacts, data, software,
and documentation, as well as to other ground validation
datasets, both within and beyond GPM.
Acknowledgments. The Validation Network is sup-
ported as part of NASA’s Global Precipitation Mea-
suring Mission. The authors wish to acknowledge the
contributions of Jason Pippitt from the TRMM Ground
Validation office, who performs quality control of the
ground radar data used in the VN. We also gratefully
acknowledge the ground radar data provided by Jun Park
and Mi-Lim Ou of the Korean Meteorological Admin-
istration (Gosan radar), Walter Petersen of NASA’s
Marshall Space Flight Center (ARMOR radar), Elizabeth
Ebert from the Australian Bureau of Meteorology
(Darwin radar), and David Wolff of NASA’s Goddard
Space Flight Center (Kwajalein radar).
REFERENCES
Anagnostou, E. N., C. A. Morales, and T. Dinku, 2001: The use
of TRMM Precipitation Radar observations in determining
ground radar calibration biases. J. Atmos. Oceanic Technol.,
18, 616–628.
Barnes, S. L., 1980: Report on a meeting to establish a common
Doppler radar data exchange format. Bull. Amer. Meteor. Soc.,
61, 1401–1404.
Bolen, S. M., and V. Chandrasekar, 2000: Quantitative cross vali-
dation of space-based and ground-based radar observations.
J. Appl. Meteor., 39, 2071–2079.
——, and ——, 2003: Methodology for aligning and comparing
spaceborne radar and ground-based radar observations. J. At-
mos. Oceanic Technol., 20, 647–659.
Fabry, F., and I. Zawadzki, 1995: Long-term radar observations
of the melting layer of precipitation and their interpretation.
J. Atmos. Sci., 52, 838–851.
GCOS, 2006: Systematic observation requirements for satellite-
based products for climate: Supplemental details to the satellite-
based component of the ‘‘Implementation Plan for the Global
Observing System for Climate in Support of the UNFCCC.’’
GCOS Rep. GCOS-107 and WMO/TD 1338, 103 pp. [Available
online at http://www.wmo.int/pages/prog/gcos/Publications/
gcos-107.pdf.]
Hou, A. Y., G. Skofronick-Jackson, C. D. Kummerow, and J. M.
Shepherd, 2008: Global precipitation measurement. Precipi-
tation: Advances in Measurement, Estimation and Prediction,
S. C. Michaelides, Ed., Springer-Verlag, 131–170.
Iguchi, T., T. Kozu, R. Meneghini, J. Awaka, and K. Okamoto,
2000: Rain-profiling algorithm for the TRMM Precipitation
Radar. J. Appl. Meteor., 39, 2038–2052.
Keenan, T., K. Glasson, F. Cummings, T. S. Bird, J. Keeler, and
J. Lutz, 1998: The BMRC/NCAR C-band polarimetric (C-
POL) radar system. J. Atmos. Oceanic Technol., 15, 871–886.
Kozu, T., and Coauthors, 2001: Development of precipitation radar
onboard the Tropical Rainfall Measuring Mission (TRMM)
satellite. IEEE Trans. Geosci. Remote Sens., 39, 102–116.
Kummerow, C., and Coauthors, 2000: The status of the Tropical
Rainfall Measuring Mission (TRMM) after two years in orbit.
J. Appl. Meteor., 39, 1965–1982.
Liao, L., and R. Meneghini, 2009: Changes in the TRMM version-5
and version-6 precipitation radar products due to orbit boost.
J. Meteor. Soc. Japan, 87A, 93–107.
——, ——, and T. Iguichi, 2001: Comparisons of rain rate and re-
flectivity factor derived from the TRMM Precipitation Radar
and the WSR-88D over the Melbourne, Florida, site. J. Atmos.
Oceanic Technol., 18, 1959–1974.
NAS, 2007: Earth Science and Applications from Space: National
Imperatives for the Next Decade and Beyond. National Acad-
emy Press, 456 pp.
318 J O U R N A L O F A T M O S P H E R I C A N D O C E A N I C T E C H N O L O G Y VOLUME 28
NASA, 2009: Validation network data user’s handbook, 28 pp.
[Available online at http://gpm.gsfc.nasa.gov/ground_library.html.]
Neeck, S. P., and R. Oki, 2007: CEOS precipitation constellation.
Proc. SPIE, 6744, 674428, doi:10.1117/12.746142.
NOAA/OFCM, 2006: Doppler radar meteorological observa-
tions: Part C WSR-88D products and algorithms. Federal
Meteorological Handbook No. 11 (FCM-H11C-2006), Office of
the Federal Coordinator for Meteorological Services and Sup-
porting Research, National Oceanic and Atmospheric Adminis-
tration, 390 pp. [Available online at http://www.ofcm.gov/fmh11/
fmh11partc/pdf/FMH-11-PartC-April2006.pdf.]
Park, S.-G., and D.-K. Lee, 2007: Doppler weather radar network over
the Korean peninsula. Preprints, 33rd Conf. on Radar Meteorology,
Cairns, QLD, Australia, Amer. Meteor. Soc., P11A.5. [Available
online at http://ams.confex.com/ams/pdfpapers/123031.pdf.]
Petersen, W. A., K. R. Knupp, D. J. Cecil, and J. R. Mecikalski,
2007: The University of Alabama Huntsville THOR Center
instrumentation: Research and operational collaboration. Pre-
prints, 33rd Int. Conf. on Radar Meteorology, Cairns, QLD,
Australia, Amer. Meteor. Soc., 5.1. [Available online at http://
ams.confex.com/ams/pdfpapers/123410.pdf.]
Rosenfeld, D., E. Amatai, and D. B. Wolff, 1995: Classification of
rain regimes by the three-dimensional properties of reflectivity
fields. J. Appl. Meteor., 34, 198–211.
Schumacher, C., and R. A. Houze Jr., 2000: Comparison of radar
data from TRMM satellite and Kwajalein oceanic validation
site. J. Appl. Meteor., 39, 2151–2164.
Simpson, J., C. Kummerow, W.-K. Tao, and R. F. Adler, 1996: On
the Tropical Rainfall Measuring Mission (TRMM). Meteor.
Atmos. Phys., 60, 19–36.
Wolff, D. B., D. A. Marks, E. Amitai, D. S. Silberstein, B. L. Fisher,
A. Tokay, J. Wang, and J. L. Pippitt, 2005: Ground validation
for the Tropical Rainfall Measuring Mission (TRMM). J. Atmos.
Oceanic Technol., 22, 365–380.
MARCH 2011 S C H W A L L E R A N D M O R R I S 319