a guide for establishing primary ac-dc transfer standard ... · pdf filethis manual, "a...
TRANSCRIPT

A Guide for establishing primary AC-DC transfer
standard using ET2001 ADS system
(Tentative Version 2.01, 12/Apr./2007)
Nano-Electronics Research Institute / AIST, Japan
Preliminary Version 1.03b
About This Manual
This manual, "A Guide for establishing primary AC-DC transfer standard using ET2001 ADS system",provides detailed technical information about the operation of type-ET2001 AC-DC Standardsystem (hereafter referred to as “ADS” system), and its application for the evaluation of thermalconverters to establish a primary AC-DC transfer standard.
Contents of the other manuals are as follows:
“Quick-Start Manual for ET2001 ADS system”This manual provides technical information for the use of ET2001 ADS system, includingcomprehensive guidance for installation and initial setting-up of the equipment.
"Technical Reference for ET2001 ADS system Hardware"This manual provides detailed technical information about hardware of the ET2001 ADSsystem, including the interfacing commands and circuit descriptions.
"Technical Reference for ET2001 Thermal Converters"This manual provides detailed technical information about the special TVCs, LF-TVC, HF-TVC, and MF-TVC, to be combined with the ET2001 ADS system.
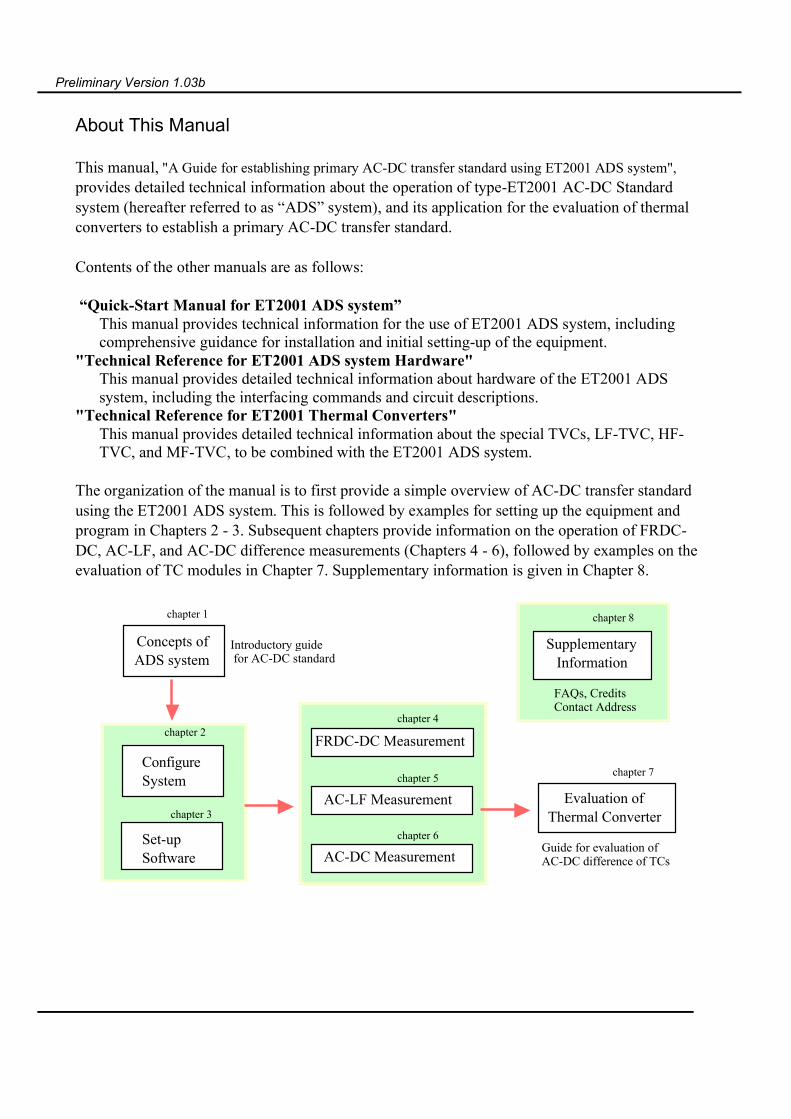
The organization of the manual is to first provide a simple overview of AC-DC transfer standardusing the ET2001 ADS system. This is followed by examples for setting up the equipment andprogram in Chapters 2 - 3. Subsequent chapters provide information on the operation of FRDC-DC, AC-LF, and AC-DC difference measurements (Chapters 4 - 6), followed by examples on theevaluation of TC modules in Chapter 7. Supplementary information is given in Chapter 8.
Concepts of ADS system
chapter 1
Introductory guide for AC-DC standard
chapter 3Evaluation of
Thermal Converter
chapter 7
Guide for evaluation of AC-DC difference of TCs
Set-upSoftware
chapter 8
Supplementary Information
FAQs, CreditsContact Address
chapter 4
chapter 5
chapter 6
AC-LF Measurement
AC-DC Measurement
FRDC-DC Measurementchapter 2
ConfigureSystem

Preliminary Version 1.03b
Important Notes
(PS&USB Module)CAUTION! --- Check correct voltage setting for the AC line voltage before applying the ac
power to the PS&USB module.
(FRDC Module)CAUTION! --- Output current of more than 30 mA may results in the permanent damage
for analog switches in the output circuit. NOTE --- Output voltage lower than 1V may not have sufficient output stability.
(DSS Module)CAUTION! --- Output current of more than 50 mA may results in the permanent damage in
the output buffer circuit. NOTE --- Output voltage lower than 1V may not have sufficient output stability. NOTE --- Output current of more than 30 mA may cause instability in the output and
increase in the distortion of the waveform.
(TC/AMP Module)CAUTION! --- Incorrect setting of the [Nominal Input] in [TVC specification] may result in
the overloading of the thermal converter element.CAUTION! --- Incorrect setting of the [Input resistance] in [TVC specification] may result
in the overloading of the FRDC and/or DSS output circuit. NOTE --- When connecting a TVC to AMP module, the Input-Lo/Guard of the AMP
module should be connected to Output-Lo of FRDC/DSS module viaOutput-Lo/Chassis of the TVC.
NOTE --- All the TC/AMP modules must have corresponding specification filesstored in the "Etrace\TCspecs" folder.
Preliminary Version 1.03b
List of Abbreviations
AC-AC [AC to AC (difference)]: Relative AC-DC difference with respect to fixed frequency.AC-DC [AC to DC (difference)]: Error in comparing rms AC quantity with DC quantity.AC-LF [AC to Low Frequency AC (difference)]: LF characteristic in AC-AC difference.ADC [Analog to Digital Converter]: Converts output EMF of TC element to digital quantity.AMP [Amplifier (module)]: TC module without dedicated TC element inside the chassis.CPDC [Chopped DC (mode)]: Quasi steady-state DC waveform with periodical off-times.DVM [Digital Voltmeter]: Replaced by AMP module in ET2001 ADS system.ADS [(ET2001) AC-DC Standard (system)]: The equipment described in this manual.DDS [Direct Digital Synthesis (chip)]: A semiconductor chip for generation of sine-wave.DSS [Digital Sine-wave Synthesizer (circuit)]: A circuit (module) for generation of sine-wave.FRDC [Fast-Reversed DC]: Quasi-rectangular waveform with equal rms power in AC and DC.HF-TVC [High-Frequency Thermal Voltage Converter]: A TVC for high-frequency reference.GPIB [General-Purpose Interface Bus]: Interface bus commonly used in measuring instruments.LF-TVC [Low-Frequency Thermal Voltage Converter]: A TVC for low-frequency reference.MDFR [Modified FRDC (mode)]: Modified FRDC waveform with periodical off-times.MDR [Miniature Delta Ribbon (cable)]: A standard cable used in ET2001 ADS system.MES [Measurement]: A thermal AC-DC transfer standard to be calibrated (UUT).PS [Power Supply (circuit)]: Power supply circuit in USB&PS module.REF [Reference]: Reference standard by which UUT standard is calibrated.TC [Thermal Converter]: Thermal Converter to be used in AC-DC comparison.TC [Thermal Converter (module)]: Combination of a TC element and a ADC circuit.TVC [Thermal Voltage Converter]: Thermal Converter for AC voltage standard.USB [Universal Serial Bus]: Serial Interface Bus used in ET2001 ADS systemUSB&PS [USB and Power Supply (module)]: Power-supply module with USB interface.UUT [Unit Under Test]: A thermal AC-DC transfer standard to be calibrated (MES).
Preliminary Version 1.03b
Table of Contents1. Introduction................................................................................................................. 8
1.1. Background .......................................................................................................... 81.2. AC-DC Transfer Standard..................................................................................... 8
1.2.1. AC-DC Difference ..................................................................................... 81.2.2. Thermal Converter ..................................................................................... 9
1.3. Determination of Frequency Characteristics........................................................ 111.3.1. DC Characteristics ................................................................................... 111.3.2. Low-Frequency Characteristics ................................................................ 121.3.3. High-Frequency Characteristics ............................................................... 13
1.4. Principles of Measurements ................................................................................ 131.4.1. FRDC-DC Difference Measurement ........................................................ 131.4.2. ACLF-AC Difference Measurement......................................................... 161.4.3. AC-DC Difference Measurement ............................................................. 17
2. Set-up ET2001 ADS System...................................................................................... 192.1. System Overview................................................................................................ 192.2. FRDC System..................................................................................................... 20
2.2.1. Configuration........................................................................................... 202.2.2. Measurement Sequence............................................................................ 21
2.3. AC-LF System.................................................................................................... 212.3.1. Configuration........................................................................................... 222.3.2. Measurement Procedure........................................................................... 22
2.4. AC-DC System................................................................................................... 232.4.1. Configuration........................................................................................... 232.4.2. Measurement Procedure........................................................................... 24
3. Set-up ET2001 ADS Software................................................................................... 263.1. Software Components......................................................................................... 263.2. Manual Operation ............................................................................................... 27
3.2.1. Initial Set-up Procedure............................................................................ 273.2.2. Manual Operation .................................................................................... 29
3.3. Setting Parameter................................................................................................ 323.3.1. Register Reference Point .......................................................................... 323.3.2. Register Measurement Procedure ............................................................. 333.3.3. Register Measurement Parameter ............................................................. 353.3.4. Specify File Name to Save Results. .......................................................... 363.3.5. Register Measurement Options................................................................. 373.3.6. Specify Email Address to Send Data. ....................................................... 37
3.4. Start/Stop Measurement...................................................................................... 38
4. FRDC-DC Difference Measurement......................................................................... 414.1. Executing Measurement...................................................................................... 41
4.1.1. Measurement Procedure........................................................................... 414.1.2. Data Format ............................................................................................. 43

Preliminary Version 1.03b
4.2. Curve-fitting ....................................................................................................... 444.3. Evaluation of Uncertainty ................................................................................... 44
4.3.1. Type-A Uncertainties ............................................................................... 454.3.2. Type-B Uncertainties ............................................................................... 464.3.3. Uncertainties in Sensitivity Coefficient .................................................... 484.3.4. Combined Uncertainty ............................................................................. 49
5. AC-LF Measurement ................................................................................................ 515.1. Executing Measurement...................................................................................... 51
5.1.1. Measurement Procedure........................................................................... 515.1.2. Data Format ............................................................................................. 52
5.2. Evaluation of Uncertainty ................................................................................... 535.2.1. Type-A Uncertainties ............................................................................... 535.2.2. Type-B Uncertainties ............................................................................... 555.2.3. Uncertainties in Sensitivity Coefficient .................................................... 555.2.4. Combined Uncertainty ............................................................................. 57
6. AC-DC Difference Measurement.............................................................................. 586.1. Executing Measurement...................................................................................... 58
6.1.1. Measurement Procedure........................................................................... 586.1.2. Data Format ............................................................................................. 60
6.2. Evaluation of Uncertainty ................................................................................... 616.2.1. Type-A Uncertainties ............................................................................... 616.2.2. Type-B Uncertainties ............................................................................... 626.2.3. Uncertainties in Sensitivity Coefficient .................................................... 636.2.4. Combined Uncertainty ............................................................................. 65
7. Evaluation and Calibration of TC modules.............................................................. 667.1. General Scheme.................................................................................................. 667.2. Evaluation of a Reference Thermal Converter..................................................... 66
7.2.1. Method of Evaluation............................................................................... 667.2.2. DC Characteristics ................................................................................... 677.2.3. Low Frequency Characteristics ................................................................ 687.2.4. High Frequency Characteristics................................................................ 687.2.5. Over-all Characteristic ............................................................................. 697.2.6. Evaluation of Uncertainty ........................................................................ 70
7.3. Calibration of a Thermal Converter..................................................................... 717.3.1. Comparison of AC-DC transfer difference ............................................... 717.3.2. Evaluation of Uncertainty ........................................................................ 737.3.3. Remote Calibration .................................................................................. 74
8. Supplementary Information...................................................................................... 758.1. FACs .................................................................................................................. 758.2. Trouble Shooting ................................................................................................ 758.3. Acknowledgements............................................................................................. 758.4. Contact Address.................................................................................................. 75

Preliminary Version 1.03b
AppendixAppendix-A Data Examples ..................................................................................179

Preliminary Version 1.03b
- 8 -
1. Introduction
1.1. Background
DC voltage standards precise to 10-9 are achievable with Josephson junction devices. Highprecision for AC voltages, even to 10-7 are much more difficult to measure, so that the method toset an AC standard most commonly used is through the "transfer" or comparison with a precisionDC standard. This is achieved by comparing the RMS power of the AC voltage with that of thestandard DC using a thermal converter. AC voltage standards in the frequency range between 10Hz and 1 MHz can thus be derived. However, because every electrical system is subject to noisesfrom many sources, with many dependent on the frequency, predetermined corrections must beadded to the measurements to compensate for these and to calibrate the equipment under test.Especially troublesome are non-negligible heating or cooling during the DC input mode. TheseThomson and Peltier thermoelectric effects give rise to frequency-independent AC-DC differencesat a 10-6 level [1]. Because of the difficulties in avoiding or evaluating the thermoelectric effects ina thermal converter, only a limited number of national metrology institutes have been able toestablish independent primary standards of AC-DC transfer. Since 2001, the AIST in Japan [3]uses the Fast-Reversed DC (FRDC) method to evaluate the frequency independent AC-DCdifference in the transfer standard. FDRC was developed in the 1990's, aiming at the experimental determination of thethermoelectric effects in thermal converters [2]. The FRDC method is based on the assumptionthat, if the frequency of the polarity reversal in a rectangular FRDC waveform is much faster thanthe thermoelectric time constant, the thermoelectric effects do not affect the temperaturedistribution.This document describes a second-generation FRDC instrument, ET2001 AC-DC Standard (ADS)System, developed at AIST in cooperation with Sunjem Co. Ltd, Japan. The new instrumentincludes not only the FRDC source, but also a complete miniature AC-DC comparator system,consisting of a DSS module, TC/AMP modules, and HF-TVC. The system may be used toestablish an independent primary AC-DC transfer standard in calibration laboratories.
1.2. AC-DC Transfer Standard
1.2.1. AC-DC Difference
The ac voltage is defined by the root-mean square (rms) value of the sinusoidal waveform:
€
VAC (rms) ≡1T
V (t) 20
T∫ dt (1.1)
Preliminary Version 1.03b
- 9 -
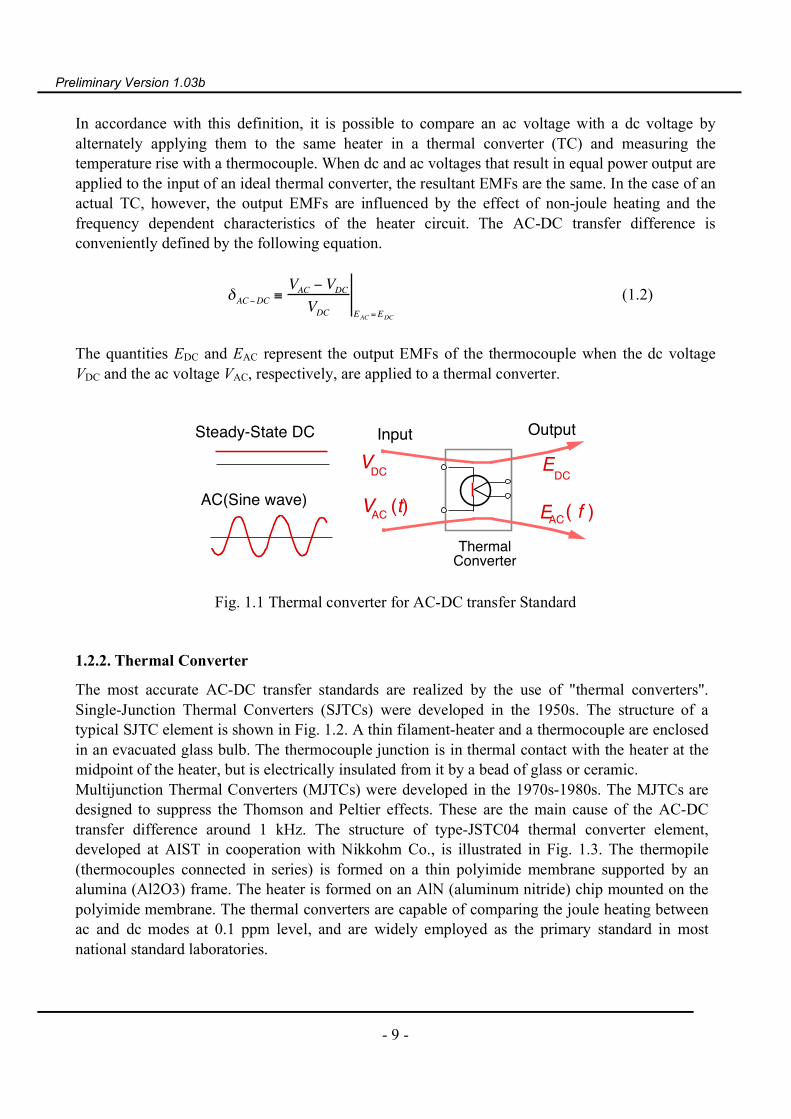
In accordance with this definition, it is possible to compare an ac voltage with a dc voltage byalternately applying them to the same heater in a thermal converter (TC) and measuring thetemperature rise with a thermocouple. When dc and ac voltages that result in equal power output areapplied to the input of an ideal thermal converter, the resultant EMFs are the same. In the case of anactual TC, however, the output EMFs are influenced by the effect of non-joule heating and thefrequency dependent characteristics of the heater circuit. The AC-DC transfer difference isconveniently defined by the following equation.
δAC−DC ≡VAC − VDCVDC EAC =EDC
(1.2)
The quantities EDC and EAC represent the output EMFs of the thermocouple when the dc voltageVDC and the ac voltage VAC, respectively, are applied to a thermal converter.
Steady-State DC
ThermalConverter
VDC
VAC (t)
EDC
EAC( f )
Input Output
AC(Sine wave)
Fig. 1.1 Thermal converter for AC-DC transfer Standard
1.2.2. Thermal Converter
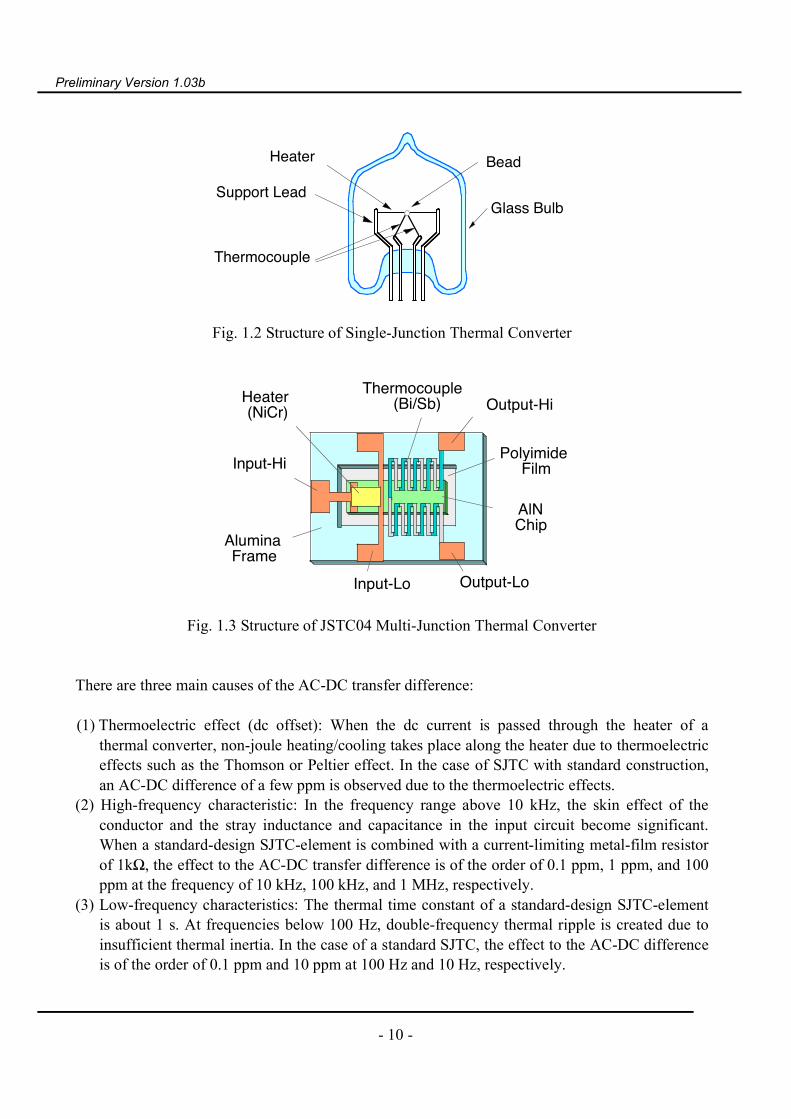
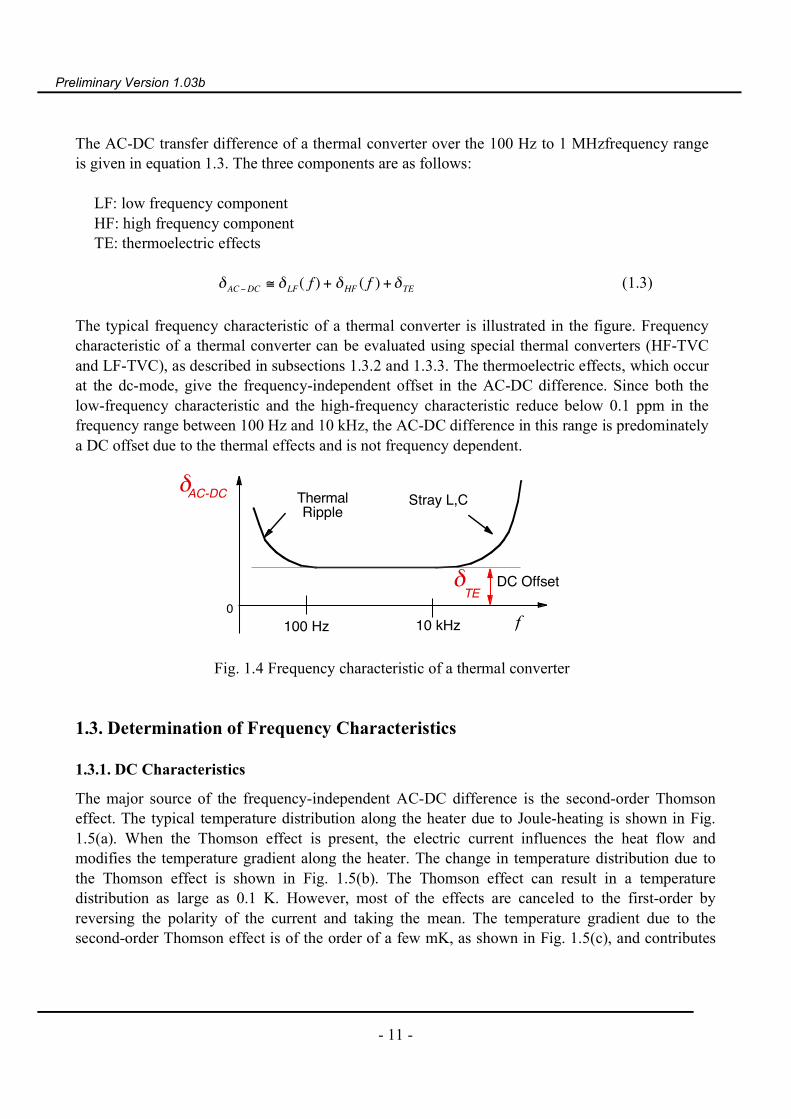
The most accurate AC-DC transfer standards are realized by the use of "thermal converters".Single-Junction Thermal Converters (SJTCs) were developed in the 1950s. The structure of atypical SJTC element is shown in Fig. 1.2. A thin filament-heater and a thermocouple are enclosedin an evacuated glass bulb. The thermocouple junction is in thermal contact with the heater at themidpoint of the heater, but is electrically insulated from it by a bead of glass or ceramic.Multijunction Thermal Converters (MJTCs) were developed in the 1970s-1980s. The MJTCs aredesigned to suppress the Thomson and Peltier effects. These are the main cause of the AC-DCtransfer difference around 1 kHz. The structure of type-JSTC04 thermal converter element,developed at AIST in cooperation with Nikkohm Co., is illustrated in Fig. 1.3. The thermopile(thermocouples connected in series) is formed on a thin polyimide membrane supported by analumina (Al2O3) frame. The heater is formed on an AlN (aluminum nitride) chip mounted on thepolyimide membrane. The thermal converters are capable of comparing the joule heating betweenac and dc modes at 0.1 ppm level, and are widely employed as the primary standard in mostnational standard laboratories.
Preliminary Version 1.03b
- 10 -
Heater
Thermocouple
Support Lead
Bead
Glass Bulb
Fig. 1.2 Structure of Single-Junction Thermal Converter
Polyimide Film
Input-Lo
Input-Hi
Output-Hi
Output-Lo
Thermocouple (Bi/Sb)Heater
(NiCr)
Alumina Frame
AlN Chip
Fig. 1.3 Structure of JSTC04 Multi-Junction Thermal Converter
There are three main causes of the AC-DC transfer difference:
(1) Thermoelectric effect (dc offset): When the dc current is passed through the heater of athermal converter, non-joule heating/cooling takes place along the heater due to thermoelectriceffects such as the Thomson or Peltier effect. In the case of SJTC with standard construction,an AC-DC difference of a few ppm is observed due to the thermoelectric effects.
(2) High-frequency characteristic: In the frequency range above 10 kHz, the skin effect of theconductor and the stray inductance and capacitance in the input circuit become significant.When a standard-design SJTC-element is combined with a current-limiting metal-film resistorof 1kΩ, the effect to the AC-DC transfer difference is of the order of 0.1 ppm, 1 ppm, and 100ppm at the frequency of 10 kHz, 100 kHz, and 1 MHz, respectively.
(3) Low-frequency characteristics: The thermal time constant of a standard-design SJTC-elementis about 1 s. At frequencies below 100 Hz, double-frequency thermal ripple is created due toinsufficient thermal inertia. In the case of a standard SJTC, the effect to the AC-DC differenceis of the order of 0.1 ppm and 10 ppm at 100 Hz and 10 Hz, respectively.
Preliminary Version 1.03b
- 11 -
The AC-DC transfer difference of a thermal converter over the 100 Hz to 1 MHzfrequency rangeis given in equation 1.3. The three components are as follows:
LF: low frequency componentHF: high frequency componentTE: thermoelectric effects
δAC−DC ≅ δLF( f ) + δHF ( f ) +δTE (1.3)
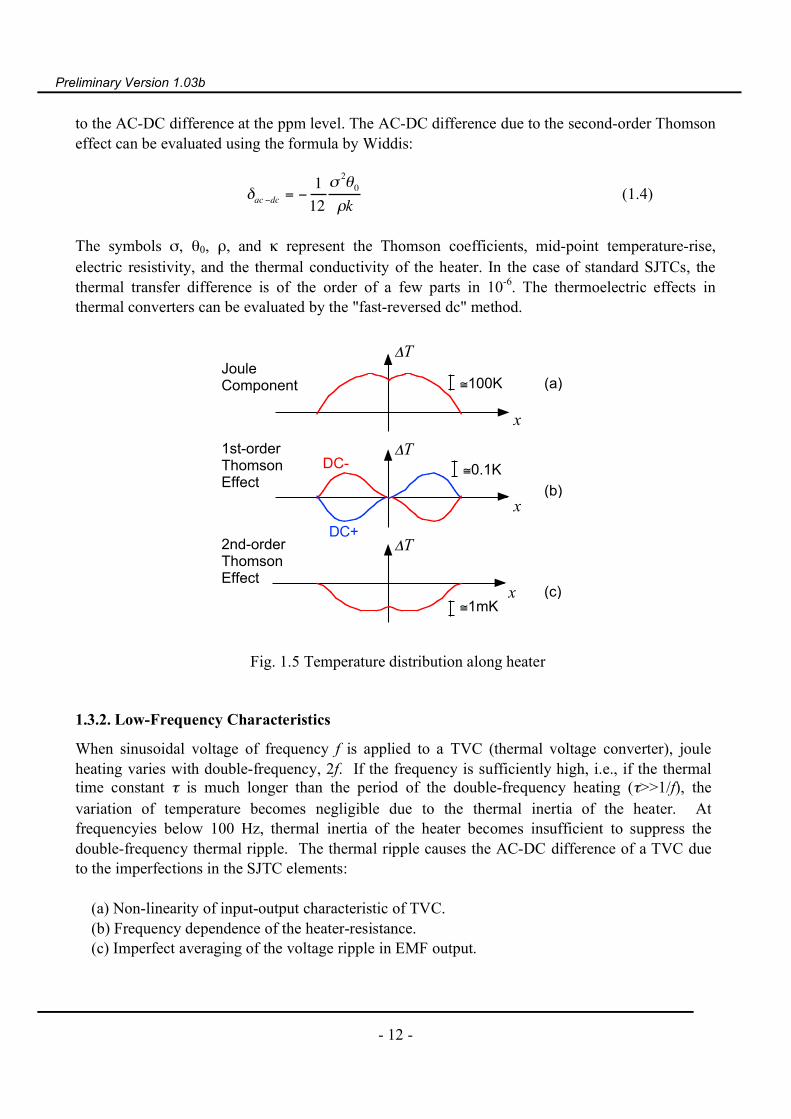
The typical frequency characteristic of a thermal converter is illustrated in the figure. Frequencycharacteristic of a thermal converter can be evaluated using special thermal converters (HF-TVCand LF-TVC), as described in subsections 1.3.2 and 1.3.3. The thermoelectric effects, which occurat the dc-mode, give the frequency-independent offset in the AC-DC difference. Since both thelow-frequency characteristic and the high-frequency characteristic reduce below 0.1 ppm in thefrequency range between 100 Hz and 10 kHz, the AC-DC difference in this range is predominatelya DC offset due to the thermal effects and is not frequency dependent.
0100 Hz 10 kHz
δTE
ThermalRipple
Stray L,C
DC Offset
f
δAC-DC
Fig. 1.4 Frequency characteristic of a thermal converter
1.3. Determination of Frequency Characteristics
1.3.1. DC Characteristics
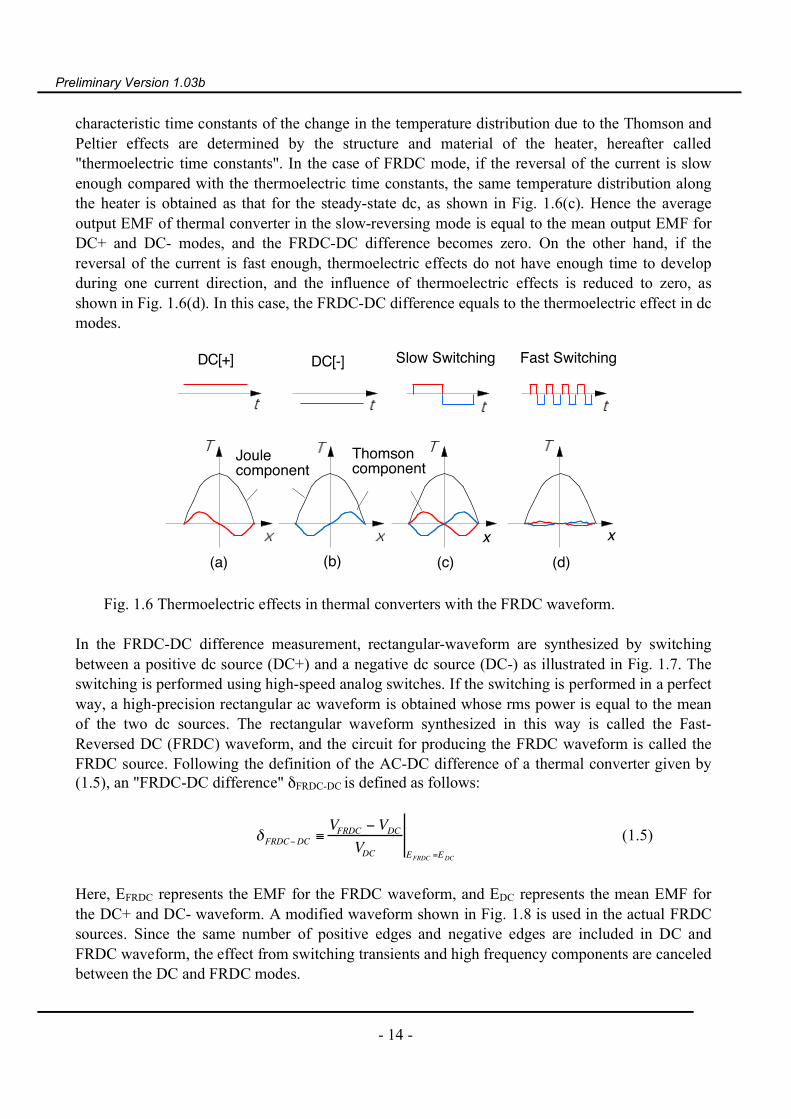
The major source of the frequency-independent AC-DC difference is the second-order Thomsoneffect. The typical temperature distribution along the heater due to Joule-heating is shown in Fig.1.5(a). When the Thomson effect is present, the electric current influences the heat flow andmodifies the temperature gradient along the heater. The change in temperature distribution due tothe Thomson effect is shown in Fig. 1.5(b). The Thomson effect can result in a temperaturedistribution as large as 0.1 K. However, most of the effects are canceled to the first-order byreversing the polarity of the current and taking the mean. The temperature gradient due to thesecond-order Thomson effect is of the order of a few mK, as shown in Fig. 1.5(c), and contributes
Preliminary Version 1.03b
- 12 -
to the AC-DC difference at the ppm level. The AC-DC difference due to the second-order Thomsoneffect can be evaluated using the formula by Widdis:
δac −dc = −112
σ 2θ0ρk
(1.4)
The symbols σ, θ0, ρ, and κ represent the Thomson coefficients, mid-point temperature-rise,electric resistivity, and the thermal conductivity of the heater. In the case of standard SJTCs, thethermal transfer difference is of the order of a few parts in 10-6. The thermoelectric effects inthermal converters can be evaluated by the "fast-reversed dc" method.
(a)
(b)
(c)
≅100K
≅0.1K
≅1mK
JouleComponent
1st-orderThomsonEffect
2nd-orderThomsonEffect
ΔT
x
ΔT
x
ΔT
x
DC+
DC-
Fig. 1.5 Temperature distribution along heater
1.3.2. Low-Frequency Characteristics
When sinusoidal voltage of frequency f is applied to a TVC (thermal voltage converter), jouleheating varies with double-frequency, 2f. If the frequency is sufficiently high, i.e., if the thermaltime constant τ is much longer than the period of the double-frequency heating (τ>>1/f), thevariation of temperature becomes negligible due to the thermal inertia of the heater. Atfrequencyies below 100 Hz, thermal inertia of the heater becomes insufficient to suppress thedouble-frequency thermal ripple. The thermal ripple causes the AC-DC difference of a TVC dueto the imperfections in the SJTC elements:
(a) Non-linearity of input-output characteristic of TVC.(b) Frequency dependence of the heater-resistance.(c) Imperfect averaging of the voltage ripple in EMF output.

Preliminary Version 1.03b
- 13 -
In the case (c), the effect to the AC-DC difference may be reduced by use of a low-pass filter or bysetting the integration time of a DVM to the multiple of the input frequency. While in cases (a)and (b), the effects are based on the thermal properties of the SJTC elements, and the contributionto the AC-DC difference has to be evaluated.The low-frequency performance of a thermal converter may be evaluated by two methods using theET2001 ADS system, i.e., (1) Impedance-matching method and (2) AC-LF measurement(synthesized-waveform method).In the case of the Impedance-matching method, AC-DC difference of a TVC is compared againstanother TVC of the same type using a special comparison circuit, such that one TVC is operated ata much smaller power level than the other. In the case of the AC-LF measurement, a synthesizedwaveform source (DSS module) is used as a reference standard, and the change in the output EMFfrom the TVC is measured by a DVM (AMP module). These methods are described in detail in aseparate technical reference "TC manual".
1.3.3. High-Frequency Characteristics
Operating at above 10 kHz, the frequency characteristic of the TVC-input circuit due to the skineffect, dielectric loss, and the stray inductance and capacitance becomes non-negligible comparedwith thermoelectric effects. Beyond 100 kHz, the frequency characteristic contributes more than 1ppm and becomes the dominant term in the AC-DC transfer difference.Since the impedance of the input circuit determines the frequency characteristic of a TVC, it is quiteimportant do define the reference plane of the input circuit from which the AC-DC difference isdefined. Usually, the reference plane is taken at the center of a TEE connector directly connected tothe input of a TC or TC module. The primary standard in the high-frequency characteristic of AC-DC difference is realized by a specially designed TVC (HF-TVC), which has a special constructionso that its high-frequency characteristic is calculable from its structure and dimensions. The designand the performance of the HF-TVC is described in detail in a separate technical reference "TCmanual".
1.4. Principles of Measurements
1.4.1. FRDC-DC Difference Measurement
Until the late 1990's, the ac-dc transfer standard in Japan had an uncertainty of 10 ppm. Thisprecision was not good enough to calibrate new instrumentation. Application of the "Fast-ReversedDC" (FRDC) method, developed at PTB (Physikalisch-Technische Bundesanstalt), has allowedten-fold improvement in the uncertainty of the national standard. The purpose of the method is toevaluate the thermoelectric transfer difference experimentally, as illustrated in Fig. 1.6. Forsimplicity, only the Thomson effect along the heater is shown in the figure. When dc current passesthrough a thermal converter, the temperature distribution is modified due to the Thomson effect asshown in Fig. 1.6(a). When the current is reversed, the polarity of the Thomson effect is alsoreversed, resulting in a different temperature distribution along heater as shown in Fig. 1.6(b). The
Preliminary Version 1.03b
- 14 -
characteristic time constants of the change in the temperature distribution due to the Thomson andPeltier effects are determined by the structure and material of the heater, hereafter called"thermoelectric time constants". In the case of FRDC mode, if the reversal of the current is slowenough compared with the thermoelectric time constants, the same temperature distribution alongthe heater is obtained as that for the steady-state dc, as shown in Fig. 1.6(c). Hence the averageoutput EMF of thermal converter in the slow-reversing mode is equal to the mean output EMF forDC+ and DC- modes, and the FRDC-DC difference becomes zero. On the other hand, if thereversal of the current is fast enough, thermoelectric effects do not have enough time to developduring one current direction, and the influence of thermoelectric effects is reduced to zero, asshown in Fig. 1.6(d). In this case, the FRDC-DC difference equals to the thermoelectric effect in dcmodes.
Joulecomponent
Thomsoncomponent
DC[+] DC[-] Slow Switching Fast Switching
(a) (b) (c) (d)xx
Fig. 1.6 Thermoelectric effects in thermal converters with the FRDC waveform.
In the FRDC-DC difference measurement, rectangular-waveform are synthesized by switchingbetween a positive dc source (DC+) and a negative dc source (DC-) as illustrated in Fig. 1.7. Theswitching is performed using high-speed analog switches. If the switching is performed in a perfectway, a high-precision rectangular ac waveform is obtained whose rms power is equal to the meanof the two dc sources. The rectangular waveform synthesized in this way is called the Fast-Reversed DC (FRDC) waveform, and the circuit for producing the FRDC waveform is called theFRDC source. Following the definition of the AC-DC difference of a thermal converter given by(1.5), an "FRDC-DC difference" δFRDC-DC is defined as follows:
δFRDC−DC ≡VFRDC − VDC
VDC EFRDC =EDC
(1.5)
Here, EFRDC represents the EMF for the FRDC waveform, and EDC represents the mean EMF forthe DC+ and DC- waveform. A modified waveform shown in Fig. 1.8 is used in the actual FRDCsources. Since the same number of positive edges and negative edges are included in DC andFRDC waveform, the effect from switching transients and high frequency components are canceledbetween the DC and FRDC modes.

Preliminary Version 1.03b
- 15 -
DC+
DC-
ThermalConverter
nVDetector
Fig. 1.7. FRDC-DC difference measurement circuit.
FRDC
DC(+)
DC(-)
Fig. 1.8 Modified DC and FRDC waveforms.
In this method, the Nono-Voltmeter measures the output EMF voltages from the TVC. If thedifference between the voltages VFRDC and VDC is small, the input-output characteristic can beapproximated to be linear in the low voltage range. In this case, the following approximation ispossible:
€
VFRDC ≅VDC + EFRDC −EDC[ ] k
Where,
€
k =ΔEΔV
. (1.6)
Here, ΔE represents the change in the EMF output from the TVC when a small change in the inputvoltage ΔV is applied. Substituting (1.6) to (1.5), the FRDC-DC difference δFRDC-DC is determinedby the following equation:
€
δFRDC−DC ≅ −EFRDC −EDC
nEDC
Where,
€
n =ΔE /E( )ΔV /V( )
(1.7)
The 'normalized index n is of the order of 2 for the TVCs with square-output characteristics. In thecase of modified waveform, the quantities EFRDC and EDC represent the average EMFs for the twoMDFR modes and for the two CPDC modes respectively, as defined by,
EFRDC ≡EMDFR(1) + EMDFR(2 )
2, EDC ≡
ECPDC+ + ECPDC −2
(1.8)
Preliminary Version 1.03b
- 16 -
1.4.2. ACLF-AC Difference Measurement
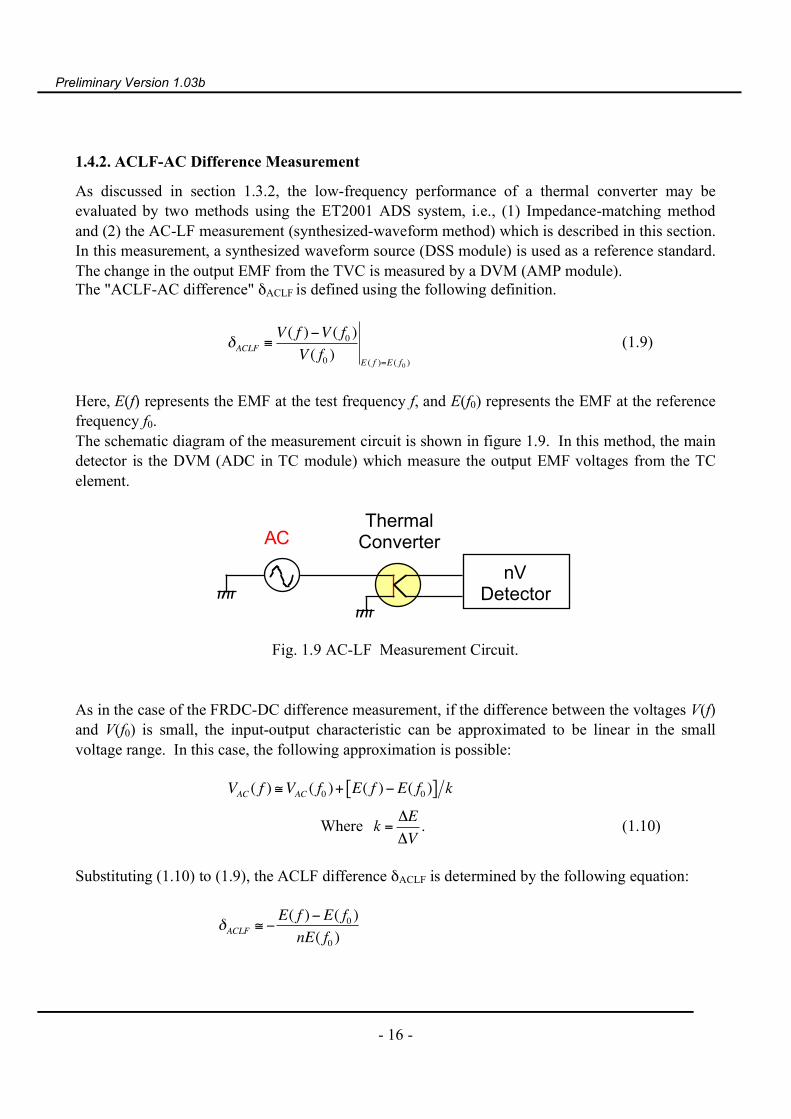
As discussed in section 1.3.2, the low-frequency performance of a thermal converter may beevaluated by two methods using the ET2001 ADS system, i.e., (1) Impedance-matching methodand (2) the AC-LF measurement (synthesized-waveform method) which is described in this section.In this measurement, a synthesized waveform source (DSS module) is used as a reference standard.The change in the output EMF from the TVC is measured by a DVM (AMP module).The "ACLF-AC difference" δACLF is defined using the following definition.
€
δACLF ≡V ( f )−V ( f0 )
V ( f0 ) E ( f )=E ( f0 )
(1.9)
Here, E(f) represents the EMF at the test frequency f, and E(f0) represents the EMF at the referencefrequency f0.The schematic diagram of the measurement circuit is shown in figure 1.9. In this method, the maindetector is the DVM (ADC in TC module) which measure the output EMF voltages from the TCelement.
ACThermalConverter
nVDetector
Fig. 1.9 AC-LF Measurement Circuit.
As in the case of the FRDC-DC difference measurement, if the difference between the voltages V(f)and V(f0) is small, the input-output characteristic can be approximated to be linear in the smallvoltage range. In this case, the following approximation is possible:
€
VAC ( f ) ≅VAC ( f0 )+ E( f )−E( f0 )[ ] k
Where
€
k =ΔEΔV
. (1.10)
Substituting (1.10) to (1.9), the ACLF difference δACLF is determined by the following equation:
€
δACLF ≅ −E( f )−E( f0 )nE( f0 )
Preliminary Version 1.03b
- 17 -
Where,
€
n =ΔE /E( )ΔV /V( )
(1.11)
Normalized index "n" is of the order of 2 for the TVCs with square-output characteristics.
1.4.3. AC-DC Difference Measurement
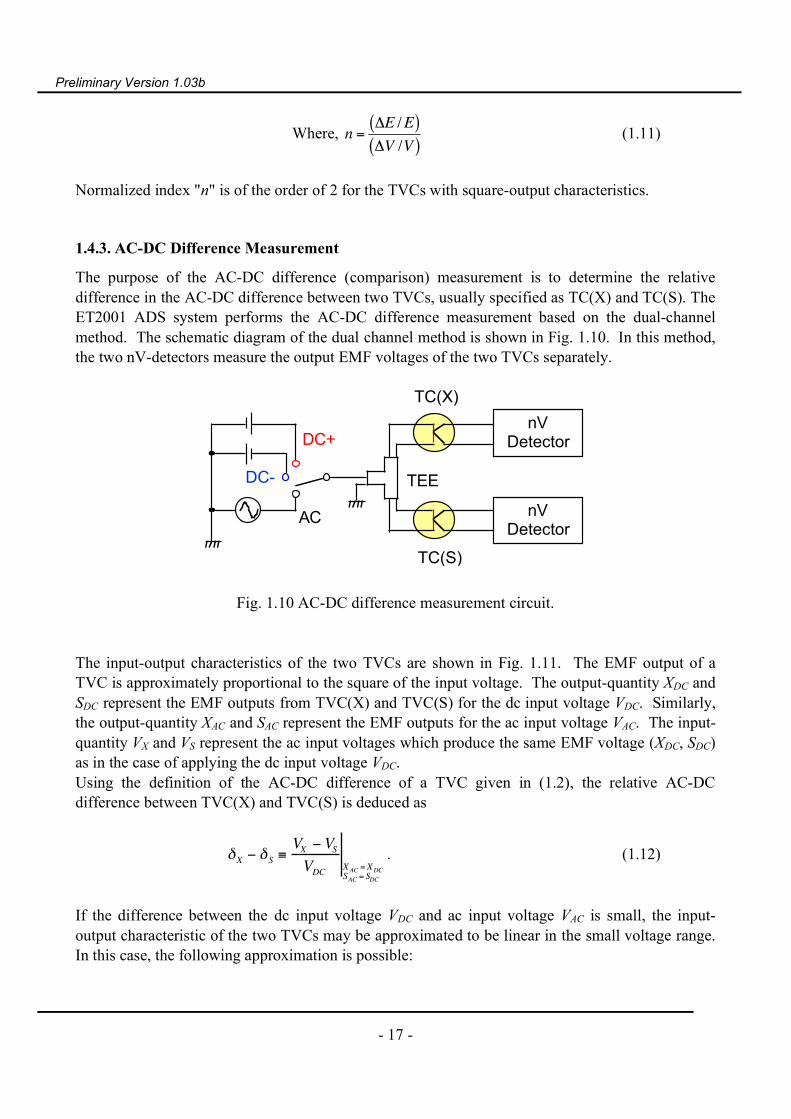
The purpose of the AC-DC difference (comparison) measurement is to determine the relativedifference in the AC-DC difference between two TVCs, usually specified as TC(X) and TC(S). TheET2001 ADS system performs the AC-DC difference measurement based on the dual-channelmethod. The schematic diagram of the dual channel method is shown in Fig. 1.10. In this method,the two nV-detectors measure the output EMF voltages of the two TVCs separately.
AC
TEE
nVDetector
DC+
DC-
TC(X)
nVDetector
TC(S)
Fig. 1.10 AC-DC difference measurement circuit.
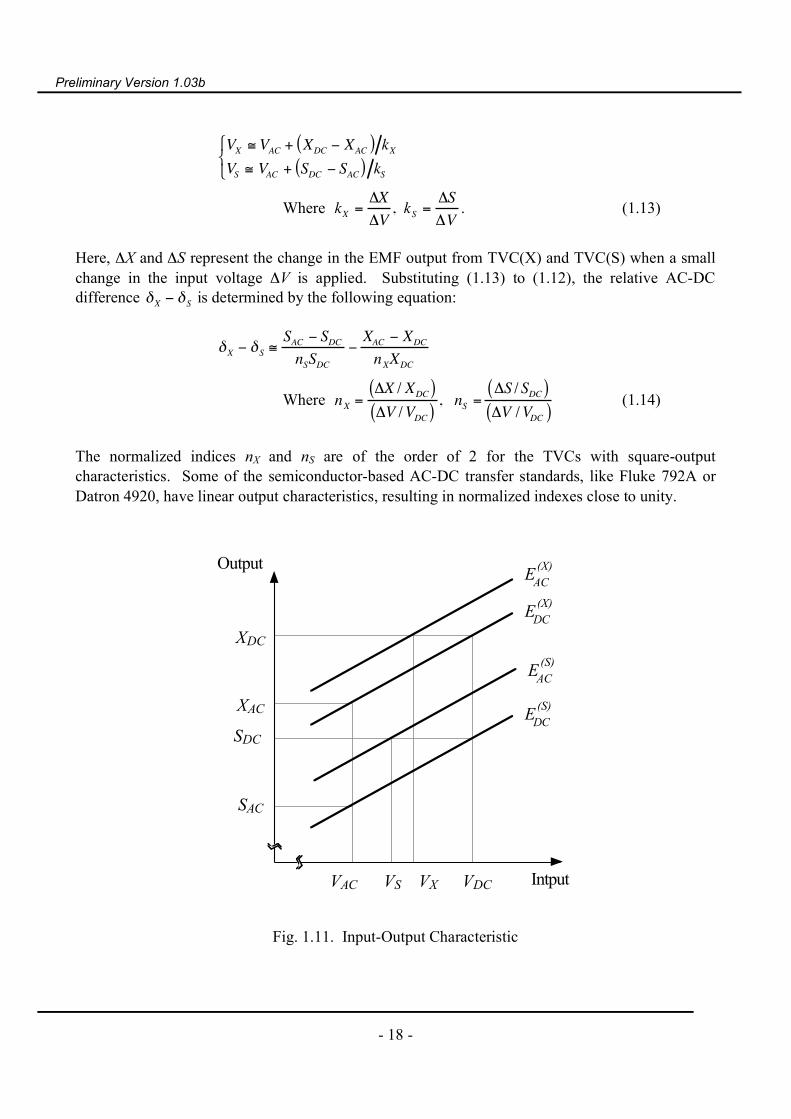
The input-output characteristics of the two TVCs are shown in Fig. 1.11. The EMF output of aTVC is approximately proportional to the square of the input voltage. The output-quantity XDC andSDC represent the EMF outputs from TVC(X) and TVC(S) for the dc input voltage VDC. Similarly,the output-quantity XAC and SAC represent the EMF outputs for the ac input voltage VAC. The input-quantity VX and VS represent the ac input voltages which produce the same EMF voltage (XDC, SDC)as in the case of applying the dc input voltage VDC.Using the definition of the AC-DC difference of a TVC given in (1.2), the relative AC-DCdifference between TVC(X) and TVC(S) is deduced as
δX − δ S ≡VX − VSVDC XAC =XDC
SAC = SDC
. (1.12)
If the difference between the dc input voltage VDC and ac input voltage VAC is small, the input-output characteristic of the two TVCs may be approximated to be linear in the small voltage range.In this case, the following approximation is possible:
Preliminary Version 1.03b
- 18 -
VX ≅ VAC + XDC − XAC( ) kXVS ≅ VAC + SDC − SAC( ) kS
Where kX =ΔXΔV
, kS =ΔSΔV
. (1.13)
Here, ΔX and ΔS represent the change in the EMF output from TVC(X) and TVC(S) when a smallchange in the input voltage ΔV is applied. Substituting (1.13) to (1.12), the relative AC-DCdifference δX − δ S is determined by the following equation:
δX − δ S ≅SAC − SDCnSSDC
−XAC − XDC
nXXDC
Where nX =ΔX / XDC( )ΔV /VDC( )
, nS =ΔS /SDC( )ΔV /VDC( )
(1.14)
The normalized indices nX and nS are of the order of 2 for the TVCs with square-outputcharacteristics. Some of the semiconductor-based AC-DC transfer standards, like Fluke 792A orDatron 4920, have linear output characteristics, resulting in normalized indexes close to unity.
Output
SAC
SDC
XAC
XDC
VAC VS VX VDC Intput
(X)EAC(X)EDC
(S)EAC
(S)EDC
Fig. 1.11. Input-Output Characteristic
Preliminary Version 1.03b
- 19 -
2. Set-up ET2001 ADS System
2.1. System Overview
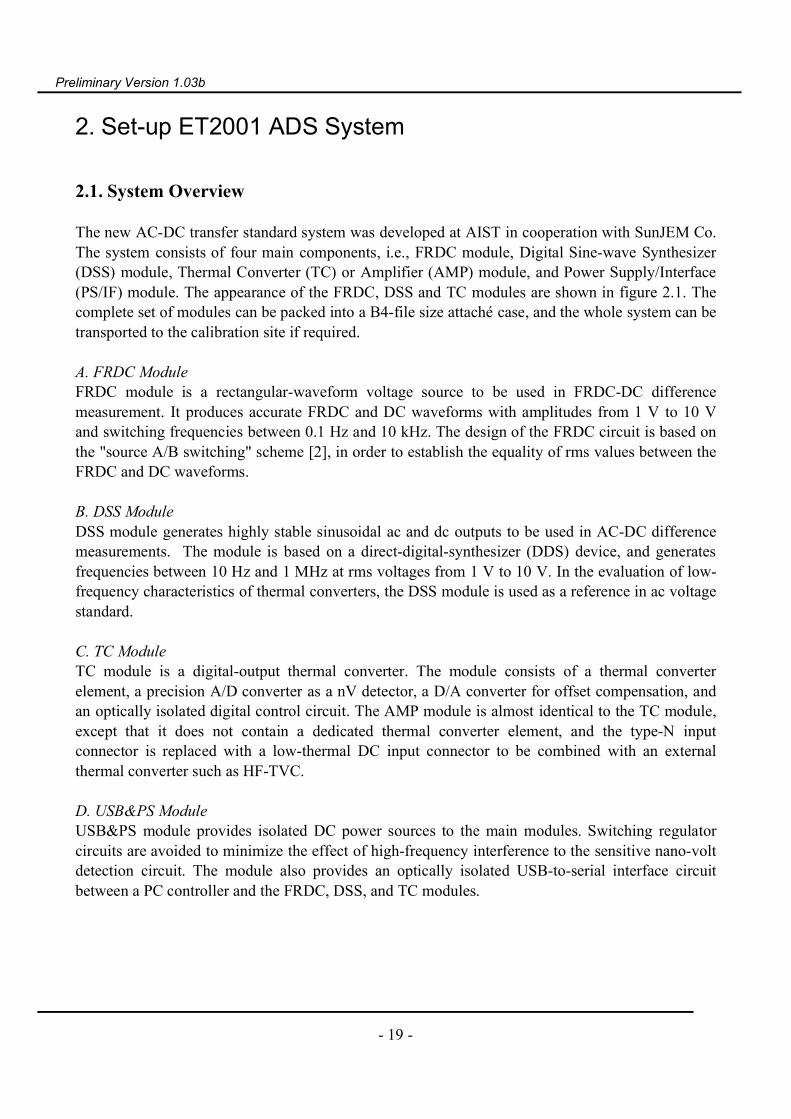
The new AC-DC transfer standard system was developed at AIST in cooperation with SunJEM Co.The system consists of four main components, i.e., FRDC module, Digital Sine-wave Synthesizer(DSS) module, Thermal Converter (TC) or Amplifier (AMP) module, and Power Supply/Interface(PS/IF) module. The appearance of the FRDC, DSS and TC modules are shown in figure 2.1. Thecomplete set of modules can be packed into a B4-file size attaché case, and the whole system can betransported to the calibration site if required.
A. FRDC ModuleFRDC module is a rectangular-waveform voltage source to be used in FRDC-DC differencemeasurement. It produces accurate FRDC and DC waveforms with amplitudes from 1 V to 10 Vand switching frequencies between 0.1 Hz and 10 kHz. The design of the FRDC circuit is based onthe "source A/B switching" scheme [2], in order to establish the equality of rms values between theFRDC and DC waveforms. B. DSS ModuleDSS module generates highly stable sinusoidal ac and dc outputs to be used in AC-DC differencemeasurements. The module is based on a direct-digital-synthesizer (DDS) device, and generatesfrequencies between 10 Hz and 1 MHz at rms voltages from 1 V to 10 V. In the evaluation of low-frequency characteristics of thermal converters, the DSS module is used as a reference in ac voltagestandard.
C. TC ModuleTC module is a digital-output thermal converter. The module consists of a thermal converterelement, a precision A/D converter as a nV detector, a D/A converter for offset compensation, andan optically isolated digital control circuit. The AMP module is almost identical to the TC module,except that it does not contain a dedicated thermal converter element, and the type-N inputconnector is replaced with a low-thermal DC input connector to be combined with an externalthermal converter such as HF-TVC.
D. USB&PS ModuleUSB&PS module provides isolated DC power sources to the main modules. Switching regulatorcircuits are avoided to minimize the effect of high-frequency interference to the sensitive nano-voltdetection circuit. The module also provides an optically isolated USB-to-serial interface circuitbetween a PC controller and the FRDC, DSS, and TC modules.

Preliminary Version 1.03b
- 20 -
Fig. 2.1 ET2001 ADS system
2.2. FRDC System
FRDC-DC difference measurement is performed using a FRDC module and one TC module to beevaluated. The TC module may be replaced by a combination of conventional thermal converterand an AMP module.The standard procedure for the measurement is as follows:(1) Configuration --- Connection of the three modules (FRDC, TC/AMP, USB&PS) and setting-up
the control program.(2) Setting Parameter --- Registering various measurement conditions and measurement options
step-by-step.(3) Execute Measurement --- Performing a fully automated FRDC-DC difference measurement.(4) Data Analysis --- Determination of a thermoelectric transfer difference of the thermal converter.
2.2.1. Configuration
CASE 1 --- Measurement with a TC module(1) Connect an AC Power cable and a USB cable to USB&PS module. Then turn on the power
switch.(2) Check green light in front panel, and connect a 26-pin MDR cable to “FRDC/DSS” port.(3) Connect the other end of the 26-pin MDR cable to a FRDC module.(4) Connect a 20-pin MDR cable to “TC#1(X)” port of USB&PS module.(5) Connect the other end of the 20-pin MDR cable to the TC (or AMP) module.(6) Connect the N-R input connectors of the FRDC module and the TC (AMP) module with an
NP-NP adopter or with a NP-NP cable no longer than 50 cm.
CASE 2 --- Measurement with a thermal converter and an AMP module.
Preliminary Version 1.03b
- 21 -
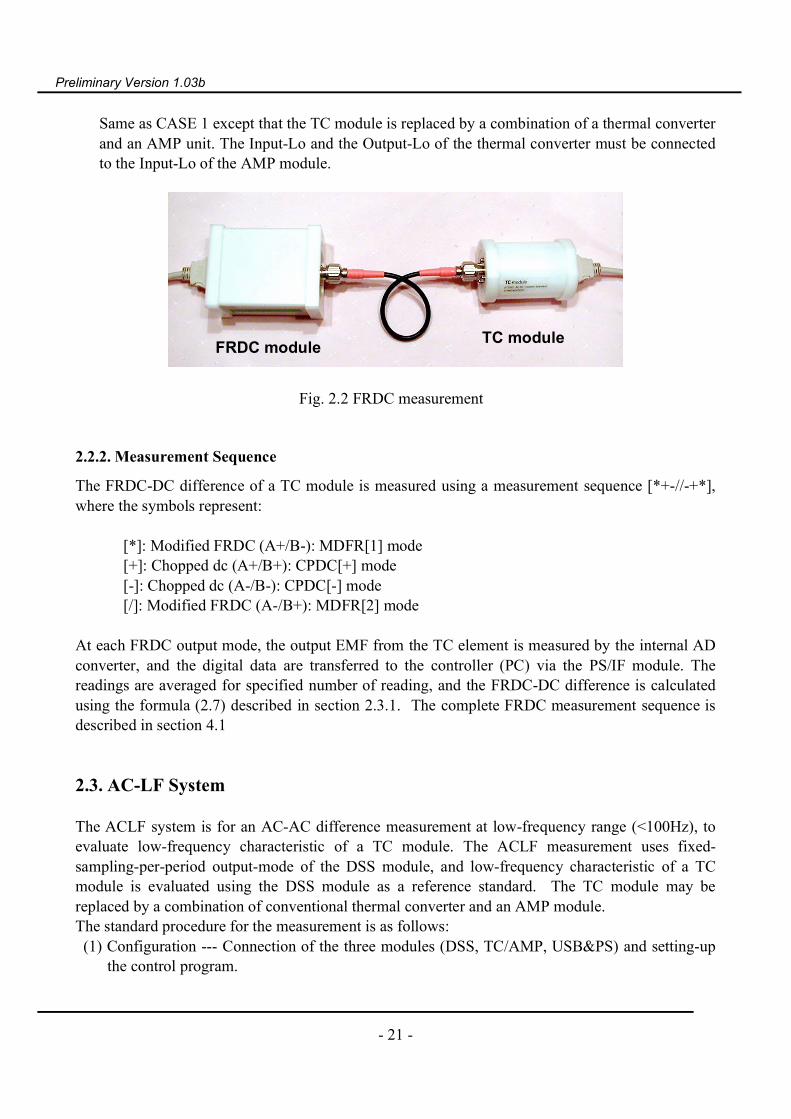
Same as CASE 1 except that the TC module is replaced by a combination of a thermal converterand an AMP unit. The Input-Lo and the Output-Lo of the thermal converter must be connectedto the Input-Lo of the AMP module.
Fig. 2.2 FRDC measurement
2.2.2. Measurement Sequence
The FRDC-DC difference of a TC module is measured using a measurement sequence [*+-//-+*],where the symbols represent:
[*]: Modified FRDC (A+/B-): MDFR[1] mode[+]: Chopped dc (A+/B+): CPDC[+] mode[-]: Chopped dc (A-/B-): CPDC[-] mode[/]: Modified FRDC (A-/B+): MDFR[2] mode
At each FRDC output mode, the output EMF from the TC element is measured by the internal ADconverter, and the digital data are transferred to the controller (PC) via the PS/IF module. Thereadings are averaged for specified number of reading, and the FRDC-DC difference is calculatedusing the formula (2.7) described in section 2.3.1. The complete FRDC measurement sequence isdescribed in section 4.1
2.3. AC-LF System
The ACLF system is for an AC-AC difference measurement at low-frequency range (<100Hz), toevaluate low-frequency characteristic of a TC module. The ACLF measurement uses fixed-sampling-per-period output-mode of the DSS module, and low-frequency characteristic of a TCmodule is evaluated using the DSS module as a reference standard. The TC module may bereplaced by a combination of conventional thermal converter and an AMP module.The standard procedure for the measurement is as follows:(1) Configuration --- Connection of the three modules (DSS, TC/AMP, USB&PS) and setting-up
the control program.
FRDC moduleTC module

Preliminary Version 1.03b
- 22 -
(2) Setting Parameter --- Registering various measurement conditions and measurement optionsstep-by-step.
(3) Execute Measurement --- Performing a fully automated ACLF measurement.(4) Data Analysis --- Determination of a thermoelectric transfer difference of the thermal converter.
2.3.1. Configuration
CASE 1 --- Measurement with a TC module
Fig. 2.3 ACLF measurement
(1) Connect an AC Power cable and a USB cable to USB&PS module. Then turn-on the powerswitch.
(2) Check green light in front panel, and connect a 26-pin MDR cable to “FRDC/DSS” port.(3) Connect the other end of the 26-pin MDR cable to a DSS module.(4) Connect a 20-pin MDR cable to “TC#1(X)” port of USB&PS module.(5) Connect the other end of the 20-pin MDR cable to the TC (or AMP) module.(6) Connect the N-R input connectors of the DSS module and the TC (AMP) module with an NP-
NP adopter or with a NP-NP cable no longer than 50 cm.
CASE 2 --- Measurement with a thermal converter and an AMP module.Same as the configuration shown above except that the TC module is replaced by a combinationof a thermal converter and an AMP unit. The Input-Lo and the Output-Lo of the thermalconverter must be connected to the Input-Lo of the AMP module.
2.3.2. Measurement Procedure
Three-mode measurement sequences, [AC(ref) / AC(test) / AC(ref)], are used to measure thedifference in the EMF output with frequency, while eliminating the influence of linear drift in DSSoutput and EMF output voltage.
AC(test): Sinusoidal AC output at test frequency
DSS moduleTC module
Preliminary Version 1.03b
- 23 -
AC(ref): Sinusoidal AC output at reference frequency
To avoid the effects from transient response after mode-switching, controller waits for specifiedperiod (normally 10s - 20 s) before integrating the reading from the TC/AMP module. The AC-ACdifference is calculated using the formula (2.11) described in section 2.3.2. The complete ACLFmeasurement sequence is described in section 5.1
2.4. AC-DC System
The AC-DC system is for an AC-DC or AC-AC difference measurement using a DSS module atfixed-sampling-per-period mode. This measurement determines relative difference between two TCmodules, TC(X) with respect to TC(S). The TC module(s) may be replaced by a combination ofconventional thermal converter(s) and AMP module(s).The standard procedure for the measurement is as follows:(1) Configuration --- Connection of the four modules (DSS, TC/AMP(X), TC/AMP(S), USB&PS)
and setting-up the control program.(2) Setting Parameter --- Registering various measurement conditions and measurement options
step-by-step.(3) Execute Measurement --- Performing a fully automated AC-DC difference comparison
measurement.(4) Data Analysis --- Determination of a thermoelectric transfer difference of the thermal converter.
In the comparison of the AC-DC difference in the higher frequency range (>10 kHz), frequencycharacteristic of a TVC including the connecting circuit between the TVCs becomes significant.Hence, it is widely accepted to define the branch-point of a TEE connector, which connects theTVCs and the AC/DC source, as the 'reference-plane' from which the frequency characteristic of aTVC is evaluated. In the case of standard TVC using type-N receptacle (N-R) as the inputconnector, the center of N-type TEE connector (N-TA-RRR) is taken as the reference plane.
2.4.1. Configuration
CASE 1 --- Measurement using TEE connector(1) Connect an AC Power cable and a USB cable to USB&PS module. Then turn-on the power
switch.(2) Check green light in front panel, and connect a 26-pin MDR cable to “FRDC/DSS” port.(3) Connect the other end of the 26-pin MDR cable to a DSS module.(4) Connect a 20-pin MDR cable to “TC#1(X)” port of USB&PS module.(5) Connect the other end of the 20-pin MDR cable to the TC (or AMP) module.(6) Connect another 20-pin MDR cable to “TC#2(S)” port of USB&PS module. Also, connect the
other end of the 20-pin MDR cable to the TC (or AMP) module.(7) Connect the N-R input connectors of the DSS module and the two TC modules (or TC) with an
NP-NP adopter or with a NP-NP cable no longer than 50 cm.

Preliminary Version 1.03b
- 24 -
Fig. 2.4 ACDC measurement
CASE 2 --- Measurement using a HF-TVC and a TC module.TEE connector is replaced by a built-in TEE inside a HF-TVC. The output of the HF-TVC isconnected to AMP module.
Fig. 2.5 ACDC measurement
2.4.2. Measurement Procedure
[1] AC-DC Difference measurement
DSS module
TC module(X) TC module(S)
TEE
DSS module
TC module
AMP module
HF-TVC
Preliminary Version 1.03b
- 25 -
A set of two four-mode standard measurement sequences, [AC/DC+/DC-/AC] and [AC/DC-/DC+/AC] are used in turn to eliminate the influence of linear drift and to check the dependence onthe sequence in DC+ and DC-:
AC: Sinusoidal AC output at test frequencyDC+: Steady-state positive DC output.DC-: Steady-state positive DC output.
[2] AC-AC Difference measurement] As in the case of ACLF measurement, three-mode measurement sequences, [AC(ref)/AC(test)/AC(ref)], is used to measure the difference in the EMF output with frequency.
In either measurements, controller waits for specified period (normally 10s - 20 s) beforeintegrating the reading from the TC/AMP module(s). The AC-DC or AC-AC difference iscalculated using the formula (2.14) described in section 2.4.2. The complete measurementsequence for the AC-DC or AC-AC difference measurements are described in section 6.1
Preliminary Version 1.03b
- 26 -
3. Set-up ET2001 ADS Software
3.1. Software Components
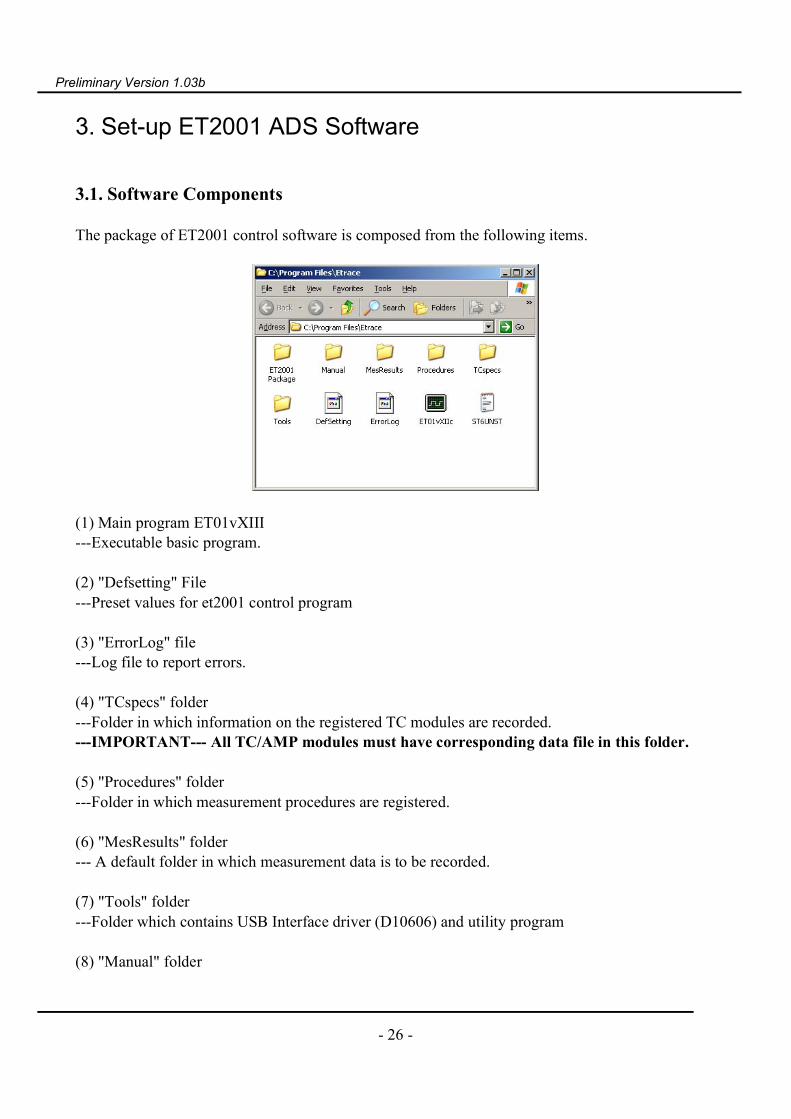
The package of ET2001 control software is composed from the following items.
(1) Main program ET01vXIII---Executable basic program.
(2) "Defsetting" File---Preset values for et2001 control program
(3) "ErrorLog" file---Log file to report errors.
(4) "TCspecs" folder---Folder in which information on the registered TC modules are recorded.---IMPORTANT--- All TC/AMP modules must have corresponding data file in this folder.
(5) "Procedures" folder---Folder in which measurement procedures are registered.
(6) "MesResults" folder--- A default folder in which measurement data is to be recorded.
(7) "Tools" folder---Folder which contains USB Interface driver (D10606) and utility program
(8) "Manual" folder
Preliminary Version 1.03b
- 27 -
(9) "ET2001" package folderInstaller for ET2001 program.
3.2. Manual Operation
3.2.1. Initial Set-up Procedure
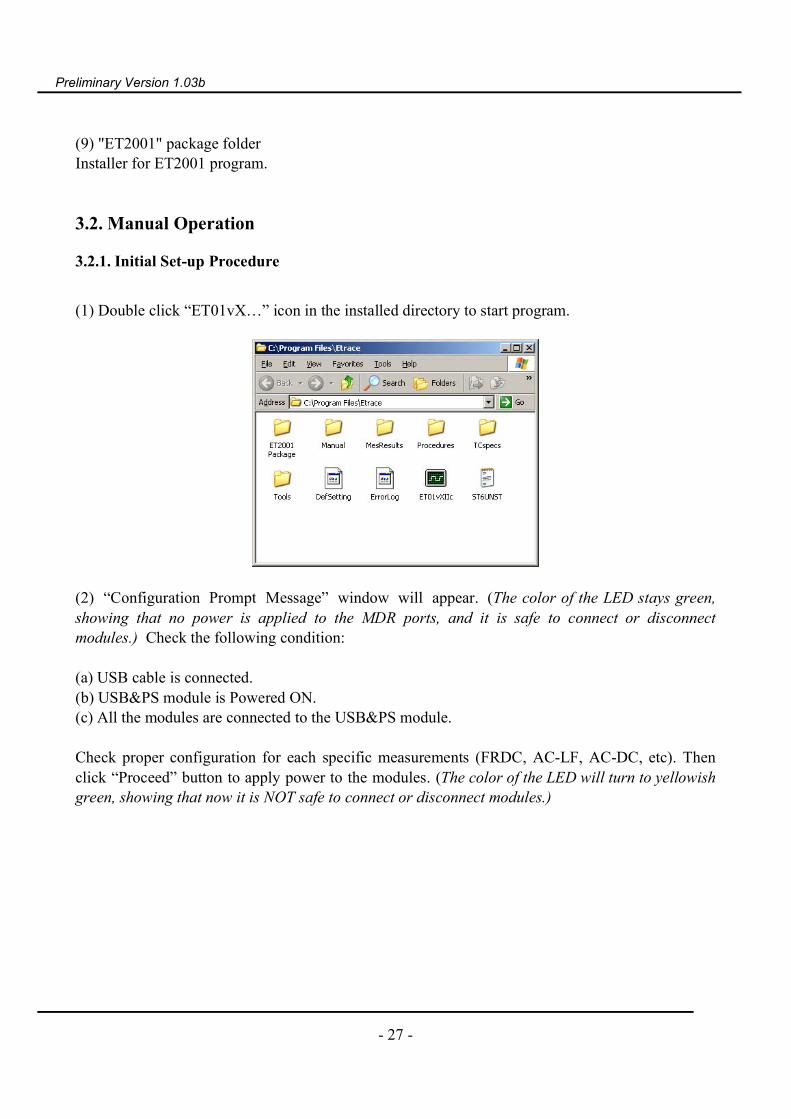
(1) Double click “ET01vX…” icon in the installed directory to start program.
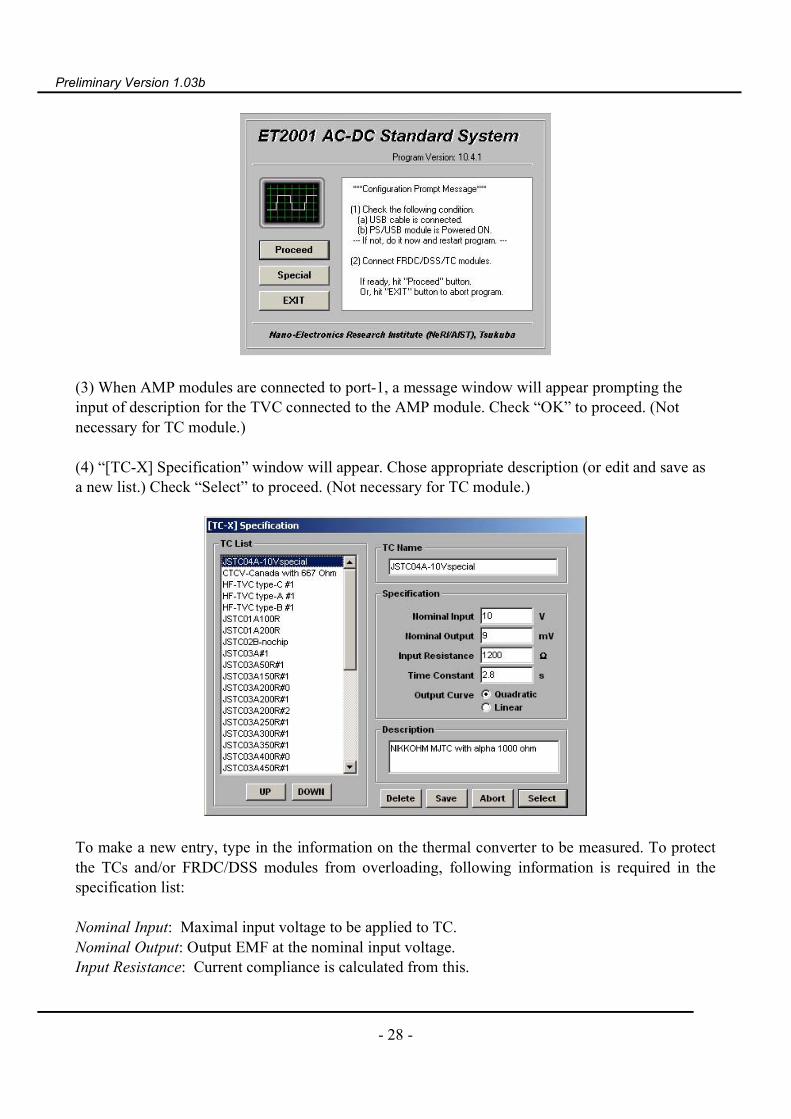
(2) “Configuration Prompt Message” window will appear. (The color of the LED stays green,showing that no power is applied to the MDR ports, and it is safe to connect or disconnectmodules.) Check the following condition:
(a) USB cable is connected.(b) USB&PS module is Powered ON.(c) All the modules are connected to the USB&PS module.
Check proper configuration for each specific measurements (FRDC, AC-LF, AC-DC, etc). Thenclick “Proceed” button to apply power to the modules. (The color of the LED will turn to yellowishgreen, showing that now it is NOT safe to connect or disconnect modules.)
Preliminary Version 1.03b
- 28 -
(3) When AMP modules are connected to port-1, a message window will appear prompting theinput of description for the TVC connected to the AMP module. Check “OK” to proceed. (Notnecessary for TC module.)
(4) “[TC-X] Specification” window will appear. Chose appropriate description (or edit and save asa new list.) Check “Select” to proceed. (Not necessary for TC module.)
To make a new entry, type in the information on the thermal converter to be measured. To protectthe TCs and/or FRDC/DSS modules from overloading, following information is required in thespecification list:
Nominal Input: Maximal input voltage to be applied to TC.Nominal Output: Output EMF at the nominal input voltage.Input Resistance: Current compliance is calculated from this.

Preliminary Version 1.03b
- 29 -
Time Constant: Gives warning if measured value differs.Output Curve: for calculating EMF output voltage.
(5) When AMP modules are connected to port-2, repeat the same procedure for “[TC-S]Specification” window
(6) After a few seconds, a message window will appear notifying the completion of initial set-upprocedure. Check “OK” to proceed to manual control or setting measurement parameters. In thecase of an AC-DC difference measurement, the initially displayed windows are:
(a) Main window:(b) DSS module control/display:(c) TC-X module control/display:(d) TC-X module control/display:(e) Output EMF monitor:(f) Temperature monitor:
3.2.2. Manual Operation
(a) Main windowUse “Manual Control” menu to control modules manually, or use “Measurement” menu or “SET”button to proceed to the next stage.
(a)
(b)
(c)
(d)
(e) (f)
Preliminary Version 1.03b
- 30 -
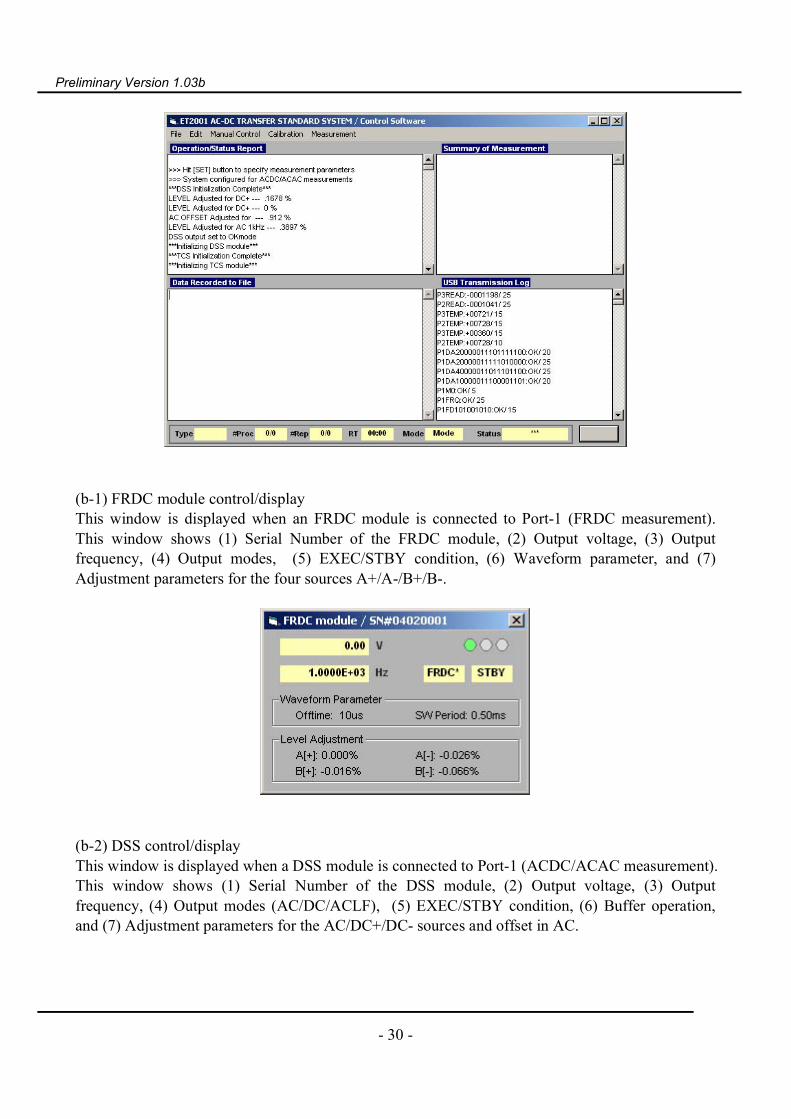
(b-1) FRDC module control/displayThis window is displayed when an FRDC module is connected to Port-1 (FRDC measurement).This window shows (1) Serial Number of the FRDC module, (2) Output voltage, (3) Outputfrequency, (4) Output modes, (5) EXEC/STBY condition, (6) Waveform parameter, and (7)Adjustment parameters for the four sources A+/A-/B+/B-.
(b-2) DSS control/displayThis window is displayed when a DSS module is connected to Port-1 (ACDC/ACAC measurement).This window shows (1) Serial Number of the DSS module, (2) Output voltage, (3) Outputfrequency, (4) Output modes (AC/DC/ACLF), (5) EXEC/STBY condition, (6) Buffer operation,and (7) Adjustment parameters for the AC/DC+/DC- sources and offset in AC.

Preliminary Version 1.03b
- 31 -
(c) TC modules control/displayThese windows show (1) Serial Number of TC/AMP module, (2) DVM reading, (3) Temperaturemonitor inside the TC/AMP module, (4) Gain/Offset setting, and (5) parameters describing theTC/AMP modules connected to Port-2 and Port-3, respectively. Only one window is displayed forFRDC and ACLF measurements.
(d) Output EMF monitorThis window displays the output trace from the TC/AMP module(s) during the integration period.Green line represents reading from TCX, and yellow line represents one from TCS.

Preliminary Version 1.03b
- 32 -
(e) Temperature monitorThis window displays the change in the temperature inside the TC/AMP module(s). It displays theinitial warm-up condition, and usually shows the temperature several degrees higher than theambient temperature after stabilization. Green line represents reading from TCX, and yellow linerepresents one from TCS.
3.3. Setting Parameter
3.3.1. Register Reference Point
[Case 1 / FRDC measurement]FRDC measurement has no reference point and this window is skipped automatically.
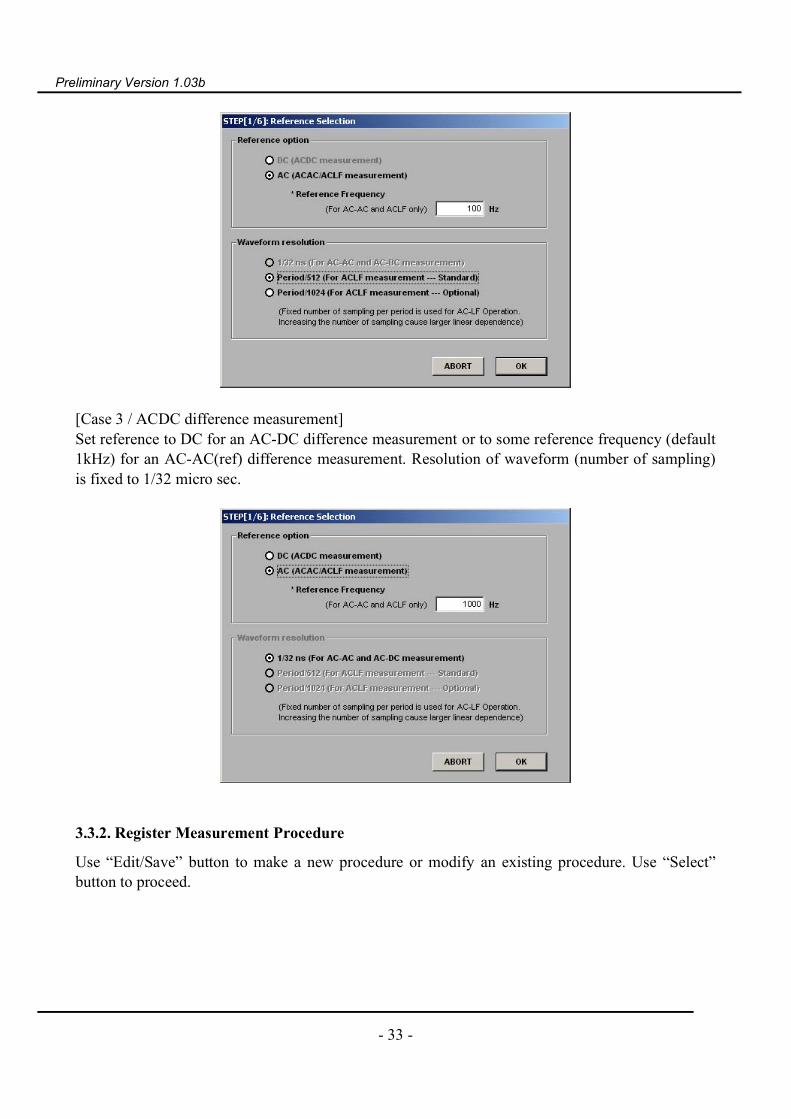
[Case 2 / ACLF measurement] Reference Frequency for AC-LFSet reference frequency (default 100 Hz) for an AC-AC(ref) difference measurement. Then selectresolution (number of sampling per period) to 1/512 (default) or 1/1024. Click “OK” button toproceed.
Preliminary Version 1.03b
- 33 -
[Case 3 / ACDC difference measurement]Set reference to DC for an AC-DC difference measurement or to some reference frequency (default1kHz) for an AC-AC(ref) difference measurement. Resolution of waveform (number of sampling)is fixed to 1/32 micro sec.
3.3.2. Register Measurement Procedure
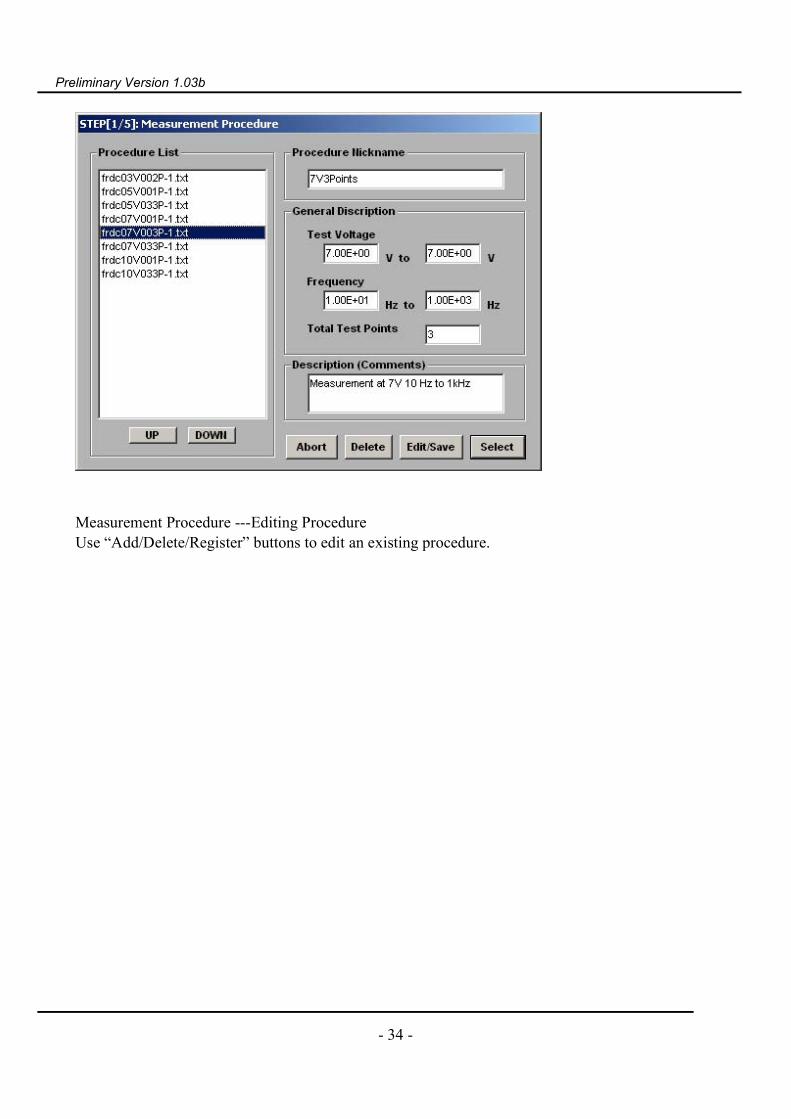
Use “Edit/Save” button to make a new procedure or modify an existing procedure. Use “Select”button to proceed.
Preliminary Version 1.03b
- 34 -
Measurement Procedure ---Editing ProcedureUse “Add/Delete/Register” buttons to edit an existing procedure.
Preliminary Version 1.03b
- 35 -
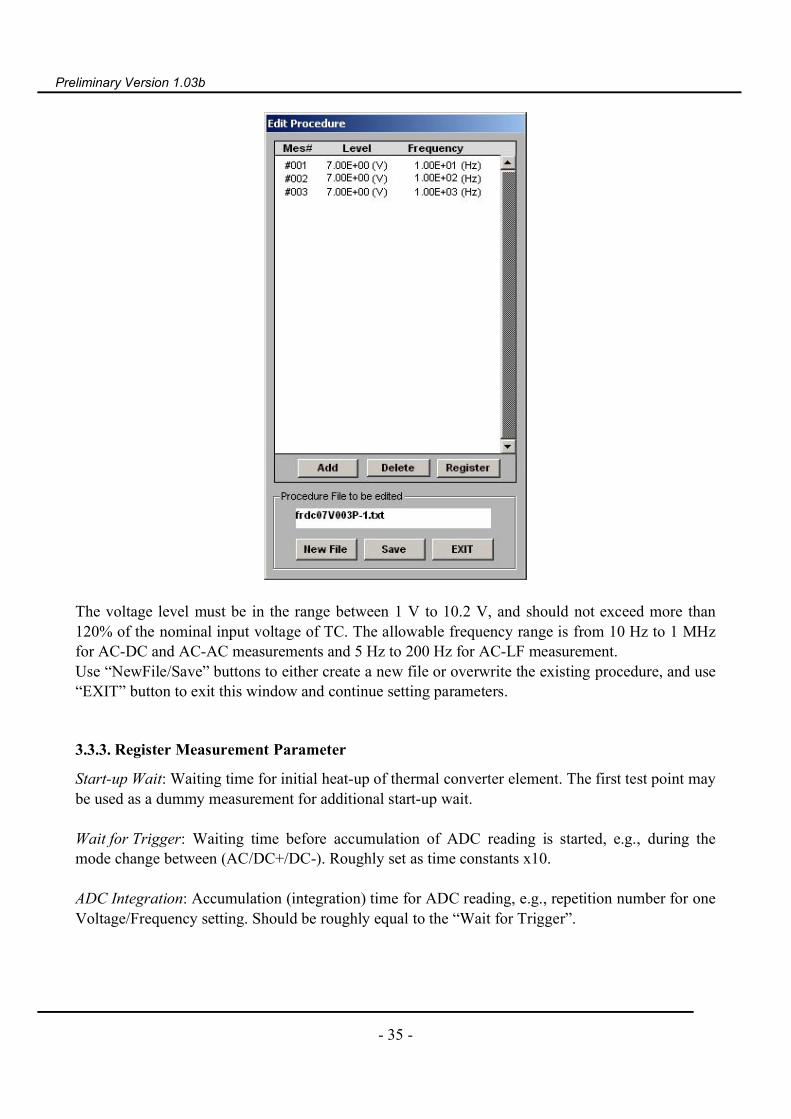
The voltage level must be in the range between 1 V to 10.2 V, and should not exceed more than120% of the nominal input voltage of TC. The allowable frequency range is from 10 Hz to 1 MHzfor AC-DC and AC-AC measurements and 5 Hz to 200 Hz for AC-LF measurement.Use “NewFile/Save” buttons to either create a new file or overwrite the existing procedure, and use“EXIT” button to exit this window and continue setting parameters.
3.3.3. Register Measurement Parameter
Start-up Wait: Waiting time for initial heat-up of thermal converter element. The first test point maybe used as a dummy measurement for additional start-up wait.
Wait for Trigger: Waiting time before accumulation of ADC reading is started, e.g., during themode change between (AC/DC+/DC-). Roughly set as time constants x10.
ADC Integration: Accumulation (integration) time for ADC reading, e.g., repetition number for oneVoltage/Frequency setting. Should be roughly equal to the “Wait for Trigger”.
Preliminary Version 1.03b
- 36 -
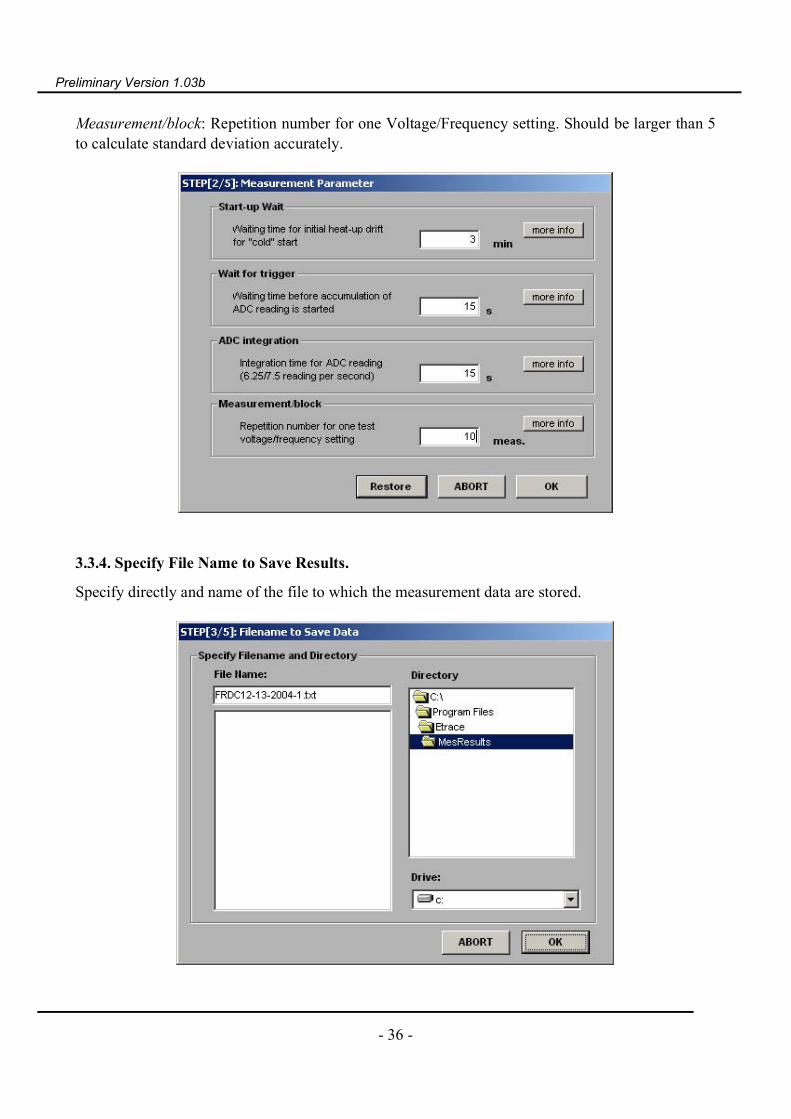
Measurement/block: Repetition number for one Voltage/Frequency setting. Should be larger than 5to calculate standard deviation accurately.
3.3.4. Specify File Name to Save Results.
Specify directly and name of the file to which the measurement data are stored.

Preliminary Version 1.03b
- 37 -
Initial default directory is “C:\Program Files\Etrace\MesResults”. Any other directory may beselected, and the new directory will be recorded as a new default in to the “DefSetting” file.
3.3.5. Register Measurement Options
Input Measurement Option
Recommended options are,
Drift Allowance : 10 ppm/min. (May not be sufficient for most accurate measurements)Ending Option : Go to stand-by mode. (power-off modules, safer option)Index Measurement Option : Always Measure Index. (for quick check use Skip-Measurement
option)
3.3.6. Specify Email Address to Send Data.
Set Email Report Option
Preliminary Version 1.03b
- 38 -
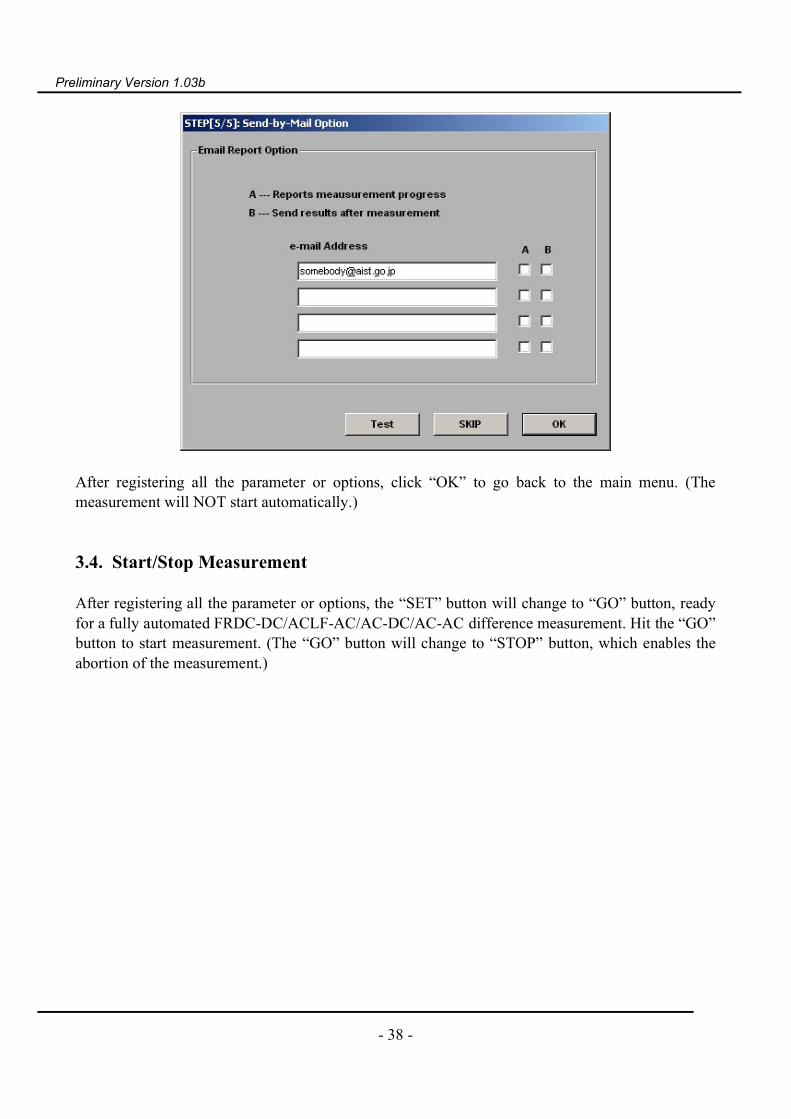
After registering all the parameter or options, click “OK” to go back to the main menu. (Themeasurement will NOT start automatically.)
3.4. Start/Stop Measurement
After registering all the parameter or options, the “SET” button will change to “GO” button, readyfor a fully automated FRDC-DC/ACLF-AC/AC-DC/AC-AC difference measurement. Hit the “GO”button to start measurement. (The “GO” button will change to “STOP” button, which enables theabortion of the measurement.)

Preliminary Version 1.03b
- 39 -
[Automated Measurement]Typical appearance of display (screen) during the automated FRDC-DC difference measurement isshown below. The fourth parameter “RT” displayed on the bottom of the main widow shows theapproximate remaining time before the measurement will be completed.
[ End of measurement]

Preliminary Version 1.03b
- 40 -
After finishing the measurement, the program go to the stand-by mode showing the “ConfigurationPrompt Message” window, ready to restart another FRDC measurement or change configuration toACDC or ACLF measurements.
Preliminary Version 1.03b
- 41 -
4. FRDC-DC Difference Measurement
4.1. Executing Measurement
4.1.1. Measurement Procedure
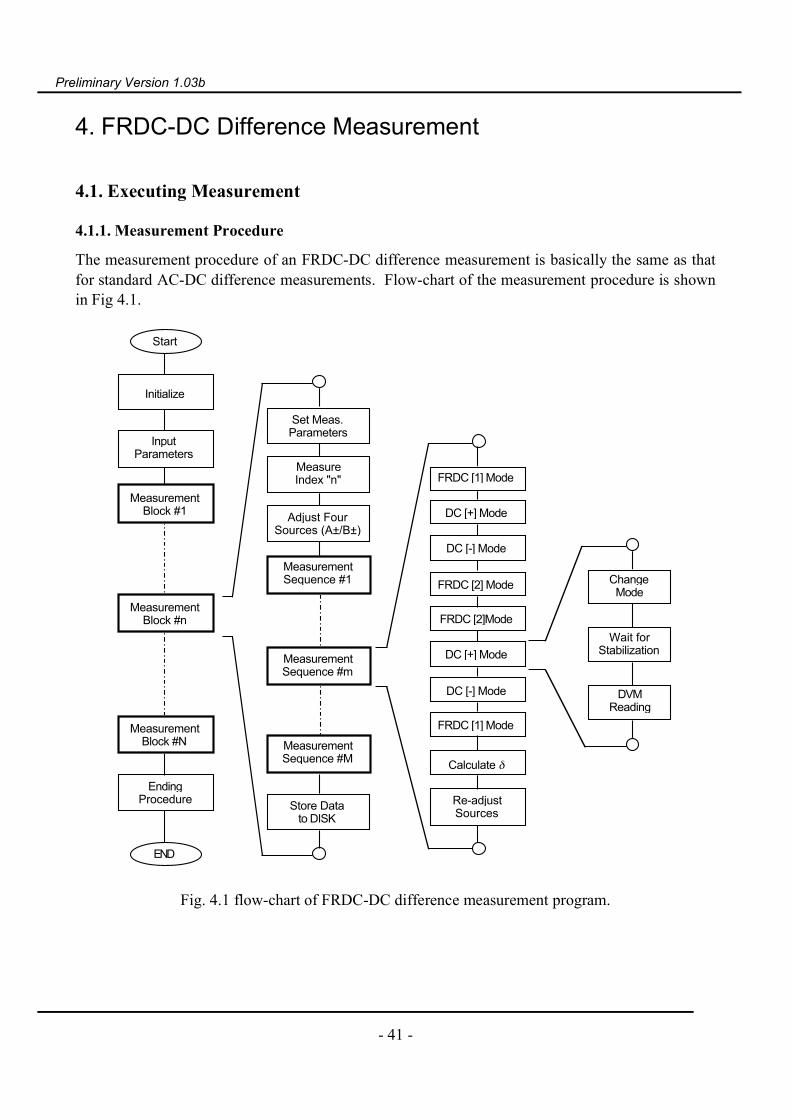
The measurement procedure of an FRDC-DC difference measurement is basically the same as thatfor standard AC-DC difference measurements. Flow-chart of the measurement procedure is shownin Fig 4.1.
END
DC [+] Mode
DC [-] Mode
FRDC [2] Mode
FRDC [2]Mode
DC [+] Mode
DC [-] Mode
FRDC [1] Mode
EndingProcedure
Initialize
MeasureIndex "n"
Adjust FourSources (A±/B±)
Calculate δ
Re-adjustSources
MeasurementBlock #1
MeasurementBlock #n
MeasurementBlock #N
Set Meas.Parameters
MeasurementSequence #1
MeasurementSequence #m
MeasurementSequence #M
Store Datato DISK
FRDC [1] Mode
ChangeMode
Wait forStabilization
DVMReading
Start
InputParameters
Fig. 4.1 flow-chart of FRDC-DC difference measurement program.
Preliminary Version 1.03b
- 42 -
After registering all the parameters or options, as described in chapter 3, the program will go tostand-by mode, ready for a fully automated FRDC-DC difference measurement. When "GO" buttonis pressed, the program will apply voltage to the TC module, and waits for a specified period oftime (normally 10 minutes) to avoid the effects from initial warm-up drift. Then the programrepeats procedure (1) to (5) at each test points (Measurement Loops) as follows. (1) Measurement of sensitivity indexThe control program measures the normalized sensitivity index n at each test point. The normalizedsensitivity indices are measured by changing the input voltage by dV (normally 0.1%). Influence ofdrift of the output voltage is removed by a measurement sequence [(V-dV ) / (V+dV ) / (V-dV)].NOTE ----- After repeating the index-measurement 10 times, the program proceeds to thenext stage with warning message that the drift is too large.
(2) Adjustment of voltage levelThe FRDC and CPDC waveforms are generated by combining four independent voltage sources(A+, A-, B+, B-) inside FRDC module. The amplitudes of the outputs from the four sources areautomatically adjusted within 0.01% relative to each other. This process reduces AC components inthe power and prevents low frequency thermal ripple.NOTE ---- After repeating the adjustment five times, the program proceeds to the next stagewith warning message that the adjustment is not sufficient.
(3) Measurement sequenceIn the case of FRDC-DC difference measurement, the following eight-mode measurement sequenceis used to eliminate the influence of linear drift in FRDC output and EMF output voltage:
[FRDC/CPDC+/CPDC-/FRDC/FRDC/CPDC-/CPDC+/FRDC]
To avoid the effects from transient response after mode-switching, program waits for specifiedperiod (normally 10 s) before reading the EMF from TVC. Then the readings of the DVM areintegrated for 10 s ~ 20 s and average values and standard deviations are calculated.
(4) Determination of FRDC-DC differenceThe FRDC-DC difference is calculated using formula (2.7). The measurement sequences arerepeated for 10 times, and average value and standard deviation for the FRDC-DC difference isobtained.
(5)Storing measurement data After measurement sequence, measurement conditions and measurement data of each test point arestored to hard disk of measurement controller. The recorded items are listed in the following sub-section.
After measurements for all test points are executed, summary of measurement data are stored to thehard disk of the system controller. Then instruments are reset to initial condition preparing for the
Preliminary Version 1.03b
- 43 -
exit from the measurement program. In the case of standard measurement condition, onemeasurement loop takes about one hour. For a set of 16 standard test points from 0.1 Hz to 5kHzrepeated twice, whole measurement (33 points) takes approximately 32 hours.
4.1.2. Data Format
The results from the FRDC-DC difference measurement are stored into the specified data-file usingthe same format as displayed in the [Data Recorded to File] window.
The data-file consists of the following records.(1) Title "Data from FRDC-DC difference measurement."(2) Revision Number of the control program(3) Main header common to all measurement-blocks, including:
(3-1) Comment of the measurement,(3-2) ID (serial) number of FRDC module,(3-3) Name, ID (serial) number, and description of TC/AMP module,(3-4) Input resistance of TC and fixed Dummy-resistance (1kohm),(3-5) Off-time,(3-6) Number of repetition for one measurement blocks,(3-7) Waiting time before the ADC integration, and for initial warm-up time.(3-8) Number of ADC sampling.
(4) Time constant of TC (measured).(5) Data for one set of measurements, consisting of:
(5-1) Measurement block number,(5-2) Date and Time of each measurement block,(5-3) Output Level/Mode for each block,(5-4) Switching Period/Frequency for each block,(5-5) Result of TC Index measurement,(5-6) Result of Source adjustments,(5-7) Results of one measurement-sequence "∗+−//−+∗", consisting of:
(5-7-1) Measurement-sequence number,(5-7-2) Time of each measurement-sequence,(5-7-3) Temperature inside TC/AMP module,(5-7-4) EMF outputs for each mode ("∗+−/"),(5-7-5) Average standard deviation of EMF outputs in ppm,(5-7-6) FRDC-DC difference for each sequence in ppm,
(5-8) Average FRDC-DC difference for each measurement-block(5-9) Standard deviation of FRDC-DC difference in ppm.
(6) Summary of the measurement.(7) Error/Warning message during the measurement.
Preliminary Version 1.03b
- 44 -
4.2. Curve-fitting
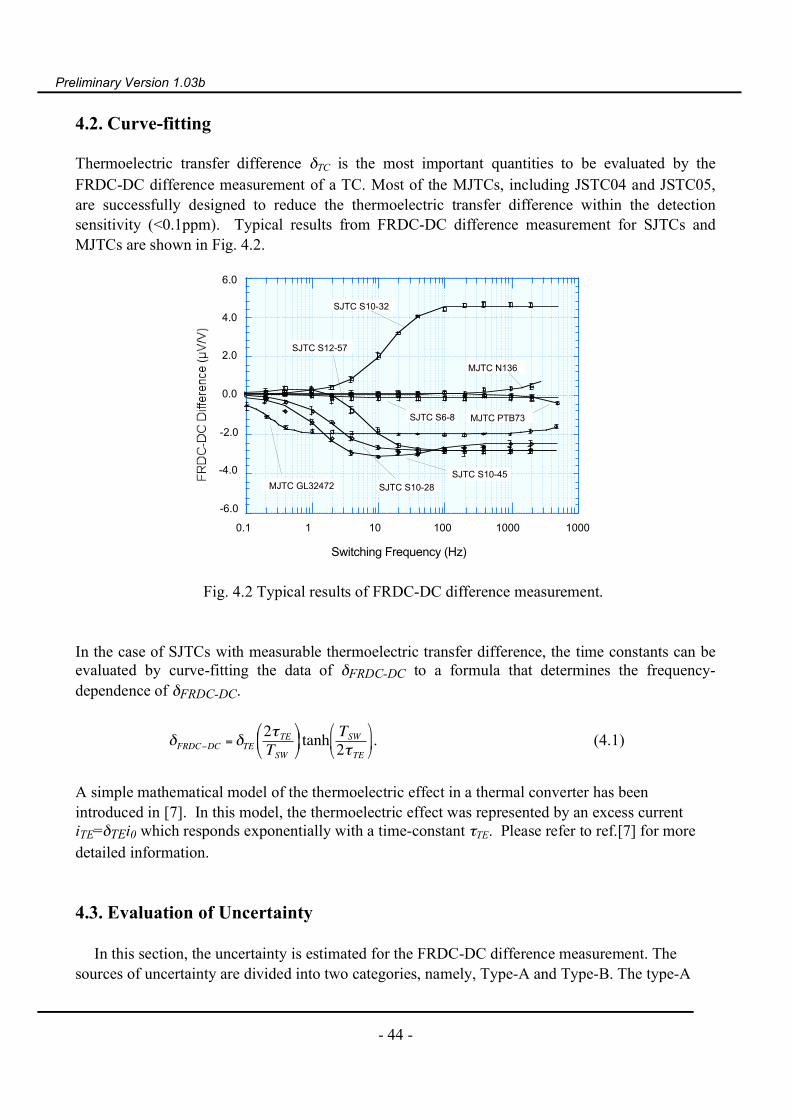
Thermoelectric transfer difference δTC is the most important quantities to be evaluated by theFRDC-DC difference measurement of a TC. Most of the MJTCs, including JSTC04 and JSTC05,are successfully designed to reduce the thermoelectric transfer difference within the detectionsensitivity (<0.1ppm). Typical results from FRDC-DC difference measurement for SJTCs andMJTCs are shown in Fig. 4.2.
-6.0
-4.0
-2.0
0.0
2.0
4.0
6.0
0.1 1 10 100 1000 1000
Switching Frequency (Hz)
SJTC S10-28
SJTC S10-45
SJTC S10-32
SJTC S12-57
MJTC N136
SJTC S6-8 MJTC PTB73
MJTC GL32472
Fig. 4.2 Typical results of FRDC-DC difference measurement.
In the case of SJTCs with measurable thermoelectric transfer difference, the time constants can beevaluated by curve-fitting the data of δFRDC-DC to a formula that determines the frequency-dependence of δFRDC-DC.
€
δFRDC−DC = δTE2τTETSW
tanh TSW
2τTE
. (4.1)
A simple mathematical model of the thermoelectric effect in a thermal converter has beenintroduced in [7]. In this model, the thermoelectric effect was represented by an excess currentiTE=δTEi0 which responds exponentially with a time-constant τTE. Please refer to ref.[7] for moredetailed information.
4.3. Evaluation of Uncertainty
In this section, the uncertainty is estimated for the FRDC-DC difference measurement. Thesources of uncertainty are divided into two categories, namely, Type-A and Type-B. The type-A

Preliminary Version 1.03b
- 45 -
uncertainties can be evaluated from actual measurement as the standard deviation of the data, whilethe type-B uncertainties have to be estimated using different methods depending on the nature ofthe sources of uncertainty.
4.3.1. Type-A Uncertainties
The type-A uncertainty in the FRDC-DC difference measurement for a "test"-TC module (UUT)is contributed from either uncertainty related to FRDC output ΔV or that to the output EMF voltageΔE from TC. Considering the square input-output characteristic of standard TVC, the uncertaintycomponents in ΔE contributes with factor one-half to the FRDC-DC difference:
€
dVV
=1ndEE
, (4.2)
The type-A uncertainty is composed of the following components:
(1) Stability/noise of FRDC module outputIn the case of an FRDC module of the ET2001 ADS system, typical thermal drift is specified to be<10 ppm/deg. Though linear drift in the output is compensated by the standard measurementsequence [MDFR(1), CPDC(+), CPDC(-), MDFR(2), MDFR(2), CPDC(-), CPDC(+), MDFR(1)],and most of the non-linear fluctuation averages out for the normal integration period of 10 s, it canstill contribute to the type-A uncertainty. Since the change in the output of the FRDC modulecauses the change in the EMF output of the TCs, and the temperature coefficients of TC-output aremuch larger than that of the FRDC circuit, the effect to the type-A uncertainty will be included inthe effect from the stability of TC module output discussed in the following paragraph.On the other hand, typical short-term stability (0.03Hz to 3Hz) of the output of the FRDC module isspecified to be <10 ppm p-p. The equivalent low-frequency noise from the FRDC circuit iscalculated as (10 / 5) / √3 = 1.2 ppm/√Hz. For normal measurement sequence (40 s for positive and40 s for negative), contribution to the type-A uncertainty is estimated to be 1.2 x (√2 / √40) = 0.26ppm for each sequence, or 0.26 / √10 = 0.08 ppm for the average of 10 measurement sequence.
(2) Stability of TC EMF outputIn the case of JSTC04 TC elements used in the standard TC modules, the temperature coefficientsof the output EMFs are of the order of 100 ppm/K, much higher than that of the output of FRDCmodule. Hence the thermal guarding of the TC module against the change of the ambienttemperature is critically important for a precision measurement. The ET2001 control softwaresuspends measurement until proper drift-condition (<10 ppm/min) is established. The linearcomponent of the drift in the EMF output is compensated by the standard measurement sequence,as in the case of the drift of an FRDC module. In this case, second-order drift during one set ofmeasurement (1 min) should not exceed one-half of the linear drift. Hence, fluctuation in the outputof a TC module (including the fluctuation in the output of FRDC module) should not affect themeasurement results by more than 5 x (1/2) =2.5 ppm for each sequence. The contribution toFRDC-DC difference for the average of 10 measurement sequence is estimated to be 2.5 / (2*√10)= 0.4 ppm, taking eq. (11.2) into account.
Preliminary Version 1.03b
- 46 -
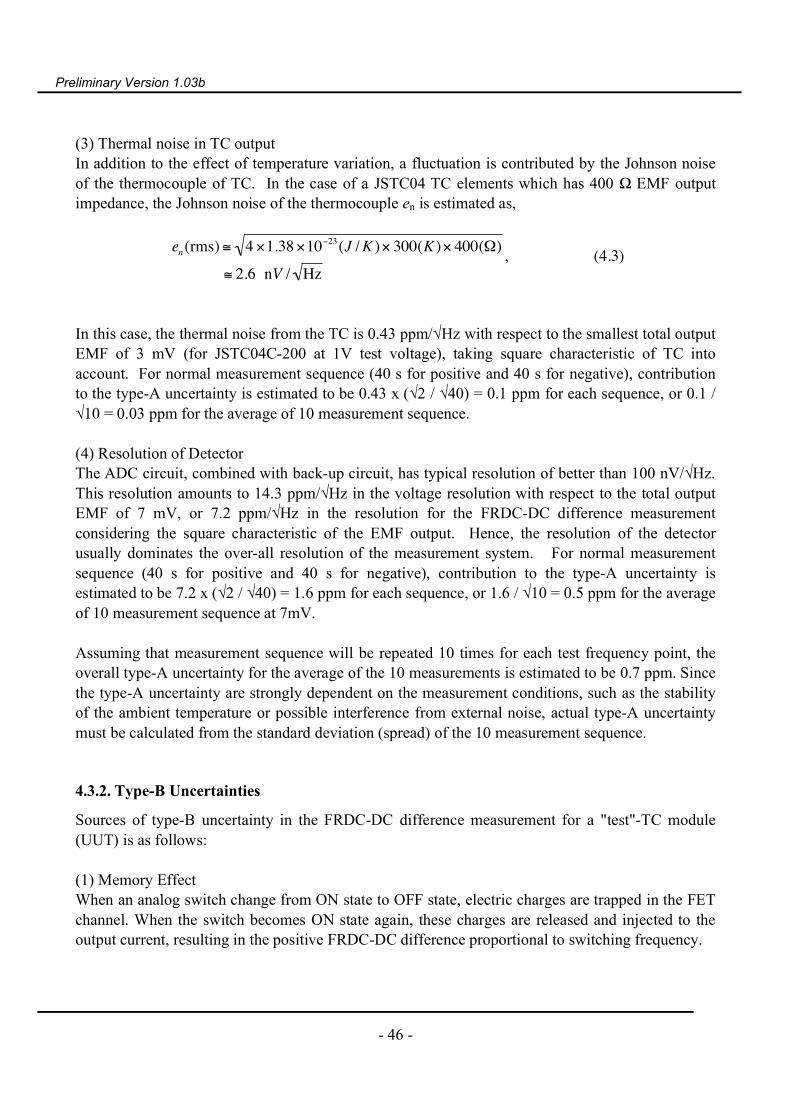
(3) Thermal noise in TC outputIn addition to the effect of temperature variation, a fluctuation is contributed by the Johnson noiseof the thermocouple of TC. In the case of a JSTC04 TC elements which has 400 Ω EMF outputimpedance, the Johnson noise of the thermocouple en is estimated as,
€
en(rms) ≅ 4 ×1.38×10−23(J /K )× 300(K )× 400(Ω)
≅ 2.6 nV / Hz, (4.3)
In this case, the thermal noise from the TC is 0.43 ppm/√Hz with respect to the smallest total outputEMF of 3 mV (for JSTC04C-200 at 1V test voltage), taking square characteristic of TC intoaccount. For normal measurement sequence (40 s for positive and 40 s for negative), contributionto the type-A uncertainty is estimated to be 0.43 x (√2 / √40) = 0.1 ppm for each sequence, or 0.1 /√10 = 0.03 ppm for the average of 10 measurement sequence.
(4) Resolution of DetectorThe ADC circuit, combined with back-up circuit, has typical resolution of better than 100 nV/√Hz.This resolution amounts to 14.3 ppm/√Hz in the voltage resolution with respect to the total outputEMF of 7 mV, or 7.2 ppm/√Hz in the resolution for the FRDC-DC difference measurementconsidering the square characteristic of the EMF output. Hence, the resolution of the detectorusually dominates the over-all resolution of the measurement system. For normal measurementsequence (40 s for positive and 40 s for negative), contribution to the type-A uncertainty isestimated to be 7.2 x (√2 / √40) = 1.6 ppm for each sequence, or 1.6 / √10 = 0.5 ppm for the averageof 10 measurement sequence at 7mV.
Assuming that measurement sequence will be repeated 10 times for each test frequency point, theoverall type-A uncertainty for the average of the 10 measurements is estimated to be 0.7 ppm. Sincethe type-A uncertainty are strongly dependent on the measurement conditions, such as the stabilityof the ambient temperature or possible interference from external noise, actual type-A uncertaintymust be calculated from the standard deviation (spread) of the 10 measurement sequence.
4.3.2. Type-B Uncertainties
Sources of type-B uncertainty in the FRDC-DC difference measurement for a "test"-TC module(UUT) is as follows:
(1) Memory EffectWhen an analog switch change from ON state to OFF state, electric charges are trapped in the FETchannel. When the switch becomes ON state again, these charges are released and injected to theoutput current, resulting in the positive FRDC-DC difference proportional to switching frequency.

Preliminary Version 1.03b
- 47 -
In the case of FRDC modules of ET2001 ADS system, the source A/B switching scheme isemployed in order to suppress the effect. The results from the FRDC-DC difference measurementsdo not show such linear dependence with switching frequency, and hence the contribution of thisitem is estimated to be within the maximum-resolution of the measurement system, i.e., 0.3 ppm.The estimated standard (1s) uncertainty is 0.3/ √3 = 0.17 ppm, assuming uniform distribution.
(2) Interference Between the Sources To obtain the equal RMS power for FRDC and DC modes, it is essential that there is nointerference between the Source A and Source B. This requirement may be confirmed using the"isolation-test circuit" described in section 5.6.3. The contribution to the measurement uncertaintyshould be within the maximum-resolution of the measurement system, i.e., 0.3 ppm. The estimatedstandard (1σ) uncertainty is 0.3/ √3 = 0.17 ppm, assuming uniform distribution.
(3) Effect of off-time If the period of the OFF-state is not long enough, the switching transients do not converge duringthe off time, and there is a possibility of correlation between the waveform from the sources A andB. The effect can be checked experimentally by changing the off-time between 5µs to 200 µs. If nochange in the FRDC-DC difference is detected, the contribution to the measurement uncertainty isestimated to be within the maximum-resolution of the measurement system, i.e., 0.3 ppm. Theestimated standard (1σ) uncertainty is 0.3/ √3 = 0.17 ppm, assuming uniform distribution.
(4) Mismatching of rms powerAs in the case of AC-DC difference comparison measurement, mismatching of rms power betweenthe FRDC mode and the dc mode can cause thermal ripple, and contribute to the uncertainty due tothe nonlinear output characteristic of the TC under test. Hence, in the measurement program, all thefour sources (A±, B±) should be adjusted for equal outputs to within 100 ppm before eachmeasurement. If this precaution is taken, the contribution to the FRDC-DC difference should bemuch smaller than 0.1 ppm.
(5) Output resistance of the sourceSince the output impedance of the FRDC source is not zero, the value obtained in this conditiondeviates from that for pure voltage mode to that for pure current mode. The degree of the deviationis estimated by the ratio of output impedance of the source (0.1 Ω) to the minimum input resistanceof the TVC (100 Ω), and should be smaller than 0.1Ω 100Ω = 10−3. Since the absolute values ofFRDC-DC difference for normal TCs are smaller than 10 ppm, the deviation is estimated to bemuch smaller than 0.1 ppm.
(6) High-Frequency ComponentsSome types of RF coaxial cables use Cu coated Fe wires as the inner conductors. If these cables areused to connect the TVC with the FRDC source, it can cause FRDC-DC difference that increaseslinearly with switching frequency due to a skin-effect. This effect occurs at the voltage mode, andbecomes significant for TVCs with low input resistance (<100Ω). Other magnetic materials such as
Preliminary Version 1.03b
- 48 -
iron-clips should also be avoided. If these precautions are taken, the contribution from the skin-effect should be much smaller than 0.1 ppm.
(7) Curve fittingIn the case of SJTC with measurable thermoelectric transfer difference, frequency-independent
part of the AC-DC transfer difference of TVC is determined from a curve fitting of FRDC-DCdifference data to the theoretical formula. The uncertainty in the curve fitting is evaluated fromrelative deviation of the FRDC-DC difference data from the theoretical curve around 1kHz. Thisuncertainty component may be omitted for MJTCs with non-measurable thermoelectric transferdifference.
4.3.3. Uncertainties in Sensitivity Coefficient
The sources of uncertainty in the sensitivity coefficient measurement and its contribution to theFRDC-DC difference results are evaluated in the following paragraph.
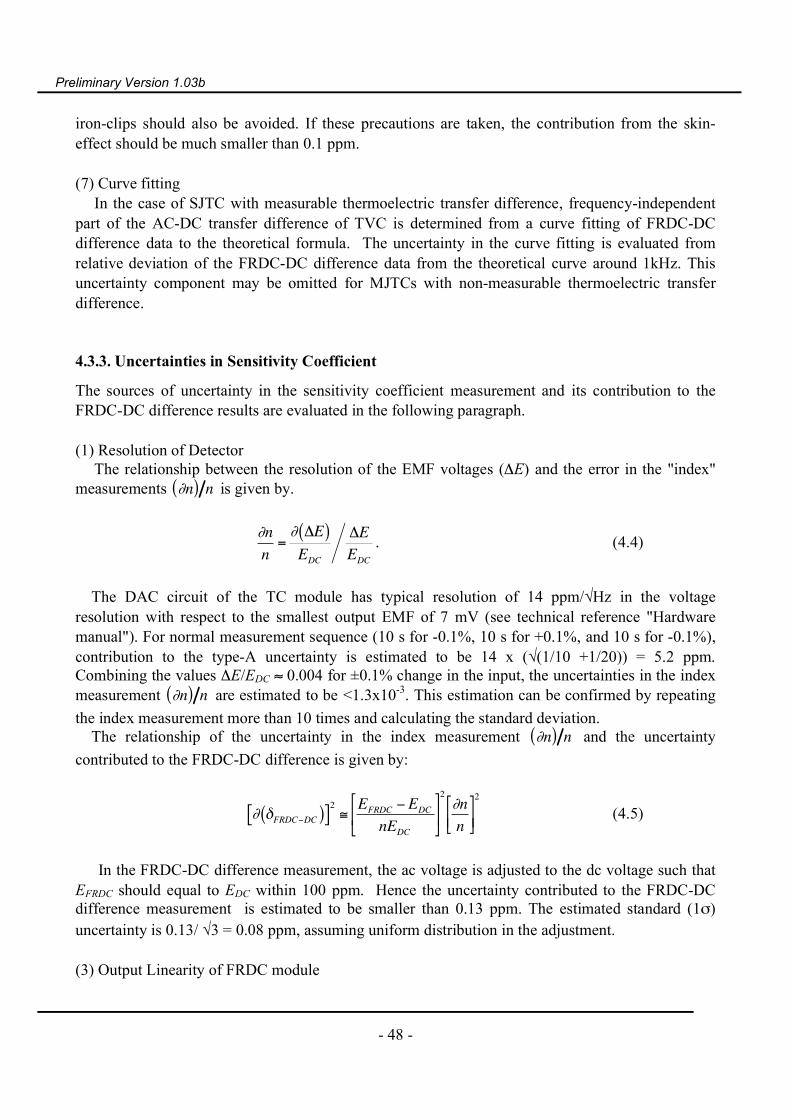
(1) Resolution of DetectorThe relationship between the resolution of the EMF voltages (ΔE) and the error in the "index"
measurements ∂n( ) n is given by.
€
∂nn
=∂ ΔE( )EDC
ΔEEDC
. (4.4)
The DAC circuit of the TC module has typical resolution of 14 ppm/√Hz in the voltageresolution with respect to the smallest output EMF of 7 mV (see technical reference "Hardwaremanual"). For normal measurement sequence (10 s for -0.1%, 10 s for +0.1%, and 10 s for -0.1%),contribution to the type-A uncertainty is estimated to be 14 x (√(1/10 +1/20)) = 5.2 ppm.Combining the values ΔE/EDC ≈ 0.004 for ±0.1% change in the input, the uncertainties in the indexmeasurement ∂n( ) n are estimated to be <1.3x10⁻³. This estimation can be confirmed by repeating
the index measurement more than 10 times and calculating the standard deviation.The relationship of the uncertainty in the index measurement ∂n( ) n and the uncertainty
contributed to the FRDC-DC difference is given by:
€
∂ δFRDC−DC( )[ ]2≅EFRDC −EDC
nEDC
2∂nn
2
(4.5)
In the FRDC-DC difference measurement, the ac voltage is adjusted to the dc voltage such thatEFRDC should equal to EDC within 100 ppm. Hence the uncertainty contributed to the FRDC-DCdifference measurement is estimated to be smaller than 0.13 ppm. The estimated standard (1σ)uncertainty is 0.13/ √3 = 0.08 ppm, assuming uniform distribution in the adjustment.
(3) Output Linearity of FRDC module
Preliminary Version 1.03b
- 49 -
Non-linearity in the voltage source can also be a source of error in the index-measurement.Using (4.5), the uncertainty contributed to the FRDC-DC difference is evaluated to be:
€
∂ δFRDC−DC( ) ≅δFRDC−DC∂ ΔV( )VDC
ΔVVDC
. (4.6)
In the case of an FRDC module of ET2001 ADS system, the linearity ∂(ΔV)/ΔV of the output ofFRDC for ±0.1% change should not exceed more than 1%. Hence, the uncertainty contributed tothe AC-DC difference is estimated to be smaller than 1 % of the measured value. Assuming thatthe FRDC-DC difference of the TC modules are <10 ppm, the uncertainty contributed to the AC-DC difference is estimated to be 0.1 ppm in the worst case. The estimated standard (1σ) uncertaintyis 0.1/ √3 = 0.06 ppm, assuming uniform distribution in the frequency characteristic.
(3) Input Linearity of TC/AMP moduleThe TC/AMP module of the ET2001ADS system uses CS5532 Σ-D A/D converter, which has
integral non-linearity better than 10 ppm. Following the same calculation as in the case of theresolution of detector (1), the contribution to the uncertainty is calculated as 0.13 x (10/5.2) = 0.25ppm. The estimated standard (1σ) uncertainty is 0.25/ √3 = 0.15 ppm, assuming uniformdistribution in the frequency characteristic.
Since the measurements of the sensitivity coefficients ("index") are performed only once foreach test frequency point (or once for all the test points), the uncertainty in the index-measurementmust be evaluated as a type-B component.
4.3.4. Combined Uncertainty
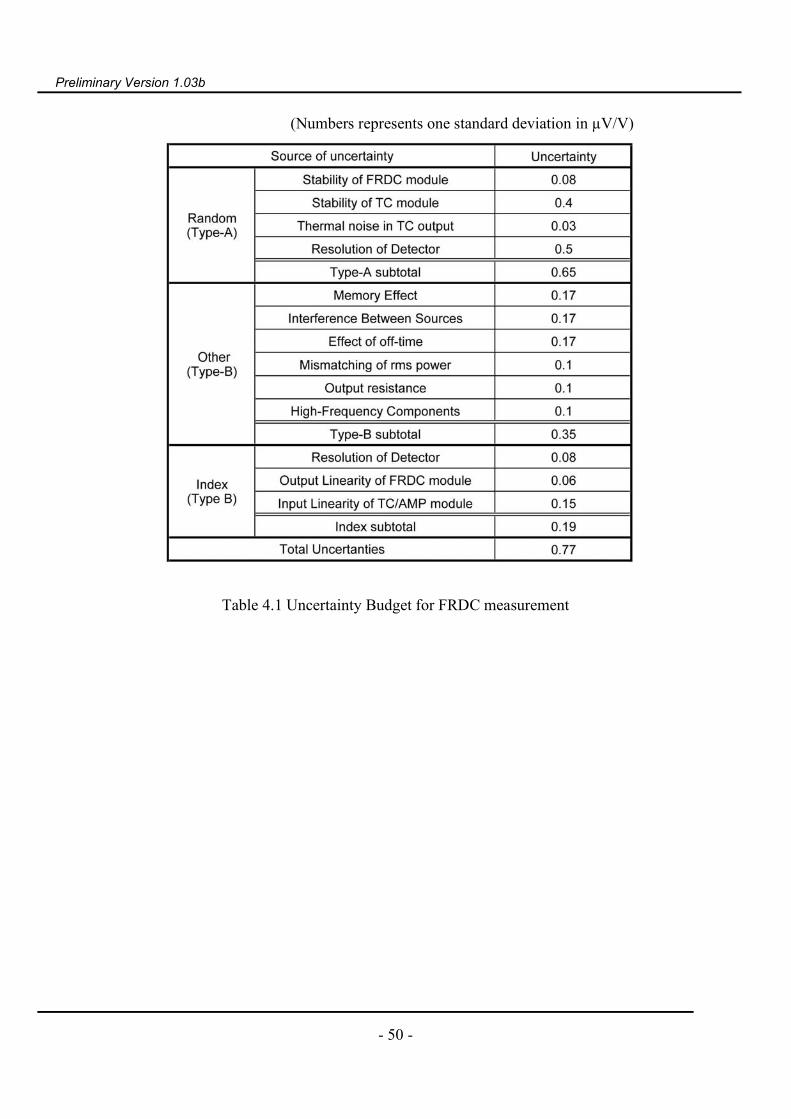
The sources of uncertainty in the FRDC-DC difference measurement, performed on a 500Ω-inputJSTC04 element at 2V to 5V, are summarized in Table 4.1. The combined uncertainty is evaluatedby taking root-sum-square of all the uncertainty components.
Preliminary Version 1.03b
- 50 -
(Numbers represents one standard deviation in µV/V)
Table 4.1 Uncertainty Budget for FRDC measurement
Preliminary Version 1.03b
- 51 -
5. AC-LF Measurement
5.1. Executing Measurement
5.1.1. Measurement Procedure
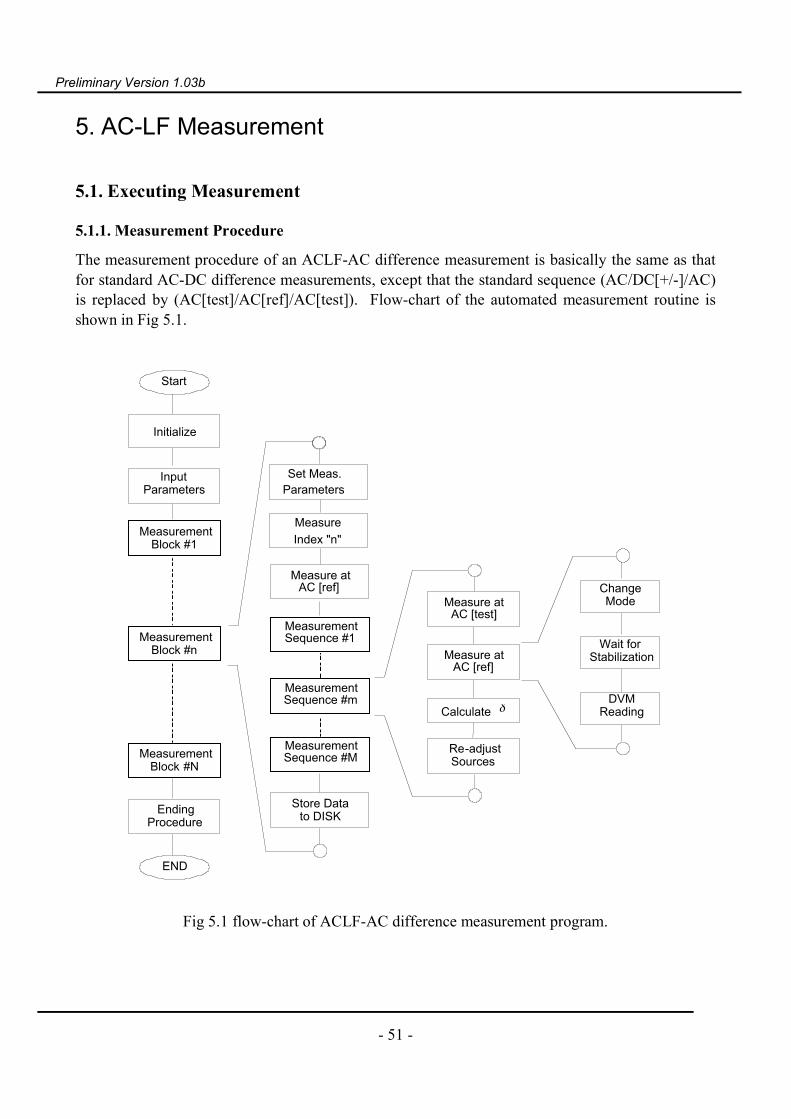
The measurement procedure of an ACLF-AC difference measurement is basically the same as thatfor standard AC-DC difference measurements, except that the standard sequence (AC/DC[+/-]/AC)is replaced by (AC[test]/AC[ref]/AC[test]). Flow-chart of the automated measurement routine isshown in Fig 5.1.
END
Ending Procedure
Initialize
Measure Index "n"
Calculate δ
Re-adjust Sources
Measurement Block #1
Measurement Block #n
Measurement Block #N
Set Meas. Parameters
Measurement Sequence #m
Measurement Sequence #M
Store Data to DISK
Change Mode
Wait for Stabilization
DVM Reading
Start
Measurement Sequence #1
Measure at AC [ref]
Measure at AC [ref]
Measure at AC [test]
Input Parameters
Fig 5.1 flow-chart of ACLF-AC difference measurement program.

Preliminary Version 1.03b
- 52 -
After registering all the parameter or options, as described in chapter 3, the program will go tostand-by mode, ready for a fully automated ACLF-AC difference measurement. When "GO" buttonis pressed, the program will apply voltage to the TC module and wait for a specified period of time(normally 10 minutes) to avoid the effects from initial warm-up drift. Then the program repeats thefollowing procedure (1) to (4) at each test points (Measurement Loops).
(1) Measurement of sensitivity indexThe control program measures the normalized sensitivity index n of TC at each test point. Thenormalized sensitivity indexes are measured by changing the input voltage by dV (normally 0.1%).Influence of drift on the output voltage is removed by a measurement sequence [(V-dV) / (V+dV) /(V-dV)].NOTE ----- After repeating the index-measurement 10 times, the program proceeds to thenext stage with warning message that the drift is too large.
(2) Measurement sequence A measurement sequence, [AC[ref] / AC[test] / AC(ref)], is used to eliminate the influence oflinear drift in DSS module output and EMF output voltage. The sequence is repeated for a specifiednumber of times (normally ten times) for each measurement point, and the average value andstandard deviation are calculated from the set of ten measurements. After each mode-switching, thecontroller waits for a specified period (normally15 seconds) to avoid the output-transients, and thentakes the reading from ADC for a specified period (normally15 seconds).
(3) Determination of AC-AC difference The AC-AC differences δ between the reference frequency and the test frequencies are calculatedby using formula (2.11).
(4) Storing measurement data After measurement sequence, measurement conditions and measurement data of each test point arestored to the hard disk of the measurement controller. The recorded items are listed in the followingsub-section.
After measurements for all test points are executed, a summery of measurement data are stored tothe hard disk of the system controller. Then instruments are reset to the initial condition preparingfor the exit from the measurement program. In the case of standard measurement conditions, onemeasurement loop takes about half an hour. For a set of 12 standard test points from 4 Hz to 100Hz,repeated two times (total 24 points), whole measurement takes approximately 16 hours.
5.1.2. Data Format
The results from the ACLF-AC difference measurement are stored into the specified data-file usingthe same format as displayed in the [Data Recorded to File] window.
The data-file consists of the following records.(1) Title "Data from ACLF-AC difference measurement."

Preliminary Version 1.03b
- 53 -
(2) Revision Number of the control program(3) Main header common to all measurement-blocks, including:
(3-1) Comment of the measurement,(3-2) ID (serial) number of DSS module,(3-3) Name, ID (serial) number, and description of TC/AMP module,(3-4) Number of repetition for one measurement blocks,(3-7) Waiting time before the ADC integration, and for initial warm-up time.(3-8) Number of ADC sampling.
(4) Time constant of TC (measured).(5) Data for one set of measurements, consisting of:
(5-1) Measurement block number,(5-2) Date and Time of each measurement block,(5-3) Test Voltage for each block,(5-4) Test/Reference Frequency for each block,(5-5) Result of TC Index measurement,(5-6) Result of Source adjustments,(5-7) Results of one measurement-sequence, consisting of:
(5-7-1) Measurement-sequence number,(5-7-2) Time of each measurement-sequence,(5-7-3) Temperature inside TC/AMP module,(5-7-4) EMF outputs for each mode ([Ref]/[Test]/[Ref]),(5-7-5) Average standard deviation of EMF outputs in ppm,(5-7-6) ACLF-AC difference for each sequence in ppm,
(5-8) Average ACLF-AC difference for each measurement-block(5-9) Standard deviation of ACLF-AC difference in ppm.
(6) Summary of the measurement.(7) Error/Warning message during the measurement.
5.2. Evaluation of Uncertainty
In this section, the uncertainty is estimated for the Low-Frequency AC-AC difference (ACLF)measurements. The sources of uncertainty are divided into two categories, namely, Type-A andType-B. The type-A uncertainties can be evaluated from actual measurement as the standarddeviation of the data, while the type-B uncertainties have to be estimated using different methodsdepending on the nature of the sources of uncertainty.
5.2.1. Type-A Uncertainties
The type-A uncertainty in the evaluation of low-frequency characteristics of a "test"-TC module(UUT) is composed of the following four components:
(1) Stability of DSS module output

Preliminary Version 1.03b
- 54 -
In the case of the measurement with the ET2001 ADS system, typical thermal drift and short-termstability (0.1Hz to 10Hz) of the output of the DSS module is specified to be <10 ppm/deg and <2ppm, respectively. Though linear drift in the output is compensated by the standard measurementsequence (AC[ref], AC[test], AC[ref]), and most of the non-linear fluctuation averages out for thenormal integration period of 10 s, it can still contribute to the type-A uncertainty. Since the changein the output of the DSS module causes the change in the EMF output of the TCs, the effect to thetype-A uncertainty will be included in the effect from the stability of TC module output discussedin the following paragraph.On the other hand, typical short-term stability (0.03Hz to 3Hz) of the output of the DSS module isspecified to be <10 ppm p-p. The equivalent low-frequency noise from the DSS circuit is calculatedas (10 / 5) / √3 = 1.2 ppm/√Hz. For normal measurement sequence (20 s for AC[MES] and 20 s forAC[REF]), contribution to the type-A uncertainty is estimated to be 1.2 x (√2 / √20) = 0.38 ppm foreach sequence, or 0.38 / √20 = 0.09 ppm for the average of standard 20 (10x2) measurementsequence.
(2) Stability of TC module outputAs in the case of the FRDC-DC difference, the ET2001 control software suspends measurementuntil proper drift-condition (<10 ppm/min) is established. In this case, second-order drift during oneset of measurement (1 min) should not exceed one-half of the linear drift. Hence, fluctuation in theoutput of TC module (including the fluctuation in the output of DSS module) should not affect themeasurement results by more than 5 x (1/2) =2.5 ppm for each sequence. The contribution toACLF-AC difference for the average of standard 20 (10x2) measurement sequence is estimated tobe 2.5 / (2*√20) = 0.28 ppm. (Please refer to section 4.3.2)
(3) Thermal noise in TC outputAs in the case of the FRDC-DC difference, the effect of thermal noise of the 400 ohm thermocoupleen is estimated to be 0.43 ppm/√Hz. For normal measurement sequence (20 s for AC[MES] and 20 sfor AC[REF]), contribution to the type-A uncertainty is estimated to be 0.43 x (√2 / √20) = 0.14ppm for each sequence, or 0.14 / √20 = 0.03 ppm for the average of standard 20 (10x2)measurement sequence.(Please refer to section 4.3.2)
(4) Resolution of DetectorAs discussed in section 4.3.2, the effect of The DAC circuit, combined with back-up circuit, hastypical resolution of better than 100 nV/√Hz. This resolution amounts to 25 ppm/√Hz in the voltageresolution with respect to the total output EMF of 4 mV, or 12.5 ppm/√Hz in the resolution for theACLF measurement considering the square characteristic of the EMF output. For normalmeasurement sequence(20 s for AC[MES] and 20 s for AC[REF]), contribution to the type-Auncertainty is estimated to be 12.5 x (√2 / √20) = 3.9 ppm for each sequence, or 3.9 / √20 = 0.87ppm for the average of standard 20 (10x2) measurement sequence.
(5) Effect of thermal rippleWhen test frequency is below 100 Hz, and the integration time is not the exact multiple of theinverse of the test frequency, thermal ripple in the output of the thermal converter may not be

Preliminary Version 1.03b
- 55 -
averaged out and can contribute to the fluctuation in the ACLF measurement. In the case ofstandard TC elements for ET2001 ADS system, JSTC04 and JSTC05, which have relatively largethermal time constant of 2.8s and 6s respectively, no increase in the standard deviation is observed.
The total type-A uncertainty for each measurement sequence is estimated to be 1.28 ppm, takingthe RSS of the contribution from each source of uncertainty. Since the type-A uncertainty arestrongly dependent on the measurement conditions, such as the stability of the ambient temperatureor possible interference from external noise, actual type-A uncertainty must be calculated from thestandard deviation (spread) of the 10 measurement sequence. The calculated standard deviationmust be confirmed to be within the estimated value for the worst situation.
5.2.2. Type-B Uncertainties
Sources of type-B uncertainty in the evaluation of low-frequency characteristic of a "test"-TCmodule (UUT) using a DSS module as the reference standard is as follows:
(1) DC offset in AC-output modeThe dc-offset voltage in the ac-mode causes a first-order thermoelectric effect in the EMF output.The DSS module has the capability of adjusting the DC offset with resolution of 0.02%. In the caseof a TC elements that have reversal error of <100 ppm, the dc-offset of 0.02% may cause asystematic error of 0.02 ppm in the AC-DC difference measurement.
(2) Effect of Dead-timeIn the case of ET2001 system, the input voltages are switched by high-speed analog switches, andthe off-time is smaller than 1 _s. The effect of the off-time to the AC-DC difference measurement isexpected to be smaller than 0.01 ppm, and will not be included in the uncertainty budgets.
(3) High-frequency spurious noiseThe synthesized sinusoidal waveform contains high-frequency spurious noise, mainly fromquantization noise of 10-bit D/A converter and clock feed-through at the sampling frequency. Thesampling frequency is 512 or 1024 times the basic (test) frequency and <1 MHz in the case ofACLF-LF difference measurement. Since the frequency characteristic at 1Mz is smaller than 100ppm and total power of the spurious noise is specified to be smaller than 1 ppm (-60dB),contribution to uncertainty in the ACLF-AC difference measurement is estimated to be smaller than0.01 ppm in the worst case.
5.2.3. Uncertainties in Sensitivity Coefficient
The sources of uncertainty in the sensitivity coefficient measurement and its contribution to the AC-LF measurement results are evaluated in the following paragraph. Since the index measurement isperformed at DC output mode, the procedure for the evaluation of uncertainty is almost exactly thesame as in the case of the FRDC-DC difference measurement.
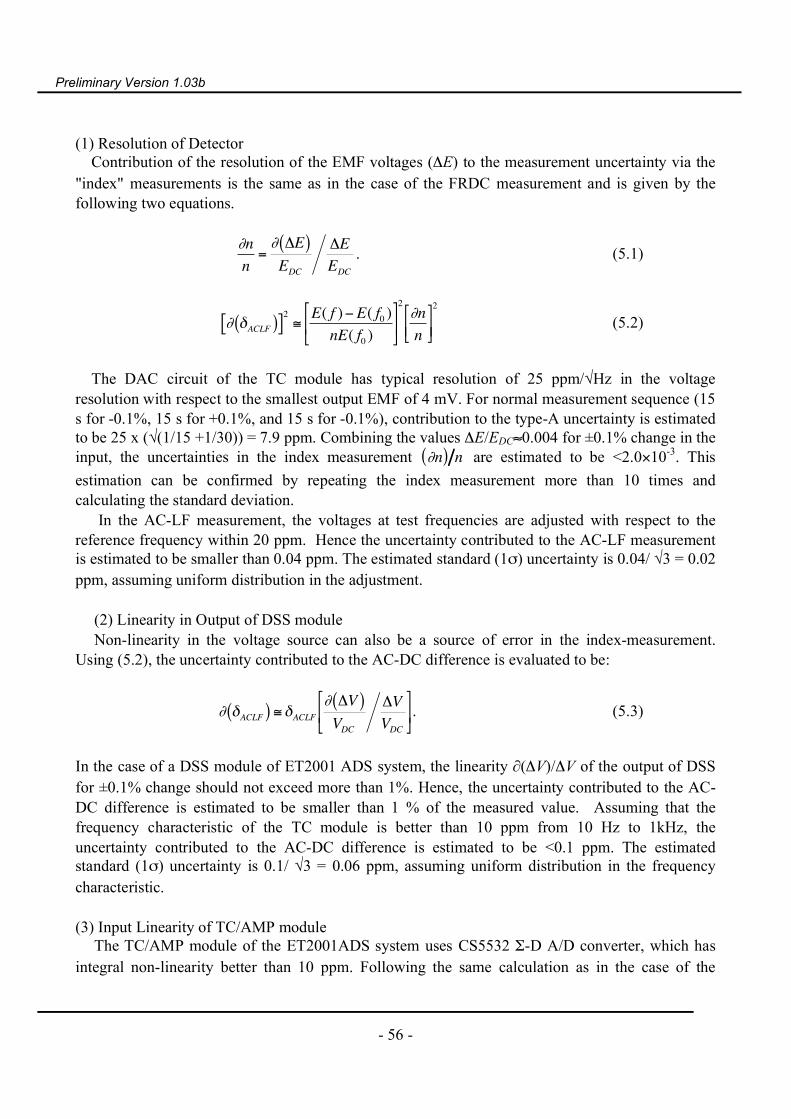
Preliminary Version 1.03b
- 56 -
(1) Resolution of DetectorContribution of the resolution of the EMF voltages (ΔE) to the measurement uncertainty via the
"index" measurements is the same as in the case of the FRDC measurement and is given by thefollowing two equations.
€
∂nn
=∂ ΔE( )EDC
ΔEEDC
. (5.1)
€
∂ δACLF( )[ ]2≅E( f )−E( f0 )nE( f0 )
2∂nn
2
(5.2)
The DAC circuit of the TC module has typical resolution of 25 ppm/√Hz in the voltageresolution with respect to the smallest output EMF of 4 mV. For normal measurement sequence (15s for -0.1%, 15 s for +0.1%, and 15 s for -0.1%), contribution to the type-A uncertainty is estimatedto be 25 x (√(1/15 +1/30)) = 7.9 ppm. Combining the values ΔE/EDC≈0.004 for ±0.1% change in theinput, the uncertainties in the index measurement ∂n( ) n are estimated to be <2.0×10⁻³. This
estimation can be confirmed by repeating the index measurement more than 10 times andcalculating the standard deviation.
In the AC-LF measurement, the voltages at test frequencies are adjusted with respect to thereference frequency within 20 ppm. Hence the uncertainty contributed to the AC-LF measurementis estimated to be smaller than 0.04 ppm. The estimated standard (1σ) uncertainty is 0.04/ √3 = 0.02ppm, assuming uniform distribution in the adjustment.
(2) Linearity in Output of DSS moduleNon-linearity in the voltage source can also be a source of error in the index-measurement.
Using (5.2), the uncertainty contributed to the AC-DC difference is evaluated to be:
€
∂ δACLF( ) ≅δACLF∂ ΔV( )VDC
ΔVVDC
. (5.3)
In the case of a DSS module of ET2001 ADS system, the linearity ∂(ΔV)/ΔV of the output of DSSfor ±0.1% change should not exceed more than 1%. Hence, the uncertainty contributed to the AC-DC difference is estimated to be smaller than 1 % of the measured value. Assuming that thefrequency characteristic of the TC module is better than 10 ppm from 10 Hz to 1kHz, theuncertainty contributed to the AC-DC difference is estimated to be <0.1 ppm. The estimatedstandard (1σ) uncertainty is 0.1/ √3 = 0.06 ppm, assuming uniform distribution in the frequencycharacteristic.
(3) Input Linearity of TC/AMP moduleThe TC/AMP module of the ET2001ADS system uses CS5532 Σ-D A/D converter, which has
integral non-linearity better than 10 ppm. Following the same calculation as in the case of the
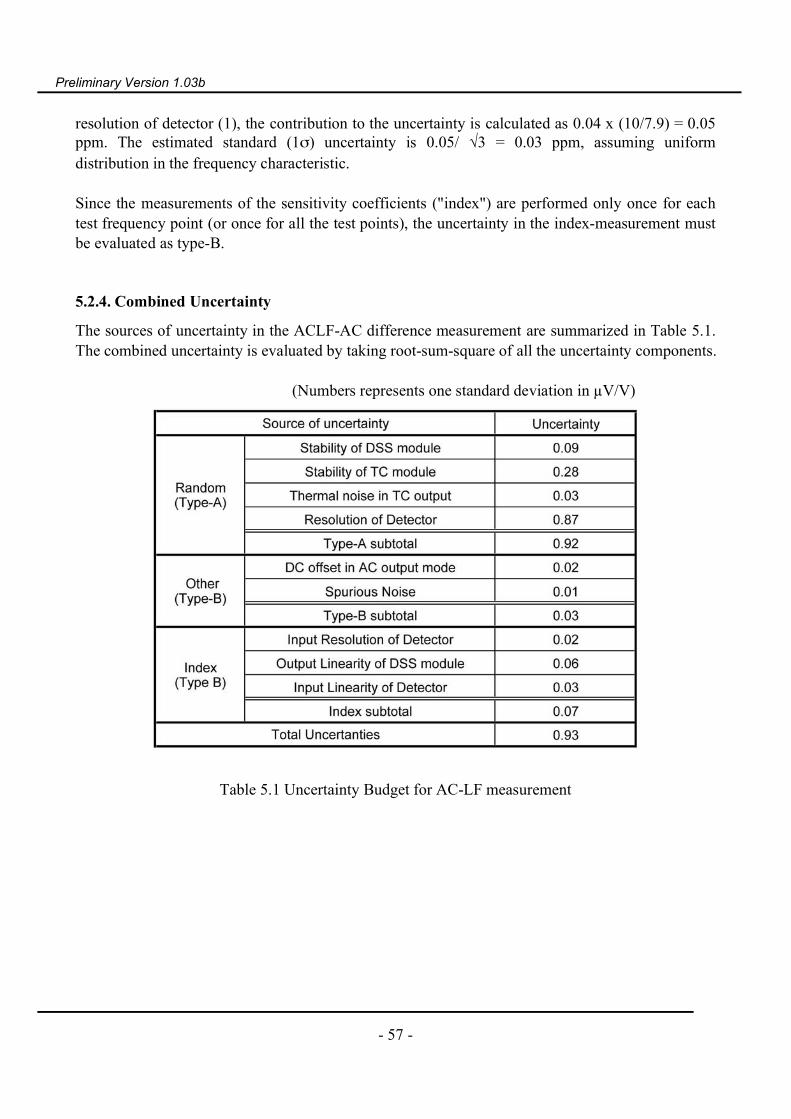
Preliminary Version 1.03b
- 57 -
resolution of detector (1), the contribution to the uncertainty is calculated as 0.04 x (10/7.9) = 0.05ppm. The estimated standard (1σ) uncertainty is 0.05/ √3 = 0.03 ppm, assuming uniformdistribution in the frequency characteristic.
Since the measurements of the sensitivity coefficients ("index") are performed only once for eachtest frequency point (or once for all the test points), the uncertainty in the index-measurement mustbe evaluated as type-B.
5.2.4. Combined Uncertainty
The sources of uncertainty in the ACLF-AC difference measurement are summarized in Table 5.1.The combined uncertainty is evaluated by taking root-sum-square of all the uncertainty components.
(Numbers represents one standard deviation in µV/V)
Table 5.1 Uncertainty Budget for AC-LF measurement
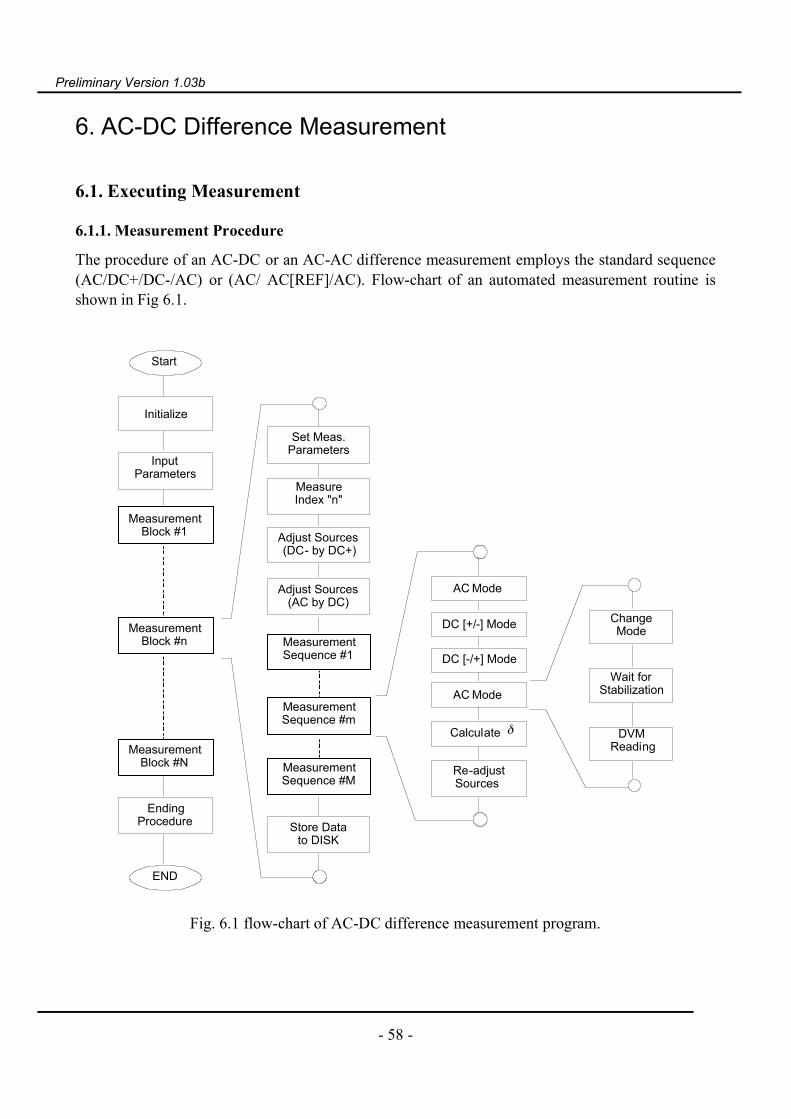
Preliminary Version 1.03b
- 58 -
6. AC-DC Difference Measurement
6.1. Executing Measurement
6.1.1. Measurement Procedure
The procedure of an AC-DC or an AC-AC difference measurement employs the standard sequence(AC/DC+/DC-/AC) or (AC/ AC[REF]/AC). Flow-chart of an automated measurement routine isshown in Fig 6.1.
END
AC Mode
DC [+/-] Mode
DC [-/+] Mode
AC Mode
Ending Procedure
Initialize
Measure Index "n"
Adjust Sources (DC- by DC+)
Calculate δ
Re-adjust Sources
Input Parameters
Measurement Block #1
Measurement Block #n
Measurement Block #N
Set Meas. Parameters
Measurement Sequence #m
Measurement Sequence #M
Store Data to DISK
Change Mode
Wait for Stabilization
DVM Reading
Start
Measurement Sequence #1
Adjust Sources (AC by DC)
Fig. 6.1 flow-chart of AC-DC difference measurement program.
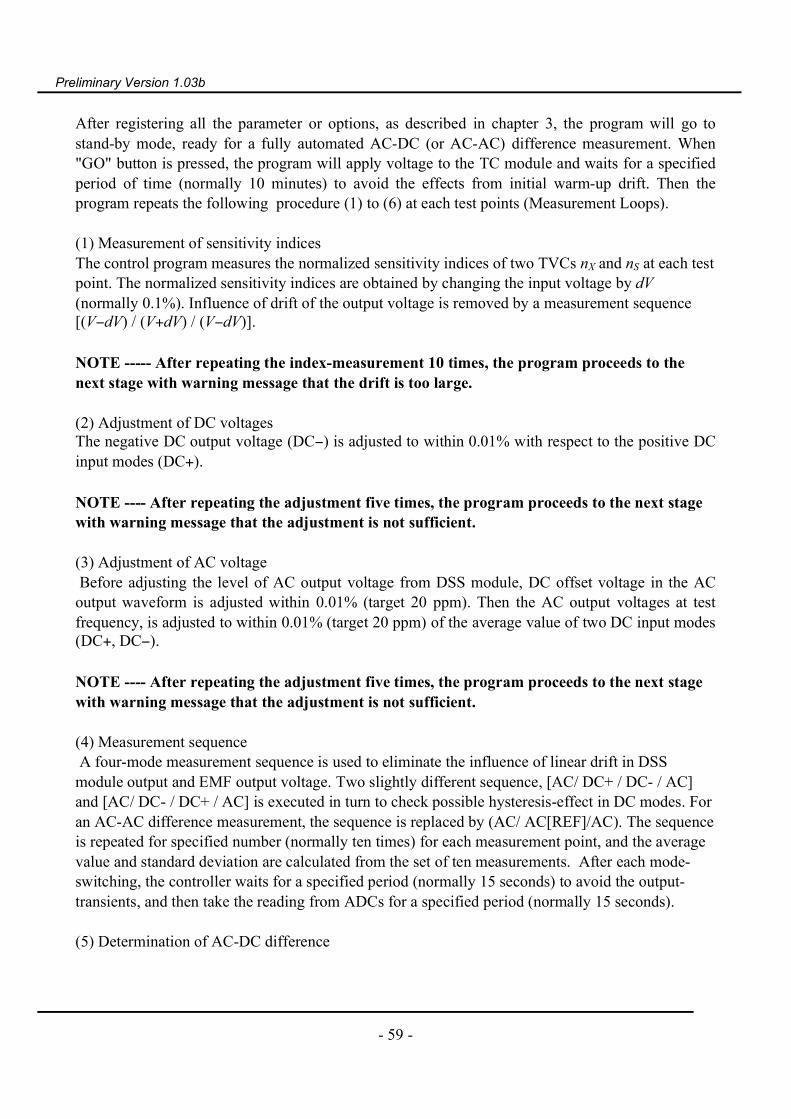
Preliminary Version 1.03b
- 59 -
After registering all the parameter or options, as described in chapter 3, the program will go tostand-by mode, ready for a fully automated AC-DC (or AC-AC) difference measurement. When"GO" button is pressed, the program will apply voltage to the TC module and waits for a specifiedperiod of time (normally 10 minutes) to avoid the effects from initial warm-up drift. Then theprogram repeats the following procedure (1) to (6) at each test points (Measurement Loops).
(1) Measurement of sensitivity indicesThe control program measures the normalized sensitivity indices of two TVCs nX and nS at each testpoint. The normalized sensitivity indices are obtained by changing the input voltage by dV(normally 0.1%). Influence of drift of the output voltage is removed by a measurement sequence[(V−dV) / (V+dV) / (V−dV)].
NOTE ----- After repeating the index-measurement 10 times, the program proceeds to thenext stage with warning message that the drift is too large.
(2) Adjustment of DC voltagesThe negative DC output voltage (DC−) is adjusted to within 0.01% with respect to the positive DCinput modes (DC+).
NOTE ---- After repeating the adjustment five times, the program proceeds to the next stagewith warning message that the adjustment is not sufficient. (3) Adjustment of AC voltage Before adjusting the level of AC output voltage from DSS module, DC offset voltage in the ACoutput waveform is adjusted within 0.01% (target 20 ppm). Then the AC output voltages at testfrequency, is adjusted to within 0.01% (target 20 ppm) of the average value of two DC input modes(DC+, DC−).
NOTE ---- After repeating the adjustment five times, the program proceeds to the next stagewith warning message that the adjustment is not sufficient.
(4) Measurement sequence A four-mode measurement sequence is used to eliminate the influence of linear drift in DSSmodule output and EMF output voltage. Two slightly different sequence, [AC/ DC+ / DC- / AC]and [AC/ DC- / DC+ / AC] is executed in turn to check possible hysteresis-effect in DC modes. Foran AC-AC difference measurement, the sequence is replaced by (AC/ AC[REF]/AC). The sequenceis repeated for specified number (normally ten times) for each measurement point, and the averagevalue and standard deviation are calculated from the set of ten measurements. After each mode-switching, the controller waits for a specified period (normally 15 seconds) to avoid the output-transients, and then take the reading from ADCs for a specified period (normally 15 seconds).
(5) Determination of AC-DC difference

Preliminary Version 1.03b
- 60 -
The difference in the AC-DC differences (δx−δs) between the two TVCs, TVC-X and TVC-S, arecalculated by using formula (2.14).
(6) Storing measurement data After measurement sequence, measurement conditions and measurement data of each test point arestored to hard disk of measurement controller. The recorded items are listed in the following sub-section.
After measurements for all test points are executed, summery of measurement data are stored to thehard disk of the system controller. Then instruments are reset to initial condition preparing for theexit from the measurement program. In the case of standard measurement condition, onemeasurement loop takes about one hour. For a set of 17 standard test points from 10 Hz to 1MHzrepeated twice (total 34 points), whole measurement takes approximately 20 hours.
6.1.2. Data Format
The results from the AC-DC (AC-AC) difference measurement are stored into the specified data-file using the same format as displayed in the [Data Recorded to File] window.
The data-file consists of the following records.(1) Title "Data from AC-DC (AC-AC) difference measurement."(2) Revision Number of the control program(3) Main header common to all measurement-blocks, including:
(3-1) Comment of the measurement,(3-2) ID (serial) number of DSS module,(3-3) Name, ID (serial) number, and description of TC/AMP modules,(3-4) Number of repetition for one measurement blocks,(3-7) Waiting time before the ADC integration, and for initial warm-up time.(3-8) Number of ADC sampling.
(4) Time constant of TC (measured).(5) Data for one set of measurements, consisting of:
(5-1) Measurement block number,(5-2) Date and Time of each measurement block,(5-3) Test Voltage for each block,(5-4) Test (& Reference) frequency for each block.(5-5) Results of TC Index measurement,(5-6) Results of Source adjustments,(5-7) Results of one measurement-sequence, consisting of:
(5-7-1) Measurement-sequence number,(5-7-2) Time of each measurement-sequence,(5-7-3) Temperature inside TC/AMP modules,(5-7-4) EMF outputs for each mode,(5-7-5) Average standard deviation of EMF outputs in ppm,
Preliminary Version 1.03b
- 61 -
(5-7-6) AC-DC (AC-AC) difference for each sequence in ppm,(5-8) Average AC-DC (AC-AC) difference for each measurement-block(5-9) Standard deviation of AC-DC (AC-AC) difference in ppm.
(6) Summary of the measurement.(7) Error/Warning message during the measurement.
6.2. Evaluation of Uncertainty
In this section, the uncertainty is estimated for the AC-DC difference measurement. The sourcesof uncertainty are divided into two categories, namely, Type-A and Type-B. The type-Auncertainties can be evaluated from actual measurement as the standard deviation of the data, whilethe type-B uncertainties have to be estimated using different methods depending on the nature ofthe sources of uncertainty.
6.2.1. Type-A Uncertainties
The Type-A uncertainty in the calibration of a "test"-TC module (UUT) against the reference TCmodule (REF) is composed of the following four components:
(1) Stability of the DSS module outputIn the case of the measurement with the ET2001 ADS system, typical thermal drift and short-termstability (0.1Hz to 10Hz) of the output of the DSS module is specified to be <10 ppm/deg and <2ppm, respectively. As in the case of an FRDC or an AC-LF measurement, linear drift in the outputis compensated by the standard measurement sequence [AC(mes), AC(ref), AC(ref), AC(mes)], andmost of the non-linear fluctuation averages out for the normal integration period of 10 s.Furthermore, in the case of an AC-DC difference measurement which includes two TC elements ofthe same type, fluctuations in output EMF voltages from the two TC elements tend to cancel eachother. Since the change in the output of the DSS module causes the change in the EMF output ofthe TCs, the effect to the type-A uncertainty will be included in the effect from the stability of TCmodule output discussed in the following paragraph.On the other hand, typical short-term stability (0.03Hz to 3Hz) of the output of the DSS module isspecified to be <10 ppm p-p. The equivalent low-frequency noise from the DSS circuit is calculatedas (10 / 5) / √3 = 1.2 ppm/√Hz. For normal measurement sequence (20 s for AC and 20 s for DC),contribution to the type-A uncertainty is estimated to be 1.2 x (√2 / √20) = 0.38 ppm for eachsequence, or 0.38 / √20 = 0.09 ppm for the average of standard 20 (10x2) measurement sequence.
(2) Stability of TC module outputAs in the case of the FRDC-DC difference or ACLF-AC difference measurement, the ET2001
control software suspends measurement until proper drift-condition (<10 ppm/min) is established.In this case, second-order drift during one set of measurement (1 min) should not exceed one-half ofthe linear drift. Hence, fluctuation in the output of TC module (including the fluctuation in theoutput of DSS module) should not affect the measurement results by more than 5 x (1/2) =2.5 ppmfor each sequence. The contribution to AC-DC or AC-AC difference for the average of standard 20
Preliminary Version 1.03b
- 62 -
(10x2) measurement sequence is estimated to be 2.5 / (2*√20) = 0.28 ppm. (Please refer to section4.3.2)
(3) Thermal noise in TC outputAs in the case of the FRDC measurement or ACLF measurement, the effect of thermal noise of the400 ohm thermocouple en is estimated to be 0.43 ppm/√Hz. For normal measurement sequence (20s for AC[MES] and 20 s for AC[REF]), contribution to the type-A uncertainty is estimated to be0.43 x (√2 / √20) = 0.14 ppm for each sequence, or 0.14 / √20 = 0.03 ppm for the average ofstandard 20 (10x2) measurement sequence.(Please refer to section 4.3.2)
(4) Resolution of DetectorAs discussed in section 4.3.2, the effect of The DAC circuit, combined with back-up circuit, has atypical resolution of better than 100 nV/√Hz. This resolution amounts to 25 ppm/√Hz in the voltageresolution with respect to the total output EMF of 4 mV, or 12.5 ppm/√Hz in the resolution for theACLF measurement considering the square characteristic of the EMF output. For a normalmeasurement sequence (20 s for AC and 20 s for DC), contribution to the type-A uncertainty isestimated to be 12.5 x (√2 / √20) = 3.9 ppm for each sequence, or 3.9 / √20 = 0.87 ppm for theaverage of standard 20 (10x2) measurement sequence.
(5) Effect of thermal rippleWhen test frequency is below 100 Hz, and the integration time is not the exact multiple of theinverse of the test frequency, thermal ripple in the output of the thermal converter may not beaveraged out and can contribute to the fluctuation in the AC-DC difference measurement. In thecase of standard TC elements for ET2001 ADS system, JSTC04 and JSTC05, which have relativelylarge thermal time constants of 2.8s and 6s respectively, no increase in the standard deviation isobserved.
The total type-A uncertainty for each measurement sequence is estimated to be 7.x ppm, takingthe RSS of the contribution from each source of uncertainty. Since the type-A uncertainty arestrongly dependent on the measurement conditions, such as the stability of the ambient temperatureor possible interference from external noise, actual type-A uncertainty must be calculated from thestandard deviation (spread) of the 10 measurement sequence. The calculated standard deviationmust be confirmed to be within the estimated value for the worst situation.
6.2.2. Type-B Uncertainties
Sources of type-B uncertainty in the calibration of a "test"-TC module (UUT) against the referenceTC module (REF) is as follows:
(1) DC offset in AC-output modeThe dc-offset voltage in the ac-mode causes a first-order thermoelectric effect in the EMF output.The DSS module has the capability of adjusting the DC offset with resolution of 0.02%. In the case

Preliminary Version 1.03b
- 63 -
of TC elements that have reversal error of <100 ppm, the dc-offset of 0.02% may cause asystematic error of 0.02 ppm in the AC-DC difference measurement.
(2) Frequency Characteristic of the circuitAt higher frequencies (>100 kHz), non-negligible effect may be contributed from parasiticimpedance of the input cable. The effect is strongly dependent on the system configuration, and itis very important to evaluate the effect experimentally by changing the length of the input cable orby changing the earth-guard configuration. In the case of the ET2001 ADS system, this effect is notobserved, or at least within the resolution (0.9 ppm) of the system. The estimated standard (1σ)uncertainty is 0.9/ √3 = 0.5 ppm, assuming uniform distribution.
(3) Effect of Dead-timeIn the case of ET2001 system, the input voltages are switched by high-speed analog switches, andthe off-time is smaller than 1 _s. The effect of the off-time to the AC-DC difference measurement isexpected to be smaller than 0.01 ppm, and will not be included in the uncertainty budgets.
(4) Harmonic distortion in AC outputDistortion of the sinusoidal waveform produces in higher order frequency components. Combinedwith the frequency characteristic of the input circuit, the higher-order components may cause errorin rms power in the input voltage. Contribution to the measurement uncertainty is estimated bymultiplying the specified total harmonic distortion (up to 10th order) with possible frequencycharacteristic in the input circuit (<10-4 @1MHz, <10-2 @10MHz) as 0.01 ppm for ≤100kHz, and1.0 ppm for >100kHz to 1MHz.
(5) High-frequency spurious noiseThe synthesized sinusoidal waveform contains high-frequency spurious noise, mainly fromquantization noise of 10-bit D/A converter and clock feed-through at the sampling frequency. Thesampling frequency is fixed at 32 MHz in the case of normal an AC-DC or an AC-AC differencemeasurement, and total power is smaller than 1 ppm (-60dB). Hence, the contribution to uncertaintyin the AC-DC or an AC-AC difference measurement is estimated to be smaller than 1 ppm in theworst case.
6.2.3. Uncertainties in Sensitivity Coefficient
The sources of uncertainty in the sensitivity coefficient measurement and its contribution to the AC-DC difference results are discussed in the following paragraphs.
(1) Resolution of DetectorThe relationship between the resolution of the EMF voltages (ΔX, ΔS) and the error in the
"index" measurements is given by.
∂nXnX
=∂ ΔX( )XDC
ΔXXDC
,
Preliminary Version 1.03b
- 64 -
∂nSnS
=∂ ΔS( )SDC
ΔSSDC
. (6.1)
The DAC circuit of the TC module has typical resolution of 25 ppm/√Hz in the voltageresolution with respect to the smallest output EMF of 4 mV. For a normal measurement sequence(15s for -0.1%, 15 s for +0.1%, and 15 s for -0.1%), contribution to the type-A uncertainty isestimated to be 25 x (√(1/15 +1/30)) = 7.9 ppm. Combining the values ΔX/XDC ≈ ΔS/SDC ≈ 0.004for ±0.1% change in the input, the uncertainties in the index measurement ∂n( ) n are estimated tobe <2.0×10⁻³. This estimation can be confirmed by repeating the index measurement more than 10times and calculating the standard deviation.
The relationship of the uncertainty in the index measurement ∂n( ) n and the uncertainty
contributed to the AC-DC difference comparison ∂ δ X − δS( ) is given by:
∂ δX − δ S( )[ ]2≅
SAC − SDCnSSDC
2∂nSnS
2
+XAC − XDCnXXDC
2∂nXnX
2
(6.2)
In the AC-DC difference comparison measurement, the ac voltage is adjusted to the dc voltagesuch that XAC should equal to XDC within 100 ppm. Hence the uncertainty contributed to the AC-DC difference comparison measurement is estimated to be smaller than 0.28 ppm. The estimatedstandard (1σ) uncertainty is 0.28/ √3 = 0.16 ppm, assuming uniform distribution in the adjustment.
(2) Linearity in Output of DSS moduleNon-linearity in the voltage source can also be a source of error in the index-measurement.
Using (3.3), the uncertainty contributed to the AC-DC difference is evaluated to be:
∂ δ X − δS( ) ≅ δX −δ S( ) ∂ ΔV( )VDC
ΔVVDC
. (6.3)
In the case of a DSS module of ET2001 ADS system, the linearity ∂(ΔV)/ΔV of the output of DSSfor ±0.1% change should not exceed more than 1%. Hence, the uncertainty contributed to the AC-DC difference is estimated to be smaller than 1 % of the measured value. Assuming that thefrequency characteristic of the TC modules is better than 100 ppm from 10 Hz to 1kHz, theuncertainty contributed to the AC-DC difference is estimated to be <1.0 ppm. The estimatedstandard (1σ) uncertainty is 1.0/ √3 = 0.6 ppm, assuming uniform distribution in the frequencycharacteristic.
(3) Input Linearity of TC/AMP moduleThe TC/AMP module of the ET2001ADS system uses CS5532 Σ-D A/D converter, which hasintegral non-linearity better than 10 ppm. Following the same calculation as in the case of theresolution of detector (1), the contribution to the uncertainty is calculated as 0.28 x (10/7.9) = 0.36ppm. The estimated standard (1σ) uncertainty is 0.36/ √3 = 0.21 ppm, assuming uniformdistribution in the frequency characteristic.
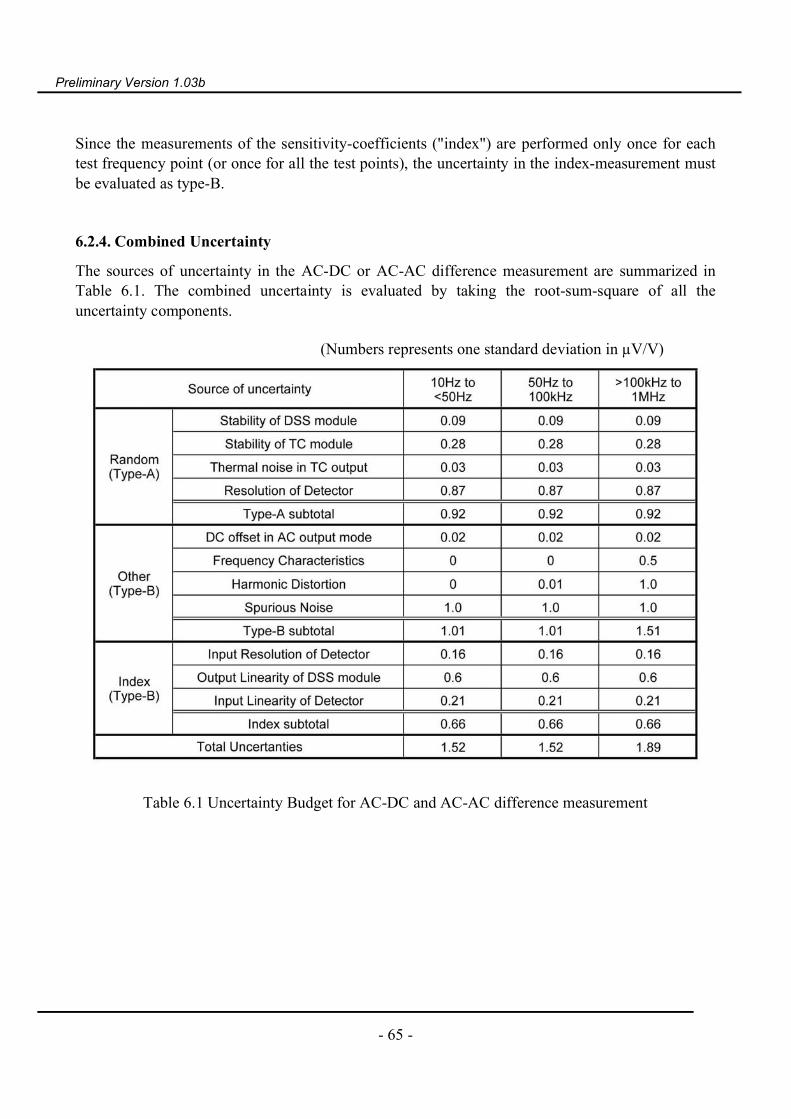
Preliminary Version 1.03b
- 65 -
Since the measurements of the sensitivity-coefficients ("index") are performed only once for eachtest frequency point (or once for all the test points), the uncertainty in the index-measurement mustbe evaluated as type-B.
6.2.4. Combined Uncertainty
The sources of uncertainty in the AC-DC or AC-AC difference measurement are summarized inTable 6.1. The combined uncertainty is evaluated by taking the root-sum-square of all theuncertainty components.
(Numbers represents one standard deviation in µV/V)
Table 6.1 Uncertainty Budget for AC-DC and AC-AC difference measurement
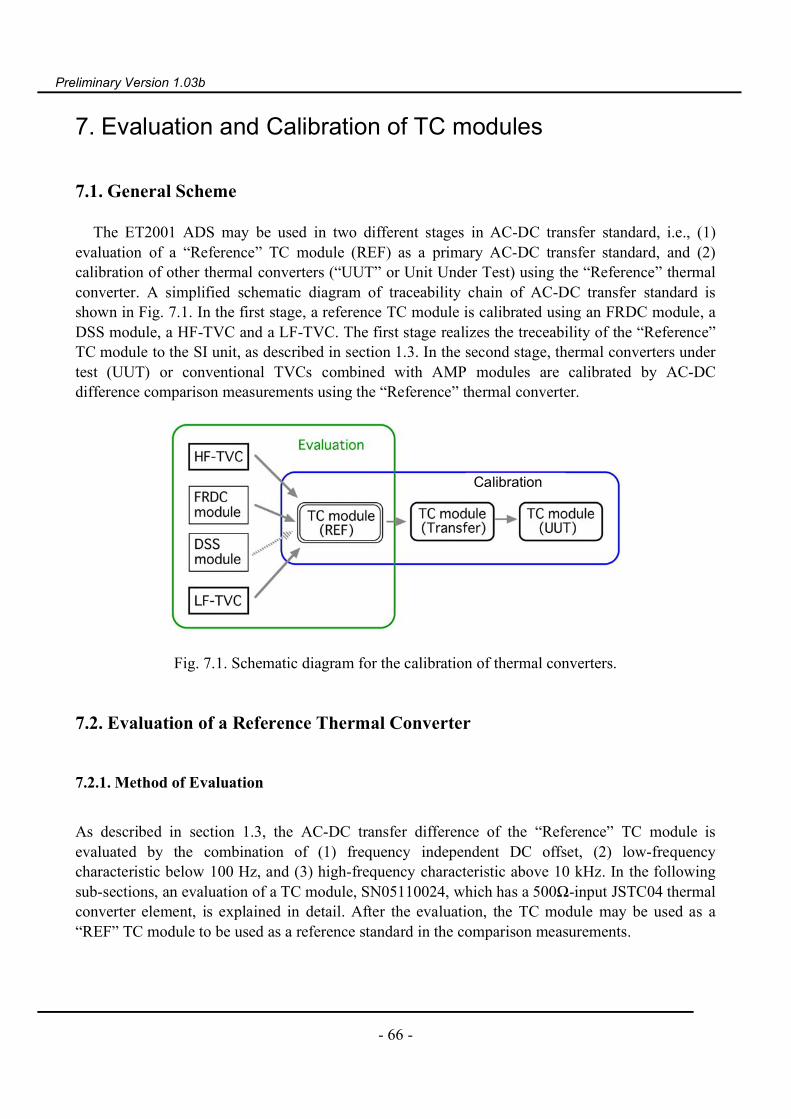
Preliminary Version 1.03b
- 66 -
7. Evaluation and Calibration of TC modules
7.1. General Scheme
The ET2001 ADS may be used in two different stages in AC-DC transfer standard, i.e., (1)evaluation of a “Reference” TC module (REF) as a primary AC-DC transfer standard, and (2)calibration of other thermal converters (“UUT” or Unit Under Test) using the “Reference” thermalconverter. A simplified schematic diagram of traceability chain of AC-DC transfer standard isshown in Fig. 7.1. In the first stage, a reference TC module is calibrated using an FRDC module, aDSS module, a HF-TVC and a LF-TVC. The first stage realizes the treceability of the “Reference”TC module to the SI unit, as described in section 1.3. In the second stage, thermal converters undertest (UUT) or conventional TVCs combined with AMP modules are calibrated by AC-DCdifference comparison measurements using the “Reference” thermal converter.
Fig. 7.1. Schematic diagram for the calibration of thermal converters.
7.2. Evaluation of a Reference Thermal Converter
7.2.1. Method of Evaluation
As described in section 1.3, the AC-DC transfer difference of the “Reference” TC module isevaluated by the combination of (1) frequency independent DC offset, (2) low-frequencycharacteristic below 100 Hz, and (3) high-frequency characteristic above 10 kHz. In the followingsub-sections, an evaluation of a TC module, SN05110024, which has a 500Ω-input JSTC04 thermalconverter element, is explained in detail. After the evaluation, the TC module may be used as a“REF” TC module to be used as a reference standard in the comparison measurements.
Calibration
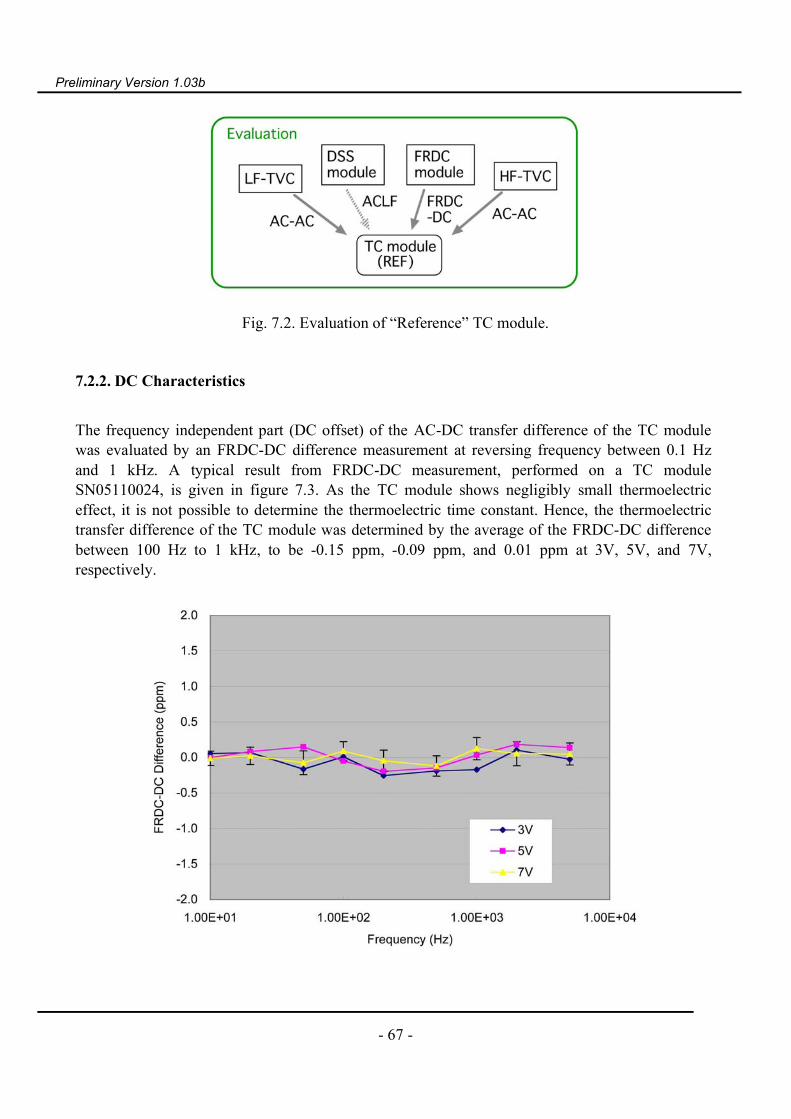
Preliminary Version 1.03b
- 67 -
Fig. 7.2. Evaluation of “Reference” TC module.
7.2.2. DC Characteristics
The frequency independent part (DC offset) of the AC-DC transfer difference of the TC modulewas evaluated by an FRDC-DC difference measurement at reversing frequency between 0.1 Hzand 1 kHz. A typical result from FRDC-DC measurement, performed on a TC moduleSN05110024, is given in figure 7.3. As the TC module shows negligibly small thermoelectriceffect, it is not possible to determine the thermoelectric time constant. Hence, the thermoelectrictransfer difference of the TC module was determined by the average of the FRDC-DC differencebetween 100 Hz to 1 kHz, to be -0.15 ppm, -0.09 ppm, and 0.01 ppm at 3V, 5V, and 7V,respectively.
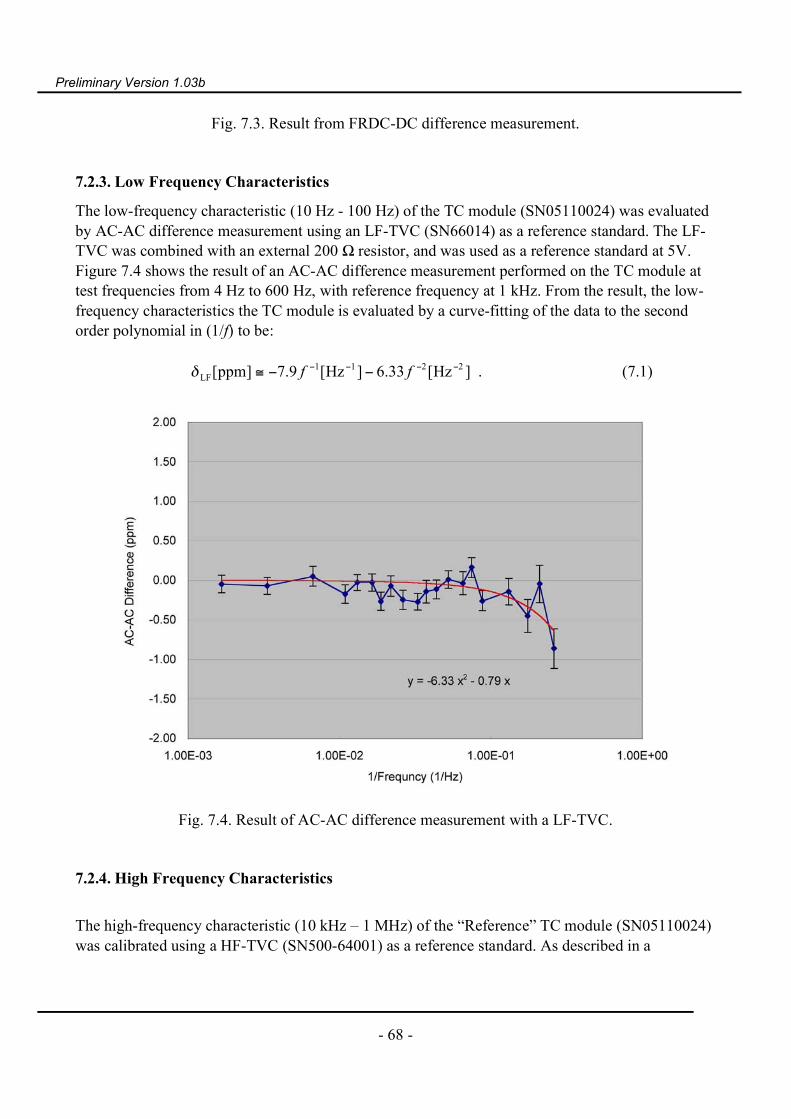
Preliminary Version 1.03b
- 68 -
Fig. 7.3. Result from FRDC-DC difference measurement.
7.2.3. Low Frequency Characteristics
The low-frequency characteristic (10 Hz - 100 Hz) of the TC module (SN05110024) was evaluatedby AC-AC difference measurement using an LF-TVC (SN66014) as a reference standard. The LF-TVC was combined with an external 200 Ω resistor, and was used as a reference standard at 5V.Figure 7.4 shows the result of an AC-AC difference measurement performed on the TC module attest frequencies from 4 Hz to 600 Hz, with reference frequency at 1 kHz. From the result, the low-frequency characteristics the TC module is evaluated by a curve-fitting of the data to the secondorder polynomial in (1/f) to be:
]Hz[33.6 ]Hz[9.7]ppm[ 2211LF
−−−− −−≅ ffδ . (7.1)
Fig. 7.4. Result of AC-AC difference measurement with a LF-TVC.
7.2.4. High Frequency Characteristics
The high-frequency characteristic (10 kHz – 1 MHz) of the “Reference” TC module (SN05110024)was calibrated using a HF-TVC (SN500-64001) as a reference standard. As described in a

Preliminary Version 1.03b
- 69 -
seaparate technical referece "TC manual", frequency characteristics of the 500-Ω input HF-TVCsare estimated to be:
( ) ]MHz[5.70.0]ppm[500 f±≅γ . (7.2)
Figure 7.5 shows the result from the AC-AC difference comparison measurement between the TCmodule and the HF-TVC with reference frequency at 1 kHz. From the result of the comparisonmeasurement, the high-frequency characteristics of the “Reference” TC module (SN05110024) isevaluated by a curve-fitting of the data to the second order polynomial to be:
]MHz[25.5 ]MHz[04.21]ppm[ 22HF ff −≅δ . (7.3)
Fig. 7.5. Result of AC-AC difference measurement with a HF-TVC.
7.2.5. Over-all Characteristic
The over-all frequency characteristic of the AC-DC difference of the TC module is determined bythe three measurements described in the preceding subsections, i.e., (1) DC offset by FRDC-DCdifference measurement, (2) LF characteristic by AC-AC difference measurement with LF-TVC,and (3) HF characteristic by AC-AC difference measurement with HF-TVC. In total, the AC-DCdifference of the “Reference” TC module (SN05110024) at 5V is characterized by the followingformula:

Preliminary Version 1.03b
- 70 -
€
δTotal[ppm]≅ − 0.09 − 7.9 f −1[Hz−1] − 6.33 f −2[Hz−2 ] + 21.04 f [MHz] − 5.25 f 2[MHz2 ]
. (7.4)
Fig. 7.6. Evaluated AC-DC difference of a “Reference” TC module (SN05110024).
7.2.6. Evaluation of Uncertainty
The sources of uncertainties in the evaluation of a “REF” TC module are summarized in Table 7.1.The combined uncertainty is evaluated by taking root-sum-square of the uncertainty contributionsfrom the three measurements, i.e., (1) FRDC-DC difference measurement, (2) AC-AC differencemeasurement with LF-TVC, and (3) AC-AC difference measurement with HF-TVC.The thermoelectric transfer difference determined by the FRDC-DC difference measurement is aDC quantity, and the uncertainty related to the measurement contributes to the AC-DC difference ofthe reference thermal converter at all the frequencies, i.e., 10 Hz to 1 MHz. The uncertainty relatedto the low-frequency characteristic of the reference thermal converter is contributed from (a) thefrequency characteristic of the LF-TVC, and (b) the AC-AC difference measurement with the LF-TVC. The uncertainty related to the high-frequency characteristic of the reference thermal converteris contributed from (a) the frequency characteristic of the HF-TVC, (b) effect from the “Built-in”TEE, and (c) the AC-AC difference measurement with the HF-TVC.
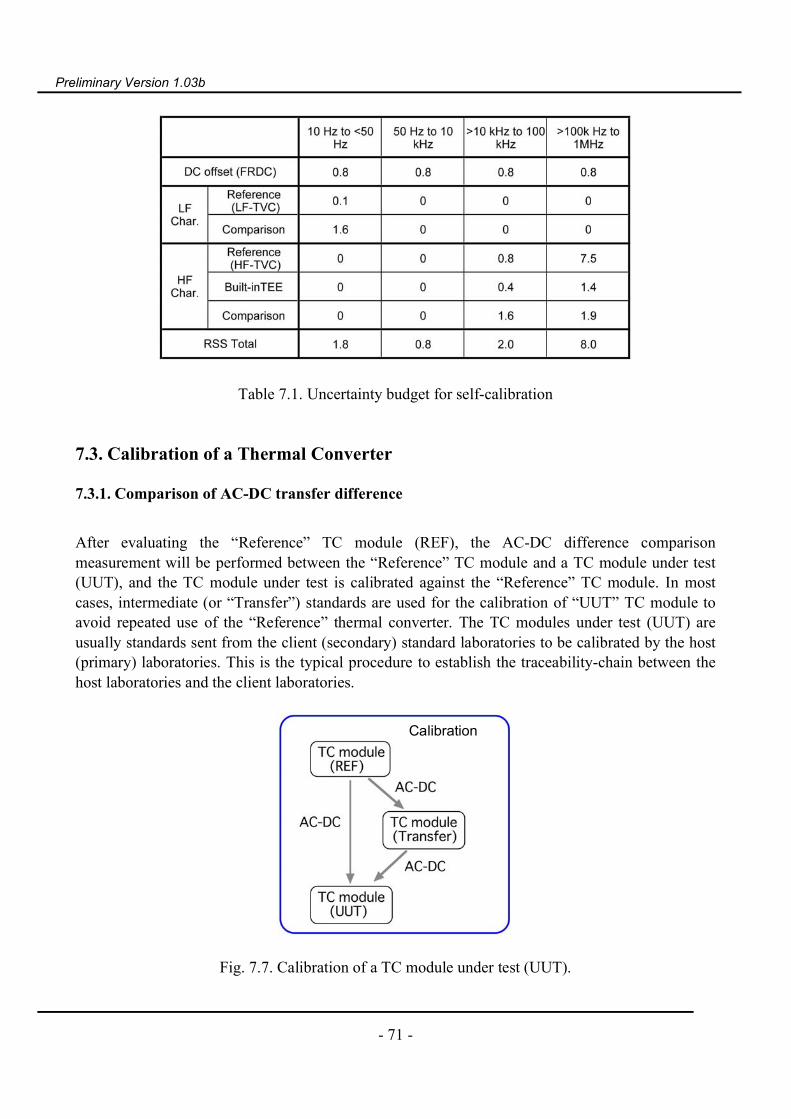
Preliminary Version 1.03b
- 71 -
Table 7.1. Uncertainty budget for self-calibration
7.3. Calibration of a Thermal Converter
7.3.1. Comparison of AC-DC transfer difference
After evaluating the “Reference” TC module (REF), the AC-DC difference comparisonmeasurement will be performed between the “Reference” TC module and a TC module under test(UUT), and the TC module under test is calibrated against the “Reference” TC module. In mostcases, intermediate (or “Transfer”) standards are used for the calibration of “UUT” TC module toavoid repeated use of the “Reference” thermal converter. The TC modules under test (UUT) areusually standards sent from the client (secondary) standard laboratories to be calibrated by the host(primary) laboratories. This is the typical procedure to establish the traceability-chain between thehost laboratories and the client laboratories.
Fig. 7.7. Calibration of a TC module under test (UUT).
Calibration

Preliminary Version 1.03b
- 72 -
The “Transfer” standards may also be used for an “inter-laboratory” comparison between twoindependent laboratories with primary AC-DC transfer standards. Though the ET2001 ADS systemis capable of realizing an independent AC-DC transfer standard, it is quite important to check itsconformity with the other independent laboratories. The conformity can most easily be verified bytransferring a TC module and compare calibration results between the laboratories.
In ether case, the calibration involves two calibration institutes, i.e., the "host/primary" institute(S) and “client/secondary” institute (X). The client laboratory prepares a calibrated travelingstandard (TCX), and sends the TCX to the host laboratory. Then the host laboratory carries out thecalibration of the TCX against its primary standard, and then issues the calibration certificate. Thisis the conventional scheme of the “inter-laboratory” calibration of AC-DC transfer standard.
Fig. 7.8. “Inter-laboratory” calibration (conventional scheme)
The AC-DC difference of the intermediate (Transfer) TC module is determined by the combinationof (1) results from the AC-DC difference comparison measurement between the “Transfer” TCmodule and the “Reference” TC module, and (2) AC-DC difference of the “Reference” TC moduleevaluated by the procedure described in the previous section. Figure 7.9 shows the result ofcalibration of a “Traveling” TC module (SN4120020) by the reference TC module (SN05110024).The two TC modules have the same type of the TC elements (type JSTC04E), and hence showssimilar frequency dependence in the AC-DC transfer difference.

Preliminary Version 1.03b
- 73 -
Fig. 7.9.Calibration of a “Traveling” TC module by the reference TC module.
7.3.2. Evaluation of Uncertainty
The sources of uncertainties in the evaluation of a transfer TC module (TRANS) or TC moduleunder test (UUT) is summarized in Table 7.2. The combined uncertainty is evaluated by takingroot-sum-square of the uncertainty contributions, i.e., (1) uncertainty in the evaluation of the AC-DC difference of the “Reference” TC module, and (2) uncertainty in the AC-DC differencecomparison measurement(s) between the two (or three) TC modules.
Table 7.2. Uncertainty budget for the calibration of a TC module

Preliminary Version 1.03b
- 74 -
7.3.3. Remote Calibration
In the case of the AC-DC transfer standard, the remote calibration is performed using a thermalconverter as a traveling standard. The traveling standard is calibrated by a pilot (host) laboratory,and is sent to another (client) calibration institute, where it is compared with a client's referencethermal converter by AC-DC difference comparison measurements. The schematic diagram of theremote calibration is illustrated in figure 7.10.
ET2001 ADS system is especially suited for the remote calibration, on condition that both thehost and client institute has the ET2001 ADS systems. In this case, a traveling TC module preparedby the host institute will be sent to the client institute by post. The TC module of the ET2001system is quite tough for the vibration or temperature change, and the no special care is required forthe transportation. After receiving the traveling TC module, client institute can simply connect thetraveling TC module with their TC module (UUT) and start the automated measurement program.After finishing the comparison measurement, all the measurement data, including the fluctuation ofambient temperature and identification of TC modules are automatically sent to the host laboratoryvia email. When necessary, the measurement data can be sent to the host laboratory by emailthroughout the measurement, so as to confirm proper measurement conditions. It is also possible toremote-control the measurement program from the host institute using a remote-login operation ofthe Internet.
Fig. 7.10. Remote or "E-trace" calibration
Preliminary Version 1.03b
- 75 -
8. Supplementary Information
8.1. FACs
Q: Should the Shield (chassis) of the thermal converter connected to the Guard (shell of inputconnector) of the AMP module?A: Input-Lo and Guard of the AMP module are connected inside. If your thermal converter hasinternal connection between chassis (Input-Lo) and Output-Lo, you do not have to connect Shieldof the thermal converter to the Guard of the AMP module. Please refer to the figures for properearth and ground connection.
Q: Is it possible to improve detection sensitivity by inserting nanovolt amplifier between the TCand the AMP module?A: A filter/amplifier specially designed for the thermal converter has been developed at NMIA. Six-fold increase is obtained in the case of SJTC. Contact address <[email protected]>.
8.2. Trouble Shooting
Q: LED of USB/PS module do not turn on after setting power switch to ON position.A: Safety switch (or circuit breaker) can accidentally be set due to mechanical shock or vibrationduring the transportation. The safety switch is located near the voltage selector switch.
8.3. Acknowledgements
The ET2001 AC-DC transfer standard (ADS) has been developed through a collaborativeresearch project between SunJEM Co. and AIST. The project was carried out as part of the “e-trace” project of supported by NEDO (New Energy and Industrial Technology DevelopmentOrganization). Detailed designing of the ADS was performed by Minoru Usuda and ShinichiKoyano of SunJEM Co., Japan, and Shinzo Honda of Yatoro-Electronics Co., Japan. The JTSC04Thermal Converter and HF/LF-TVC has been developed through a collaborative research projectbetween Nikkohm Co. and AIST, supported by Koji Shimizume, Kazuki Nishiya, Satoshi Nakano,Kaname Kishino and Shigeru Hidaka of Nikkohm Co. Contribution and Supports from KiyotadaKato of SunJEM Co., and Hiroyuki Fujiki and Kunihiko Takahashi of AIST are gratefullyacknowledged.
8.4. Contact Address
[Purchase information]

Preliminary Version 1.03b
- 76 -
Key Techno Co., Ltd.Fax: +81-3-3251-3166Email: [email protected]
[Technical questions or comments]IQUANTUM Co., Ltd.FAX: +81-29-855-8171Email: [email protected]://www.iquantum.jp orHitoshi SASAKINanoelectronics Research Institute, AISTEmail: [email protected]

Preliminary Version 1.03b
- 77 -
Appendix-A: File Examples
[1] Example of Measurement Procedure List[2] Example of TC module specifications File[3] Data from a FRDC-DC Difference Measurement[4] Data from an AC-LF Measurement[5] Data from an AC-DC Difference Measurement[6] Data from an AC-AC Difference Measurement
All the data/parameters are recorded in simple ASCII text formats using semicolons as data-separatorsAn example of a data-file is listed below.
[1] Example of Measurement Procedure List
"FRDCproc.txt"------------------------------------------------------- 3Type1,7.50E-01,7.50E-01,1.00E-01,5.00E+03,33,repeat 2 times,frdc01V033P-1.txtType2,3.00E+00,1.00E+00,1.00E+02,1.00E+03,2,Meas at 5V,frdc03V002P-1.txtType3,1.00E+01,1.00E+01,5.00E-01,1.00E+00,33,repeat 2 times,frdc10V033P-1.txtEND-------------------------------------------------------
"ACLFproc.txt"------------------------------------------------------- 2LF-1,8.60E+00,8.60E+00,5.00E+00,2.00E+02,96,Proc JSTC05A,aclf8p6V096-1.txtLF-2,2.80E+00,4.00E+00,5.00E+00,2.00E+02,96,Proc JSTC05A,aclf4p0V096-1.txtEND-------------------------------------------------------
"ACDCproc.txt"------------------------------------------------------- 4Quick-1,5.00E+00,5.00E+00,1.00E+01,1.00E+06,13, meas at 5V,acdc5p0V013-1.txtType2,1.00E+00,1.00E+00,1.00E+04,9.90E+05,24,for HF-TVC,acdc01V024P-1.txtType3,1.50E+00,1.50E+00,1.00E+04,9.90E+05,24,for HF-TVC,acdc1p5V24P-1.txtType4,1.00E+01,1.00E+01,1.00E+01,1.00E+06,34,repeat 2 times,acdc10V034P-1.txtEND-------------------------------------------------------
Parameters;(Head: number of registerd procedure files)
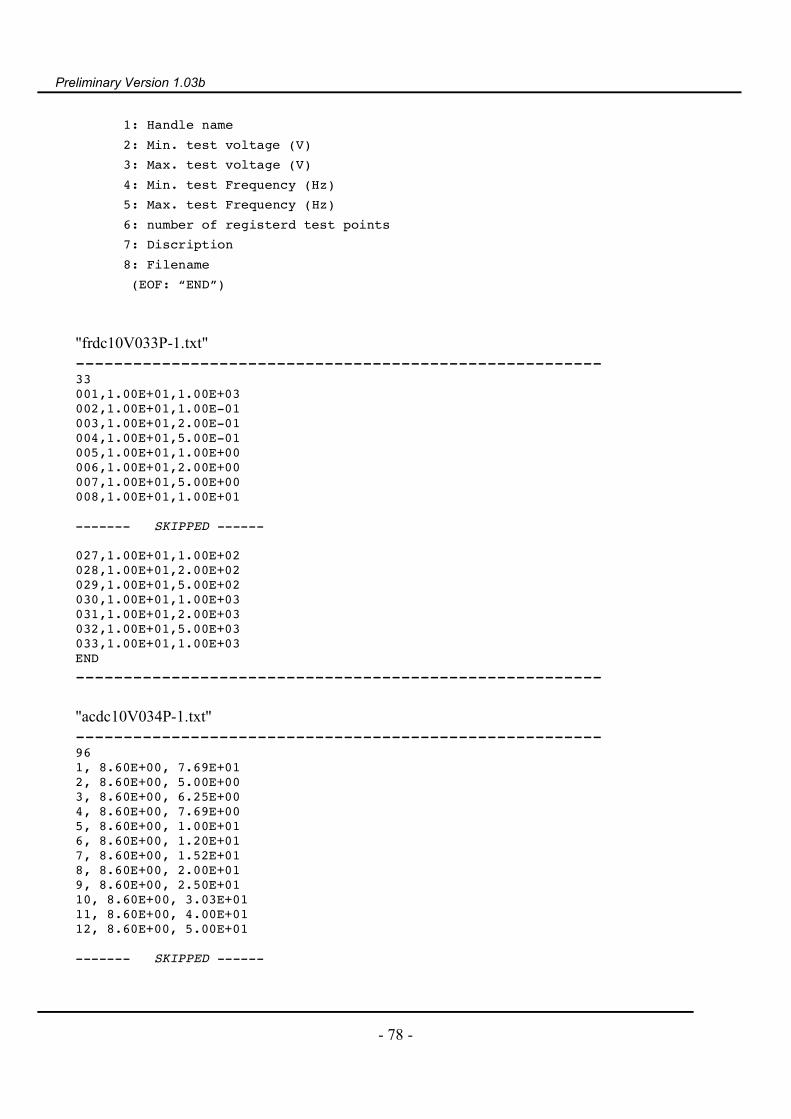
Preliminary Version 1.03b
- 78 -
1: Handle name2: Min. test voltage (V)3: Max. test voltage (V)4: Min. test Frequency (Hz)5: Max. test Frequency (Hz)6: number of registerd test points7: Discription8: Filename (EOF: “END”)
"frdc10V033P-1.txt"-------------------------------------------------------33001,1.00E+01,1.00E+03002,1.00E+01,1.00E-01003,1.00E+01,2.00E-01004,1.00E+01,5.00E-01005,1.00E+01,1.00E+00006,1.00E+01,2.00E+00007,1.00E+01,5.00E+00008,1.00E+01,1.00E+01
------- SKIPPED ------
027,1.00E+01,1.00E+02028,1.00E+01,2.00E+02029,1.00E+01,5.00E+02030,1.00E+01,1.00E+03031,1.00E+01,2.00E+03032,1.00E+01,5.00E+03033,1.00E+01,1.00E+03END-------------------------------------------------------
"acdc10V034P-1.txt"-------------------------------------------------------961, 8.60E+00, 7.69E+012, 8.60E+00, 5.00E+003, 8.60E+00, 6.25E+004, 8.60E+00, 7.69E+005, 8.60E+00, 1.00E+016, 8.60E+00, 1.20E+017, 8.60E+00, 1.52E+018, 8.60E+00, 2.00E+019, 8.60E+00, 2.50E+0110, 8.60E+00, 3.03E+0111, 8.60E+00, 4.00E+0112, 8.60E+00, 5.00E+01
------- SKIPPED ------

Preliminary Version 1.03b
- 79 -
91, 5.00E+00, 4.00E+0192, 5.00E+00, 5.00E+0193, 5.00E+00, 6.25E+0194, 5.00E+00, 7.69E+0195, 5.00E+00, 1.00E+0296, 5.00E+00, 2.00E+02END-------------------------------------------------------
"acdc10V034P-1.txt"------------------------------------------------------- 34001,1.00E+01,1.00E+03002,1.00E+01,1.00E+01003,1.00E+01,2.00E+01004,1.00E+01,5.00E+01005,1.00E+01,1.00E+02006,1.00E+01,2.00E+02007,1.00E+01,5.00E+02008,1.00E+01,1.00E+03
------- SKIPPED ------
027,1.00E+01,1.00E+04028,1.00E+01,2.00E+04029,1.00E+01,5.00E+04030,1.00E+01,1.00E+05031,1.00E+01,2.00E+05032,1.00E+01,5.00E+05033,1.00E+01,1.00E+06034,1.00E+01,1.00E+03END-------------------------------------------------------
Parameters;(Head: number of registerd test points)1: Number2: Test voltage (V)3: Test Frequency (Hz)(EOF: “END”)
[2] Example of TC Spec List
"TClist.txt"-------------------------------------------------------3JSTC04A-10Vspecial,10,9,1200,2.8,Q,NIKKOHM MJTC with alpha 1000 ohmCTCV-Canada with 667 Ohm,10,4.2,742,15,Q,CTVC 742 OhmJSTC04B-4Z01, 7, 80, 500, 2.8,Q,NIKKOHM MJTCEND
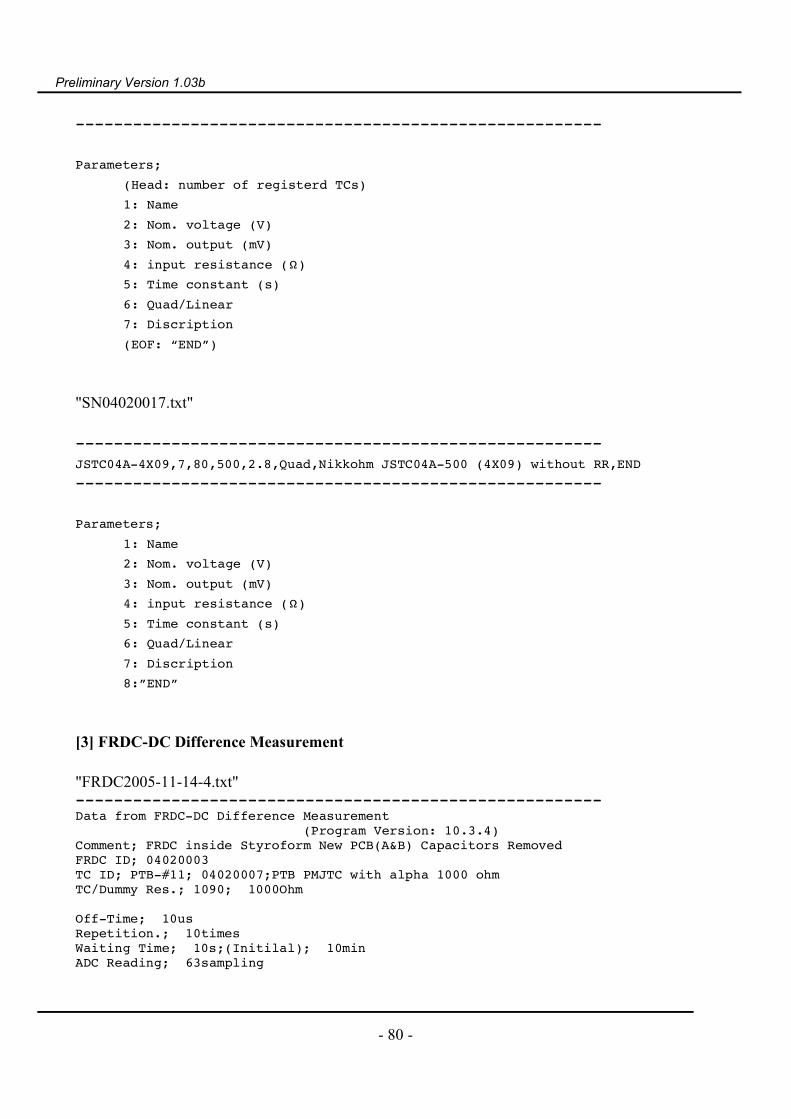
Preliminary Version 1.03b
- 80 -
-------------------------------------------------------
Parameters;(Head: number of registerd TCs)1: Name2: Nom. voltage (V)3: Nom. output (mV)4: input resistance (Ω)5: Time constant (s)6: Quad/Linear7: Discription(EOF: “END”)
"SN04020017.txt"
-------------------------------------------------------JSTC04A-4X09,7,80,500,2.8,Quad,Nikkohm JSTC04A-500 (4X09) without RR,END-------------------------------------------------------
Parameters;1: Name2: Nom. voltage (V)3: Nom. output (mV)4: input resistance (Ω)5: Time constant (s)6: Quad/Linear7: Discription8:”END”
[3] FRDC-DC Difference Measurement
"FRDC2005-11-14-4.txt"-------------------------------------------------------Data from FRDC-DC Difference Measurement (Program Version: 10.3.4)Comment; FRDC inside Styroform New PCB(A&B) Capacitors RemovedFRDC ID; 04020003TC ID; PTB-#11; 04020007;PTB PMJTC with alpha 1000 ohmTC/Dummy Res.; 1090; 1000Ohm Off-Time; 10usRepetition.; 10timesWaiting Time; 10s;(Initilal); 10minADC Reading; 63sampling
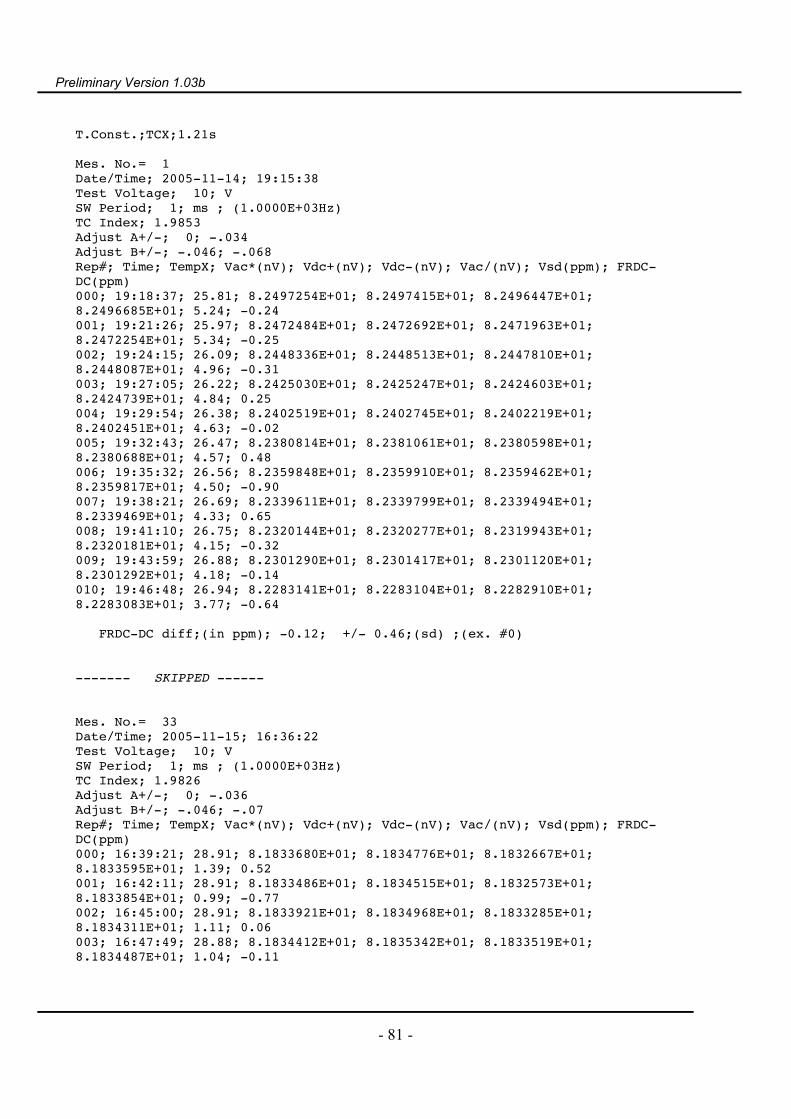
Preliminary Version 1.03b
- 81 -
T.Const.;TCX;1.21s Mes. No.= 1Date/Time; 2005-11-14; 19:15:38Test Voltage; 10; VSW Period; 1; ms ; (1.0000E+03Hz)TC Index; 1.9853Adjust A+/-; 0; -.034Adjust B+/-; -.046; -.068Rep#; Time; TempX; Vac*(nV); Vdc+(nV); Vdc-(nV); Vac/(nV); Vsd(ppm); FRDC-DC(ppm)000; 19:18:37; 25.81; 8.2497254E+01; 8.2497415E+01; 8.2496447E+01;8.2496685E+01; 5.24; -0.24001; 19:21:26; 25.97; 8.2472484E+01; 8.2472692E+01; 8.2471963E+01;8.2472254E+01; 5.34; -0.25002; 19:24:15; 26.09; 8.2448336E+01; 8.2448513E+01; 8.2447810E+01;8.2448087E+01; 4.96; -0.31003; 19:27:05; 26.22; 8.2425030E+01; 8.2425247E+01; 8.2424603E+01;8.2424739E+01; 4.84; 0.25004; 19:29:54; 26.38; 8.2402519E+01; 8.2402745E+01; 8.2402219E+01;8.2402451E+01; 4.63; -0.02005; 19:32:43; 26.47; 8.2380814E+01; 8.2381061E+01; 8.2380598E+01;8.2380688E+01; 4.57; 0.48006; 19:35:32; 26.56; 8.2359848E+01; 8.2359910E+01; 8.2359462E+01;8.2359817E+01; 4.50; -0.90007; 19:38:21; 26.69; 8.2339611E+01; 8.2339799E+01; 8.2339494E+01;8.2339469E+01; 4.33; 0.65008; 19:41:10; 26.75; 8.2320144E+01; 8.2320277E+01; 8.2319943E+01;8.2320181E+01; 4.15; -0.32009; 19:43:59; 26.88; 8.2301290E+01; 8.2301417E+01; 8.2301120E+01;8.2301292E+01; 4.18; -0.14010; 19:46:48; 26.94; 8.2283141E+01; 8.2283104E+01; 8.2282910E+01;8.2283083E+01; 3.77; -0.64
FRDC-DC diff;(in ppm); -0.12; +/- 0.46;(sd) ;(ex. #0)
------- SKIPPED ------
Mes. No.= 33Date/Time; 2005-11-15; 16:36:22Test Voltage; 10; VSW Period; 1; ms ; (1.0000E+03Hz)TC Index; 1.9826Adjust A+/-; 0; -.036Adjust B+/-; -.046; -.07Rep#; Time; TempX; Vac*(nV); Vdc+(nV); Vdc-(nV); Vac/(nV); Vsd(ppm); FRDC-DC(ppm)000; 16:39:21; 28.91; 8.1833680E+01; 8.1834776E+01; 8.1832667E+01;8.1833595E+01; 1.39; 0.52001; 16:42:11; 28.91; 8.1833486E+01; 8.1834515E+01; 8.1832573E+01;8.1833854E+01; 0.99; -0.77002; 16:45:00; 28.91; 8.1833921E+01; 8.1834968E+01; 8.1833285E+01;8.1834311E+01; 1.11; 0.06003; 16:47:49; 28.88; 8.1834412E+01; 8.1835342E+01; 8.1833519E+01;8.1834487E+01; 1.04; -0.11

Preliminary Version 1.03b
- 82 -
004; 16:50:38; 28.91; 8.1834449E+01; 8.1835475E+01; 8.1833559E+01;8.1834548E+01; 1.05; 0.12005; 16:53:27; 28.91; 8.1834569E+01; 8.1835628E+01; 8.1833690E+01;8.1834662E+01; 0.97; 0.27006; 16:56:17; 28.88; 8.1834687E+01; 8.1835630E+01; 8.1833760E+01;8.1834802E+01; 1.02; -0.31007; 16:59:06; 28.91; 8.1834794E+01; 8.1835800E+01; 8.1833900E+01;8.1834879E+01; 1.05; 0.08008; 17:01:55; 28.91; 8.1834887E+01; 8.1836007E+01; 8.1834135E+01;8.1835067E+01; 1.03; 0.58009; 17:04:44; 28.91; 8.1835066E+01; 8.1836124E+01; 8.1834223E+01;8.1835153E+01; 1.07; 0.39010; 17:07:33; 28.91; 8.1835286E+01; 8.1836296E+01; 8.1834385E+01;8.1835413E+01; 1.07; -0.06
FRDC-DC diff;(in ppm); 0.02; +/- 0.36;(sd) ;(ex. #0)
Mes#; Time; Level;; Frequency;; FRDC(ppm);; (sd) 1;19:46:49;10.00;V;1.00E+03;Hz;;-0.12;(;0.46;)uV/V 2;20:26:51;10.00;V;1.00E-01;Hz;;0.10;(;0.59;)uV/V 3;21:06:50;10.00;V;2.00E-01;Hz;;0.13;(;0.16;)uV/V 4;21:46:50;10.00;V;5.00E-01;Hz;;0.00;(;0.38;)uV/V 5;22:26:50;10.00;V;1.00E+00;Hz;;0.11;(;0.26;)uV/V 6;23:06:50;10.00;V;2.00E+00;Hz;;-0.16;(;0.27;)uV/V 7;23:46:50;10.00;V;5.00E+00;Hz;;0.03;(;0.37;)uV/V 8;00:26:51;10.00;V;1.00E+01;Hz;;0.02;(;0.13;)uV/V 9;01:06:51;10.00;V;2.00E+01;Hz;;-0.11;(;0.35;)uV/V 10;01:46:52;10.00;V;5.00E+01;Hz;;0.04;(;0.25;)uV/V 11;02:26:56;10.00;V;1.00E+02;Hz;;-0.26;(;0.50;)uV/V 12;03:06:58;10.00;V;2.00E+02;Hz;;-0.04;(;0.20;)uV/V 13;03:47:00;10.00;V;5.00E+02;Hz;;-0.14;(;0.32;)uV/V 14;04:27:01;10.00;V;1.00E+03;Hz;;-0.15;(;0.34;)uV/V 15;05:07:02;10.00;V;2.00E+03;Hz;;0.05;(;0.19;)uV/V 16;05:47:03;10.00;V;5.00E+03;Hz;;0.28;(;0.40;)uV/V 17;06:27:04;10.00;V;1.00E+03;Hz;;0.02;(;0.31;)uV/V 18;07:07:06;10.00;V;1.00E-01;Hz;;-0.07;(;0.41;)uV/V 19;07:47:13;10.00;V;2.00E-01;Hz;;-0.10;(;0.21;)uV/V 20;08:27:17;10.00;V;5.00E-01;Hz;;-0.12;(;0.31;)uV/V 21;09:07:18;10.00;V;1.00E+00;Hz;;0.06;(;0.18;)uV/V 22;09:47:20;10.00;V;2.00E+00;Hz;;0.12;(;0.15;)uV/V 23;10:27:22;10.00;V;5.00E+00;Hz;;-0.11;(;0.46;)uV/V 24;11:07:23;10.00;V;1.00E+01;Hz;;-0.21;(;0.32;)uV/V 25;11:47:24;10.00;V;2.00E+01;Hz;;0.09;(;0.35;)uV/V 26;12:27:25;10.00;V;5.00E+01;Hz;;-0.01;(;0.13;)uV/V 27;13:07:26;10.00;V;1.00E+02;Hz;;0.01;(;0.14;)uV/V 28;13:47:27;10.00;V;2.00E+02;Hz;;-0.03;(;0.55;)uV/V 29;14:27:28;10.00;V;5.00E+02;Hz;;0.04;(;0.18;)uV/V 30;15:07:30;10.00;V;1.00E+03;Hz;;-0.06;(;0.27;)uV/V 31;15:47:31;10.00;V;2.00E+03;Hz;;-0.04;(;0.16;)uV/V 32;16:27:33;10.00;V;5.00E+03;Hz;;0.49;(;0.16;)uV/V 33;17:07:34;10.00;V;1.00E+03;Hz;;0.02;(;0.36;)uV/V-------------------------------------------------------
[4] AC-LF Measurement
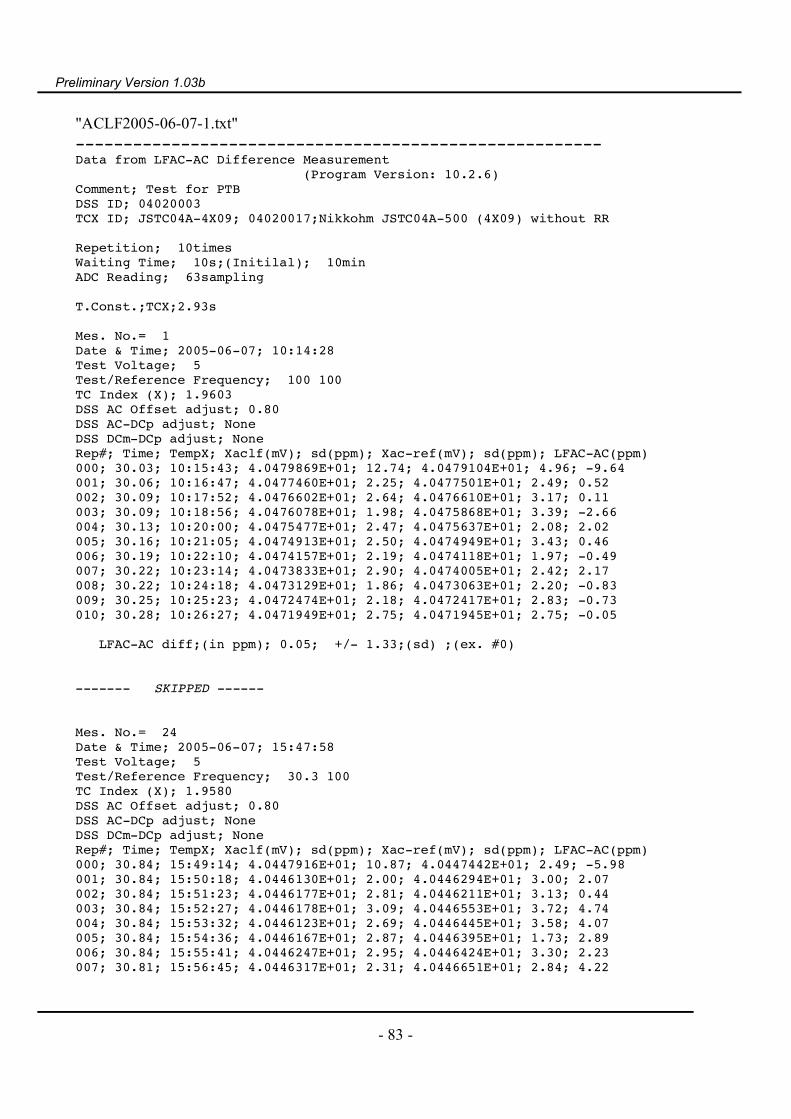
Preliminary Version 1.03b
- 83 -
"ACLF2005-06-07-1.txt"-------------------------------------------------------Data from LFAC-AC Difference Measurement (Program Version: 10.2.6)Comment; Test for PTBDSS ID; 04020003TCX ID; JSTC04A-4X09; 04020017;Nikkohm JSTC04A-500 (4X09) without RR Repetition; 10timesWaiting Time; 10s;(Initilal); 10minADC Reading; 63sampling T.Const.;TCX;2.93s Mes. No.= 1Date & Time; 2005-06-07; 10:14:28Test Voltage; 5Test/Reference Frequency; 100 100TC Index (X); 1.9603DSS AC Offset adjust; 0.80DSS AC-DCp adjust; NoneDSS DCm-DCp adjust; NoneRep#; Time; TempX; Xaclf(mV); sd(ppm); Xac-ref(mV); sd(ppm); LFAC-AC(ppm)000; 30.03; 10:15:43; 4.0479869E+01; 12.74; 4.0479104E+01; 4.96; -9.64001; 30.06; 10:16:47; 4.0477460E+01; 2.25; 4.0477501E+01; 2.49; 0.52002; 30.09; 10:17:52; 4.0476602E+01; 2.64; 4.0476610E+01; 3.17; 0.11003; 30.09; 10:18:56; 4.0476078E+01; 1.98; 4.0475868E+01; 3.39; -2.66004; 30.13; 10:20:00; 4.0475477E+01; 2.47; 4.0475637E+01; 2.08; 2.02005; 30.16; 10:21:05; 4.0474913E+01; 2.50; 4.0474949E+01; 3.43; 0.46006; 30.19; 10:22:10; 4.0474157E+01; 2.19; 4.0474118E+01; 1.97; -0.49007; 30.22; 10:23:14; 4.0473833E+01; 2.90; 4.0474005E+01; 2.42; 2.17008; 30.22; 10:24:18; 4.0473129E+01; 1.86; 4.0473063E+01; 2.20; -0.83009; 30.25; 10:25:23; 4.0472474E+01; 2.18; 4.0472417E+01; 2.83; -0.73010; 30.28; 10:26:27; 4.0471949E+01; 2.75; 4.0471945E+01; 2.75; -0.05
LFAC-AC diff;(in ppm); 0.05; +/- 1.33;(sd) ;(ex. #0)
------- SKIPPED ------
Mes. No.= 24Date & Time; 2005-06-07; 15:47:58Test Voltage; 5Test/Reference Frequency; 30.3 100TC Index (X); 1.9580DSS AC Offset adjust; 0.80DSS AC-DCp adjust; NoneDSS DCm-DCp adjust; NoneRep#; Time; TempX; Xaclf(mV); sd(ppm); Xac-ref(mV); sd(ppm); LFAC-AC(ppm)000; 30.84; 15:49:14; 4.0447916E+01; 10.87; 4.0447442E+01; 2.49; -5.98001; 30.84; 15:50:18; 4.0446130E+01; 2.00; 4.0446294E+01; 3.00; 2.07002; 30.84; 15:51:23; 4.0446177E+01; 2.81; 4.0446211E+01; 3.13; 0.44003; 30.84; 15:52:27; 4.0446178E+01; 3.09; 4.0446553E+01; 3.72; 4.74004; 30.84; 15:53:32; 4.0446123E+01; 2.69; 4.0446445E+01; 3.58; 4.07005; 30.84; 15:54:36; 4.0446167E+01; 2.87; 4.0446395E+01; 1.73; 2.89006; 30.84; 15:55:41; 4.0446247E+01; 2.95; 4.0446424E+01; 3.30; 2.23007; 30.81; 15:56:45; 4.0446317E+01; 2.31; 4.0446651E+01; 2.84; 4.22

Preliminary Version 1.03b
- 84 -
008; 30.84; 15:57:50; 4.0446350E+01; 3.58; 4.0446899E+01; 2.72; 6.94009; 30.81; 15:58:54; 4.0446601E+01; 2.61; 4.0446792E+01; 2.36; 2.41010; 30.81; 15:59:59; 4.0446386E+01; 4.40; 4.0446935E+01; 2.39; 6.92
ACLF-AC diff;(in ppm); 3.69; +/- 2.00;(sd) ;(ex. #0)
Mes#;Time;Level;;Frequency;;ACLF(ppm);; (sd) 1;10:26:28;5.00;V;1.00E+02;Hz;0.05;(;1.33;)uV/V 2;10:42:31;5.00;V;8.00E+00;Hz;3.01;(;5.27;)uV/V 3;10:58:35;5.00;V;1.00E+01;Hz;6.81;(;4.36;)uV/V 4;11:12:56;5.00;V;1.20E+01;Hz;6.11;(;3.50;)uV/V 5;11:27:17;5.00;V;1.52E+01;Hz;3.13;(;3.36;)uV/V 6;11:41:38;5.00;V;2.00E+01;Hz;4.17;(;2.55;)uV/V 7;11:55:59;5.00;V;2.50E+01;Hz;3.62;(;1.76;)uV/V 8;12:10:20;5.00;V;3.03E+01;Hz;4.10;(;1.73;)uV/V 9;12:24:41;5.00;V;4.00E+01;Hz;3.34;(;1.22;)uV/V 10;12:39:02;5.00;V;5.00E+01;Hz;2.04;(;1.02;)uV/V 11;12:53:23;5.00;V;6.25E+01;Hz;1.89;(;1.03;)uV/V 12;13:07:44;5.00;V;7.69E+01;Hz;1.25;(;0.97;)uV/V 13;13:22:05;5.00;V;1.00E+02;Hz;-0.15;(;1.20;)uV/V 14;13:36:26;5.00;V;1.25E+02;Hz;-0.95;(;1.04;)uV/V 15;13:50:47;5.00;V;1.67E+02;Hz;-3.68;(;1.09;)uV/V 16;14:05:09;5.00;V;2.00E+02;Hz;-6.12;(;0.82;)uV/V 17;14:19:30;5.00;V;2.50E+02;Hz;-8.36;(;1.26;)uV/V 18;14:33:51;5.00;V;8.00E+00;Hz;6.93;(;4.82;)uV/V 19;14:48:13;5.00;V;1.00E+01;Hz;3.06;(;4.38;)uV/V 20;15:02:34;5.00;V;1.20E+01;Hz;4.10;(;3.14;)uV/V 21;15:16:56;5.00;V;1.52E+01;Hz;4.30;(;2.04;)uV/V 22;15:31:17;5.00;V;2.00E+01;Hz;2.79;(;1.87;)uV/V 23;15:45:38;5.00;V;2.50E+01;Hz;3.12;(;1.50;)uV/V 24;15:59:59;5.00;V;3.03E+01;Hz;3.69;(;2.00;)uV/V-------------------------------------------------------
[5] AC-DC Difference Measurement
"ACDC2005-07-31-1.txt"-------------------------------------------------------Data from ACDC Difference Measurement (Program Version: 10.3.4)Comment; test programDSS ID; 04020001TCX ID; JSTC04A-4X07; 04020004;Nikkohm JSTC04B-200 device#4X07TCS ID; JSTC04A 4X08; 04020003; Repetition; 10timesWaiting Time; 15s;(Initilal); 10minADC Read; 94sampling T.Const.;TCX;3.01s;TCS;2.92s Mes. No.= 1Date & Time; 2005-08-01; 00:04:11Test Voltage; 3Test Frequency; 10000
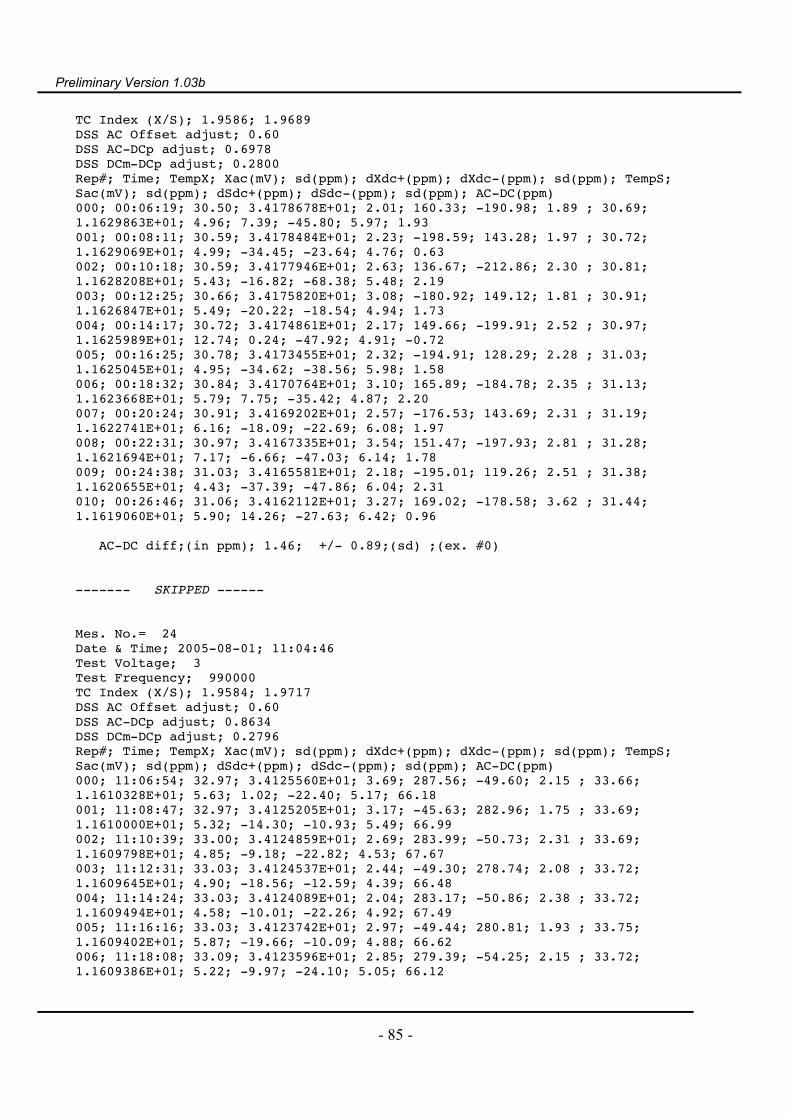
Preliminary Version 1.03b
- 85 -
TC Index (X/S); 1.9586; 1.9689DSS AC Offset adjust; 0.60DSS AC-DCp adjust; 0.6978DSS DCm-DCp adjust; 0.2800Rep#; Time; TempX; Xac(mV); sd(ppm); dXdc+(ppm); dXdc-(ppm); sd(ppm); TempS;Sac(mV); sd(ppm); dSdc+(ppm); dSdc-(ppm); sd(ppm); AC-DC(ppm)000; 00:06:19; 30.50; 3.4178678E+01; 2.01; 160.33; -190.98; 1.89 ; 30.69;1.1629863E+01; 4.96; 7.39; -45.80; 5.97; 1.93001; 00:08:11; 30.59; 3.4178484E+01; 2.23; -198.59; 143.28; 1.97 ; 30.72;1.1629069E+01; 4.99; -34.45; -23.64; 4.76; 0.63002; 00:10:18; 30.59; 3.4177946E+01; 2.63; 136.67; -212.86; 2.30 ; 30.81;1.1628208E+01; 5.43; -16.82; -68.38; 5.48; 2.19003; 00:12:25; 30.66; 3.4175820E+01; 3.08; -180.92; 149.12; 1.81 ; 30.91;1.1626847E+01; 5.49; -20.22; -18.54; 4.94; 1.73004; 00:14:17; 30.72; 3.4174861E+01; 2.17; 149.66; -199.91; 2.52 ; 30.97;1.1625989E+01; 12.74; 0.24; -47.92; 4.91; -0.72005; 00:16:25; 30.78; 3.4173455E+01; 2.32; -194.91; 128.29; 2.28 ; 31.03;1.1625045E+01; 4.95; -34.62; -38.56; 5.98; 1.58006; 00:18:32; 30.84; 3.4170764E+01; 3.10; 165.89; -184.78; 2.35 ; 31.13;1.1623668E+01; 5.79; 7.75; -35.42; 4.87; 2.20007; 00:20:24; 30.91; 3.4169202E+01; 2.57; -176.53; 143.69; 2.31 ; 31.19;1.1622741E+01; 6.16; -18.09; -22.69; 6.08; 1.97008; 00:22:31; 30.97; 3.4167335E+01; 3.54; 151.47; -197.93; 2.81 ; 31.28;1.1621694E+01; 7.17; -6.66; -47.03; 6.14; 1.78009; 00:24:38; 31.03; 3.4165581E+01; 2.18; -195.01; 119.26; 2.51 ; 31.38;1.1620655E+01; 4.43; -37.39; -47.86; 6.04; 2.31010; 00:26:46; 31.06; 3.4162112E+01; 3.27; 169.02; -178.58; 3.62 ; 31.44;1.1619060E+01; 5.90; 14.26; -27.63; 6.42; 0.96
AC-DC diff;(in ppm); 1.46; +/- 0.89;(sd) ;(ex. #0)
------- SKIPPED ------
Mes. No.= 24Date & Time; 2005-08-01; 11:04:46Test Voltage; 3Test Frequency; 990000TC Index (X/S); 1.9584; 1.9717DSS AC Offset adjust; 0.60DSS AC-DCp adjust; 0.8634DSS DCm-DCp adjust; 0.2796Rep#; Time; TempX; Xac(mV); sd(ppm); dXdc+(ppm); dXdc-(ppm); sd(ppm); TempS;Sac(mV); sd(ppm); dSdc+(ppm); dSdc-(ppm); sd(ppm); AC-DC(ppm)000; 11:06:54; 32.97; 3.4125560E+01; 3.69; 287.56; -49.60; 2.15 ; 33.66;1.1610328E+01; 5.63; 1.02; -22.40; 5.17; 66.18001; 11:08:47; 32.97; 3.4125205E+01; 3.17; -45.63; 282.96; 1.75 ; 33.69;1.1610000E+01; 5.32; -14.30; -10.93; 5.49; 66.99002; 11:10:39; 33.00; 3.4124859E+01; 2.69; 283.99; -50.73; 2.31 ; 33.69;1.1609798E+01; 4.85; -9.18; -22.82; 4.53; 67.67003; 11:12:31; 33.03; 3.4124537E+01; 2.44; -49.30; 278.74; 2.08 ; 33.72;1.1609645E+01; 4.90; -18.56; -12.59; 4.39; 66.48004; 11:14:24; 33.03; 3.4124089E+01; 2.04; 283.17; -50.86; 2.38 ; 33.72;1.1609494E+01; 4.58; -10.01; -22.26; 4.92; 67.49005; 11:16:16; 33.03; 3.4123742E+01; 2.97; -49.44; 280.81; 1.93 ; 33.75;1.1609402E+01; 5.87; -19.66; -10.09; 4.88; 66.62006; 11:18:08; 33.09; 3.4123596E+01; 2.85; 279.39; -54.25; 2.15 ; 33.72;1.1609386E+01; 5.22; -9.97; -24.10; 5.05; 66.12

Preliminary Version 1.03b
- 86 -
007; 11:20:01; 33.06; 3.4123169E+01; 2.61; -53.52; 279.13; 1.82 ; 33.78;1.1609272E+01; 4.65; -25.32; -11.65; 4.64; 66.98008; 11:21:53; 33.06; 3.4122635E+01; 3.13; 286.68; -48.68; 2.23 ; 33.78;1.1609143E+01; 4.90; -7.34; -17.34; 4.70; 67.02009; 11:23:45; 33.09; 3.4122478E+01; 2.70; -48.04; 280.20; 1.75 ; 33.78;1.1609180E+01; 4.65; -19.15; -10.84; 4.88; 66.88010; 11:25:38; 33.09; 3.4122148E+01; 3.22; 284.62; -47.84; 1.92 ; 33.78;1.1609159E+01; 5.40; -8.08; -16.47; 4.78; 66.68
AC-DC diff;(in ppm); 66.89; +/- 0.44;(sd) ;(ex. #0)
Mes#;Time;Level;;Frequency;;ACDC(ppm);; (sd) 1;00:26:46;3.00;V;1.00E+04;Hz;1.46;(;0.89;)uV/V 2;00:55:48;3.00;V;5.00E+04;Hz;5.08;(;0.82;)uV/V 3;01:24:36;3.00;V;9.00E+04;Hz;8.66;(;0.55;)uV/V 4;01:52:22;3.00;V;1.90E+05;Hz;15.50;(;0.51;)uV/V 5;02:20:58;3.00;V;2.90E+05;Hz;22.11;(;0.68;)uV/V 6;02:48:45;3.00;V;3.90E+05;Hz;28.61;(;0.87;)uV/V 7;03:18:11;3.00;V;4.90E+05;Hz;35.32;(;0.83;)uV/V 8;03:45:59;3.00;V;5.90E+05;Hz;41.28;(;0.81;)uV/V 9;04:16:25;3.00;V;6.90E+05;Hz;47.68;(;1.23;)uV/V 10;04:45:03;3.00;V;7.90E+05;Hz;53.71;(;1.61;)uV/V 11;05:13:06;3.00;V;8.90E+05;Hz;60.51;(;0.68;)uV/V 12;05:41:25;3.00;V;9.90E+05;Hz;67.38;(;0.51;)uV/V 13;06:10:00;3.00;V;1.00E+04;Hz;1.22;(;0.90;)uV/V 14;06:37:48;3.00;V;5.00E+04;Hz;5.36;(;0.67;)uV/V 15;07:06:26;3.00;V;9.00E+04;Hz;7.77;(;0.95;)uV/V 16;07:34:44;3.00;V;1.90E+05;Hz;15.02;(;0.77;)uV/V 17;08:04:10;3.00;V;2.90E+05;Hz;21.86;(;0.49;)uV/V 18;08:33:32;3.00;V;3.90E+05;Hz;28.37;(;0.89;)uV/V 19;09:03:09;3.00;V;4.90E+05;Hz;34.89;(;0.96;)uV/V 20;09:31:45;3.00;V;5.90E+05;Hz;41.32;(;0.94;)uV/V 21;09:59:34;3.00;V;6.90E+05;Hz;47.57;(;0.67;)uV/V 22;10:27:23;3.00;V;7.90E+05;Hz;54.30;(;0.75;)uV/V 23;10:56:58;3.00;V;8.90E+05;Hz;60.38;(;0.65;)uV/V 24;11:25:39;3.00;V;9.90E+05;Hz;66.89;(;0.44;)uV/V-------------------------------------------------------
[6] AC-AC Difference Measurement
"ACAC2005-07-18-1.txt"-------------------------------------------------------Data from ACAC Difference Measurement (Program Version: 10.4.5)Comment; Chassis B with 2000-5119 (Normal Combination)DSS ID; 04020003TCX ID; JSTC04-100B5102; 04020009;TCS ID; JSTC04A-5101; 04020005;Nikkohm JSTC04B-100 device#5101 Repetition; 10timesWaiting Time; 15s;(Initilal); 10minADC Read; 94sampling T.Const.;TCX;3.03s;TCS;3.13s
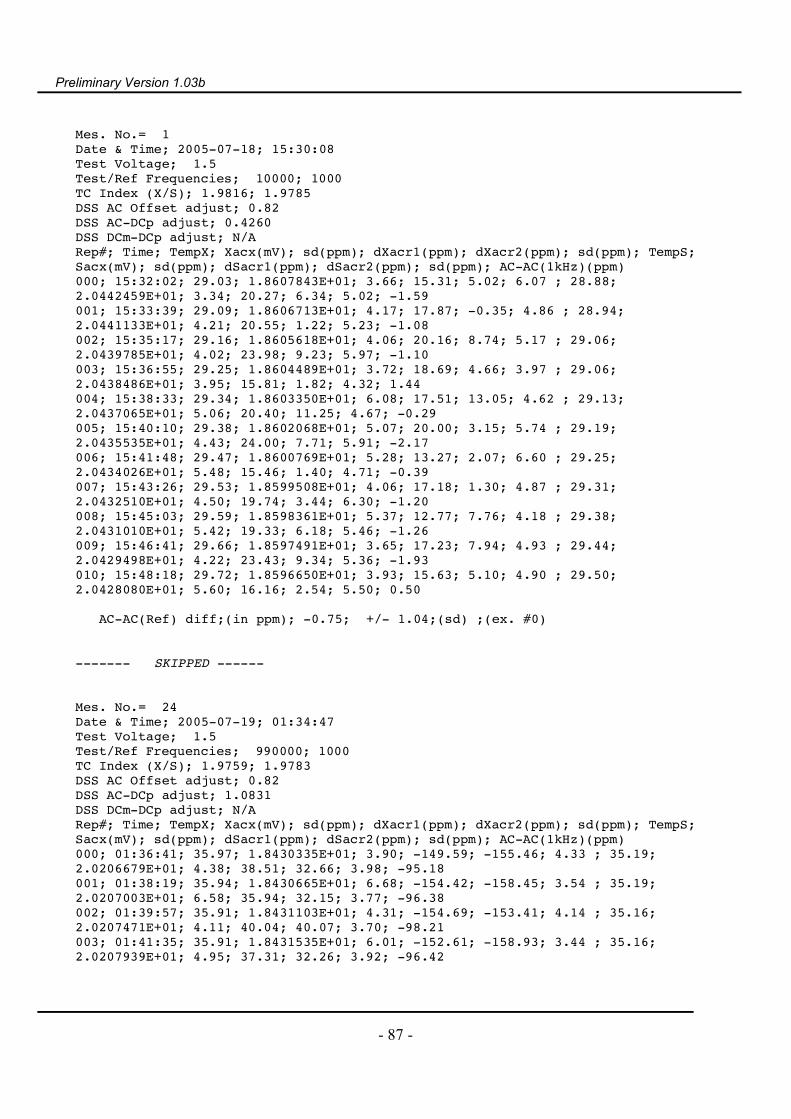
Preliminary Version 1.03b
- 87 -
Mes. No.= 1Date & Time; 2005-07-18; 15:30:08Test Voltage; 1.5Test/Ref Frequencies; 10000; 1000TC Index (X/S); 1.9816; 1.9785DSS AC Offset adjust; 0.82DSS AC-DCp adjust; 0.4260DSS DCm-DCp adjust; N/ARep#; Time; TempX; Xacx(mV); sd(ppm); dXacr1(ppm); dXacr2(ppm); sd(ppm); TempS;Sacx(mV); sd(ppm); dSacr1(ppm); dSacr2(ppm); sd(ppm); AC-AC(1kHz)(ppm)000; 15:32:02; 29.03; 1.8607843E+01; 3.66; 15.31; 5.02; 6.07 ; 28.88;2.0442459E+01; 3.34; 20.27; 6.34; 5.02; -1.59001; 15:33:39; 29.09; 1.8606713E+01; 4.17; 17.87; -0.35; 4.86 ; 28.94;2.0441133E+01; 4.21; 20.55; 1.22; 5.23; -1.08002; 15:35:17; 29.16; 1.8605618E+01; 4.06; 20.16; 8.74; 5.17 ; 29.06;2.0439785E+01; 4.02; 23.98; 9.23; 5.97; -1.10003; 15:36:55; 29.25; 1.8604489E+01; 3.72; 18.69; 4.66; 3.97 ; 29.06;2.0438486E+01; 3.95; 15.81; 1.82; 4.32; 1.44004; 15:38:33; 29.34; 1.8603350E+01; 6.08; 17.51; 13.05; 4.62 ; 29.13;2.0437065E+01; 5.06; 20.40; 11.25; 4.67; -0.29005; 15:40:10; 29.38; 1.8602068E+01; 5.07; 20.00; 3.15; 5.74 ; 29.19;2.0435535E+01; 4.43; 24.00; 7.71; 5.91; -2.17006; 15:41:48; 29.47; 1.8600769E+01; 5.28; 13.27; 2.07; 6.60 ; 29.25;2.0434026E+01; 5.48; 15.46; 1.40; 4.71; -0.39007; 15:43:26; 29.53; 1.8599508E+01; 4.06; 17.18; 1.30; 4.87 ; 29.31;2.0432510E+01; 4.50; 19.74; 3.44; 6.30; -1.20008; 15:45:03; 29.59; 1.8598361E+01; 5.37; 12.77; 7.76; 4.18 ; 29.38;2.0431010E+01; 5.42; 19.33; 6.18; 5.46; -1.26009; 15:46:41; 29.66; 1.8597491E+01; 3.65; 17.23; 7.94; 4.93 ; 29.44;2.0429498E+01; 4.22; 23.43; 9.34; 5.36; -1.93010; 15:48:18; 29.72; 1.8596650E+01; 3.93; 15.63; 5.10; 4.90 ; 29.50;2.0428080E+01; 5.60; 16.16; 2.54; 5.50; 0.50
AC-AC(Ref) diff;(in ppm); -0.75; +/- 1.04;(sd) ;(ex. #0)
------- SKIPPED ------
Mes. No.= 24Date & Time; 2005-07-19; 01:34:47Test Voltage; 1.5Test/Ref Frequencies; 990000; 1000TC Index (X/S); 1.9759; 1.9783DSS AC Offset adjust; 0.82DSS AC-DCp adjust; 1.0831DSS DCm-DCp adjust; N/ARep#; Time; TempX; Xacx(mV); sd(ppm); dXacr1(ppm); dXacr2(ppm); sd(ppm); TempS;Sacx(mV); sd(ppm); dSacr1(ppm); dSacr2(ppm); sd(ppm); AC-AC(1kHz)(ppm)000; 01:36:41; 35.97; 1.8430335E+01; 3.90; -149.59; -155.46; 4.33 ; 35.19;2.0206679E+01; 4.38; 38.51; 32.66; 3.98; -95.18001; 01:38:19; 35.94; 1.8430665E+01; 6.68; -154.42; -158.45; 3.54 ; 35.19;2.0207003E+01; 6.58; 35.94; 32.15; 3.77; -96.38002; 01:39:57; 35.91; 1.8431103E+01; 4.31; -154.69; -153.41; 4.14 ; 35.16;2.0207471E+01; 4.11; 40.04; 40.07; 3.70; -98.21003; 01:41:35; 35.91; 1.8431535E+01; 6.01; -152.61; -158.93; 3.44 ; 35.16;2.0207939E+01; 4.95; 37.31; 32.26; 3.92; -96.42
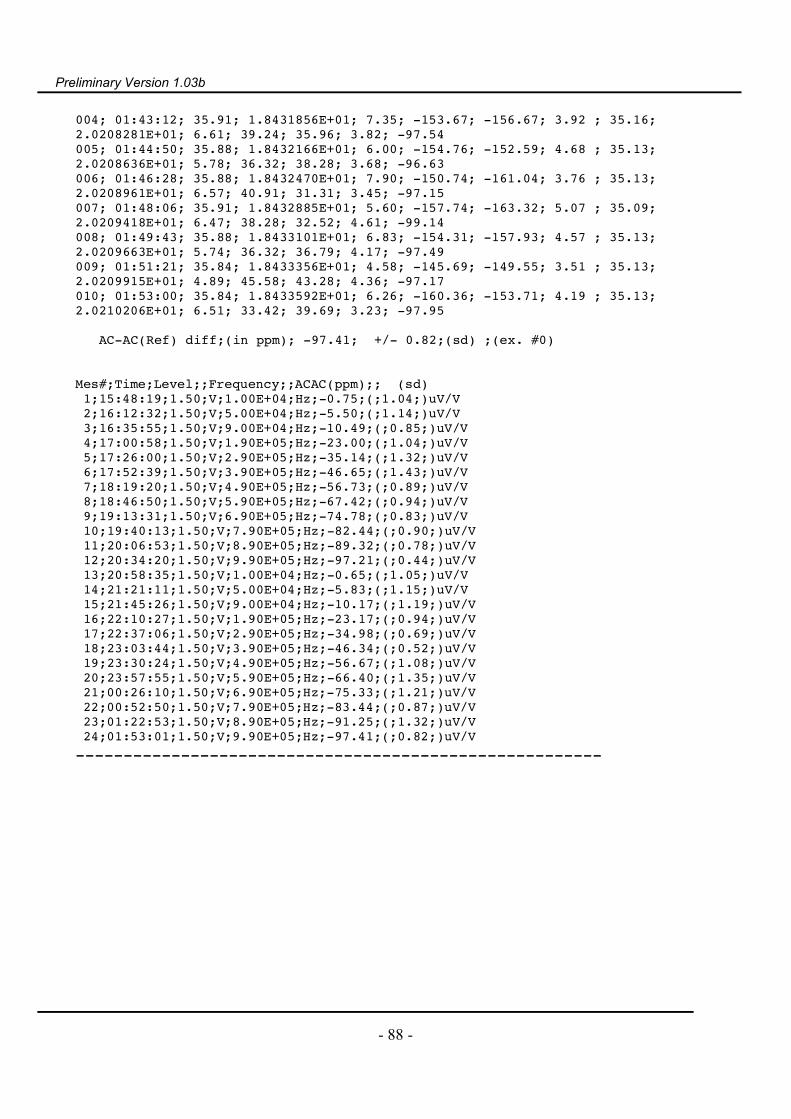
Preliminary Version 1.03b
- 88 -
004; 01:43:12; 35.91; 1.8431856E+01; 7.35; -153.67; -156.67; 3.92 ; 35.16;2.0208281E+01; 6.61; 39.24; 35.96; 3.82; -97.54005; 01:44:50; 35.88; 1.8432166E+01; 6.00; -154.76; -152.59; 4.68 ; 35.13;2.0208636E+01; 5.78; 36.32; 38.28; 3.68; -96.63006; 01:46:28; 35.88; 1.8432470E+01; 7.90; -150.74; -161.04; 3.76 ; 35.13;2.0208961E+01; 6.57; 40.91; 31.31; 3.45; -97.15007; 01:48:06; 35.91; 1.8432885E+01; 5.60; -157.74; -163.32; 5.07 ; 35.09;2.0209418E+01; 6.47; 38.28; 32.52; 4.61; -99.14008; 01:49:43; 35.88; 1.8433101E+01; 6.83; -154.31; -157.93; 4.57 ; 35.13;2.0209663E+01; 5.74; 36.32; 36.79; 4.17; -97.49009; 01:51:21; 35.84; 1.8433356E+01; 4.58; -145.69; -149.55; 3.51 ; 35.13;2.0209915E+01; 4.89; 45.58; 43.28; 4.36; -97.17010; 01:53:00; 35.84; 1.8433592E+01; 6.26; -160.36; -153.71; 4.19 ; 35.13;2.0210206E+01; 6.51; 33.42; 39.69; 3.23; -97.95
AC-AC(Ref) diff;(in ppm); -97.41; +/- 0.82;(sd) ;(ex. #0)
Mes#;Time;Level;;Frequency;;ACAC(ppm);; (sd) 1;15:48:19;1.50;V;1.00E+04;Hz;-0.75;(;1.04;)uV/V 2;16:12:32;1.50;V;5.00E+04;Hz;-5.50;(;1.14;)uV/V 3;16:35:55;1.50;V;9.00E+04;Hz;-10.49;(;0.85;)uV/V 4;17:00:58;1.50;V;1.90E+05;Hz;-23.00;(;1.04;)uV/V 5;17:26:00;1.50;V;2.90E+05;Hz;-35.14;(;1.32;)uV/V 6;17:52:39;1.50;V;3.90E+05;Hz;-46.65;(;1.43;)uV/V 7;18:19:20;1.50;V;4.90E+05;Hz;-56.73;(;0.89;)uV/V 8;18:46:50;1.50;V;5.90E+05;Hz;-67.42;(;0.94;)uV/V 9;19:13:31;1.50;V;6.90E+05;Hz;-74.78;(;0.83;)uV/V 10;19:40:13;1.50;V;7.90E+05;Hz;-82.44;(;0.90;)uV/V 11;20:06:53;1.50;V;8.90E+05;Hz;-89.32;(;0.78;)uV/V 12;20:34:20;1.50;V;9.90E+05;Hz;-97.21;(;0.44;)uV/V 13;20:58:35;1.50;V;1.00E+04;Hz;-0.65;(;1.05;)uV/V 14;21:21:11;1.50;V;5.00E+04;Hz;-5.83;(;1.15;)uV/V 15;21:45:26;1.50;V;9.00E+04;Hz;-10.17;(;1.19;)uV/V 16;22:10:27;1.50;V;1.90E+05;Hz;-23.17;(;0.94;)uV/V 17;22:37:06;1.50;V;2.90E+05;Hz;-34.98;(;0.69;)uV/V 18;23:03:44;1.50;V;3.90E+05;Hz;-46.34;(;0.52;)uV/V 19;23:30:24;1.50;V;4.90E+05;Hz;-56.67;(;1.08;)uV/V 20;23:57:55;1.50;V;5.90E+05;Hz;-66.40;(;1.35;)uV/V 21;00:26:10;1.50;V;6.90E+05;Hz;-75.33;(;1.21;)uV/V 22;00:52:50;1.50;V;7.90E+05;Hz;-83.44;(;0.87;)uV/V 23;01:22:53;1.50;V;8.90E+05;Hz;-91.25;(;1.32;)uV/V 24;01:53:01;1.50;V;9.90E+05;Hz;-97.41;(;0.82;)uV/V-------------------------------------------------------