a guide to graduate study in economics: ranking economics ... · pdf filesouthern economic...
TRANSCRIPT

Southern Economic Journal 2008, 74(4). 971-996
A Guide to Graduate Study in Economics:Ranking Economics Departments by Fieldsof Expertise
Therese C. Grijalva* and Clifford Nowellf
Ph.D. programs in economics are ranked overall and by subject field. The results provideinsight to students researching graduate programs in economics in specific subject fields.Results indicate that (i) difTerences in overall research productivity measures diminish as auniversity's rank declines; (ii) a university ranked highly in a particular subject field may be theresult of a single, extremely productive faculty member; and (Hi) many programs outside thetraditional top 20 programs are ranked high in specific subject fields.
JEL Clas.siflcation: A11,A22, A23
I. Introduction
Each year, thousatids of undergraduates apply for admission to graduate schools ineconomics intending to obtain a Ph.D. Many of these students have little idea on how to choosea graduate program, and many go to an undergraduate adviser looking for advice. Prospectivegraduate students and iheir advisers have little published research to help them in the process ofchoosing what schools best match the undergraduate's skills and interests.
This study highlights many of the characteristics of departments that offer doctoraldegrees in economics and provides information on both overall productivity and productivityby subject field. This research is significant for those looking to obtain a Ph.D. in economicsbecause the choice of where to attend graduate school has been shown to be important in bothacademic and nonacademic job markets. Research into the careers of Ph.D. economists(Barbezat 1992; McMillen and Singell 1994; Stock and Alston 2000; Siegfried and Stock 2004)consistently indicates that graduates from top-rated schools fare better in academic andnonacademic job markets than their peers from lower-ranked programs.
Based on the finding that the quality of the school influences outcomes in the job market,the best advice for those applying to graduate school in economics may simply be to apply tothe best schools to which you will likely be admitted. Yet this advice is of little valtie for thosewho are unlikely to be admitted into a top program yet have a strong interest in one of themany subject fields of economics and a strong desire to pursue a particular field. This group ofstudents is left getting advice from an undergraduate adviser who cannot be expected to know
• Department of Economics. Weber Slate University, Ogden, UT 84408-3807, USA; E-mail [email protected];corresiwnding author.
t Department of Economics. Weber Stale University. Ogden. UT 84408-3807, USA; E-mail [email protected] in data gathering was provided by Adrienne Strong.Received January 2007; accepted August 2007,
971

972 Therese C. Grijalva and Clifford Nowell
the strengths of economics departments across the country or to search the Web pages of all theprograms that offer a Ph.D. looking for clues as to what school is the best match.
In this article, we provide information to undergraduate students and their advisers on theresearch strengths of 129 economics departments that offer Ph.D, degrees in the United Statesand to identify schools that are ranked highly in the many different subject fields of economics.This article should also provide guidance to departments hiring new Ph.D. candidates within aspecific field and to job candidates looking for information on potential academic employers.
This article ditTers from the many papers ranking the quality of economics departments byidentifying the relative strength of all Ph.D. programs and by specifically providing informationon all the major subject fields in economics. Although Tschirhart (1989) ranks departments infields of expertise, only a limited set of fields is identified, and departments are ranked usingdata that are now over 20 years old. U.S. News and World Report^ also provides a ranking ofeconomics departments by field. Their ranking is based on survey responses of departmentchairs who were asked to rank all departments on a five-point scale. Department rankings byfield can also be found on the EconPhd.net website (http://www.econphd.net)- This site ranksdepartments by field, using publications in 63 highly ranked economics journals during the1993-2003 period. The data we used as the basis for this article are more comprehensive andcover a larger time frame. We used all journals in which economists at the Ph.D.-grantinginstitutions in the United States had published during a 20-year period. Our data set consists ofpublications in 254 journals over the 20-year period 1985-2004. This analysis provides by farthe most detailed, complete ranking of departments by field in the literature.
In addition to simply identifying the top 20 schools in each field, other information, notfound elsewhere, is provided on the relative importance of the field at the school and how thescholarly output is distributed across the department's faculty. To measure the concentration offaculty in a field, we calculate a Herfindahl-Hirschman Index (HHI). The HHI is particularlyimportant for an undergraduate to consider. Planning to obtain a Ph.D. from a school in hopes ofstudying with a single person is a risky undertaking not only because the faculty member maymove but also because any single faculty member can mentor only a limited number of students.
We recognize that ranking departments is fraught with danger. Thursby (2000) haspointed out that using single measures of department productivity suggests differences betweenmany departments that are meaningless, a finding we reiterate when solely aggregate measuresof performance are used. However, by providing detailed information on departments by fieldand by identifying the publication patterns of the faculty within the field, we are able tohighlight some differences that aggregate measures gloss over.
2. Methods
Similar to Tschirhart (1989), the data-gathering stage consists of four basic steps: (i)identifying all Ph.D.-granting institutions in economics as of the 2004 spring semester,' (ii)identifying all tenure-track or tenured faculty as of the 2004 spring semester, (iii) acquiring a listof faculty publications, and (iv) determining the quality of each publication.
' Available al http://www.usnews.com/usnews/edu/grad/rankings/phdhuni/phdhumindex3rier.php (July 2007).^ Departments offering doctorates in agricultural economics were not included in the analysis.

Ranking Economics Departments by Fields 973
To identify the universities offering doctoral degrees in economics, we used the websiteniainiained by the University of Albany.^ This site contained a list of all economicsdepartments with Ph.D. programs at American and Canadian universities and was verified withPetersons Guide lo Graduate Schools.'^ Based on this, we identified 129 programs located in theUnited States that offered doctoral degrees in economics as of the spring of 2004.
The second step, identifying all tenure-track or tenured faculty for each university, wasaccomplished by accessing economics department Web sites. A slight shortcoming of thisapproach is that faculty lists are highly dependent on whether a department maintains andupdates their faculty lists. Removing faculty members without any publications resuhed in over2600 faculty names. In the few cases where faculty appeared on multiple department websites,we included the faculty member in the department where he or she had a permanent andcurrent affiliation. We recognize that there are some faculty who are members of a departmentother than economics (e.g., the Department of Managerial Economics and Decision Sciences atNorthwestern University) yet contribute to the education of graduate students and areproductive in the field of economics. Determining who these faculty are and the extent to whichthey are involved in the economics department made it impractical to include them in theanalysis.
The third step focused on acquiring journal publications for each faculty member listed inthe Journal of Economic Literature database Econlil. The database was queried for thepublications of tenure-track faculty identified by the 129 departments. Faculty were droppedfrom the analysis if Econlit indicated that they had no published articles. This study focused onarticles published between 1985 and 2004. Over this time period, Econlit cataloged over 38,000publications of faculty who were employed in Ph.D. economics programs as of the spring of2004.^ Further, Econlit provided four essential pieces of information that would be needed foranalysis: (i) article source, (ii) page numbers, (iii) number of authors, and (iv) Journal ofEconomic Literature subject codes. The article source would be needed in order to assess thequahty of the article. The credit each author received for a publication was weighted by thenumber of authors and page length. The greater the number of coauthors, the less creditassigned to each coauthor, and the greater the length of the article, the greater the creditassigned to each coauthor.'' The subject codes would be needed to sort articles by a field ofexpertise.
The final step was assigning a quality index, Qj, to each journal. We used both the impactfactors published in the 2004 Social Science Citation Index (SSCI scores) and rankings based on"citations per character in 1990" for articles published between 1985 and 1989 (JEL scores)proposed by Laband and Piette (1994)7 Many publications contained at least one or both anSSCI and a JEL score. There were 107 journals containing both an SSCI and a JEL score.There were an additional 131 with only an SSCT score and an additional 16 with only a JELscore. Thus, the total number of journals indexed in the SSCI that we used in our analysis was238. and the total number of journals indexed in the JEL that we used in our analysis was 123.
' Available at http://www.albaiiy,cdu/econ/eco_phds.htnil (July 2007).* Available at http://www.petcrsoiis.com/graduate_home.asp?path=gr.home (July 2007).
Coiiuthors listed as "et al." rather than by name in Econlit are not identified specifically by Econlit.Articles with four or more authors or in articles where coauthors are nol specifically identified (i.e.. cl al.) are treated ashaving four authors.
' Analternativctousingimpact factors is to use total citations per journal per year. We chose to use impact factors to beconsistent with past research (e.g.. see Tschirhart 1989).
974 Therese C. Grijaha and Clifford Nowell
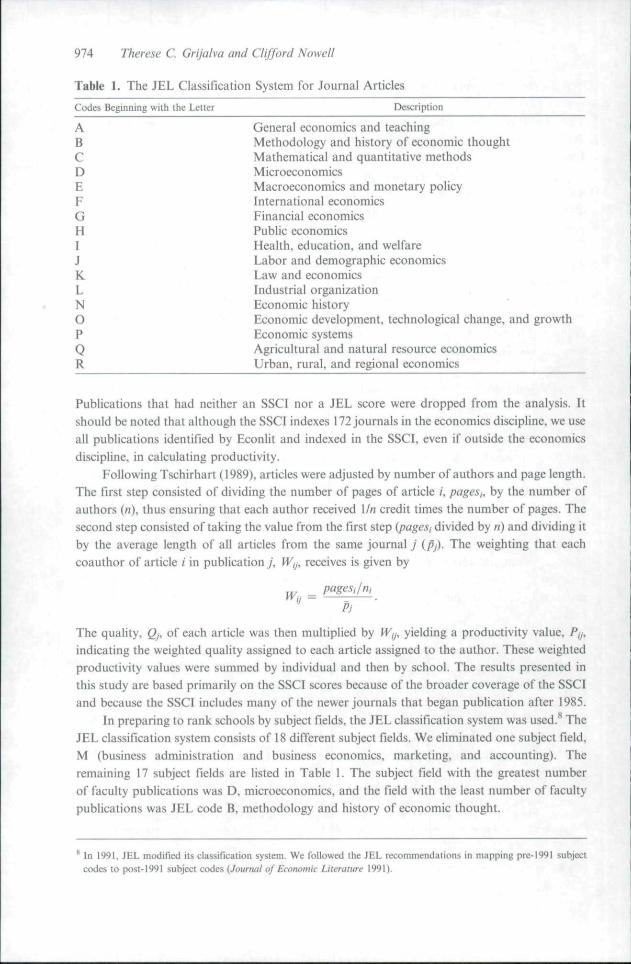
Table 1. The JEL Classification System for Journal Articles
Codes Beginning wilh the Letter Description
A General economics and teachingB Methodology and history of economic thoughtC Mathematical and quantitative methodsD MicroeconomicsE Macroeconomics and monetary policyF International economicsG Financial economicsH Public economicsI Health, education, and welfareJ Labor and demographic economicsK Law and economicsL Industrial organizationN Economic historyO Economic development, technological change, and growthP Economic systemsQ Agricultural and natural resource ecotiomicsR Urban, rural, and regional economics
Publications that had neither an SSCI nor a JEL score were dropped from the analysis. Itshould be noted that although the SSCI indexes 172 journals in the economics discipline, we useall publications identified by Econlit and indexed in the SSCI, even if outside the economicsdiscipline, in calculating productivity.
Following Tschirharl (1989), articles were adjusted by number of authors and page length.The first step consisted of dividing the number of pages of article /, pagesi., by the number ofauthors («), thus ensuring that each author received l//i credit times the number of pages. Thesecond step consisted of taking the value from the first step {pageSj divided by n) and dividing itby the average length of all articles frotn the same journal j (pj). The weighting that eachcoauthor of article / in publication j , W,j, receives is given by
_ pagesi/mVVjj — _ .
Pj
The quality, Qj, of each article was then multiplied by Wjj, yielding a productivity value, Fy,indicating the weighted quality assigned to each article assigned to the author. These weightedproductivity values were summed by individual and then by school. The results presented inthis study are based primarily on the SSCI scores because of the broader coverage of the SSCIand because the SSCI includes many ofthe newer journals that began publication after 1985.
In preparing to rank schools by subject fields, the JEL classification system was used.^ TheJEL classification system consists of 18 different subject fields. We eliminated one subject field.M {business administration and business economics, marketing, and accounting). Theremaining 17 subject fields are listed in Table 1. The subject field with the greatest numberof faculty publications was D, microeconomics, and the field with the least number of facultypublicatiotis was JEL code B, methodology and history of economic thought.
In 1991. JEL modified its classification system. We followed the JEL recommendations in mapping pre-1991 subjectcodes to post-1991 subject eodes {Journal of Economic Literature 1991),

Ranking Economics Departments by Eields 975
3. Results
After gathering and cleaning the data and making the previously mentioned calculations,rankings are computed. The results are presented in Tables 2 and 3.
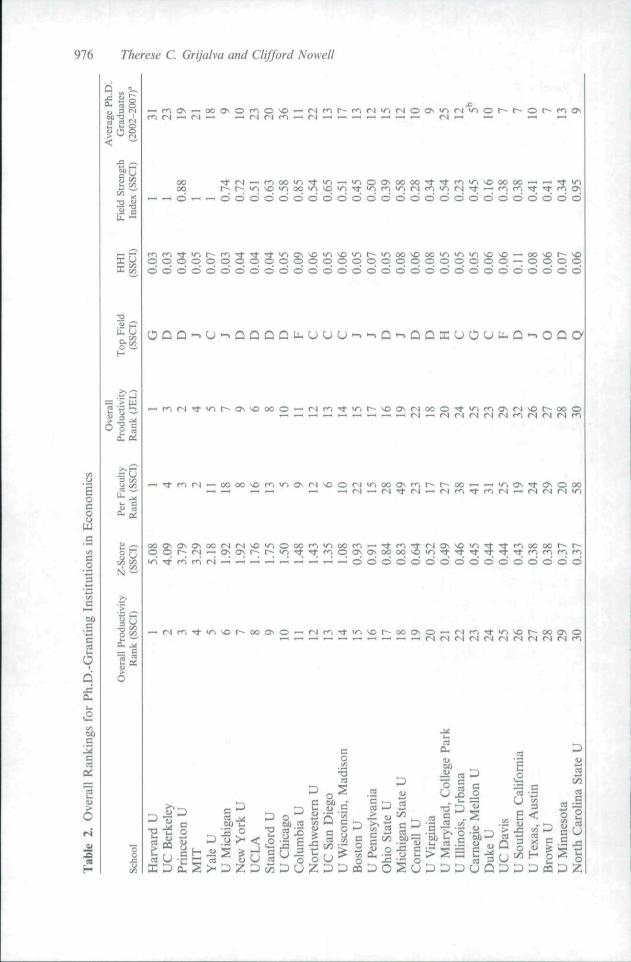
The second column of Table 2 provides the overall productivity rank of all 129departments. This ranking was computed by summing Fy for each university, with the topuniversity having the greatest overall productivity sum. Although it is similar to rankings foundin Graves, Marchatid, and Thompson (1982) and Dusansky and Vernon (1998), somedilTerences are apparent. These differences can be attributed to the difference in time periodsanalyzed, the inclusion of all articles listed in Econlit rather than a subset, and the use of theSSCI for the quality index.
The third column in Table 2. "Z-Score," indicates the number of standard deviationsthe school's productivity rank is above or below the mean productivity rank. Only 44 of the129 schools have a positive Z-score, indicating that the distribution of overall productivity isskewed to the right, A noticeable feature of this skewness is that distinction between schoolsdiminishes as the rank declines. For example, the top-ranked school. Harvard, has a Z-scoreof 5.08, and the fifth-ranked school, Yale, has a Z-score of 2.18. a substantial difference.However, as we move lower in the rankings, the 70th-ranked school, the University ofMassachusetts, has a Z-score of -0.43, and the 80th-ranked school, the University ofDelaware, has a Z-score of -0.50, a very small difference. The ordinal rankings presented inmuch of the literature that ranks economics departments miss the fact that helow arelatively small group of top programs, the differences in aggregate productivity becomefairly small.
The fourth column of Table 2, "Per Faculty Rank," shows how each school ranks whentheir total productivity sum is divided by the number of publishing faculty within thedepartment; it represents the average productivity of publishing faculty in a department andinay be the best indicator of the quality of the faculty for potential graduate students. Forexample, the California Institute of Technology has an overall rank of 38 and an average rankof 7. suggesting that the lower overall rank of the department is greatly influenced by thesmaller size of the department and not due to the productivity of each publishing facultymember. A student attending this institution would likely obtain an education from "top 10"faculty even though the relatively small department size dampens the overall productivityranking. The fifth column of Table 2 indicates the overall productivity ranking of departmentsbased on the journal rankings of Laband and Piette (1994) that appeared in the Journal ofEconomic Literature. Notice that rankings using the SSCI or those calculated by Laband andPiette (1994) identify the same top 10 schools, and there is only one difTerence in the top 20schools.
The sixth column of Table 2, "Top Field." indicates each department's best subject field.Top field was determined by summing each department's productivity for each JEL category,using the first JEL code identified by the author as a guide and then choosing the subject fieldwith the highest sum. The seventh column of Table 2 shows the HHI for each school. The HHIis typically used to tneasure the degree of market concentration for a particular industry. In thisstudy, the HHI provides information on how concentrated the research is among the number offaculty publishing in the department. The HHI is found by squaring the faculty member's shareof the department's total productivity and then summing the results:
976 Therese C. Grijaha and Clifford Nowell
olUIO
c8c
ons
*3=3
* - •
C
a
ran
0d
g
1aPi
1
6ri
nt-
ciPh
.ublR
Ave
ive
ra
O
ates
a
6
00
a
XX
12u
•£
oH
ity
>
1"2
£
Ity
• F
ac
ua.
-Sco
i
N
vitv
•n
oduc
cC
eral
O
.,
007
( N
o
1UOD^
W• a
• ^
G
u
Jr j j—1
uw
3
SSC
I
•—'
^-
SSC
I
ciS
"oo
OO
— d — — d d d d d d d d o o o o o o o o o o o o o o o o o
pppoppoppoopoooopoooooooo — oopodddddddddddddddddddddddddddddd
w-1 cr> t ON o 00<N »— <N (N (N w^
doooooooodcJodooo
I
o 'tat)
ra n n CDo - '
nl —'
uj ra
a> O
4>
^ ra D
U £ o
.5 § ^'d " ^ • —
H ^ • — QU
ra
o lc U
PZ

uccQ
U
0, M 5
in —
:i*
Ranking Economics Departments by Fields 977
— ooooooc)ooooo ooocJoocJ 0 0 0 0 0 0 0 0 0
qq — qqq — — — qqq—- q — -q — q q q o o o o — 0 0 0000000000'0000 000000000'0000000
Q - . Q UJ Q Q Q -> Q UUU->Q-^UJU-U-QLu-i
O O O O O O O O O O O O OS q q q q q — . - - ; — XlfsjcNtNfNJNfNOOOOOOOOOOOOOOCSO
I I I I I 1 I 1 I I I i I I I
?
^ "=S w
D
.S
Hop
l
iuor
tate
.S3 c
™ 0
V 52 i_i
Syra
Pent
Geo
Ji
lCo
lB
osl
j =
Tec
, _
c
rnia
1
t2
Cal
i:
2
I ^ I..i >• •£ ,sa'c: 7 - o3 S c bfl
DDO D < a:

978 Therese C Grijalva and Clifford Nowell
Q "_
[ i . —
O
=2 .i t2 g :2
•5 U
u toa. a:
o o o o o o o o o o o o'cioooo
^O^Da^CT^CT^O ^ O ^ ^ t ^ 0 ^ m D m ^ 0 ^ 0 O ^ O 0 m n m ^_ — — - H O O O — — — q — qfN — q — — ( N — - q q — --(N—'^--(N —oooooooooooooooooo'ocoooooooooo
c i o o o o o o o o o o o o o o o o o o o c J o o o o o o o o oI I I I I I I I 1 I 1 I I I I I t I I I I I I I I I I I I I

Ranking Economics Departments hy Fields 979
C
coU
0)
lonH
Qx;Q~u0re
all
Ove
r
o
0
u
-a
iel.
u.
HH
I
•n
Fiel
aH
itv
tivod
uc
a.
flU-
Per
0
N
IV] t
ydu
ct
o
u
6
.,
r i
r j
X
•a
(SSC
I)
00
UJ
ank
(
a;
uC<-1( ^
. ^
Ran
SCI
zl
;sci
cfl
ool
in
;o — po — — poopp-Hoporjo-Hoooooooooooooo'oo'ooooo'oooooooo'o
— O — - O O p — O—;
d
^ : : i ^ ^ . '^'^i^ — — — — — — o — •— — (NM —ooooooooooo'oo'ooooo'oo'oo'oooooooo
—. O __ —. o —
oooooooooooooooooooo'ooooooooooI I I > I I I I I I I I I I I I I I I i I I I I I I I I I I
s i o r o o o sO O O O O
.2}•fl
I(J
1^ CO D
u"rt
,S ;S .rt 5 fl^ = S 'c
c 2ifl
CQ
1) J3
O -1 o l
tn "2
rt ^ S -5I
S-flD^
ft l l-a 5o ^

980 Therese C. Grijaha and Clifford Nowell
a. g 5
go
' < j
u
.=: -J=5 .i W
|1
3c«£ "IT
c
— O O O O O — , O O Ooooooooooo
o o o o o o o o o o
ooooooooooI I I I I I I I I I
o —
pcj—1
IU
1/5
the
3
0coE1)
u
p
o J2 J2 oZ U P U a.
<ua
«^
3 «(N
^ Oi
U El i^ k.
ra ^ -o
s d
_M t .
II

Ranking Economics Departments by Fields 981
do«
he
3a
tor
1 30u
—I
T34>
IU• " *
u
ao
X)
LL.
CQ
* ^ J N " ^ — * o%* < n r ^ * vocT^•l^ o o ^ > n > o r ^ * t ^ * o ^ t ~ ~ o ^ o o r ^ l » 00ONin t~^ fN >noo ONin m c N m r - - O N t ^ t ^ ^ c ".D
o ^ rs 00N
— o * *
m o O ^ t~-(N (N in (N 00
inoot^oorn^in^inrN
•^ — m t^ M
— * O (N
^ O O ' ' ^ ' N O N ( N C N— rN(N«n in<n<N X-oorn
m * o r M ^ r o r n ^ t n r M t ^ o o r ^m ON<N — S r ~ - i n o \ o \ m t - - ' *
• 1
^ O m m m ox> — <NNO —
— * 000
^ Q N — in 00 — —
— - f N o o ON
00 — — - * P*
c
men
c
0Si*-•
rizo
n
00
=a
3 n n
c_o
Mel
neg
.1—
0>-
z<.—0D
u
3•0Kl
c0
oou
U l
6 5
a>
(A -^o .2
-O Xi
2 ao 3
1
= p
E
o c
rtD ra rt 5, : : ;—,—
« a u ( D a j . 2 ^ ' 2-a . r i DOOOoDDOrt c-
t c o o o o C gL ^ U - O O O O E X
«c.2c
D«
rt
0

982 Therese C. Grijalva and Clifford Nowell
O
o
o—•*
r~-o>noot— oor-i3 o m ^ n t N O
o * * in*
3 OOOO —0(NOooa^C7N —
— ON —
— r ^ * * t- * -^0 * o o o o o o — O N * -noooo t-- r- r- ' ^ — NO
f n T t r s o( N r - i o —
r-* NO* * *
*-, ^no^or-(Noo•^r-•^|^ lnoo —
CT<fnO- — CT^ON
- oo>n
[ n n o C T— — ( N ^ O O
ONOO (N — — ro — — o r — C^l— \£)oO —
r r * o p n ^- O N O O
- ON — * — * * < n m — *r r f N
t O
O DI D
u
njC
O O O O
Pu
H
o rt eo) c "z: ^•2 r (u c b
m 00 (N
IIrt O
bO —3 ""•
OOUl
CQ>d
3 OCQ
z zD

Ranking Economics Departtnents by Fields 983
oU
a mOoo — moo
O — o o o o o * r - j *
C O * - ^
n OS— \ O o o o
O r ' i * —f
r^\or-t--oo
* * — *
o — ro^-m O £
(NO —
O s ^ O O O O s— or— 0*^00
r M O n
>nr-oor~-r--osor— (NOOOOOO
^ o o o O O O v u i oooovwir—osw^oo —
O f o O ^ M o— (Noooor— r-i — H-I\D SO
— * o o * N— O00s*'nr<ll—
T t
Du
2o
E ca CO
H f-< < < <
J i < I 2 Q COC u •-
— -J CC C/D C/)
6 .y <u
i 5 =o ^ ^ 'O 'O
=3 C CttJ fl O • = - = CO (U
UUUUUUUU
984 Therese C. Grijalva and Clifford Nowell
a
o
r~~ r> * ONTJ-* OS* mr- iONm* minso m o j •«• moNONfs o
mON
00 •—• m <-< so m * ON r- r- *r - ON
# C?N Tf00 OO
00 — »O
* OlOl
m CT * mi n —« CTi
m* oo» m r - * * * •ijso* fnoo — — o »OJ 'O OO ^ - ( ^ inr*^i^sooo
o — o o i n ^ t * i n * »noo* O N ' ^ o i r o o s o f O *r^ m yr> r— •—• r ooo ^^r-'Soso^^rooN —'m — m
O * » *r^oooooo
o ^ m i m O N— r~-somoo —
* » o — r s * * •^ * * * ^ ^ * -^ m t - OO so
— — o o o o *O TTOO
o i i m o o- — >no
ON — — r - o \ o m — oomoO O
moo—' —
o r -
O OJ *OJ O]
so *so in
OJONSO
S3
a.u
"oU-a«
2 U
cOO
o1 / :
r -
ipp
intn
' u i
_3
u
ri. '
3Oryiin
a
' u3Oi/i(/>
oocra
raJ 3
x:
a Ji ^
1> -C O in
i ; ra 60 c
Z O O (X
rt
ra J?
lin
alii
u E
3 3o o
ille
>Xo
C X
1-H t-H
O 3
C C
o oi i r ra -S2 .S2
01}d
•5b
>5 DDD DP D D D D P
Ranking Economics Departments by Fields 985
— o «
m o o j— o o •*
o t ^ • ^ OS r—so ro ro so r-
— O N S O O O O O
j o i o c r oo j o i o o —
sooo — r - m * o r - r -t t m r- 00 00 00 in
.ao
ara
c c —O O !
• 5 b '
S

986 Therese C. Grifalva and Clifford Nowell
where s represents the productivity share of the /th faculty member. Vahies for the index canrange from 0 to 1, depending on the distribution of publication patterns across the faculty atthe school. A value of 1.0 indicates that all the publications result from a single individual., anda value of 0 implies that the publications are spread equally among the faculty in the area.^
The eighth column of Table 2, "Field Strength Index," demonstrates how well eachdepartment does in its top field relative to the department that is the number one rank in thatparticular field. For example, Harvard's top field is financial economics, and it is the top-ranked department in fmancial economics; hence. Harvard has a field strength index of I.O.Princeton University's top field is microeconomics (JEL code D), although its field strengthindex in microeconomics is 0.88, indicating that it produces 88% of the research of the top-ranked school in the microeconomics category.'" It is important to note that some universitiesmay not offer a field in their top field (see footnotes for Table 2). Finally, the last column ofTable 2, "Average Ph.D. Graduates (2002-2007)," provides information on the size of eachprogram, and is included to provide additional information to potential applicants." Asignificant portion of graduate education is obtained from one's classmates. As such, this figureprovides information regarding the activity level of the graduate education within adepartment. A department may have many productive scholars but may not be a,s activelyengaged in its graduate education.
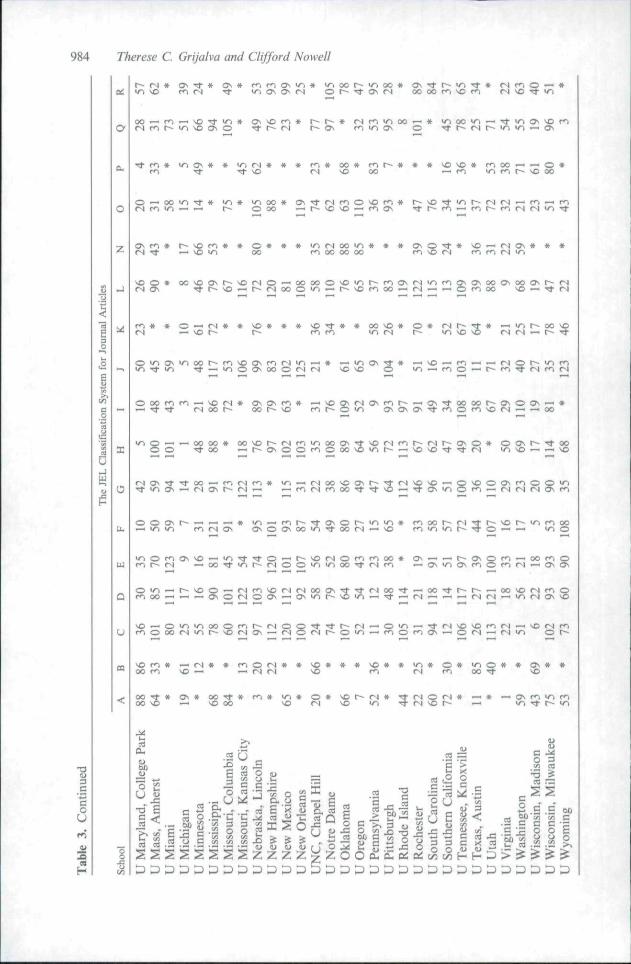
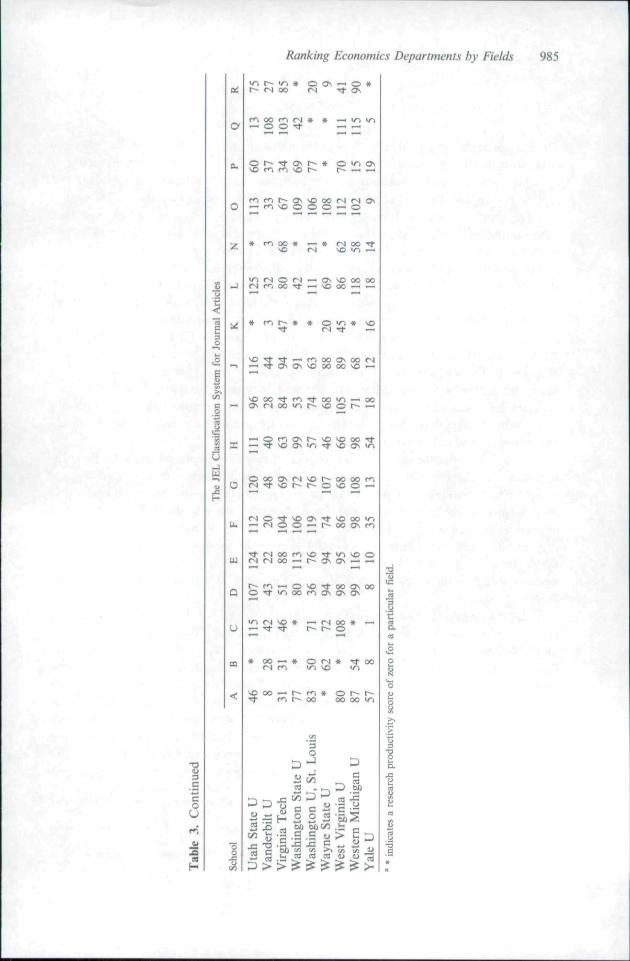
Table 3 identifies the field rankings for each of the 129 departments using the first JELcode identified by the author. All articles were assigned to a field on the basis of the assumptionthat the first JEL code listed represents the primary subject field of the article. Once an articlewas categorized, the productivity value for each article. F,,, was summed by subject anduniversity, yielding a total productivity score within a particular field for a particulardepartment. While this information is useful to potential graduate students and others, itshould be noted that not all fields are offered at each university. Thus, potential graduatestudents should confirm that a field of interest is available at a particular university beforeapplying.
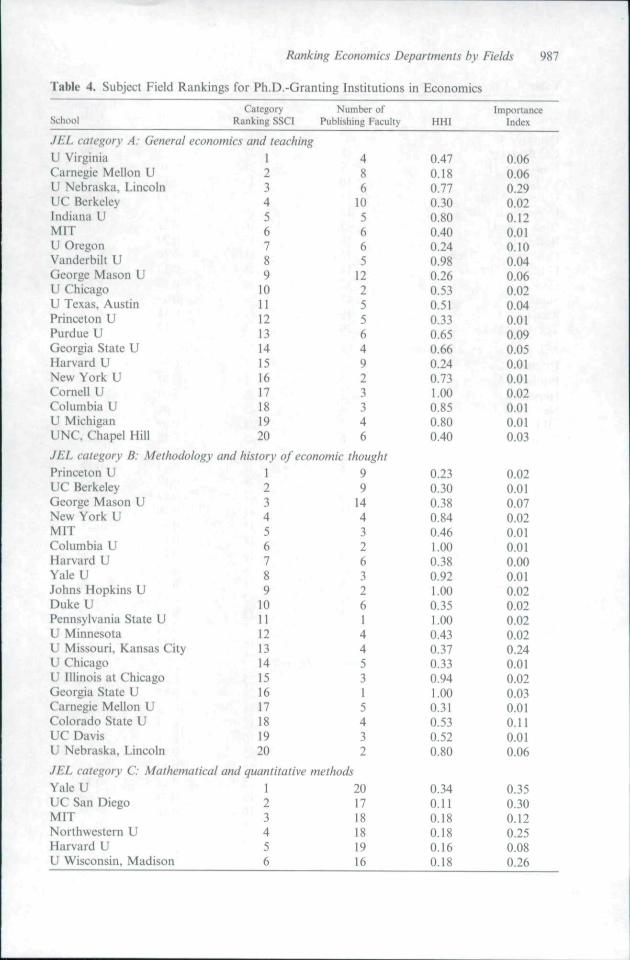
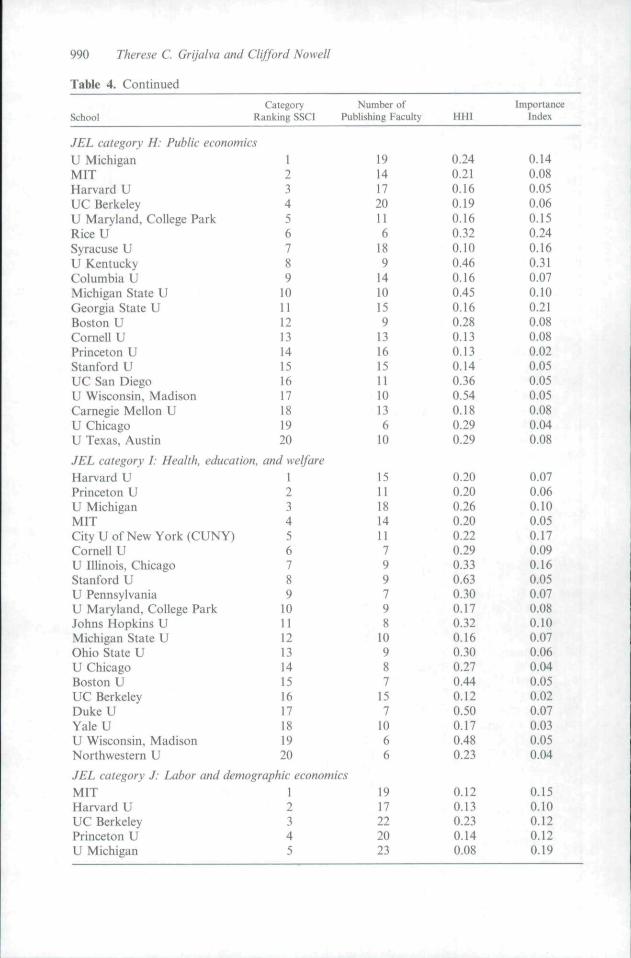
Table 4 identifies the top 20 schools in each field. This table also identifies the number offaculty in each school who publish in the field regardless of where they publish or whether thejournal is listed in the SSCI. Table 4 also shows the HHI for each of the top 20 schools in thefield. For example, referring to Carnegie Mellon University, the value for the HHI in generaleconomics and teaching (JEL subject code A) is 0,18. whereas for Cornell University the HHI is1.0. At Carnegie Mellon, publication in this field is spread out among the eight members of thefaculty who publish in this area. At Cornell, however, all the publications listed in SSCI areattributed to a single faculty member. (Although at Cornell, three people have published in thisarea, only one person has published in journals listed in the SSCI.) As another example, for
' It should be noted that in ihe case of an HHI of 1.0, more than one faculty member may publish in this area, yetbecause other faculty members" publications may not be indexed in the SSCI, they are nol recognized in our data ascontributing to the department's research productivity.
"* The field strength index measures only ihe department's relative productivity in its top field. It is possible that adepartment has a higher field strength raling in a Held other than ils top Fieid.
" These data were acquired by calling and e-mailing the graduate advisers or the department administrators at eachuniversity. In some cases, multiple attempts were made to contact the department and acquire this infonnation.
Ranking Economics Departments hy Fields 987
Table 4. Subject Field Rankings for Ph.D.-Granting Institutions in Economics
SchoolCategory
Ranking SSCI
JEL category A: General economics and leachingU VirginiaCarnegie Mellon \JU Nebraska, LincolnUC BerkeleyIndiana UMITU OregonVanderbilt UGeorge Mason UU ChicagoU Texas. AustinPrinceton UPurdue UGeorgia State UHarvard UNew York UCornell UColumbia UU MichiganUNC. Chapel Hill
JEL category B: Methodolog)Princeton UUC BerkeleyGeorge Mason UNew York UMITColumbia UHarvard UYale UJohns Hopkins UDuke UPennsylvania State UU MinnesotaU Missouri, Kansas CityU ChicagoU Illinois at ChicagoGeorgia State UCarnegie Mellon UColorado State UUC DavisU Nebraska, Lincoln
123456789
1011121314151617181920
Number ofPublishing Faculty
486
105665
1225564923346
; and history of economic thought123456789
1011121314151617181920
99
1443263261445315432
JEL category C: Mathematical and quantitative methodsYaleUUC San DiegoMITNorthwestern UHarvard UU Wisconsin. Madison
123456
201718181916
HHI
0.470.180.770.300.800.400.240.980.260.530.510330.650.660.240.73i.000.850.800.40
0.230.300.380.840.46LOO0.380.921.000.351.000.430.370.330.94LOO0.310.530.520.80
0.340.110.180.180.160.18
ImportanceIndex
0.060.060.290.020.120.010.100.040.060.020.04 '0.010.090.050.01 ;0.010.02 .0.010.010.03
0.020.010.070.020.010.010.000.010.020.020.020.020.240.010.020.030.010.110.010.06
0.350.300.120.250.080.26

988 Therese C. Grijalva and Clifford Nowell
Table 4. Continued
School
Princeton UUC BerkeleyNew York UUCLAU PennsylvaniaU Southern CaliforniaOhio State UBoston UCalifornia Inst TechU Illinois, UrbanaCornell UStanford URiceUTexas A&M U
CategoryRanking SSCI
789
1011121314151617181920
JEL category D: MicroeconomicsUC BerkeleyPrinceton UHarvard UNew York UMITStanford UU ChicagoYale UUCLANorthwestern UCalifornia Inst TechU PennsylvaniaOhio State UU Southern CaliforniaJohns Hopkins UU MinnesotaU MichiganU VirginiaBoston UColumbia U
123456789
10
n121314151617181920
Number ofPublishing Faculty
2422212317101615U1813191114
352828252!2524282622111518169
1527131719
JEL category E: Macroeconomics and monetary policyHarvard UPrinceton UUC BerkeleyMITNorthwestern UColumbia UNew York UUCLAU MichiganYale UBoston UUC San DiegoJohns Hopkins U
123456789
10111213
2520181210151615191611137
HHI
0.090.130.100.120.130.180.290.240.260.140.170.090.180.17
0.060.070.070.080.09O.IO0.090.070.110.110.190.100.140.180.270.120.070.150.110.19
0.080.120.170.240.210.190.120.120.090.180.220.250.42
ImportanceIndex
0.090.090.160.130.180.220.150.130.250.170.160.090.280.27
0.170.150.100.230.130.220.210.170.170.180.420.210.210.260.290.26O.Il0.200.150.11
0.120.150.110.110.160.150.130.110.090.090.130.100.19

Ranking Economics Departments by Fields 989
Table 4. Continued
School
Stanford UUC DavisU MinnesotaOhio State UU Wisconsin, MadisonU RochesterGeorgetown U
CategoryRanking SSCI
14IS1617181920
JEL category F: International economicsPrinceton UHarvard UColumbia UUC BerkeleyU Wisconsin, MadisonUCLAU MichiganUC DavisStanford UU Maryland, College ParkUC Santa CruzU Colorado. BoulderUC San DiegoNew York UU PennsylvaniaU VirginiaU WashingtonGeorgetown UDuke UVanderbilt U
123456789
10XI121314151617181920
JEL category G: Financial economicsHarvard UPrinceton UCarnegie Mellon UU ChicagoMITUC San DiegoUC BerkeleyNew York UStanford UOhio State UU Illinois, UrbanaColumbia UYaleUU MichiganDuke UCornell UUC Santa BarbaraUCLACity U of New York (CUNY]U Wisconsin, Madison
1234S6789
10U12131415161718
1 1920
Number ofPublishing Facully
11131210116
12
13191616
1520
9147
12139
13769
13U12
2226
141611201110U14U15169
111217157
HHI
0.170.13
0.170.160.120.39ClMnM0.150.460.350.380.210.270.310060 400.350.350.130.180.24
0M0.12^0.160.180.26O.U0.160.180.220.210.260.220.110.180.430.350.110.230.28
ImportanceIndex
0.080.160.160.110.090.190.17
0.120.090.220.080.160.100.090.190.080.150.240.230.080.060.100.110.180.160.110.12
0.15O.Il0.330.150.07 .0.100.040.070.060.090.100.050.040.040.090.080.150.040.120.05
990 Therese C. Grijalva and Clifford Nowell
Table 4. Continued
Category Number of"School Ranking SSCI Publishing Faculty
JEL category H: Public economicsU MichiganMITHarvard UUC BerkeleyU Maryland, College ParkRice USyracuse UU KentuckyColumbia UMichigan State UGeorgia State UBoston UCornell UPrinceton UStanford UUC San DiegoU Wisconsin. MadisonCarnegie Mellon UU ChicagoU Texas, Austin
JEL category I: Health, education,Harvard UPrinceton UU MichiganMITCity U of New York (CUNY)Cornell UU Illinois, ChicagoStanford UU PennsylvaniaU Maryland, College ParkJohns Hopkins UMichigan State UOhio State UU ChicagoBoston UUC BerkeleyDukeUYaleUU Wisconsin, MadisonNorthwestern U
123456789
1011121314151617181920
and welfare123456789
1011121314151617181920
JEL category J: Labor and demographic economicsMITHarvard UUC BerkeleyPrinceton UU Michigan
12345
19141720116
189
1410159
1316151110136
10
1511181411799798
10987
157
1066
1917222023
HHI
0.240.210.160.190.160.320.100.460.160.450.160.280.130.130.140.360.540.180.290.29
0.200.200.260.200.220.290.330.630.300.170.320.160.300.270.440.120.500.170.480.23
0.120.130.230,140.08
ImportanceIndex
0.140.080.050.060.150.240.160.310.070.100.210.080.080.020.050.050.050.080.040.08
0.070.060.100.050.170.090.160.050.070.080.100.070.060.040.050.020.070.030.050.04
0.150.100.120.120.19

Ranking Economics Departments by Fields 991
Table 4. Continued
School
Michigan State UUCLAU ChicagoU PennsylvaniaBoston UU Texas, AustinYaleUNorthwestern UStanford UBrown UU South CarolinaNew York U
CategoryRanking SSCI
6789
1011121314151617
City U of New York (CUNY) 18U Illinois, ChicagoSyracuse U
1920
JEL category K: Law and economicsUC BerkeleyHarvard UVanderbilt UU ConnecticutUC San DiegoPrinceton UU ChicagoMITFlorida State UU MichiganGeorge Mason UBoston UEmory USUNY BuffaloClemson UYale ULI Wisconsin, MadisonColumbia UU AlabamaWayne State U
123456789
1011121314151617181920
JEL category L: Industrial organizationUC BerkeleyMITUCLAU ChicagoStanford UHarvard UNorthwestern UU MichiganU VirginiaBoston LIColumbia UDukeU
123456789
101112
Number ofPublishing Faculty
13201315156
1813IS116
. 17ISU16
9424284574
-. 9442
• j
' 62
'- 5 •" 4
a. -26162017219
. 191 9136
157
11
HHI
0.450.09a i 30.160.130.450.150.320.130.110.460.110.130.250.12
0.25g j 50 . ^0.450.930.170.470.34
A360.400.420.750*71fwMSSJ24
4ii6
0.ioo.n0.14^22OM0.230.140.230.21
ImportanceIndex
0.270.140.150.220.180.23O.IO0.110.100.200.600.080.270.270.21
0.02O.OI0.070.140.03O.OI0.02O.OI0.060.010.040.020.080.120.060.010.010.010.090.07
0.090.090.130.110.110.040.090.050.100.080.060.11

992 Therese C Grijalva and Clifford Nowell
Table 4. Continued
School
U Southern CaliforniaUC DavisU Illinois. UrbanaNew York UGeorgetown UYale UU Wisconsin, MadisonPrinceton U
JEL category N: EconomicUC BerkeleyHarvard UVanderbilt UMITUC DavisStanford UPrinceton URutgers UU ArizonaUCLAU Colorado, BoulderU Illinois, ChicagoColumbia UYaleUU DelawareNorthwestern UU MichiganOhio State USUNY BinghamtonNew York U
JEL category 0: EconomicHarvard UUC BerkeleyUCLANew York UMITPrinceton UBrown UColumbia UYale UCornell UU ChicagoStanford UDukeUU MinnesotaU MichiganNorthwestern UPennsylvania State UMichigan State UU Illinois, Urbana
CategoryRanking SSCI
1314151617181920
history1234567S9
1011121314151617181920
Number ofPublishing Faculty
11131614121599
8107365644
104675255632
HHI
0.550.140.280.140.180.150.180.16
0.250.340.320.430.300.390.460.350.330.200.480.560.280.390.810.320.470.310.630.52
development, technological change, and growth123456789
10111213141516171819
22232015131612IT15134
15118
168
111014
0.080.120.140.170.330.110.200.190.130.110.610.130.180.210.210.280.320.450.19
ImportanceIndex
O.ll0.100.090.040.110.040.050.02
0.030.020.090.020.080.030.010.100.120.020.050.050.020.010.130.020.010.02O.ll0.01
0.090.080.11O.IO0.060.050.200.090.060.110.060.050.100.110.040.05O.ll0.070.06

Ranking Economics Departments by fields 993
Table 4. Continued
School
U Maryland, College Park
CategoryRanking SSC!
20
JEL category P: Economic systemsUC BerkeleyHarvard UColumbia UU Maryland, College ParkU MichiganArizona State UU PittsburghUC DavisU ChicagoStanford LJBrown UPrinceton UMITCity U of New York (CUNY)Western Michigan UU Southern CaliforniaBrandeis UUC IrvineYale UU Illinois, Urbana
123456789
1011121314151617181920
Number ofPublishing Faculty
9
57926
' 2 •423t3S4; '3151
,«52
JEL category Q: Agricultural and natural resource economicsIowa State UNorth Carolina State UU WyomingHarvard UYale UUC Santa BarbaraMITU Rhode IslandGeorgetown USUNY BinghamtonStanford UU Colorado. BoulderUtah State URPIU ConnecticutUC San DiegoRutgers UBrown UU Wisconsin, MadisonGeargia State U
1t34367S9
1011121314151617181920
29249667783497
143361665
JEL category R: Urban, rural, and regional economicsU Illinois, ChicagoHarvard USyracuse UMITBoston College
12345
5
a776
HHI
0.24
OMOM
0.^0.920.34
m0440.S6
m1,00
tm0.870.280.96
0.070.120.270.390.390.320.210,240.950,340.300.220.150.540,650.301.000.220.310.29
0.420.270.290.210.54
Impo nanceIndex
0.06
0.030.020.040.060.030.07O.IO0.040.020.020.040.010.010.040.200.020.120.060.010.02
0.360.340.350.020.040.140.020.760.080.220.030.080.560.210.140.030.090.040.030.07
0.210.020.140.030.13

994 Therese C. Grijalva and Clifford Nowell
Table 4. Continued
School
UC BerkeleyFlorida Slate UGeorgia State UWayne State UPrinceton UUC San DiegoU ConneeticutU Illinois., UrbanaU Colorado, BoulderSUNY BuffaloUC RiversideU KentuckyPennsylvania State UOklahoma State UWashington U, St. Louis
CategoryRanking SSCI
6789
1011121314151617181920
Number ofPublishing Faculty
6118278558255233
HHI
0.500.430.520.600.380.230.390.330.180.940.480.290.800.450.51
ImportanceIndex
0.020.150.130.290.020.040.180.050.090.250.120.130.060.350.13
JEL subject code I (health, education, and welfare), Stanford University has nine facultymembers who have published in this area and an HHI of 0.63. Michigan State University isranked slightly lower than Stanford and has 10 faculty publishing in the area with an HHI of0.16. If a student wishes to pursue a graduate degree in economics at Stanford University withan emphasis in health, education, and welfare, he or she should realize that the scholarlyactivity in this area at Stanford is concentrated in a few of the nine people who publish in thearea, while at Michigan State University, the publications are more evenly distributed acrossthe faculty in this area.
The fifth column in Table 4, "Importance Index," demonstrates the importance of aparticular field for a department relative to its overall productivity. The importance indexsimply divides a department's productivity score for a particular field by the department'soverall productivity score. Refer to Princeton University, which ranks as the top department inJEL subject codes B and F, methodology and history of economic thought and internationaleconomics, respectively. For methodology and history of economic thought, Princeton has animportance index of 2%, and for intemational economics, Princeton has an importance indexof 12%. This indicates that methodology and history of economic thought is more likely aspillover category and not the primary focus of the department's overall research agenda.
4. Conclusion
The primary objective of this article is to provide information to undergraduate studentsand to their advisers on the research strengths of 129 economics doctoral programs in theUnited States. We provide both total and average, or per capita, research productivitymeasures for publishing faculty and identify schools that are highly ranked in the manydifferent subject fields of economics.
A noticeable feature of our total productivity rankings is that the distinction betweenschools diminishes as their rank declines. The data demonstrate that per capita and total

Ranking Economics Departments hy Fields 995
productivity measures result in differences in quality rankings, where total productivity isinfluenced by both the number of publishing faculty and the productivity of each facultymember. Students searching for graduate schools may benefit from considering both theaverage quality of the faculty and the total quahty of the department.
For students who have a strong interest in a specific subject field of economics, we identifylhe schools that may best fit with the student's desires. As a cautionary note, we provide HHImeasures that alert students to the possibility that some departments may have a top reputationin a subject field due to having a single, very influential faculty member.
Although this information should be helpful to students applying to graduate school,applicants should be mindful of several things. First, one should apply to many different Ph.D.programs. The loss from a redundant application is much smaller than the loss of not applyingto a place that could become one's best offer (or maybe help to get a better deal elsewhere).Second, although a student will benefit by attending a university ranked highly in his or herpreferred field, a major consideration should still be the overall quality of the department.There are several benefits of attending a highly ranked school: (i) a student often learns a lotfrom his or her classmates, who perhaps are better students; (ii) students may change theirpreferences during their studies, and our study shows that highly ranked departments overallare strong in many fields; and (iii) students may be more successful in their job search if theygraduated from a department that is highly ranked overall. While this article can be a usefultool to start with, when actually choosing between competing offers, prospective studentsshould check out department websites and relevant curricula vital themselves.'^
Finally, our work shows that many top-ranked programs based on total productivitymeasures are able to provide an education that is broad in nature and that gives access to manyof the subject fields of economics. For students who are interested in a specific subject field,attending a traditionally top-ranked program will likely not limit the student's ability toconduct future research in an applied discipline. At the same time, however, for students whowill not attend a top-ranked school based on total productivity measures, they will likely attenda program with actively publishing faculty, and if they choose their programs correctly, it willstill be possible to obtain a top-ranked education in one of the subfields of economics.
References
Barbezat. Debra A. 1992, The markei for new Ph.D. economists. Journal of Economic Education 23:262-76.Dusansky, Richard, and Clayton J. Vemon. 1998. Rankings of U.S. economics departments. Journal of Economic
Perspectives 12:157-70.Graves, Philip E., James R. Marchand, and Randel Thompson. 1982. Economics departmental ratikings: Research
incentives, constraints, and efficiency. American Economic Review 5:1131-41.Journal of Economic Literature. 1991, Classification system: Oid and new categories. Journal of Economic Literature
29:xviii-xxviii,Laband. David N.. and Michael J. Piette. 1994. The relative impacts of economics journals: 1970-1990. Journal of
Economic Literature 32:640-66.McMillen, Daniel P., and Larry D. Singell, Jr. 1994- Gender differences in first jobs for economists. Southern Economic
Journal 6Q-J0l-\4.Siegfried, John J., and Wendy Stock. 2004. The labor marke! for new Ph.D. economists in 2002. American Economic
Review Papers and Proceedings 94:272-85.
'^ We thank an anonymous referee for pointing out these cautionary notes.

996 Therese C. Grijaha and Clifford Nowell
Stock, Wendy, and Richard M. Alston. 2000. The effect of graduate program rank on success in the job market. Journaiof Economic Education 31:389-401.
Thursby. Jerry G. 2000. What do we say about ourselves and what does it mean? Yet another look at economicsdepartment research. Journal of Economic Literature 38:383-404.
Tschirhart, John. 1989. Ranking economics departments in areas of expertise. Journal of Economic Education20:199-222.
