a guide to microbiology a guide to wastewater...
TRANSCRIPT

A Guide to MicrobiologyUnderstanding how to classify microorganisms, their growth requirements, and their limiting factors
A Guide to Wastewater Microbiology

Introduction
This purpose of this document is to provide descriptions and classifications of microorganisms and their growth requirements. In addition, it will include information on how microorganisms utilize particular pollutants or substrates, and the limiting factors to their growth and viability.
What is a microorganism?
Microorganisms are microscopic free-Iiving organisms that can reproduce if the proper environmental conditions are met.
Microorganisms are found in all kingdoms of life:
Microorganism classificationsDomain Kingdom Representatives
Eukaryota
Fungi Penicilium, Aspergillus
Plantae Green algae, Moss
Protista Amoeba, Slime molds, Acanthanmoeba, Euglypha, Physarum
Animalia Rotifers, Zooplankton, chaetonotus
Archaea Archaebacteria Thermotoga, Pyrococcus, Methanosarcina
Bacteria Eubacteria Escherichia, Pseudomonas, Bacillus
Table 1. Microorganism classifications (Three-domain system)
SizeWhat is the difference between a microorganism and any other organism? The “micro-“ simply refers to the small size of the organism. The size of microorganisms range from 0.5 µm to 1 cm. This range of size can generally only be seen clearly using a range of microscopes. Prokaryotes and EukaryotesOrganisms are classified in many ways, but one of the most common ways microorganisms are classified is by their basic cell structure. All living organisms can be divided into either prokaryotic or eukaryotic organisms.
Prokaryotes are single-celled organisms composed of cells that contain no defined nucleus and do not have membrane-bound organelles. Prokaryotes are further classified as bacteria or archaea. Archaea are often referred to as prehistoric bacteria due to their similar size and shapes. In actuality, archaea are not bacteria and have branched away from true bacteria early in their evolutionary history. Archaea can often contain very similar genes and metabolic pathways found in eukaryotes. The domain Archaea contains some very specialized organisms which have the ability to live in extreme environments or have very selective living conditions (thermophiles, halophiles, and methanogens). Outside of the scientific community, both true bacteria and archaea are often lumped together as “bacteria.”
Bacteria can generally be divided into two groups based on their cell wall
1

3
composition and structure. Gram-positive and Gram-negative bacteria are differentiated based on their staining properties and also by physiological capabilities. Certain genera of Gram positive bacteria (Bacillus species, for example) form a resting stage called an endospore or more commonly referred to as a spore. The spore state is a chemical, toxic and heat resistant state that is metabolically inactive. Under proper environmental conditions, spores can germinate into a metabolically active state know as a vegetative state. Gram negative bacteria (Pseudomonas species, for example) do not form spores and exist in the vegetative state throughout their life time.
Bacteria are the most abundant organisms on Earth and there are estimated to be over 5 nonillion (1030) on the planet. Bacteria are the primary focus of biological wastewater treatment and thus will be the focus of this module.
Eukaryotes are organisms which contain a true nucleus and have membranes surrounding each organelle. Eukaryotes can be single-celled (such as protozoa and amoeba) or multicellular (like animals). Table 2 compares prokaryotic and eukaryotic cells.
Prokaryotes versus EukaryotesProkaryotes Eukaryotes
Lack a membrane-bound nucleus Has a well-defined membrane-bound nucleus
DNA is a single circular moleculeDNA is a linear molecule bound together by proteins and orga-nized into chromosomes
Lack membrane-bound organellesMultiple membrane-bound organelles (mitochondria, Golgi apparatus, vacuoles, etc.)
Reproduce through division (binary fission) Asexual reproduction, budding, binary fission
Can have pili for adhesions and flagella for locomotion
Can have cilia or flagella for locomotion
Cell wall contains peptidoglycan Call wall (if present) contains cellulose or chitin
Cell sizes 0.5 µm to 100 µm Cell sizes 10 µm to >1000 µm
Table 2. Prokaryotes versus eukaryotes
The differences between prokaryotes and eukaryotes cells can be seen below:
Figure 1. Prokaryotic cell
Fimbriae
Outer membrane
Cell wall
Cytoplasm
Nucleoid region
Flagella
Plasma membrane
RibosomesProkaryote
2

4
Bacterial morphologyWhen looking at the bacteria that make up the majority of wastewater treatment, they can be classified by common morphologies (shapes). In general, bacteria come in five shapes:
• Bacillus – rod-shaped organisms• Coccus – round or spherical-shaped organisms• Spirilla – spiral-shaped organisms• Vibrio – comma-shaped organisms• Filamentous – strands of bacteria
Most bacteria in the environment are of the rod morphology. The cells can be found singularly or in groups.
Bacilli
Others
Budding and appendaged bacteria
Cocci
Coccus DiplococciDiplococci
encapsulatedPneumococcus
staphylococci
TetradSarcinaStreptococci
Coccobacillus Bacillus
DiplobacilliPalisades
Streptobacilli
Hypha Stalk
Enlarged rodFusobacterium
Vibrio
Comma s formBdeliovibrio
Club rodCorynebacteriaceae
Helical formHelicobacter pylori
Corkscrew s formBorrelia burgdorferi
Filamentous
Spirochete
Figure 3. Morphology of bacterial cells
Ribosomes
Smooth endoplasmic reticulum
Glycoproteins
Plasma membrane
Rouch endoplasmic reticulum
Mitochondria
Nucleus Eukaryote
Figure 2. Eukaryotic cell
3

Gram stainAnother common way of classifying bacteria is by using the Gram stain. The Gram stain differentiates organisms by structural elements of the cell wall. This classification pertains to a staining procedure named after the Danish scientist Christian Gram (1853–1938) who first devised the technique in 1884. During the staining process, bacteria are killed and stained with crystal violet followed by a mordant, such as iodine. The stained cells are then treated with an organic solvent such as acetone or ethanol. After washing with solvent, the samples are then counterstained with safranin or fuchsine. Bacteria fall into two categories: those that are readily decolorized and take up the counter stain under these conditions, and those that retain the primary stain. Cells of the former type are said to be Gram-negative; those of the latter type are said to be Gram-positive.
The difference in reaction reflects a fundamental difference in the structure of the cell wall in the two types of bacteria. Structure of bacterial cells showing the homogenous thick murein (a biopolymer) layer of Gram-positive cell walls and the two discrete layers of Gram-negative walls are shown below:
Gram-negative bacteria do not form heat-resistant spores. This is an important factor in the manufacturing process as Gram-negative bacteria are generally less stable. Gram staining is a useful technique in differentiating problematic bacteria in a wastewater treatment system, particularly with filamentous bacteria, which cause sludge foaming and bulking.
Cellular composition and nutritional requirements
Approximate elementary composition of the bacterial cell:
The nutritional requirements for bacteria are essentially the same as the elemental composition described below. In a conventional aerobic wastewater system, where oxygen is not limited, the nutritional needs are a source of carbon, nitrogen and phosphorous in the ratio of 100 (C): 5 (N): 1 (P), and trace minerals. Each of the elements are important for a healthy population, and these requirements must be met.
5
Figure 4. Differences between Gram- positive and negatives
Bacterial cell compositionElement Percentage by WeightCarbon 50
Oxygen 20
Nitrogen 14
Hydrogen 8
Phosphorus 3
Sulfur 1
Potassium 1
Sodium 1
Calcium 0.5
Magnesium 0.5
Chlorine 0.5
Iron 0.2
All others 0.3
Table 3. Composition of the bacterial cell
4

6
General physiological functionsElement Physiological Function
Carbon (C) Constituent of organic cell materials (structural)
Hydrogen (H) Constituent of cellular water, organic cell materials
Nitrogen (N) Constituent of proteins, nucleic acids, coenzymes
Oxygen (O)Constituent of cellular water, organic cell material, and as O2 acts as the electron ac-ceptor in respiration of aerobes
Phosphorus (P) Constituent of nucleic acids, ATP, and the phospholipids that form all cell membranes
Sulfur (S) Constituent of nucleic acids, phospholipids, coenzymes
Potassium (K) One of the principal inorganic cations in cells, cofactor for some enzymes
Magnesium (Mg)Important cellular cation; inorganic cofactor for many enzymatic reactions, including those involving ATP; functions in binding enzymes to substrates; constituent of chloro-phylls
Manganese (Mn) Inorganic cofactor for some enzymes, sometimes replacing Mg
Calcium (Ca) Important cellular cation; cofactor for some enzymes (for example, proteases).
Iron (Fe)Constituent of cytochrome and other heme or non-heme protein; cofactor for a num-ber of enzymes
Cobalt (Co) Constituent of vitamin B12 and its coenzyme derivatives
Copper (Cu), Zinc (Zn), Molybdenum (Mo)
Inorganic constituents of special enzymes
Table 4. General physiological functions of the principle elements
Microbial metabolism and enzymesMicroorganisms bring organics and nutrients into their cells in order to take advantage of their nutritional value. The microbial cell membrane can only allow small molecules through. As a result, the larger organic material may need to be broken down outside the cell. This is performed by extracellular hydrolytic enzymes. The cell will secrete specific enzymes to break these molecules down to a size which can be taken into the cell (via membrane-bound enzymes). For example, bacterial cells will secrete lipases to break down large fat molecules into smaller fatty acids which can then enter the cell. Once inside the cell, intracellular enzymes can then be utilized to further breakdown or convert the molecules to usable substrates for metabolism. Of the enzymes that are produced by the microorganism, only about 3% are secreted outside of the cell.
Extracellular enzymes
Large molecules, particulate or
colloidal material
Small, soluble compounds
Membrane-bound enzymes
Intracellular enzymes
CO2 and H2
O
Fig 5. Extracellular and intracellular enzymes
5

Carbon sourceThe terms “heterotrophic” and “autotrophic” are used to characterize the type of nutrition of microorganisms. Heterotrophic refers to microorganisms that depend on organic material supplied by the environment for the carbon source. In wastewater applications, heterotrophs are often called “BOD bacteria.” Autotrophic refers to the nutrition of microorganisms that depend on inorganic sources of carbon (like carbon dioxide or bicarbonate). In wastewater applications, nitrifiers and sulfer oxidizers are two types of autotrophs. Both terms refer solely to the source of carbon and are inadequate to describe the metabolic diversity of microorganisms. These terms are, however, in common use.
Energy source (or Electron donor)Microorganisms require energy for three main functions:
• Maintenance of cellular structure• Growth• Mobility
They obtain this energy in the electron transfer processes. Through its cellular machinery, the microorganism oxidizes organic or inorganic substrates (autotrophs) to generate energy through an electron transport chain. The final result is the electron, which can be donated to an electron acceptor. During this process, the electron donor is oxidized and the electron acceptor is reduced.
Microorganisms are also classified by where they get their energy (or where they get their electron acceptor). The most prevalent type of organism in conventional wastewater applications are “chemotrophs.” Chemotrophs get their energy from the oxidation of organic or inorganic compounds. Organisms like algae and plants, that get their energy from photosynthesis, are called “phototrophs”.
Electron acceptor (or Hydrogen)As stated above, the chemical reactions of the electron transfer chain require an electron donor as well as an electron acceptor. Microorganisms are classified by where they donate their electrons. Those that donate electrons to inorganic compounds are called lithotrophs. Those that donate electrons to other organic compounds are called organotrophs.
Therefore, chemoorganoheterotrophs are organisms that utilize organic compounds for both their energy and carbon demands. This is the classification for most microorganisms in a conventional wastewater system. Nitrifying bacteria are considered chemolithoautotrophs, getting their carbon from inorganic carbon sources (like carbon dioxide) and energy from the oxidation of inorganic compounds (ammonia and nitrate being the hydrogen donors).
OxygenOxygen availability is another factor in growth. Microorganisms can be classified by their ability to utilize oxygen as follows:
• Aerobe – Can exist only when there is a supply of molecular oxygen.• Anaerobe – Can exist only in an environment where there is no oxygen.• Facultative – Can exist in an environment with or without molecular oxygen.
Many organisms have some facultative capabilities or can tolerate changes in oxygen availability. However, if the term “strict” is utilized, that distinguishes organisms that are not tolerant. For example, nitrifying bacteria are strict aerobes, as they cannot survive in low oxygen conditions. Methanogenic bacteria are strict anaerobes, as they cannot survive in the presence of even minimal amounts of oxygen.
6

Wastewater systems can be designed to utilize all three types of organisms above, depending on the treatment goals. The conventional wastewater treatment system is primarily aerobic.
TemperatureEvery organism has a minimum, optimum and maximum growth temperature. Microorganisms can be classified as mesophiles, thermophiles, psychrotrophs, and psychrophiles. The mesophiles represent the majority of microorganisms found in soil and water and have a temperature optimum in the range of 30 to 45°C. These are the microorganisms that are most prevalent in wastewater systems. At the optimum temperature, the microorganism’s growth rate is at its maximum. The optimum temperature can also be based on yield or growth of biomass. The minimum, optimum, and maximum temperature ranges for each of these classifications are below.
Principal physiological categories of microorganisms in terms of the relationship between growth rate and temperature:
Temperature (°C) ranges
Group Minimum Optimum Maximum
Thermophiles 40 – 50 55 – 75 60 – 80
Mesophiles 10 – 15 30 – 45 35 – 47
Psychrotrophs -5 – 5 25 – 30 30 – 35
Psychrophiles (obligate) -5 – 5 15 – 18 19 – 22
Table 6. Minimal and maximal temperature ranges
Temperature (°C)
Gro
wth
rat
e
Bacterial classifi cation by temperature range
Psychrophiles
MesophilesThermophiles
Hyperthermophiles
Figure 6. Bacterial classification by temperature ranges
pH and alkalinityEach microorganism has an optimum pH and range for growth. The pH values of natural habitats usually are between 5 and 9, which means that most bacteria have their optimum pH in that range. Some organisms, however, are able to grow at a pH below 2 and above 10. The bacterial groups according to their pH tolerance are as follows:
7

Classification by pHGroup pH Range
Acidophiles <1 to 4.5
Neutrophiles 5.5 to 8.5
Alkalophiles 7.5 to 11.5
Table 7. Bacterial classification by pH
The growth of bacteria can alter the pH of the surrounding environment and many times is the reason for the cessation of growth or activity. Organisms may create or degrade organic acids, or decompose protein releasing ammonia which all can affect the pH of the environment. The typical wastewater application will require a stable pH consistently between 6-8.
Alkalinity measures the ability of a solution to neutralize (buffer) acids to the equivalence point of carbonate or bicarbonate. Alkalinity is not the same thing as pH or basicity. Some wastestreams will have very little buffering capacity and can cause serious detrimental impacts to microorganisms from acidic spikes. Wastestreams with enough alkalinity to handle these spikes will limit the amount of upsets. This becomes even more important when addressing nitrification (see nitrification section) and anaerobic treatment.
Salinity and osmotic pressureIn natural habitats, high osmotic pressure of bacterial significance is usually related to NaCl. Bacteria differ in relation to their salt tolerance.
Based on salt tolerance, four groups can be identified: nonhalophiles, marine bacteria, moderate halophiles, and extreme halophiles. The nonhalophilic bacteria do not require Na+, though a small amount has a stimulatory effect. The marine bacteria and moderate halophiles require NaCl. Extreme halophiles, which can tolerate up to 36% NaCl do not grow at less than 12% NaCl concentration. It should be noted that the majority of bacteria are relatively osmotic tolerant and can adapt to changes in salinity if the change is gradual and not a shock. A sudden change in salinity can either cause the bacteria to dehydrate or burst. This is caused by the balancing of the salinity between the cell interior and the environment.
Carbon dioxideProviding carbon dioxide is necessary for the growth of some photolithothrophs and chemolithothrophs. Since the concentration in the atmosphere is rather low (390 ppm), this substrate may be limiting [an important factor for nitrification]. The addition of an alkalinity source such as carbonate may be necessary in processes such as nitrification to provide pH balance and a source of carbon dioxide.
Microbial growthGrowth is defined as an orderly increase of all chemical constituents of an organism, leading to cell division and an increase in bacterial numbers. An increase in total mass is not necessarily a reflection of growth. It may result from the increase in a storage material. In a multi-cellular organism, replication results in an increase in size of the individual. In unicellular organisms it results in an increase in their number. The generalized growth curve of a bacterial culture is illustrated by the following graph:
8

10
Microbial populations seldom maintain exponential growth for long. Considering the consequences of exponential growth, one can see that growth at such high rates cannot typically continue for very long.
For example, a single bacterium with a generation time of 20 minutes would, over the course of 48 hours, produce 2144 (2.2 x 1043) cells. Although the average bacterium weighs only 10-12 g, the total weight of the organisms in this demonstration would equal 2.2x 1031 g or 4,000 times the weight of the earth.
The exponential growth phase is the time when the microbial population is experiencing maximum growth. For any initial population size (N0), we can determine the population size in successive generations (Nn) as follows:
The population size is dependent upon elapsed time and the time required for a doubling of the population, also known as the generation time. The following table provides the maximal recorded growth rates (generation times) for certain bacteria, measured at or near the optimum temperature at optimum laboratory conditions:
Maximum recorded growth ratesOrganism Temperature Generation time (hr)
Pseudomonas natriegens 37 0.16
Bacillus stearothermophilus 60 0.18
Escherichia coli 40 0.35
Bacillus subtilis 40 0.43
Pseudomonas putida 30 0.75
Vibrio marinus 15 1.35
Rhodopseudomonas spheriodes 30 2.2
Mycobacterium tuberculosis 37 ≈ 6
Nitrobacter agilis 27 ≈ 20
Table 9. Maximum recorded growth rates
Growth is normally limited by the exhaustion of nutrients or alteration of the environment by production of a toxic metabolite or change in pH. It is these phenomena that are responsible for the typical shape of the batch growth curve as shown. The four principal phases of the growth curve can be described as follows:
Growth phaseAfter 1 generation: N1 = 2N0
After 2 generations: N2 = 2 x 2N0 = 22N0
After 3 generations: N3 = 23N0
After n generations: Nn = 2nN0
Table 8. Exponential growth phase
Time
Log
nu
mb
er o
f ce
lls
Typical bacterial growth curve
Death phase
Phase of exponential
growth
Maximum stationary
phase
Log phase
Figure 7. Typical bacterial growth curve
9

11
• Lag phase: A lag in growth can be caused by transfer of a bacterial culture from one environment to another, or the transfer of a culture in the stationary or death phase into a new environment. The lag phase doesn’t always occur, but when it does, the length of time can vary considerably.
• Exponential phase: This phase of growth begins when the growth rate reaches a constant value. During this phase, nearly all the cells are viable and of a constant size. The cell number and cell mass increase proportionally. The growth rate is influenced both by the genetics of the microorganism and the environmental factors.
• Maximum stationary phase: In an environment where nutrients are not renewed, the exponential phase continues for only a few generations and the growth rate begins to decline because of lack of substrate or the production of a toxic end product. The maximum stationary phase is characterized by a growth rate of zero.
• Death phase: The stationary phase is followed by the death phase where the viable population declines. In bacterial populations, death of an individual cell may be unaccompanied by lysis. Thus, the cell mass may remain unchanged. Death that is accomplished by cell lysis will see a drop in cell mass.
Growth rate vs. nutrient concentration Growth rate, like a chemical reaction rate, is a function of chemical concentration; however, in general, growth rate is relatively constant for the local environment. In addition, the growth rate can also be dependent upon the type of substrates present in the local environment. Each microorganism may have particular organic chemicals and nutrients that result in optimum growth. It is the identification of the microbes that grow particularly well on a given substrate that Novozymes seeks to achieve for bioaugmentation.
Nutritional typesFor a microorganism to continue to function properly it must have sources of energy and carbon for the synthesis of new cellular material. Microorganisms are classified by the source of energy and carbon:
Classification by energy and carbon sourceWastewater
ProcessClassification
Wastewater system
C Source e- donor e- acceptor Byproducts
Aerobic Oxidation Heterotrophic Aerobic OM OM O2 CO2/H2O/NH3
Nitrification Autotrophic Aerobic CO2/HCO3- NH3/NO2 O2 NO2
-/NO3-
Sulfur Oxidation Autotrophic Aerobic CO2/HCO3- H2S, S, S2O3 O2 SO4
-2
Denitrification Heterotrophic Anoxic/Facultative OM OM NO2/NO3 N2/CO2/H2O
Acidification Heterotrophic Anaerobic OM OM OM VFA
Sulfur Reduction Heterotrophic Anaerobic OM OM SO4-2 H2S/CO2/H2O
Methanogenesis Heterotrophic Anaerobic OM H2/VFA CO2 CH4
Notes: OM = organic material VFA = volatile fatty acids
Table 5. Microorganism classification by energy and carbon source
10
12
Microbial processes in the environment
As stated earlier, microbes are ubiquitous in our environment and, given the right conditions to grow, they will. Our environment is composed of many different natural processes that are driven by microorganisms. Microorganisms impact how natural elements, like carbon or nitrogen, cycle through our air, soil, and water. These cycles are important to understand as they are the foundational processes in which wastewater treatment is designed.
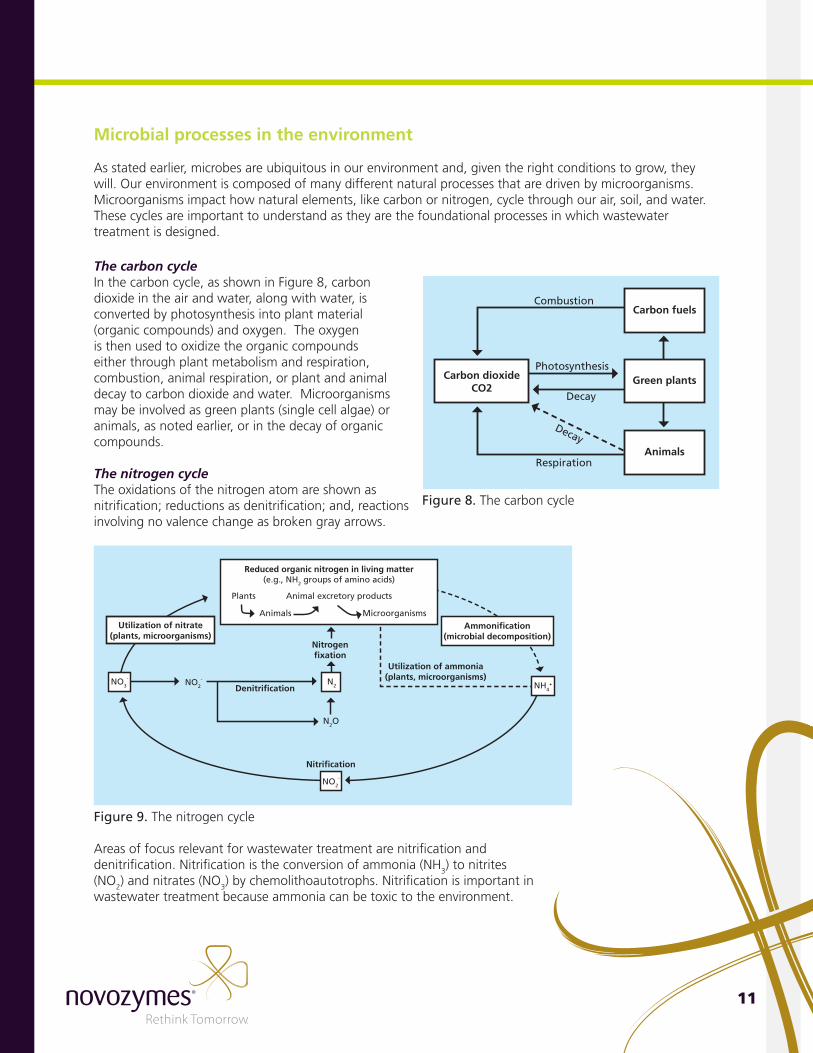
The carbon cycleIn the carbon cycle, as shown in Figure 8, carbon dioxide in the air and water, along with water, is converted by photosynthesis into plant material (organic compounds) and oxygen. The oxygen is then used to oxidize the organic compounds either through plant metabolism and respiration, combustion, animal respiration, or plant and animal decay to carbon dioxide and water. Microorganisms may be involved as green plants (single cell algae) or animals, as noted earlier, or in the decay of organic compounds.
The nitrogen cycleThe oxidations of the nitrogen atom are shown as nitrification; reductions as denitrification; and, reactions involving no valence change as broken gray arrows.
Reduced organic nitrogen in living matter(e.g., NH2 groups of amino acids)
Plants
Animals
Animal excretory products
Microorganisms
N2O
NO2-
Nitrifi cation
Nitrogenfi xation
Utilization of ammonia(plants, microorganisms)
Ammonifi cation(microbial decomposition)
Utilization of nitrate(plants, microorganisms)
Denitrifi cationN2 NH4
+NO3-
NO2-
Figure 9. The nitrogen cycle
Areas of focus relevant for wastewater treatment are nitrification and denitrification. Nitrification is the conversion of ammonia (NH3) to nitrites (NO2) and nitrates (NO3) by chemolithoautotrophs. Nitrification is important in wastewater treatment because ammonia can be toxic to the environment.
Carbon fuelsCombustion
Animals
Carbon dioxideCO2
Green plants
Respiration
Photosynthesis
Decay
Decay
Figure 8. The carbon cycle
11

13
Denitrification is the conversion of nitrates into dinitrogen gas (N2). Denitrification is important because it is the process by which nitrogen is removed from water and put back into the air. The accumulation of nitrogen (even as nitrates) can fuel eutrophication, in which the plant biomass growth (algae blooms) causes hypoxia or the loss of available dissolved oxygen and can suffocate fish or other marine animals.
The sulfur cycle
Reduced organic sulfur in living matter(e.g., SH group of cysteine)
Plants Animals Microorganisms
S
Decomposition of organic matter (microorganisms)
Utilization of sulfate(plants, microorganisms)
Desulfovibrio H2SSO4
-
Sulfur oxidation (colorless and photosynthetic
sulfur bacteria)
Oxidation of H2S(colorless and photosynthetic
sulfur bacteria, or spontaneous)
Figure 10. The sulfur cycle
Sulfate is important in wastewater applications because it can be reduced to a dangerous and destructive gas (hydrogen sulfide) if not handled properly. The production of hydrogen sulfide in collection systems can be dangerous to the public and wastewater operators. Hydrogen sulfide can also be toxic to the wastewater treatment plant’s biomass and form sulfuric acid, which destroys concrete and steel structures. In addition, the rotten egg smell of hydrogen sulfide is the number one cause of odor complaints in wastewater treatment.
12

NovozymesMain sales offices
North and South America
Novozymes Biologicals, Inc.5400 Corporate CircleSalem, VA 24153Tel.: +1 800-859-2972Fax: +1 540-389-2688
Europe, Middle East, and Africa
Novozymes Biologicals France SAParc Technologique des Grillions60 Route de Sartrouville, Bât. 678230 Le Pecq, FranceTel.: +33 1 30 15 28 40Fax: +33 1 30 15 15 45
Asia Pacific
Novozymes China14 Xinxi LuShandi Zone, Haidian DistrictBeijing 100085, ChinaTel.: +86 10 6298 7888Fax: +86 10 6298 1281
For more information visit www.novozymes.com/wastewatersolutions
Laws, regulations, and/or third-party rights may prevent customers from importing, using, processing, and/or reselling the products described herein in a given manner. Without separate, written agreement between the customer and Novozymes to such effect, information provided in this document “AS IS” is of good faith and does not constitute a representation or warranty of any kind and is subject to change without further notice.
Novozymes Biologicals, Inc.5400 Corporate CircleSalem, VA 24153
Tel.: +1 800-859-2972Fax: +1 540-389-2688
Novozymes is the world leader in bioinnovation. Together with customers across a broad array of industries we create tomorrow’s industrial biosolutions, improving our customers’ business and the use of our plant’s resources.
With over 700 products used in 130 countries, Novozymes’ bioinnovations improve industrial performance and safeguard the world’s resources by offering superior and sustainable solutions for tomorrow’s ever-changing marketplace.
©NovozymesA/S•LunaNo.2013-04119-01