a guide to preparing and reviewing remedial action reports …asktop.net/wp/download/27/ep 1110-1-19...
TRANSCRIPT

EP 1110-1-1930 June 2001
US Army Corpsof Engineers
A GUIDE TO PREPARING AND REVIEWINGREMEDIAL ACTION REPORTS OFCOST AND PERFORMANCE
ENGINEER PAMPHLET

CEMP-R EP 1110-1-1930 June 2001
CEMP-REngineer Pamphlet
1110-1-19
Department of the ArmyU.S. Army Corps of Engineers
Washington, DC 20314-1000
EP 1110-1-1930 June 2001
A GUIDE TO PREPARING AND REVIEWINGREMEDIAL ACTION REPORTSOF COST AND PERFORMANCE
Distribution Restriction StatementApproved for public release;
distribution is unlimited.
CEMP-R EP 1110-1-1930 June 2001
FOREWARD
The U.S. Army Corps of Engineers (USACE), through its staff and contractors, provides quality,responsive engineering and construction services to the Army and the Nation. USACE missions include civilworks, military construction, environmental restoration and support to other agencies. The civil worksprogram encompasses flood control, navigation, shore erosion, and recreation facilities. The militaryconstruction program supports the Army, most of the Air Force, and certain other Department of Defense(DoD) agencies. USACE performs environmental restoration work for the Army, DoD, EnvironmentalProtection Agency, Department of Energy, and several other agencies. USACE also provides design andconstruction management services for non-DoD Federal agencies, state and local governments, and foreigngovernments.
A majority of the planning, engineering, design and surveying and mapping services for theseprograms is acquired by contract with private architect-engineer (A-E) firms. USACE is one of the largestFederal procurers of A-E services. This pamphlet describes the USACE policies and procedures for preparingand reviewing remedial action reports of cost and performance.
FOR THE COMMANDER:
ROBERT CREARColonel, Corps of EngineersChief of Staff
This pamphlet supersedes EP 1110-1-19, dated 15 November 1996.

DEPARTMENT OF THE ARMYU.S. Army Corps of Engineers
CEMP-R Washington, D. C. 20314-1000
Engineer PamphletNo. EP 1110-1-19 30 June 2001
Engineering and DesignA GUIDE TO PREPARING AND REVIEWING
REMEDIAL ACTION REPORTS OFCOST AND PERFORMANCE
TABLE OF CONTENTS
Paragraph Page
i
Acronyms iv
Chapter 1 IntroductionPurpose................................................................................. 1-1 1-1Applicability ........................................................................ 1-2 1-2Scope.................................................................................... 1-3 1-2References............................................................................ 1-4 1-2Organization......................................................................... 1-5 1-3
Chapter 2 BackgroundSuperfund Process................................................................ 2-1 2-1Remedial Action Process ..................................................... 2-2 2-5Remedial Action Completion .............................................. 2-3 2-6
Chapter 3 Reporting CriteriaPreparation ........................................................................... 3-1 3-1Timing.................................................................................. 3-2 3-1Distribution .......................................................................... 3-3 3-1Approval .............................................................................. 3-4 3-1Review ................................................................................. 3-5 3-2
Chapter 4 Report ComponentsGeneral................................................................................. 4-1 4-1Introduction.......................................................................... 4-2 4-3Operable Unit Background .................................................. 4-3 4-5Construction Activities ........................................................ 4-4 4-6Chronology of Events .......................................................... 4-5 4-7Performance Standards and Construction Quality Control.. 4-6 4-8Final Inspections and Certifications..................................... 4-7 4-10Operation & Maintenance Activities ................................... 4-8 4-11Summary of Project Costs ................................................... 4-9 4-11Observations and Lessons Learned...................................... 4-10 4-12Operable Unit Contact Information ..................................... 4-11 4-13References............................................................................ 4-12 4-14

EP 1110-1-1930 Jun 01
TABLE OF CONTENTS (continued)
Paragraph Page
ii
Chapter 5 Documenting Technology PerformanceGeneral................................................................................. 5-1 5-1Recommended Performance Reporting ............................... 5-2 5-1Factors that Affect Cost and Performance ........................... 5-3 5-2
Chapter 6 Documenting Project CostsGeneral ............................................................................... 6-1 6-1Definitions.......................................................................... 6-2 6-1Cost Element Structure....................................................... 6-3 6-2Capital Cost Elements ........................................................ 6-4 6-2O&M Cost Elements .......................................................... 6-5 6-7Periodic Cost Elements ...................................................... 6-6 6-11Project Cost Appendix ....................................................... 6-7 6-12
Appendix A Glossary of Superfund Terms.........................................................................A-1
Appendix B Example Remedial Action Report – Ex Situ Soil Remediation ..................... B-1
Appendix C Example Remedial Action Report – In Situ Soil and GroundwaterRemediation.................................................................................................... C-1
Appendix D Cost Reporting Templates ..............................................................................D-1
EP 1110-1-1930 Jun 01
LIST OF EXHIBITS
Page
iii
Exhibit 2-1 The Superfund Pipeline ...................................................................................2-2Exhibit 2-2 Example Pipeline Scenarios ............................................................................2-4Exhibit 2-3 Remedial Action Completion Process .............................................................2-7Exhibit 3-1 Remedial Action Report Checklist ..................................................................3-3Exhibit 4-1 Example Abstract ............................................................................................4-2Exhibit 4-2 Example Introduction ......................................................................................4-4Exhibit 4-3 Example Operable Unit Background...............................................................4-5Exhibit 4-4 Example Construction Activities.....................................................................4-6Exhibit 4-5 Example Chronology of Events.......................................................................4-7Exhibit 4-6 Example Performance Standards and Construction Quality Control ..............4-9Exhibit 4-7 Example Final Inspections and Certifications ...............................................4-10Exhibit 4-8 Example Operations & Maintenance Activities ............................................4-11Exhibit 4-9 Example Summary of Project Costs ..............................................................4-12Exhibit 4-10 Example Observations and Lessons Learned ................................................4-12Exhibit 4-11 Example Operable Unit Contact Information................................................4-13Exhibit 5-1 Recommended Performance Reporting...........................................................5-1Exhibit 5-2 Example Remedial Technologies ....................................................................5-3Exhibit 5-3 Suggested Parameters to Report that Affect Cost and Performance................5-4Exhibit 5-4 Example Matrix Characteristics ......................................................................5-6Exhibit 5-5 Example Operating Parameters .......................................................................5-7Exhibit 6-1 Relationship of Capital and O&M Costs to Pipeline Phases ...........................6-2Exhibit 6-2 RA Capital and Operating Cost Elements .......................................................6-3Exhibit 6-3 Post-RA O&M Cost Elements.........................................................................6-8Exhibit 6-4 RA or Post-RA O&M Periodic Cost Elements..............................................6-11Exhibit 6-5 Example Cost Breakdown .............................................................................6-14Exhibit 6-6 Example Technology-Specific Unit Cost Calculation...................................6-16Exhibit 6-7 Example HCAS Data Report and WBS Cost Breakdown.............................6-17
EP 1110-1-1930 Jun 01
ACRONYMS
iv
ARARs Applicable or Appropriate and Relevant RequirementsCERCLA Comprehensive Environmental Response, Compensation, and Liability ActCFR Code of Federal RegulationsCX Center of ExpertiseDoD Department of DefenseDQO Data Quality ObjectiveEE/CA Engineering Evaluation/Cost AnalysisEPA U.S. Environmental Protection AgencyESD Explanation of Significant DifferencesFF Federal FacilityFFA Federal Facility AgreementFS Feasibility Study*HCAS Historical Cost Analysis SystemHQ HeadquartersHRS Hazard Ranking SystemHTRW Hazardous, Toxic, and Radioactive WasteLTRA Long-Term Response Action*NCP National Oil and Hazardous Substances Pollution Contingency PlanNPL National Priorities ListO&F Operational and Functional*O&M Operation and Maintenance*OU Operable Unit*PA Preliminary AssessmentPRP Potentially Responsible Party*PRP LR Potentially Responsible Party Long-Term Response*QA Quality AssuranceQAPP Quality Assurance Project PlanQC Quality ControlRA Remedial Action*RD Remedial Design*RI Remedial Investigation*ROD Record of Decision*RPM Remedial Project ManagerSARA Superfund Amendments and Reauthorization ActSI Site InspectionUSACE U.S. Army Corps of EngineersWBS Work Breakdown Structure* Definition provided in Appendix A
EP 1110-1-1930 Jun 01
1-1
CHAPTER 1 INTRODUCTION
1-1. Purpose.
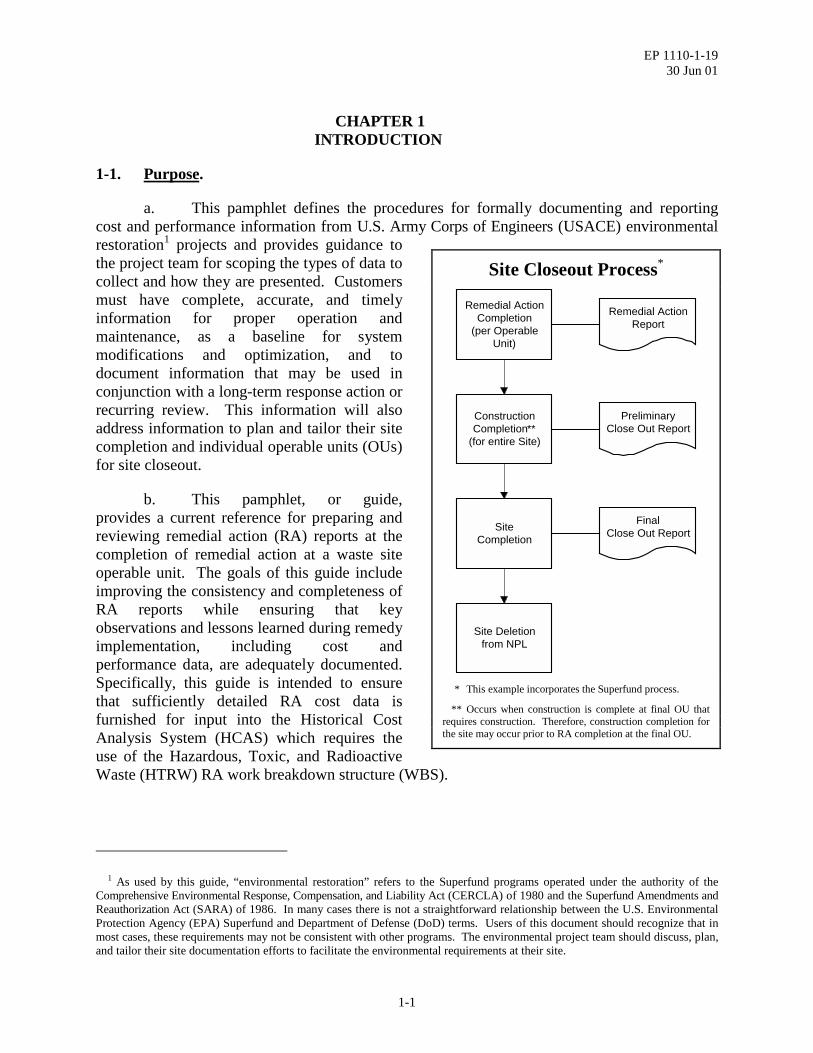
a. This pamphlet defines the procedures for formally documenting and reportingcost and performance information from U.S. Army Corps of Engineers (USACE) environmentalrestoration1 projects and provides guidance tothe project team for scoping the types of data tocollect and how they are presented. Customersmust have complete, accurate, and timelyinformation for proper operation andmaintenance, as a baseline for systemmodifications and optimization, and todocument information that may be used inconjunction with a long-term response action orrecurring review. This information will alsoaddress information to plan and tailor their sitecompletion and individual operable units (OUs)for site closeout.
b. This pamphlet, or guide,provides a current reference for preparing andreviewing remedial action (RA) reports at thecompletion of remedial action at a waste siteoperable unit. The goals of this guide includeimproving the consistency and completeness ofRA reports while ensuring that keyobservations and lessons learned during remedyimplementation, including cost andperformance data, are adequately documented.Specifically, this guide is intended to ensurethat sufficiently detailed RA cost data isfurnished for input into the Historical CostAnalysis System (HCAS) which requires theuse of the Hazardous, Toxic, and RadioactiveWaste (HTRW) RA work breakdown structure (WBS).
1 As used by this guide, “environmental restoration” refers to the Superfund programs operated under the authority of the
Comprehensive Environmental Response, Compensation, and Liability Act (CERCLA) of 1980 and the Superfund Amendments andReauthorization Act (SARA) of 1986. In many cases there is not a straightforward relationship between the U.S. EnvironmentalProtection Agency (EPA) Superfund and Department of Defense (DoD) terms. Users of this document should recognize that inmost cases, these requirements may not be consistent with other programs. The environmental project team should discuss, plan,and tailor their site documentation efforts to facilitate the environmental requirements at their site.
Site Closeout Process*
Remedial ActionCompletion
(per OperableUnit)
ConstructionCompletion**
(for entire Site)
Remedial ActionReport
PreliminaryClose Out Report
SiteCompletion
FinalClose Out Report
Site Deletionfrom NPL
* This example incorporates the Superfund process.
** Occurs when construction is complete at final OU thatrequires construction. Therefore, construction completion forthe site may occur prior to RA completion at the final OU.

EP 1110-1-1930 Jun 01
1-2
c. This guide is intended to assist in the preparation, review, or use of RA reports forenvironmental restoration projects by cost engineers, environmental engineers, residentconstruction managers, project managers, remedial project managers (RPMs), programmanagers, and other related technical disciplines.
1-2. Applicability. This pamphlet applies to all USACE commands having investigation,design, and remedial action responsibility for environmental restoration projects within themilitary, civil works, or support for others programs.
1-3. Scope. This pamphlet is a companion document to A Guide for Preparing andReviewing Remedial Action Reports developed jointly by the U.S. Army Corps of Engineers(USACE) and U.S. Environmental Protection Agency (USEPA). The primary differencebetween these two documents is the cost reporting format. Both documents incorporate selectedguidance from the Guide to Documenting and Managing Cost and Performance Information forRemediation Projects (EPA 542-B-98-007, October 1998). This guide does not addressconstruction completion, site completion, or site deletion from the National Priorities List (NPL).For information on these issues refer to Close Out Procedures for National Priorities List Sites(EPA 540-R-98-016, January 2000). Although much of this guide is written from theperspective of a Superfund site listed on the NPL, the presented concepts could also be applied tonon-NPL sites or other cleanup programs.
1-4. References. The following documents provide additional information related to thesubject of this pamphlet.
a. ER 5-1-11. Program and Project Management.
b. ER 415-345-38. Transfer and Warranties.
c. ER 1110-3-1301. Hazardous, Toxic, and Radioactive Waste (HTRW) CostEngineering.
d. CEGS 01070. Cost and Performance Report.
e. CEGS 01440. Contractor Quality Control.
f. CEGS 01450. Chemical Data Quality Control.
g. Standard Industrial Classification Manual. 1987.
h. 40 CFR Part 300. National Oil and Hazardous Substances Pollution ContingencyPlan (NCP). (http://www.epa.gov/docs/epacfr40/chapt-I.info/subch-J.htm)
i. EPA 540-F-93-048. Presumptive Remedies: Site Characterization andTechnology Selection for CERCLA Site with Volatile Organic Compounds in Soils. U.S.Environmental Protection Agency. September 1993.
EP 1110-1-1930 Jun 01
1-3
j. EPA/542/B-94/013. Remediation Technologies Screening Matrix and ReferenceGuide, Second Edition. Federal Remediation Technologies Roundtable. October 1994.
k. EPA/540/G-89/004. Guidance for Conducting Remedial Investigations andFeasibility Studies under CERCLA. Interim Final. U.S. Environmental Protection Agency.October 1988.
l. OSWER 9335.0-27FS. A Guide to Selecting Superfund Remedial Actions. U.S.Environmental Protection Agency. April 1990.
m. EPA 540/F-96/018. The Role of Cost in the Superfund Remedy SelectionProcess. Quick Reference Fact Sheet. U.S. Environmental Protection Agency. September 1996.(http://www.epa.gov/superfund/resources/cost_dir/index.htm)
n. EPA 540-R-97-013. Rules of Thumb for SuperfundRemedy Selection. U.S. Environmental Protection Agency. August 1997.(http://www.epa.gov/superfund/resources/rules/index.htm)
o. EPA 542-B-98-007. Guide to Documenting and Managing Cost and PerformanceInformation for Remediation Projects. U.S. Environmental Protection Agency. October 1998.(http://www.frtr.gov/cost/)
p. EPA/540/R-98/031. A Guide to Preparing Superfund Proposed Plans, Records ofDecision, and Other Remedy Selection Decision Documents. U.S. Environmental ProtectionAgency. July 1999. (http://www.epa.gov/superfund/resources/remedy/rods/index.htm)
q. EPA 540-R-98-016. Close Out Procedures for NationalPriorities List Sites. U.S. Environmental Protection Agency. January 2000.(http://www.epa.gov/superfund/resources/closeout/index.htm)
r. EPA 540-R-00-002. A Guide to Developing and Documenting Cost EstimatesDuring the Feasibility Study. U.S. Environmental Protection Agency. July 2000.(http://www.epa.gov/superfund/resources/remedy/costest.htm)
1-5. Organization. This guide is intended to provide the user with the basic informationnecessary to complete or review the RA report for a given OU at a site. Throughout the guide,exhibits help illustrate the concepts discussed, while highlight boxes are used to provideinformation that is important to note, but not necessarily central to the discussion at hand. Theobjectives of each chapter and appendix are listed below.
a. Chapter 1: Introduce the guide, including its purpose, scope, and use.
b. Chapter 2: Provide background information on RAs, including the Superfundprocess, RA process, and RA completion.
EP 1110-1-1930 Jun 01
1-4
c. Chapter 3: Provide RA reporting criteria, including who should prepare the RAreport, timing of submittals, distribution, approval criteria, and a checklist of RA reportcomponents.
d. Chapter 4: Describe the components of the recommended RA report format anddescribe the information that should be included in each component.
e. Chapter 5: Provide information on how to document technology performance inthe RA report.
f. Chapter 6: Provide information on how to document project costs in the RAreport.
g. Appendix A: Provide a glossary of environmental restoration terms used in theguide.
h. Appendix B: Present an example RA report for the case of ex situ soilremediation using incineration.
i. Appendix C: Present an example RA report for a combination of in situ soil andgroundwater remediation using soil vapor extraction and air sparging.
j. Appendix D: Provide example templates for reporting costs for HCAS data entry.
EP 1110-1-1930 Jun 01
2-1
CHAPTER 2 BACKGROUND
2-1. Superfund Process.
a. General
(1) Section 105 of CERCLA, asamended by SARA, requires the U.S.Environmental Protection Agency (EPA) tomaintain the NPL, which is a record ofuncontrolled hazardous waste sites that havereleased or that pose a threat to releasehazardous substances into the environment.Pursuant to the National Oil and HazardousSubstances Pollution Contingency Plan (NCP),Title 40 Code of Federal Regulations Part 300(40 CFR 300), sites on the NPL are eligible toreceive CERCLA trust fund (Superfund)financing for RAs. Funding can only beprovided for RAs at sites that are listed as finalon the NPL.
(2) Prior to a site being listed on theNPL, a preliminary assessment/site inspection(PA/SI) is typically completed to collect thedata necessary to develop a score for the siteusing the hazard ranking system (HRS). TheHRS score ultimately determines the site’seligibility for inclusion on the NPL.
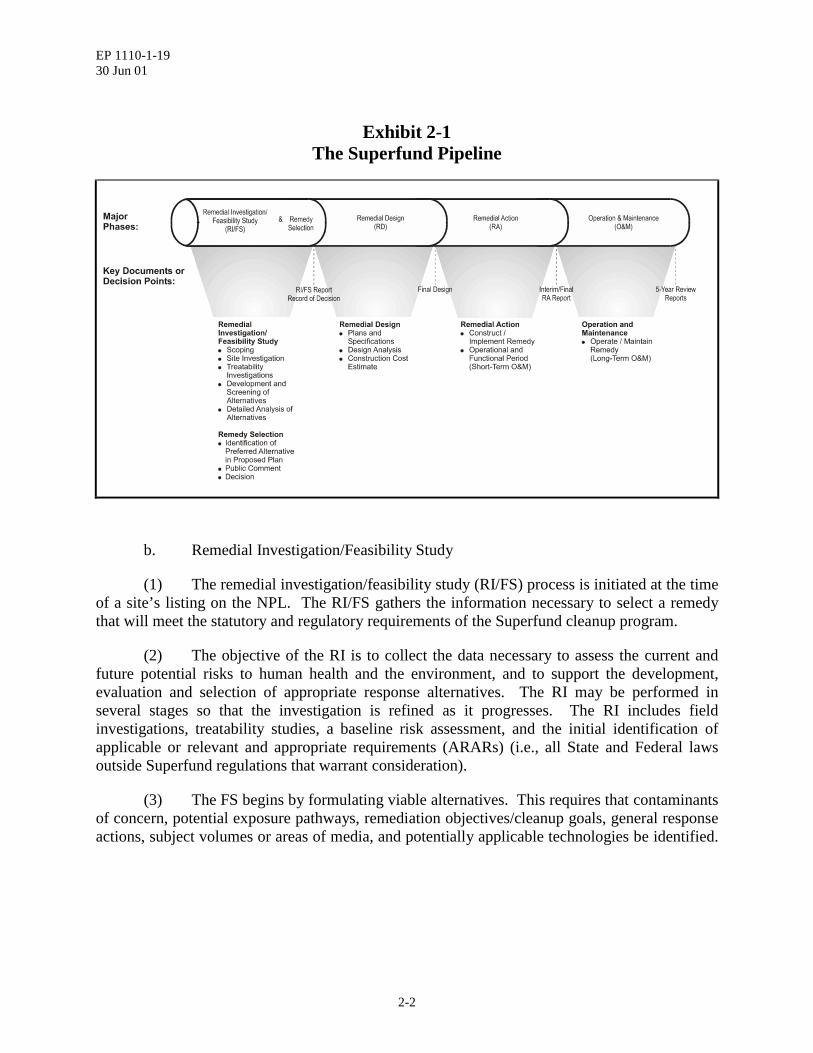
(3) Sites on the NPL are addressed by the Superfund process through a combinationof removal and remedial authority. Removal actions are short-term responses, usually to addressimmediate threats.1 Remedial actions achieve long-term permanent responses to risk. TheSuperfund pipeline (Exhibit 2-1) illustrates the major phases and decision points of theSuperfund remedial response process. The various phases of this process are briefly described inthe following paragraphs.
1 Removal authority cleanup actions achieve prompt risk reduction through activities categorized as emergency (responserequired within hours/days), time-critical (response required within 6 months), or non-time-critical (more than 6 months isavailable before action must be taken). Non-time-critical removal alternatives are analyzed in an engineering evaluation/costanalysis (EE/CA), which is considered the equivalent of a remedial investigation/feasibility study. An action memorandum is theprimary decision document, which is considered the equivalent of a record of decision.
Lead AgenciesAt or prior to the time a site is placed on the
NPL, a determination of the lead agency is made.The lead agency, represented by a remedialproject manager (RPM), has the primaryresponsibility for coordinating response action.EPA, a State environmental agency, or anotherFederal agency can serve as the lead agency.However, EPA retains final remedy selectionauthority for all “Fund-financed” actions, and forall Federal facility (FF)-led actions at NPL sites.*Generally, the lead agency RPM is responsiblefor overseeing all technical, enforcement, andfinancial aspects of a remedial response.
* The following terms are typically used todesignate which government entity serves as the leadagency in the Superfund remedial response process:“EPA-lead,” “State-lead,” and “Federal facility-lead.”In addition, the following terms refer to the source ofremediation/cleanup monies: “Fund-financed” (i.e.,remediation or cleanup money from the Superfund trustfund) and “potentially responsible party (PRP)-lead”(i.e., remediation or cleanup money derived fromenforcement action taken by lead agency).
EP 1110-1-1930 Jun 01
2-2
Exhibit 2-1The Superfund Pipeline
b. Remedial Investigation/Feasibility Study
(1) The remedial investigation/feasibility study (RI/FS) process is initiated at the timeof a site’s listing on the NPL. The RI/FS gathers the information necessary to select a remedythat will meet the statutory and regulatory requirements of the Superfund cleanup program.
(2) The objective of the RI is to collect the data necessary to assess the current andfuture potential risks to human health and the environment, and to support the development,evaluation and selection of appropriate response alternatives. The RI may be performed inseveral stages so that the investigation is refined as it progresses. The RI includes fieldinvestigations, treatability studies, a baseline risk assessment, and the initial identification ofapplicable or relevant and appropriate requirements (ARARs) (i.e., all State and Federal lawsoutside Superfund regulations that warrant consideration).
(3) The FS begins by formulating viable alternatives. This requires that contaminantsof concern, potential exposure pathways, remediation objectives/cleanup goals, general responseactions, subject volumes or areas of media, and potentially applicable technologies be identified.
EP 1110-1-1930 Jun 01
2-3
An FS may address a specific site problem, OU, or an entire site.2 Following the preliminaryscreening of alternatives, a reasonable number of possible alternatives undergo a detailedanalysis using the nine evaluation criteria listed in the NCP.
c. Remedy Selection
(1) The preferred alternative remedyfor a site or OU is discussed in detail andpresented for public comment in the proposedplan. The proposed plan briefly summarizesthe alternatives that were studied in detailduring the RI/FS, and highlights the key factorsthat lead to the selection of the preferredalternative.
(2) Following the public commentperiod associated with the proposed plan, theROD documents the selected remedy.3 TheROD introduces the significant facts, presentsan analysis of these facts, states the site-specific policy determinations, and explainshow the nine evaluation criteria wereconsidered in the remedy selection process.The remedy selection process must be carriedout in accordance with CERCLA and, to theextent practicable, with the NCP.
(3) The ROD provides theframework for the transition into the next phaseof the remedial process. Recommendedcontent and format for the ROD can be found in A Guide to Preparing Superfund ProposedPlans, Records of Decision, and Other Remedy Selection Decision Documents (EPA 540-R-98-031, July 1999). The ROD describes the remedy’s technical parameters, specifying the methodsselected to protect human health and the environment, including the treatment, engineering,institutional control components, and remedial action objectives/cleanup goals. The ROD alsoprovides a consolidated summary of the site or OU and the chosen remedy, including therationale behind the selection.
2 The RI/FS can be performed for the site as a whole, or for a particular portion of the site. The NCP defines an OU as a
“discrete action that comprises an incremental step toward comprehensively addressing site problems. This discrete portion of aremedial response manages migration, or eliminates or mitigates a release, threat of a release, or pathway of exposure” (NCP§300.5). Hence, an OU can be a certain geographic portion of a site or a specific environmental medium at the site (e.g.,groundwater or soil). The OU may also consist of a comprehensive but temporary remedy (e.g., a temporary cap over a site) thatprovides interim protection of human health and the environment before final remediation. The cleanup of a site can be dividedinto a number of OUs, depending on the complexity of the problems associated with the site.
3 For pre-SARA sites, the selected remedy may be detailed in other reports (e.g., a consent decree or an administrative order).
Potentially Responsible Parties
Under CERCLA §104, a person or an entitypotentially responsible for a release of hazardoussubstances, pollutants, or contaminants into theenvironment (i.e., a potentially responsible party(PRP)) may be allowed to conduct certainresponse actions in accordance with CERCLA§122, if a lead agency determines that the PRP, orthe PRP’s contractor, is qualified and capable.For a PRP-lead response action, either EPA or thestate agency oversees the PRP’s work anddevelops the ROD.* PRPs may participate in theremedy selection process by submittingcomments on the proposed plan during the formalpublic comment period, held prior to the finalremedy selection. However, PRPs generallyshould not be permitted to write or amend aROD.
* For detailed information regarding PRP oversight,refer to Guidance on Oversight of PotentiallyResponsible Party Remedial Investigations andFeasibility Studies, Volumes 1 and 2 (EPA 540-G-91010a and b, July 1991).
EP 1110-1-1930 Jun 01
2-4
d. Remedial Design. Plans, specifications, and other documents necessary toconstruct or implement the remedy are developed during remedial design (RD), an engineeringphase that precedes the RA. The specifications are based upon the detailed descriptions of theselected remedy and the remediation/cleanup criteria provided in the ROD.
e. Remedial Action. The RA is the implementation of the selected remedy from theROD and the RD. RA activities must conform to the remedy set forth in the ROD and otherpost-ROD decision documents (e.g., ROD amendments, explanation of significant differences).The remedial action includes the completion of an operational and functional (O&F) period(Paragraph 2-2.a), if necessary, followed by any long-term response action (LTRA) forgroundwater or surface water remedies (Paragraph 2-2.a), prior to long term operation andmaintenance (O&M) of the remedy.
Exhibit 2-2Example Pipeline Scenarios
RA
RA<10 yrs. O&M
FinalRA Report
Treatment and/or Off-Site Disposal
Containment
FinalRA Report
RA
O&M
Final RA Report(Cleanup Goals Achieved)
Groundwater and Surface Water Restoration
InterimRA Report
O&F
<1 yr.
O&F
<1 yr.
LTRA (Fund)PRP LR (PRP)
O&M (FF)
(No O&M Required)

EP 1110-1-1930 Jun 01
2-5
f. Operation and Maintenance. Operation and maintenance (O&M) are the activitiesrequired to maintain the effectiveness or the integrity of a remedy. O&M is dependent on theimplemented remedy. O&M may not be necessary, may only be required for a definedtimeframe, or may be required to be performed indefinitely.4 For remedies that require activeon-site treatment, remedial system evaluation or optimization is an important component ofO&M.5 Except for Fund-financed groundwater or surface water restoration actions coveredunder NCP §300.435(f)(4), O&M measures are initiated after the remedy has achieved theremediation objectives and cleanup goals listed in the ROD, and is operational and functional(Paragraph 2-2.a). O&M starts when the RA is complete and the State or the PRP(s) assumeresponsibility for all activities necessary to operate and/or maintain the long-term effectivenessor integrity of the actions selected in the ROD. In the case of Fund-financed measures to restoregroundwater or surface waters, that extend beyond the ten-year long-term RA period (Paragraph2-2.b), O&M is required to continue the operation of such measures until the cleanup goals areachieved.
2-2. Remedial Action Process. Besides the RA and O&M phases, the RA process typicallyincludes the operation and functional period, long-term response, cleanup goals achievedmilestone, and five-year reviews. Exhibit 2-2 provides three different pipeline scenarios to helpillustrate when these periods occur in relation to preparation of the RA report. The followingparagraphs provide a brief description of each phase or milestone.
a. Operational and Functional
(1) Operational and functional (O&F) activities are conducted after the RA has beenconstructed to ensure that it is operating as designed and functioning properly. The O&F periodis part of the RA and occurs during the last year of the RA. The NCP provides for a maximumtimeframe of one year for performing O&F activities, though EPA may extend the one-yearperiod, as appropriate. O&F determinations are made for containment (all media), groundwaterrestoration and surface water restoration remedies.6 Monitored natural attenuation remedies donot go through an O&F determination.
(2) A remedy becomes O&F either one year after O&F start, or when the remedy hasbeen determined, concurrently by EPA and the State agency, to be functioning properly andperforming as designed, whichever occurs first (40 CFR 300.435). O&F is considered to becomplete on the date that the designated Regional official approves, in writing, the interim RAreport (for sites with groundwater or surface water restoration remedies) or final RA report. This
4 Examples of remedies where O&M may have an indefinite period of performance are sites where waste is contained on-site
and the integrity of the cap must be maintained or sites where institutional controls must be maintained.5 Additional information on remedial system evaluation or optimization is available on the web at
http://www.frtr.gov/optimization/.6 Formal O&F determinations are made primarily for Fund-financed projects because the O&F milestone governs when O&M
or Long-Term RA (LTRA) begins under State authority. Federal facilities-lead projects go through determinations known as“operating properly and successfully.”
EP 1110-1-1930 Jun 01
2-6
report should not be approved until the determination has been made through an inspection thatthe remedy is, in fact, O&F (Paragraph 2-3).
b. Long-Term Response.
(1) Long-term response action (LTRA) and PRP long-term response (LR) are sub-actions of O&M used to track and assure continued Federal funding for the operation ofgroundwater or surface water restoration remedies.7 LTRA is defined as the Fund-financedoperation of groundwater and surface water restoration measures, including monitored naturalattenuation, for up to the first ten years of operation. LTRA is complete after ten years, after atechnical impracticability determination is made, or after cleanup goals are achieved anddocumented in a final RA report, whichever occurs first. LTRA transitions to traditional O&Mif cleanup goals are not achieved, or if continued monitoring is required, after ten years haveelapsed.
(2) In the past, the term LTRA has been used to describe PRP-lead groundwater andsurface water restoration measures, including monitored natural attenuation. However, PRP-leadgroundwater and surface water restoration measures, including monitored natural attenuation, arecovered by a separate action, PRP LR. Because PRP LR is a specific type of O&M, the ten-yeartimeframe does not apply. PRP LR is complete after a technical impracticability determinationis made, or cleanup goals are achieved and documented in a final RA report, whichever occursfirst.
c. Cleanup Goals Achieved. Usually preceded by the interim RA report, thismilestone signifies when cleanup goals are achieved for groundwater and surface waterrestoration, including monitored natural attenuation. “Cleanup goals achieved” is officiallyaccomplished once the final RA report is approved in writing.
d. Five-Year Reviews. If there are any hazardous substances, pollutants, orcontaminants remaining at the site above levels that do not allow for unlimited use andunrestricted exposure, EPA is required to conduct a review of the RA at least once every fiveyears to assure that human health and the environment are being protected. CERCLA §121(c)and NCP §300.430(f)(5)(iii)(C) provide the legal bases for conducting five-year reviews.Generally, five-year reviews may be discontinued when no hazardous substances, pollutants, orcontaminants remain at the site above levels that allow for unlimited use and unrestrictedexposure.
2-3. Remedial Action Completion. The RA for an OU is complete after the remedy isdetermined to be O&F (if applicable), the remediation objectives and/or cleanup goals stated in
7 LTRA and PRP LR apply to groundwater and surface water restoration measures only, including monitored natural
attenuation. These terms do not apply to groundwater and surface water restoration measures conducted under other leads;groundwater or surface water containment measures; groundwater or surface water measures initiated for the primary purpose ofproviding a safe drinking water supply; or groundwater monitoring. Federal facilities-lead sites do not use LTRA or PRP LR.Instead, groundwater and surface water restoration measures go from RA directly to O&M at these sites.
EP 1110-1-1930 Jun 01
2-7
the ROD are achieved, and the designated Regional official has approved the interim or final RAreport. Exhibit 2-3 illustrates the remedial action completion process.
Exhibit 2-3Remedial Action Completion Process
ConstructRemedial Action
Pre-Final/FinalInspection
Operational andFunctional Period
(if applicable)
InterimRemedial Action
Report
FF - Lead Inspection
Have remediationobjectives and/or cleanup
goals been achieved?
No
Cleanup GoalsAchieved
FinalRemedial Action
Report
Yes
Fund - Lead Inspection
PRP - Lead Inspection
a. Inspection Requirements.
(1) General. With any RA, regardless of lead or contracting party, the standardpractice is to conduct contract pre-final and final inspections prior to RA completion. These
EP 1110-1-1930 Jun 01
2-8
inspections are conducted to determine whether the construction is complete in accordance withthe contract design and specifications. The inspections are generally held between thecontracting party and the construction contractor, although others can be invited. If all the itemsobserved during the contract pre-final inspection are corrected or are considered insignificant,the contract pre-final inspection may automatically serve as the contract final inspection.Otherwise, a contract final inspection will be conducted later by the contracting party todetermine if these items have been corrected and completed in accordance with the RD plans andspecifications. In addition to the pre-final and final inspections, other inspections may berequired prior to completion of the RA. These include Fund-lead, PRP-lead, and Federal facility(FF)-lead inspections as described below.
(2) Fund – Lead. The NCP requires an additional set of inspections at Fund-financedsites that will undergo LTRA and/or O&M. During this set of inspections, EPA and the Stateconcurrently determine the end of the O&F period. After an O&F determination is made, theremedy enters LTRA or O&M. If convenient, these inspections may be conducted concurrentlywith the contract pre-final or final inspection.
(3) PRP – Lead. For PRP-lead sites, the Revised Model CERCLA RD/RA ConsentDecree (Federal Register, Vol. 60, No. 145, pp. 38817-38837, July 28, 1995) requires a pre-certification inspection upon completion of the RA. This inspection, which involves the PRP(s),EPA, and the State, is intended to determine if the RA is fully complete and if the remediationobjectives/cleanup goals are attained. After the pre-certification inspection, the PRPs are alsorequired to submit a written report, for EPA approval, stating that the RA is complete in fullcompliance with the requirements of the Consent Decree. If it contains the proper information,this report can serve as the RA report for the OU. For groundwater and surface water restorationremedies, where an interim RA report is appropriate, EPA may require the preparation of aseparate (interim) RA report for groundwater or surface water, since it is not normally requiredin the Consent Decree.
(4) FF – Lead. Federal facility agreements (FFAs) generally require an additional setof inspections to determine that all aspects of the remedy have been implemented in accordancewith applicable enforcement documents and the ROD. Participants include the EPA, Federalfacility, oversight contractor, and the State. These inspections may be conducted concurrentlywith either of the pre-final or final inspections described above.
b. Remedial Action Reporting. When the RA for an operable unit is complete, theRA report is prepared. There are two basic types of RA reports, interim and final. An interimRA report is completed only for RAs that include groundwater or surface water restorationremedies, including monitored natural attenuation. Interim reports are used because of theextended duration between the completion of the treatment system construction (or the RODsignature, in the case of monitored natural attenuation) and the achievement of the cleanup goals.A final RA report is complete when the remediation objectives/cleanup goals are achieved.More detailed information on preparation, timing, distribution, approval, and review of RAreports is provided in Chapter 3.

EP 1110-1-1930 Jun 01
3-1
CHAPTER 3 REPORTING CRITERIA
3-1. Preparation. The party most familiar with the RD, the construction efforts, and theassociated project costs, should prepare the RA report. This familiarity will provide the bestopportunity to discuss the successes, difficulties, and lessons learned during the project. TheEPA RPM and contractor for the RA (e.g., PRP, U.S. Army Corps of Engineers, State or EPAcontractor) are typically the parties most familiar with the RA. While the EPA RPM can andsometimes does prepare the RA report, the contractor is usually tasked with that effort.
3-2. Timing. For most OUs, the RA report should be prepared and submitted to the EPAregion (Region) or appropriate regulatory authority for approval within 90 days after the contractfinal inspection of the completed construction.1 At OUs where LTRA is being performed, aninterim RA report should be prepared once the remedy is constructed (within 90 days after thefinal inspection). The interim RA report must then be amended and finalized once the RAcleanup goals specified in the ROD are achieved. An interim RA report is required because ofthe extended period of time that may elapse between the completion of construction andachievement of cleanup goals. Where actual costs are not known at the time of reportpreparation (e.g., pending claims, change orders), estimated costs may be used (Chapter 6).
3-3. Distribution.
a. Once the Region or appropriate regulatory authority has approved the RA report,either interim or final, depending on the remedy, the original report is retained in the Regionalsite file, and an approved copy should be returned to the report preparer. Upon completion of theRA report, the Region or appropriate regulatory authority is required to notify the appropriateNatural Resource Trustees listed in the Regional Contingency Plans regarding the completion ofthe RA. The Region or appropriate regulatory authority will provide a copy of the approved RAreport to the Trustees within one week of the report’s approval.
b. For projects in which the USACE is involved, a copy of the RA report shall befurnished to HQ USACE and the USACE HTRW Center of Expertise (CX). Mailing addressesare provided in Appendix D.
3-4. Approval.
a. For a given site or OU, the RA is considered to be complete once the designatedEPA Regional official has approved the interim or final RA report in writing. An interim RAreport is completed only for RAs that include groundwater or surface water restoration remedies(including monitored natural attenuation). Interim reports are used because of the extendedperiod of time that typically transpires between the completion of the treatment systemconstruction (or the ROD signature, in the case of monitored natural attenuation) and the
1 For PRP-lead sites, the RA report is due within 90 days after the official determination has been made that the remediation
objectives/cleanup goals have been achieved.
EP 1110-1-1930 Jun 01
3-2
achievement of the cleanup goals. A final RA report is complete once the remediationobjectives/cleanup goals are achieved.
b. Criteria required for EPA approval of an interim RA report include:
(1) The remedy to reduce contaminant concentrations and achieve the cleanup goals,including groundwater or surface water restoration, with active treatment or natural attenuation,is installed;
(2) For active treatment, the construction of the treatment system is complete and thesystem is operating as intended (i.e., the remedy is determined to be O&F at Fund-financedsites);
(3) For monitored natural attenuation, any necessary RA components, such asmonitoring wells, are constructed;
(4) If the OU addresses media other than groundwater, construction activities arecomplete and RA objectives specified in the ROD are achieved for these components;
(5) A final inspection is conducted;
(6) Institutional controls, if applicable, are in place; and
(7) The interim RA report includes the information described in Chapter 4 of thisguide.
c. Criteria required for the approval of a final RA report include:
(1) All construction activities are complete, including site restoration anddemobilization;
(2) All RA objectives specified in the ROD, including those for groundwater andsurface water (if applicable), are achieved;
(3) A final inspection is conducted;
(4) Institutional or engineering controls, such as containment (if applicable), are inplace (i.e., the remedy is determined to be O&F at a Fund-financed site); and
(5) The final RA report includes the information described in Chapter 4 of this guide.
d. When an interim RA report has already been prepared, the interim RA report maysimply be amended to create the final RA report. The amendment would add information onactivities that occurred after the interim RA report was completed, including a final actual costbreakdown.
3-5. Review. Prior to submittal of the RA report, it should be reviewed to ensure that itcontains the necessary information. Exhibit 3-1 provides a checklist that summarizes the

EP 1110-1-1930 Jun 01
3-3
recommended content of the RA report. Each component listed in the checklist is furtherdescribed in Chapter 4, including examples.
Exhibit 3-1Remedial Action Report Checklist
SECTION COMPONENT
I. Introduction ♦ Include a brief description of the location, size, environmental setting,and operational history of the site.
♦ Describe the operations and waste management practices thatcontributed to contamination of the site.
♦ Describe the regulatory and enforcement history of the site.♦ Describe the major findings and results of site investigation activities.♦ Describe prior removal and remedial activities at the site.♦ Describe the OUs designated at the site and introduce the OU for which
the RA report applies.
II. Operable Unit Background ♦ Summarize requirements specified in the ROD for the OU. Includeinformation on the remediation objectives/cleanup goals, institutionalcontrols, monitoring requirements, operation and maintenancerequirements, and other parameters applicable to the design,construction, operation, and performance of the RA.
♦ Provide additional information regarding the basis for determining theremediation objectives/cleanup goals for the OU, including informationon planned future land use.
♦ Summarize the remedial design, including any significant regulatory ortechnical considerations or events occurring during the design.
♦ Identify and briefly discuss any ROD amendments, explanation ofsignificant differences, or technical impracticability waivers.
III. Construction Activities ♦ Provide a step-by-step description of the major activities undertaken toconstruct and implement the RA (e.g., mobilization and site preparatorywork; construction of the treatment system; associated site work, such asfencing and surface water collection and control; system operation andmonitoring; and sampling activities).
♦ If a treatment technology was used, refer to Appendix A for siteconditions, matrix characteristics and/or operating parameters of thesystem.
EP 1110-1-1930 Jun 01
3-4
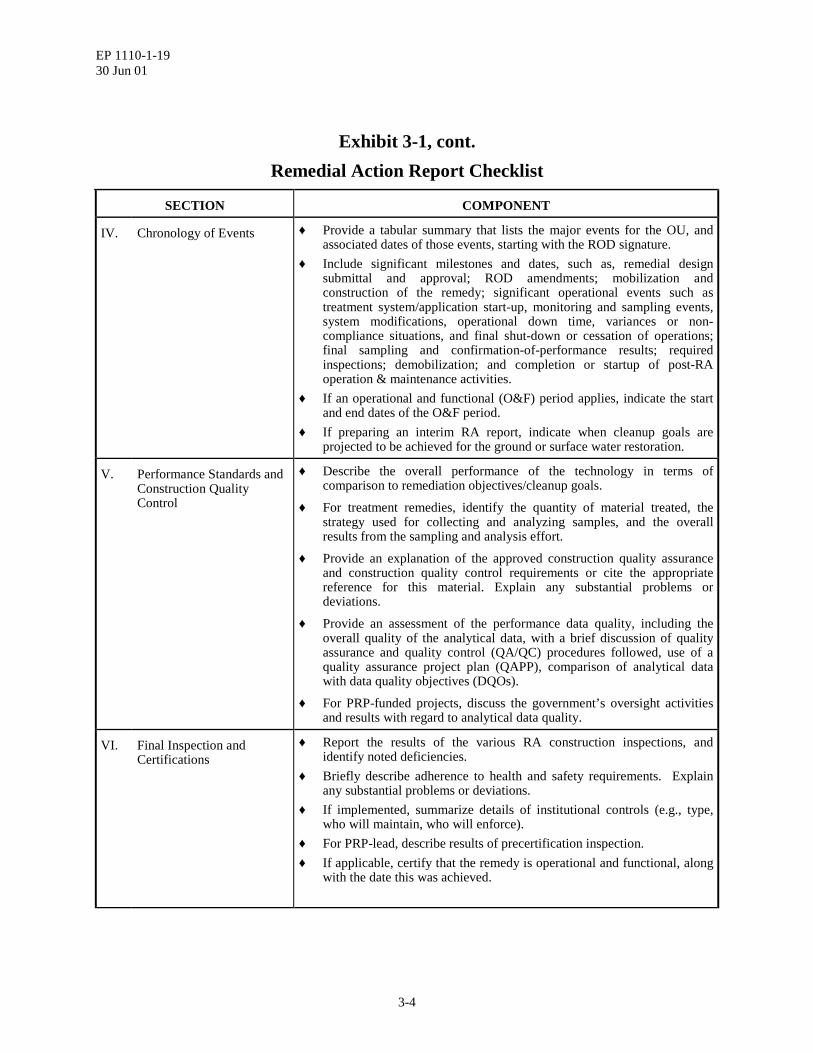
Exhibit 3-1, cont.Remedial Action Report Checklist
SECTION COMPONENT
IV. Chronology of Events ♦ Provide a tabular summary that lists the major events for the OU, andassociated dates of those events, starting with the ROD signature.
♦ Include significant milestones and dates, such as, remedial designsubmittal and approval; ROD amendments; mobilization andconstruction of the remedy; significant operational events such astreatment system/application start-up, monitoring and sampling events,system modifications, operational down time, variances or non-compliance situations, and final shut-down or cessation of operations;final sampling and confirmation-of-performance results; requiredinspections; demobilization; and completion or startup of post-RAoperation & maintenance activities.
♦ If an operational and functional (O&F) period applies, indicate the startand end dates of the O&F period.
♦ If preparing an interim RA report, indicate when cleanup goals areprojected to be achieved for the ground or surface water restoration.
V. Performance Standards andConstruction QualityControl
♦ Describe the overall performance of the technology in terms ofcomparison to remediation objectives/cleanup goals.
♦ For treatment remedies, identify the quantity of material treated, thestrategy used for collecting and analyzing samples, and the overallresults from the sampling and analysis effort.
♦ Provide an explanation of the approved construction quality assuranceand construction quality control requirements or cite the appropriatereference for this material. Explain any substantial problems ordeviations.
♦ Provide an assessment of the performance data quality, including theoverall quality of the analytical data, with a brief discussion of qualityassurance and quality control (QA/QC) procedures followed, use of aquality assurance project plan (QAPP), comparison of analytical datawith data quality objectives (DQOs).
♦ For PRP-funded projects, discuss the government’s oversight activitiesand results with regard to analytical data quality.
VI. Final Inspection andCertifications
♦ Report the results of the various RA construction inspections, andidentify noted deficiencies.
♦ Briefly describe adherence to health and safety requirements. Explainany substantial problems or deviations.
♦ If implemented, summarize details of institutional controls (e.g., type,who will maintain, who will enforce).
♦ For PRP-lead, describe results of precertification inspection.♦ If applicable, certify that the remedy is operational and functional, along
with the date this was achieved.
EP 1110-1-1930 Jun 01
3-5
Exhibit 3-1, cont.Remedial Action Report Checklist
SECTION COMPONENT
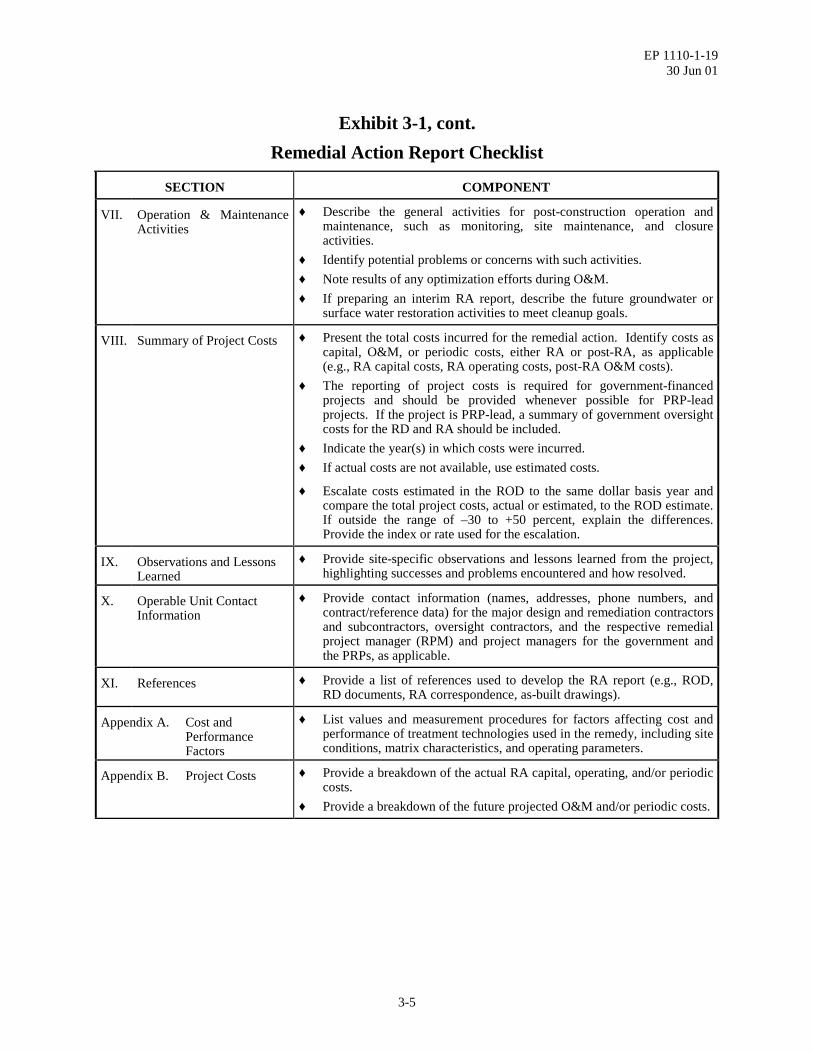
VII. Operation & MaintenanceActivities
♦ Describe the general activities for post-construction operation andmaintenance, such as monitoring, site maintenance, and closureactivities.
♦ Identify potential problems or concerns with such activities.♦ Note results of any optimization efforts during O&M.♦ If preparing an interim RA report, describe the future groundwater or
surface water restoration activities to meet cleanup goals.
VIII. Summary of Project Costs ♦ Present the total costs incurred for the remedial action. Identify costs ascapital, O&M, or periodic costs, either RA or post-RA, as applicable(e.g., RA capital costs, RA operating costs, post-RA O&M costs).
♦ The reporting of project costs is required for government-financedprojects and should be provided whenever possible for PRP-leadprojects. If the project is PRP-lead, a summary of government oversightcosts for the RD and RA should be included.
♦ Indicate the year(s) in which costs were incurred.♦ If actual costs are not available, use estimated costs.
♦ Escalate costs estimated in the ROD to the same dollar basis year andcompare the total project costs, actual or estimated, to the ROD estimate.If outside the range of –30 to +50 percent, explain the differences.Provide the index or rate used for the escalation.
IX. Observations and LessonsLearned
♦ Provide site-specific observations and lessons learned from the project,highlighting successes and problems encountered and how resolved.
X. Operable Unit ContactInformation
♦ Provide contact information (names, addresses, phone numbers, andcontract/reference data) for the major design and remediation contractorsand subcontractors, oversight contractors, and the respective remedialproject manager (RPM) and project managers for the government andthe PRPs, as applicable.
XI. References ♦ Provide a list of references used to develop the RA report (e.g., ROD,RD documents, RA correspondence, as-built drawings).
Appendix A. Cost andPerformanceFactors
♦ List values and measurement procedures for factors affecting cost andperformance of treatment technologies used in the remedy, including siteconditions, matrix characteristics, and operating parameters.
Appendix B. Project Costs ♦ Provide a breakdown of the actual RA capital, operating, and/or periodiccosts.
♦ Provide a breakdown of the future projected O&M and/or periodic costs.

EP 1110-1-1930 Jun 01
4-1
CHAPTER 4 REPORT COMPONENTS
4-1. General.
a. This chapter describes the components of the recommended format for the RAreport and details the information that should be included in each component. The componentsare divided into the following:
(1) Abstract
(2) Section 1: Introduction
(3) Section 2: Operable Unit Background
(4) Section 3: Construction Activities
(5) Section 4: Chronology of Events
(6) Section 5: Performance Standards and Construction Quality Control
(7) Section 6: Final Inspection and Certifications
(8) Section 7: Operation & Maintenance Activities
(9) Section 8: Summary of Project Costs
(10) Section 9: Observations and Lessons Learned
(11) Section 10: Operable Unit Contact Information
(12) Section 11: References
(13) Appendix A: Cost and Performance Factors
(14) Appendix B: Project Costs
b. The RA report should be straightforward and easily understood, using consistentCERCLA terminology where applicable. The report length should generally not exceed twentypages, excluding appendices, relying on brief descriptions for each report component. Tablesand figures that support the report may be inserted within the text, at the end of each section, orcollectively at the end of the report. An example RA report abstract is shown in Exhibit 4-1.Examples for other report components are provided in the following chapter sections thatdescribe each component.
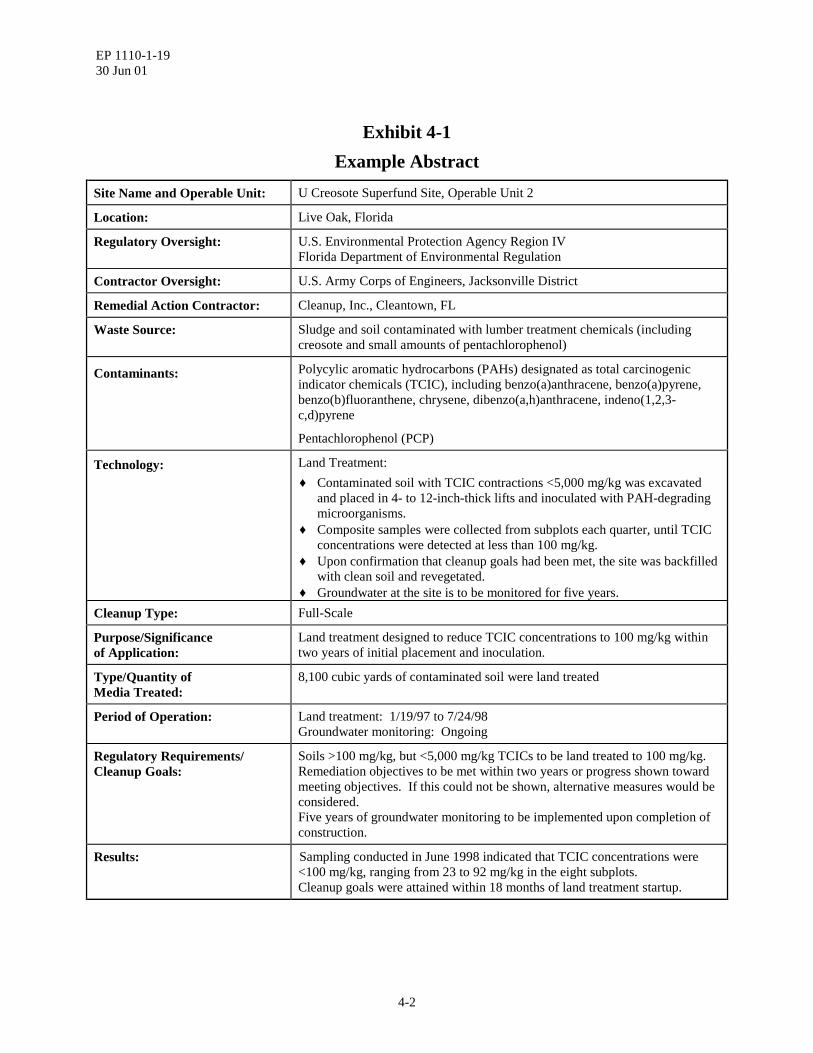
EP 1110-1-1930 Jun 01
4-2
Exhibit 4-1Example Abstract
Site Name and Operable Unit: U Creosote Superfund Site, Operable Unit 2
Location: Live Oak, Florida
Regulatory Oversight: U.S. Environmental Protection Agency Region IVFlorida Department of Environmental Regulation
Contractor Oversight: U.S. Army Corps of Engineers, Jacksonville District
Remedial Action Contractor: Cleanup, Inc., Cleantown, FL
Waste Source: Sludge and soil contaminated with lumber treatment chemicals (includingcreosote and small amounts of pentachlorophenol)
Contaminants: Polycylic aromatic hydrocarbons (PAHs) designated as total carcinogenicindicator chemicals (TCIC), including benzo(a)anthracene, benzo(a)pyrene,benzo(b)fluoranthene, chrysene, dibenzo(a,h)anthracene, indeno(1,2,3-c,d)pyrene
Pentachlorophenol (PCP)
Technology: Land Treatment:♦ Contaminated soil with TCIC contractions <5,000 mg/kg was excavated
and placed in 4- to 12-inch-thick lifts and inoculated with PAH-degradingmicroorganisms.
♦ Composite samples were collected from subplots each quarter, until TCICconcentrations were detected at less than 100 mg/kg.
♦ Upon confirmation that cleanup goals had been met, the site was backfilledwith clean soil and revegetated.
♦ Groundwater at the site is to be monitored for five years.Cleanup Type: Full-Scale
Purpose/Significanceof Application:
Land treatment designed to reduce TCIC concentrations to 100 mg/kg withintwo years of initial placement and inoculation.
Type/Quantity ofMedia Treated:
8,100 cubic yards of contaminated soil were land treated
Period of Operation: Land treatment: 1/19/97 to 7/24/98Groundwater monitoring: Ongoing
Regulatory Requirements/Cleanup Goals:
Soils >100 mg/kg, but <5,000 mg/kg TCICs to be land treated to 100 mg/kg.Remediation objectives to be met within two years or progress shown towardmeeting objectives. If this could not be shown, alternative measures would beconsidered.Five years of groundwater monitoring to be implemented upon completion ofconstruction.
Results: Sampling conducted in June 1998 indicated that TCIC concentrations were<100 mg/kg, ranging from 23 to 92 mg/kg in the eight subplots.Cleanup goals were attained within 18 months of land treatment startup.

EP 1110-1-1930 Jun 01
4-3
Exhibit 4-1, cont.Example Abstract
Costs: Total actual cost = $435,523 with RA capital costs of $303,026 and RAoperating costs of $132,497.Total estimated remaining O&M cost = $21,000 for five years ofgroundwater monitoring.The technology-specific unit cost of land treatment was calculated at$33.73 per cubic yard.
Description: From 1948 to 1986, the ABC company operated the U Creosote site as alumber treatment facility. Lumber treatment processes included thepressure-treatment of lumber products. Small rail cars were used to movelumber to two treatment cylinders. A mixture of either creosote and wateror PCP and petroleum was used to treat the lumber. The treated lumberwas dried on racks over bare soil and stored in an area north of thetreatment cylinders.
The results of a remedial investigation/feasibility study (RI/FS) conductedat the site between 1992 and 1996 confirmed that soils and sediments in thelagoon and drainage ditch were contaminated with polycyclic aromatichydrocarbons (PAH). During the RI/FS, EPA and the PRPs agreed toaddress the site as two operable units (OUs). OU 1 includes the lagoon andformer plant facility, which has been addressed separately. The record ofdecision for OU 2 was signed on March 8, 1996.
During land treatment, the soil for each of three lifts was placed 4 to 12inches thick in the land treatment area and inoculated with PAH-degradingmicroorganisms. An inoculum was sprayed on the soil and the landtreatment area was cultivated once every two weeks. An irrigation systemwas used to maintain a 10-percent soil moisture content. The concentrationof microorganisms in the soils was found to be adequate to supportbiological activity, and no inoculum was applied for the second or third lift.Additionally, the total number of lifts applied to each subplot variedbecause several of the half-acre areas exceeded the TCIC concentrations of100 mg/kg. Subsequently, no additional soil was placed in those subplotsuntil the analytical results indicated less than 100 mg/kg.
On October 17, 1998, the PRPs provided a written report that the remedialaction has been fully performed and the performance standards of theconsent decree have been attained. As specified in the ROD, the PRPs willcontinue semiannual monitoring of groundwater through 2002 to confirmthat groundwater will not be adversely impacted by the land treatmentactivities.
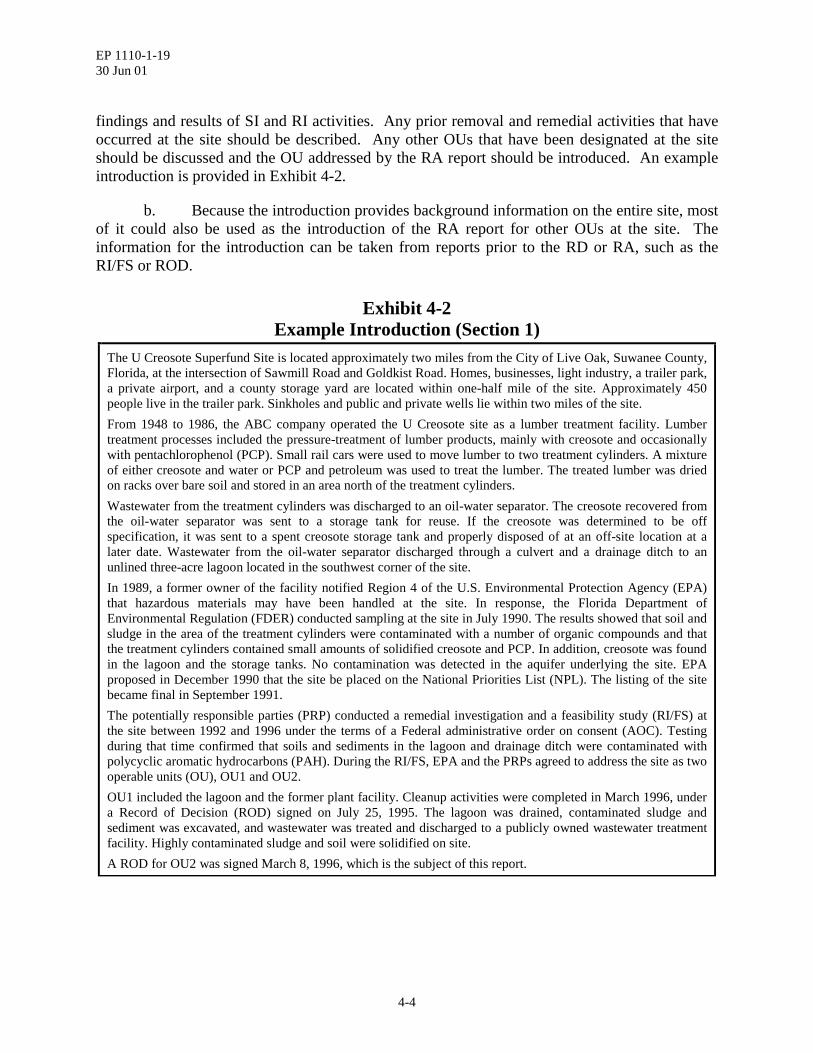
4-2. Introduction.
a. The introduction should include a brief description of the location, size,environmental setting, and history of the site. The site history should describe the operations andwaste management practices that contributed to the contamination of the site, and the regulatoryand enforcement activities that have occurred. The introduction should also discuss the major
EP 1110-1-1930 Jun 01
4-4
findings and results of SI and RI activities. Any prior removal and remedial activities that haveoccurred at the site should be described. Any other OUs that have been designated at the siteshould be discussed and the OU addressed by the RA report should be introduced. An exampleintroduction is provided in Exhibit 4-2.
b. Because the introduction provides background information on the entire site, mostof it could also be used as the introduction of the RA report for other OUs at the site. Theinformation for the introduction can be taken from reports prior to the RD or RA, such as theRI/FS or ROD.
Exhibit 4-2Example Introduction (Section 1)
The U Creosote Superfund Site is located approximately two miles from the City of Live Oak, Suwanee County,Florida, at the intersection of Sawmill Road and Goldkist Road. Homes, businesses, light industry, a trailer park,a private airport, and a county storage yard are located within one-half mile of the site. Approximately 450people live in the trailer park. Sinkholes and public and private wells lie within two miles of the site.From 1948 to 1986, the ABC company operated the U Creosote site as a lumber treatment facility. Lumbertreatment processes included the pressure-treatment of lumber products, mainly with creosote and occasionallywith pentachlorophenol (PCP). Small rail cars were used to move lumber to two treatment cylinders. A mixtureof either creosote and water or PCP and petroleum was used to treat the lumber. The treated lumber was driedon racks over bare soil and stored in an area north of the treatment cylinders.Wastewater from the treatment cylinders was discharged to an oil-water separator. The creosote recovered fromthe oil-water separator was sent to a storage tank for reuse. If the creosote was determined to be offspecification, it was sent to a spent creosote storage tank and properly disposed of at an off-site location at alater date. Wastewater from the oil-water separator discharged through a culvert and a drainage ditch to anunlined three-acre lagoon located in the southwest corner of the site.In 1989, a former owner of the facility notified Region 4 of the U.S. Environmental Protection Agency (EPA)that hazardous materials may have been handled at the site. In response, the Florida Department ofEnvironmental Regulation (FDER) conducted sampling at the site in July 1990. The results showed that soil andsludge in the area of the treatment cylinders were contaminated with a number of organic compounds and thatthe treatment cylinders contained small amounts of solidified creosote and PCP. In addition, creosote was foundin the lagoon and the storage tanks. No contamination was detected in the aquifer underlying the site. EPAproposed in December 1990 that the site be placed on the National Priorities List (NPL). The listing of the sitebecame final in September 1991.The potentially responsible parties (PRP) conducted a remedial investigation and a feasibility study (RI/FS) atthe site between 1992 and 1996 under the terms of a Federal administrative order on consent (AOC). Testingduring that time confirmed that soils and sediments in the lagoon and drainage ditch were contaminated withpolycyclic aromatic hydrocarbons (PAH). During the RI/FS, EPA and the PRPs agreed to address the site as twooperable units (OU), OU1 and OU2.OU1 included the lagoon and the former plant facility. Cleanup activities were completed in March 1996, undera Record of Decision (ROD) signed on July 25, 1995. The lagoon was drained, contaminated sludge andsediment was excavated, and wastewater was treated and discharged to a publicly owned wastewater treatmentfacility. Highly contaminated sludge and soil were solidified on site.A ROD for OU2 was signed March 8, 1996, which is the subject of this report.
EP 1110-1-1930 Jun 01
4-5
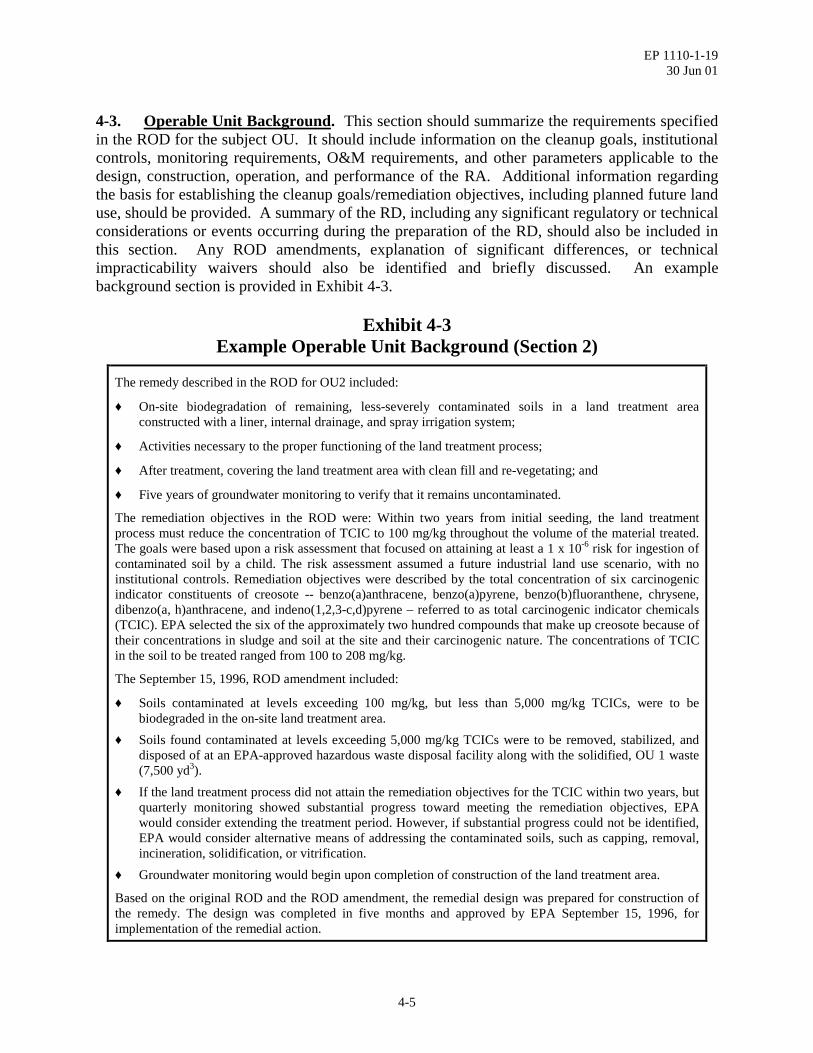
4-3. Operable Unit Background. This section should summarize the requirements specifiedin the ROD for the subject OU. It should include information on the cleanup goals, institutionalcontrols, monitoring requirements, O&M requirements, and other parameters applicable to thedesign, construction, operation, and performance of the RA. Additional information regardingthe basis for establishing the cleanup goals/remediation objectives, including planned future landuse, should be provided. A summary of the RD, including any significant regulatory or technicalconsiderations or events occurring during the preparation of the RD, should also be included inthis section. Any ROD amendments, explanation of significant differences, or technicalimpracticability waivers should also be identified and briefly discussed. An examplebackground section is provided in Exhibit 4-3.
Exhibit 4-3Example Operable Unit Background (Section 2)
The remedy described in the ROD for OU2 included:
♦ On-site biodegradation of remaining, less-severely contaminated soils in a land treatment areaconstructed with a liner, internal drainage, and spray irrigation system;
♦ Activities necessary to the proper functioning of the land treatment process;
♦ After treatment, covering the land treatment area with clean fill and re-vegetating; and
♦ Five years of groundwater monitoring to verify that it remains uncontaminated.
The remediation objectives in the ROD were: Within two years from initial seeding, the land treatmentprocess must reduce the concentration of TCIC to 100 mg/kg throughout the volume of the material treated.The goals were based upon a risk assessment that focused on attaining at least a 1 x 10⁻⁶ risk for ingestion ofcontaminated soil by a child. The risk assessment assumed a future industrial land use scenario, with noinstitutional controls. Remediation objectives were described by the total concentration of six carcinogenicindicator constituents of creosote -- benzo(a)anthracene, benzo(a)pyrene, benzo(b)fluoranthene, chrysene,dibenzo(a, h)anthracene, and indeno(1,2,3-c,d)pyrene – referred to as total carcinogenic indicator chemicals(TCIC). EPA selected the six of the approximately two hundred compounds that make up creosote because oftheir concentrations in sludge and soil at the site and their carcinogenic nature. The concentrations of TCICin the soil to be treated ranged from 100 to 208 mg/kg.
The September 15, 1996, ROD amendment included:
♦ Soils contaminated at levels exceeding 100 mg/kg, but less than 5,000 mg/kg TCICs, were to bebiodegraded in the on-site land treatment area.
♦ Soils found contaminated at levels exceeding 5,000 mg/kg TCICs were to be removed, stabilized, anddisposed of at an EPA-approved hazardous waste disposal facility along with the solidified, OU 1 waste(7,500 yd3).
♦ If the land treatment process did not attain the remediation objectives for the TCIC within two years, butquarterly monitoring showed substantial progress toward meeting the remediation objectives, EPAwould consider extending the treatment period. However, if substantial progress could not be identified,EPA would consider alternative means of addressing the contaminated soils, such as capping, removal,incineration, solidification, or vitrification.
♦ Groundwater monitoring would begin upon completion of construction of the land treatment area.
Based on the original ROD and the ROD amendment, the remedial design was prepared for construction ofthe remedy. The design was completed in five months and approved by EPA September 15, 1996, forimplementation of the remedial action.
EP 1110-1-1930 Jun 01
4-6
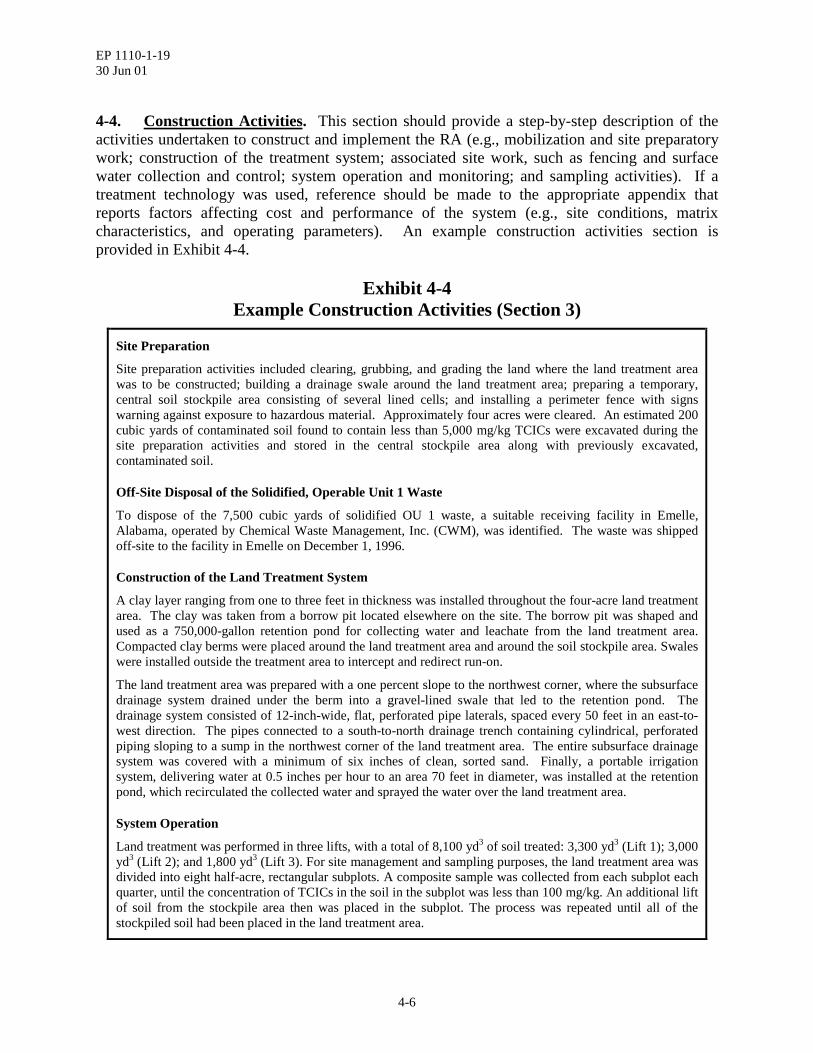
4-4. Construction Activities. This section should provide a step-by-step description of theactivities undertaken to construct and implement the RA (e.g., mobilization and site preparatorywork; construction of the treatment system; associated site work, such as fencing and surfacewater collection and control; system operation and monitoring; and sampling activities). If atreatment technology was used, reference should be made to the appropriate appendix thatreports factors affecting cost and performance of the system (e.g., site conditions, matrixcharacteristics, and operating parameters). An example construction activities section isprovided in Exhibit 4-4.
Exhibit 4-4Example Construction Activities (Section 3)
Site Preparation
Site preparation activities included clearing, grubbing, and grading the land where the land treatment areawas to be constructed; building a drainage swale around the land treatment area; preparing a temporary,central soil stockpile area consisting of several lined cells; and installing a perimeter fence with signswarning against exposure to hazardous material. Approximately four acres were cleared. An estimated 200cubic yards of contaminated soil found to contain less than 5,000 mg/kg TCICs were excavated during thesite preparation activities and stored in the central stockpile area along with previously excavated,contaminated soil.
Off-Site Disposal of the Solidified, Operable Unit 1 Waste
To dispose of the 7,500 cubic yards of solidified OU 1 waste, a suitable receiving facility in Emelle,Alabama, operated by Chemical Waste Management, Inc. (CWM), was identified. The waste was shippedoff-site to the facility in Emelle on December 1, 1996.
Construction of the Land Treatment System
A clay layer ranging from one to three feet in thickness was installed throughout the four-acre land treatmentarea. The clay was taken from a borrow pit located elsewhere on the site. The borrow pit was shaped andused as a 750,000-gallon retention pond for collecting water and leachate from the land treatment area.Compacted clay berms were placed around the land treatment area and around the soil stockpile area. Swaleswere installed outside the treatment area to intercept and redirect run-on.
The land treatment area was prepared with a one percent slope to the northwest corner, where the subsurfacedrainage system drained under the berm into a gravel-lined swale that led to the retention pond. Thedrainage system consisted of 12-inch-wide, flat, perforated pipe laterals, spaced every 50 feet in an east-to-west direction. The pipes connected to a south-to-north drainage trench containing cylindrical, perforatedpiping sloping to a sump in the northwest corner of the land treatment area. The entire subsurface drainagesystem was covered with a minimum of six inches of clean, sorted sand. Finally, a portable irrigationsystem, delivering water at 0.5 inches per hour to an area 70 feet in diameter, was installed at the retentionpond, which recirculated the collected water and sprayed the water over the land treatment area.
System Operation
Land treatment was performed in three lifts, with a total of 8,100 yd3 of soil treated: 3,300 yd3 (Lift 1); 3,000yd3 (Lift 2); and 1,800 yd3 (Lift 3). For site management and sampling purposes, the land treatment area wasdivided into eight half-acre, rectangular subplots. A composite sample was collected from each subplot eachquarter, until the concentration of TCICs in the soil in the subplot was less than 100 mg/kg. An additional liftof soil from the stockpile area then was placed in the subplot. The process was repeated until all of thestockpiled soil had been placed in the land treatment area.
EP 1110-1-1930 Jun 01
4-7
Exhibit 4-4, cont.Example Construction Activities (Section 3)
In general, the soil for each lift was placed 4 to 12 inches thick in the land treatment area and inoculated withPAH-degrading microorganisms. The inoculum, sprayed on the soil, was developed by growing seedcultures in mobile, on-site reactor tanks equipped with aeration and mixing equipment. The land treatmentarea was cultivated once every two weeks. An irrigation system was used to maintain a 10-percent soilmoisture content. The concentration of microorganisms in the soils at the land treatment area was found tobe adequate to support biological activity, and no inoculum was applied for the second or third lift.Additionally, the total number of lifts applied to each subplot varied because several of the half-acre areasexceeded the TCIC concentrations of 100 mg/kg. Subsequently, no additional soil was placed in thosesubplots until the analytical results indicated less than 100 mg/kg.
Appendix A reports matrix characteristics and operating parameters of the land treatment system.
Approximately 50 cubic yards of construction debris were removed from the soil and buried on the site.After validation of the final sampling results and determination that the remediation objectives had been met,the site was backfilled with clean soil and seeded on September 1, 1998.
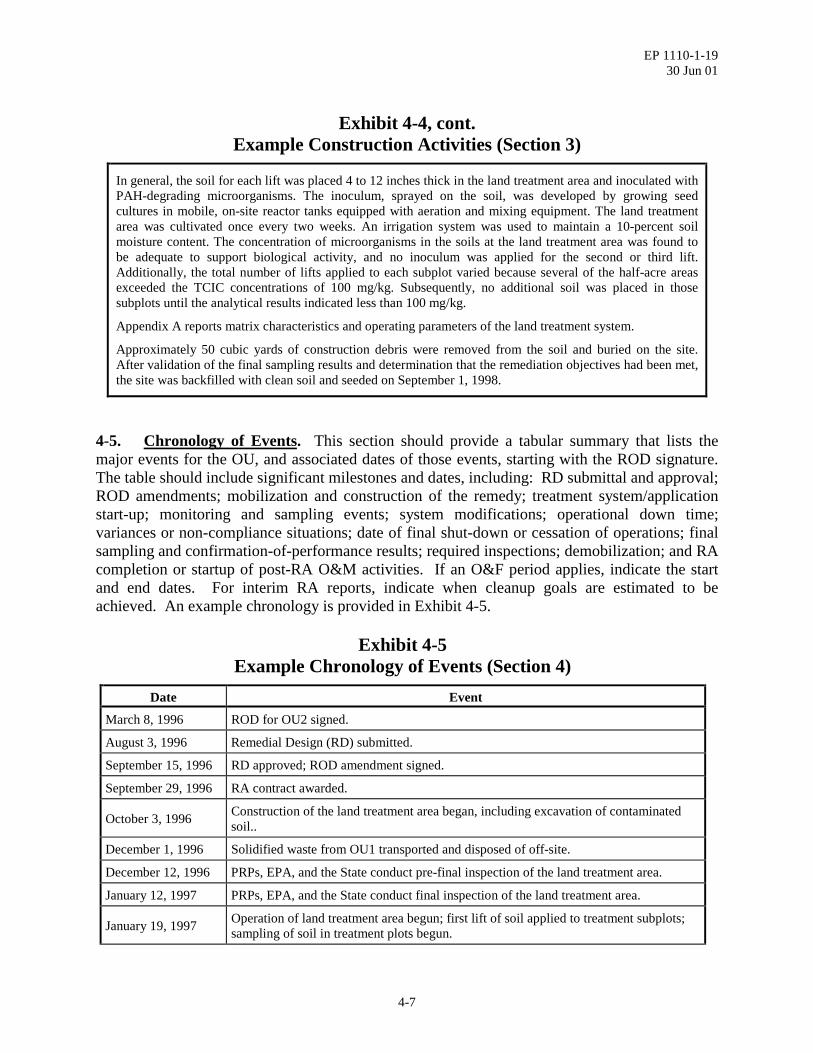
4-5. Chronology of Events. This section should provide a tabular summary that lists themajor events for the OU, and associated dates of those events, starting with the ROD signature.The table should include significant milestones and dates, including: RD submittal and approval;ROD amendments; mobilization and construction of the remedy; treatment system/applicationstart-up; monitoring and sampling events; system modifications; operational down time;variances or non-compliance situations; date of final shut-down or cessation of operations; finalsampling and confirmation-of-performance results; required inspections; demobilization; and RAcompletion or startup of post-RA O&M activities. If an O&F period applies, indicate the startand end dates. For interim RA reports, indicate when cleanup goals are estimated to beachieved. An example chronology is provided in Exhibit 4-5.
Exhibit 4-5Example Chronology of Events (Section 4)
Date Event
March 8, 1996 ROD for OU2 signed.
August 3, 1996 Remedial Design (RD) submitted.
September 15, 1996 RD approved; ROD amendment signed.
September 29, 1996 RA contract awarded.
October 3, 1996 Construction of the land treatment area began, including excavation of contaminatedsoil..
December 1, 1996 Solidified waste from OU1 transported and disposed of off-site.
December 12, 1996 PRPs, EPA, and the State conduct pre-final inspection of the land treatment area.
January 12, 1997 PRPs, EPA, and the State conduct final inspection of the land treatment area.
January 19, 1997 Operation of land treatment area begun; first lift of soil applied to treatment subplots;sampling of soil in treatment plots begun.
EP 1110-1-1930 Jun 01
4-8
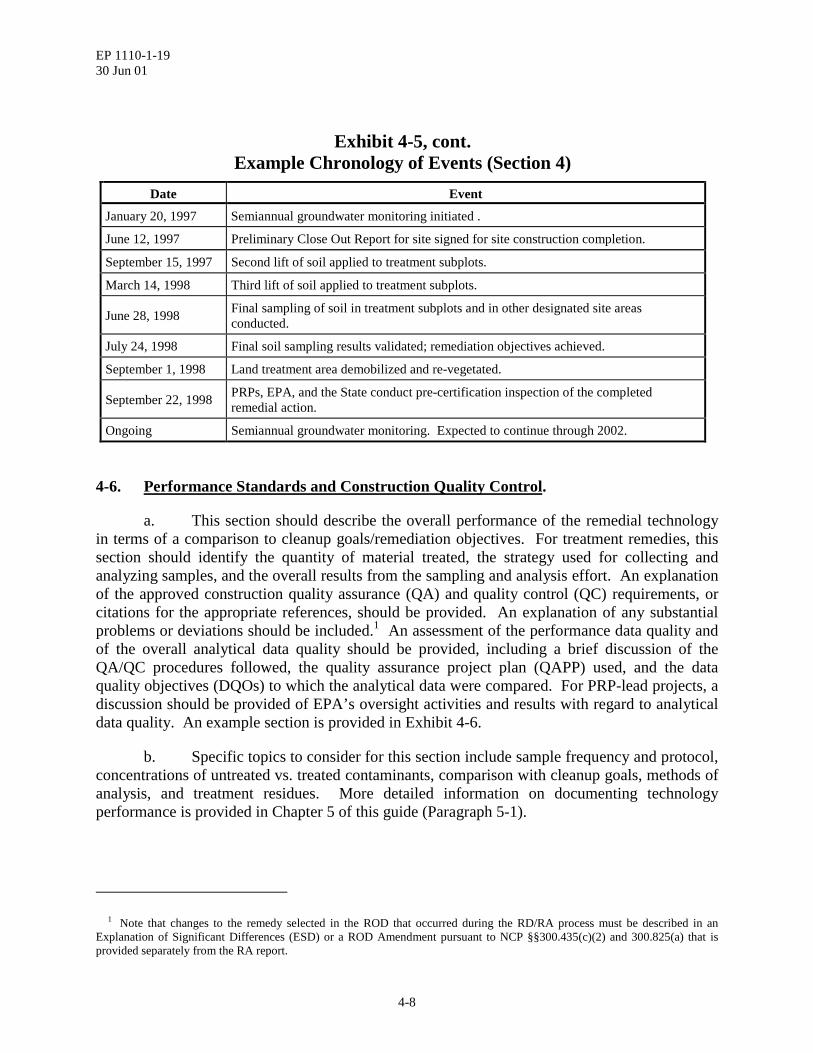
Exhibit 4-5, cont.Example Chronology of Events (Section 4)
Date Event
January 20, 1997 Semiannual groundwater monitoring initiated .
June 12, 1997 Preliminary Close Out Report for site signed for site construction completion.
September 15, 1997 Second lift of soil applied to treatment subplots.
March 14, 1998 Third lift of soil applied to treatment subplots.
June 28, 1998 Final sampling of soil in treatment subplots and in other designated site areasconducted.
July 24, 1998 Final soil sampling results validated; remediation objectives achieved.
September 1, 1998 Land treatment area demobilized and re-vegetated.
September 22, 1998 PRPs, EPA, and the State conduct pre-certification inspection of the completedremedial action.
Ongoing Semiannual groundwater monitoring. Expected to continue through 2002.
4-6. Performance Standards and Construction Quality Control.
a. This section should describe the overall performance of the remedial technologyin terms of a comparison to cleanup goals/remediation objectives. For treatment remedies, thissection should identify the quantity of material treated, the strategy used for collecting andanalyzing samples, and the overall results from the sampling and analysis effort. An explanationof the approved construction quality assurance (QA) and quality control (QC) requirements, orcitations for the appropriate references, should be provided. An explanation of any substantialproblems or deviations should be included.1 An assessment of the performance data quality andof the overall analytical data quality should be provided, including a brief discussion of theQA/QC procedures followed, the quality assurance project plan (QAPP) used, and the dataquality objectives (DQOs) to which the analytical data were compared. For PRP-lead projects, adiscussion should be provided of EPA’s oversight activities and results with regard to analyticaldata quality. An example section is provided in Exhibit 4-6.
b. Specific topics to consider for this section include sample frequency and protocol,concentrations of untreated vs. treated contaminants, comparison with cleanup goals, methods ofanalysis, and treatment residues. More detailed information on documenting technologyperformance is provided in Chapter 5 of this guide (Paragraph 5-1).
1 Note that changes to the remedy selected in the ROD that occurred during the RD/RA process must be described in an
Explanation of Significant Differences (ESD) or a ROD Amendment pursuant to NCP §§300.435(c)(2) and 300.825(a) that isprovided separately from the RA report.

EP 1110-1-1930 Jun 01
4-9
Exhibit 4-6Example Performance Standards and Construction Quality Control
(Section 5)
Performance Standards
The quantity of soil treated by landfarming was 8,100 yd3. Initial concentrations of PAHs in untreated, stockpiledsoil ranged from 100 to 208 mg/kg. Upon completion of land treatment, the concentration of TCICs in soil rangedfrom 23 to 92 mg/kg.
All soil and sludge samples collected during operation of the land treatment area were analyzed for PAHs. EPAMethod 8270 was used to measure the concentrations of PAHs in all samples. Composite samples were collectedquarterly from eight subplots in the land treatment area over an 18-month operating period. Once the cleanup goalhad been achieved in a subplot, that subplot was not monitored further until an additional lift of soil was appliedto the subplot.
Quality Assurance and Quality Control
The QA/QC program used throughout the operation of the land treatment area was outlined in the RD/RA workplan and quality assurance project plan (QAPP) approved by EPA. The program enabled EPA to determine thatall analytical results reported were accurate and adequate to ensure satisfactory execution of the remedial action,in a manner consistent with the requirements of the ROD.
The RA contractor conducted sampling and analysis activities on the soils each quarter. EPA took split samplesduring three sampling events, including the final sampling event on June 28, 1998. EPA periodically conductedoversight of the PRP contractor’s field sampling procedures. While deviations from the approved protocols wereidentified, none was sufficiently significant to cause rejection of the data. Matrix spike, duplicate, and blanksamples were analyzed by the laboratory, and the resulting data provided to EPA. On the basis of the split sampledata, the confirmatory sampling data were acceptable to EPA. The Florida Department of EnvironmentalRegulation (FDER) also reviewed the data and found the data to be acceptable.
The QA/QC program is also being used for the semiannual sampling of groundwater.
Performance Results Compared with Remediation Objectives
Remediation Objectives Performance Results
Reduce concentration of TCICs to 100 mg/kg.Sampling conducted in June 1998 indicated that the concentrationof TCICs was less than 100 mg/kg and ranged from 23 to 92 mg/kgin the eight subplots.
Attain desired remediation objectives within two years afterstartup of the land treatment operation.
Cleanup levels were attained within 18 months after startup of theland treatment operation.
Identify, remove, stabilize, and dispose (off-site) of excavatedOU 2 soils with TCIC levels greater than 5,000 mg/kg.
Sampling detected no soils with contamination above this specifiedlevel.
EP 1110-1-1930 Jun 01
4-10
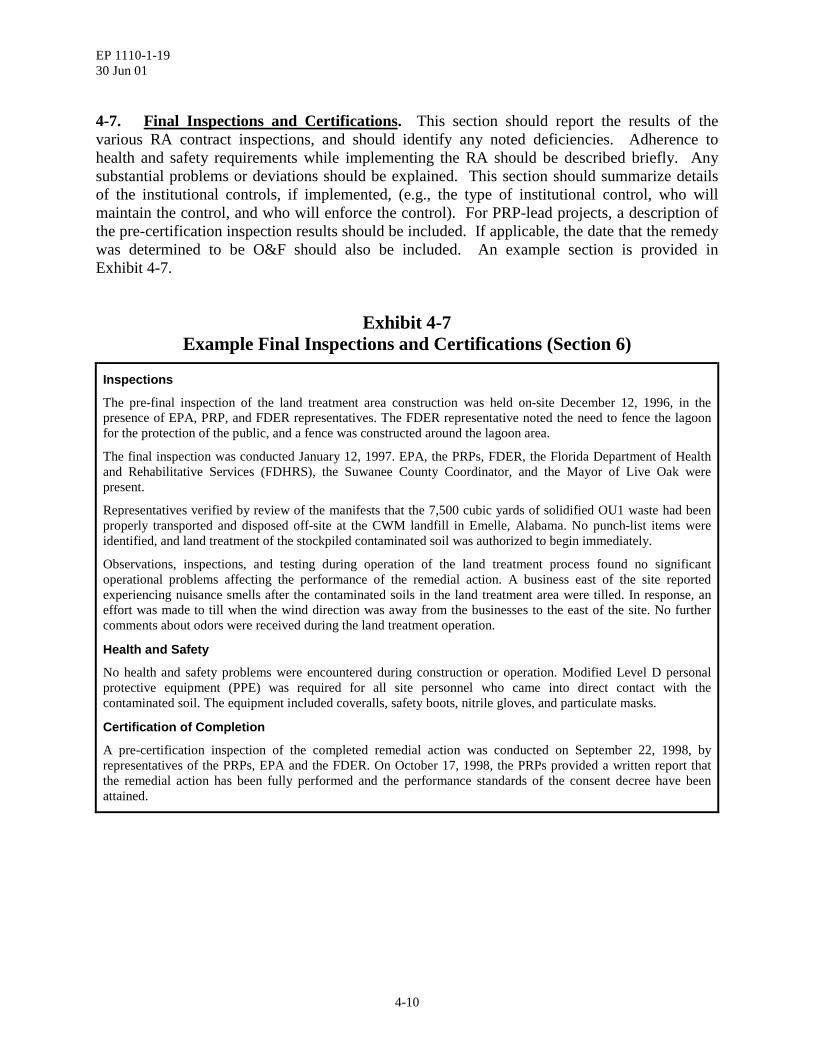
4-7. Final Inspections and Certifications. This section should report the results of thevarious RA contract inspections, and should identify any noted deficiencies. Adherence tohealth and safety requirements while implementing the RA should be described briefly. Anysubstantial problems or deviations should be explained. This section should summarize detailsof the institutional controls, if implemented, (e.g., the type of institutional control, who willmaintain the control, and who will enforce the control). For PRP-lead projects, a description ofthe pre-certification inspection results should be included. If applicable, the date that the remedywas determined to be O&F should also be included. An example section is provided inExhibit 4-7.
Exhibit 4-7Example Final Inspections and Certifications (Section 6)
Inspections
The pre-final inspection of the land treatment area construction was held on-site December 12, 1996, in thepresence of EPA, PRP, and FDER representatives. The FDER representative noted the need to fence the lagoonfor the protection of the public, and a fence was constructed around the lagoon area.
The final inspection was conducted January 12, 1997. EPA, the PRPs, FDER, the Florida Department of Healthand Rehabilitative Services (FDHRS), the Suwanee County Coordinator, and the Mayor of Live Oak werepresent.
Representatives verified by review of the manifests that the 7,500 cubic yards of solidified OU1 waste had beenproperly transported and disposed off-site at the CWM landfill in Emelle, Alabama. No punch-list items wereidentified, and land treatment of the stockpiled contaminated soil was authorized to begin immediately.
Observations, inspections, and testing during operation of the land treatment process found no significantoperational problems affecting the performance of the remedial action. A business east of the site reportedexperiencing nuisance smells after the contaminated soils in the land treatment area were tilled. In response, aneffort was made to till when the wind direction was away from the businesses to the east of the site. No furthercomments about odors were received during the land treatment operation.
Health and Safety
No health and safety problems were encountered during construction or operation. Modified Level D personalprotective equipment (PPE) was required for all site personnel who came into direct contact with thecontaminated soil. The equipment included coveralls, safety boots, nitrile gloves, and particulate masks.
Certification of Completion
A pre-certification inspection of the completed remedial action was conducted on September 22, 1998, byrepresentatives of the PRPs, EPA and the FDER. On October 17, 1998, the PRPs provided a written report thatthe remedial action has been fully performed and the performance standards of the consent decree have beenattained.
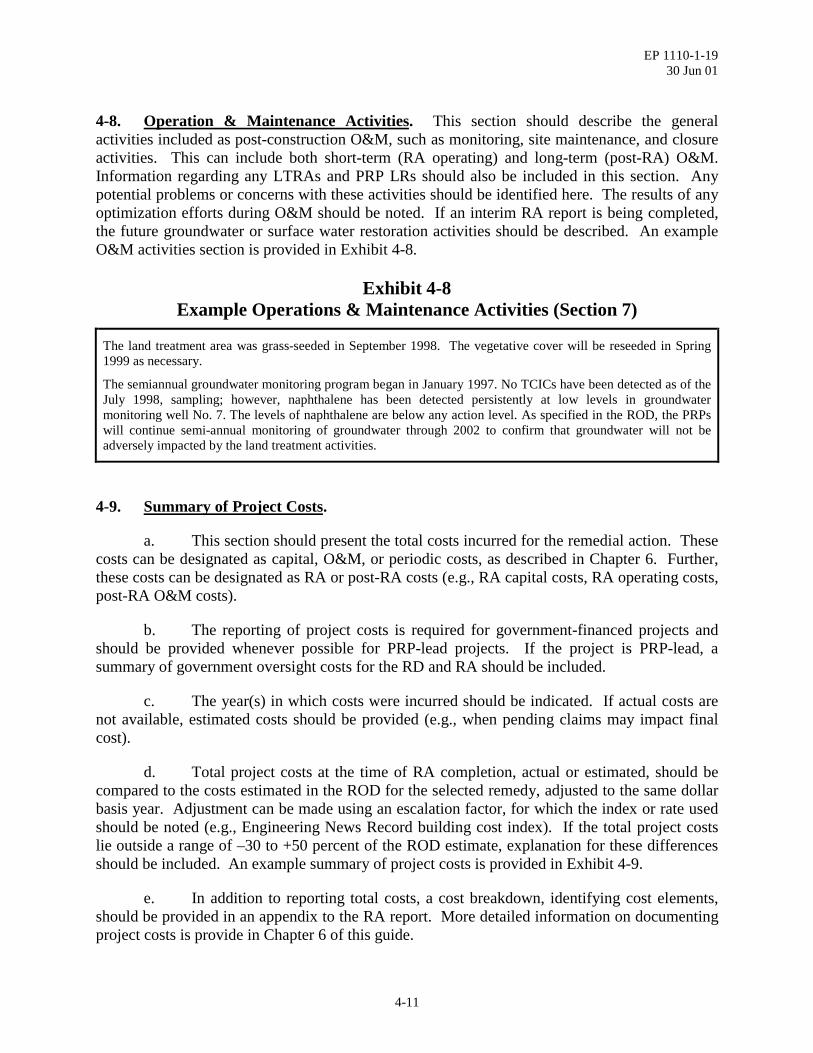
EP 1110-1-1930 Jun 01
4-11
4-8. Operation & Maintenance Activities. This section should describe the generalactivities included as post-construction O&M, such as monitoring, site maintenance, and closureactivities. This can include both short-term (RA operating) and long-term (post-RA) O&M.Information regarding any LTRAs and PRP LRs should also be included in this section. Anypotential problems or concerns with these activities should be identified here. The results of anyoptimization efforts during O&M should be noted. If an interim RA report is being completed,the future groundwater or surface water restoration activities should be described. An exampleO&M activities section is provided in Exhibit 4-8.
Exhibit 4-8Example Operations & Maintenance Activities (Section 7)
The land treatment area was grass-seeded in September 1998. The vegetative cover will be reseeded in Spring1999 as necessary.
The semiannual groundwater monitoring program began in January 1997. No TCICs have been detected as of theJuly 1998, sampling; however, naphthalene has been detected persistently at low levels in groundwatermonitoring well No. 7. The levels of naphthalene are below any action level. As specified in the ROD, the PRPswill continue semi-annual monitoring of groundwater through 2002 to confirm that groundwater will not beadversely impacted by the land treatment activities.
4-9. Summary of Project Costs.
a. This section should present the total costs incurred for the remedial action. Thesecosts can be designated as capital, O&M, or periodic costs, as described in Chapter 6. Further,these costs can be designated as RA or post-RA costs (e.g., RA capital costs, RA operating costs,post-RA O&M costs).
b. The reporting of project costs is required for government-financed projects andshould be provided whenever possible for PRP-lead projects. If the project is PRP-lead, asummary of government oversight costs for the RD and RA should be included.
c. The year(s) in which costs were incurred should be indicated. If actual costs arenot available, estimated costs should be provided (e.g., when pending claims may impact finalcost).
d. Total project costs at the time of RA completion, actual or estimated, should becompared to the costs estimated in the ROD for the selected remedy, adjusted to the same dollarbasis year. Adjustment can be made using an escalation factor, for which the index or rate usedshould be noted (e.g., Engineering News Record building cost index). If the total project costslie outside a range of –30 to +50 percent of the ROD estimate, explanation for these differencesshould be included. An example summary of project costs is provided in Exhibit 4-9.
e. In addition to reporting total costs, a cost breakdown, identifying cost elements,should be provided in an appendix to the RA report. More detailed information on documentingproject costs is provide in Chapter 6 of this guide.

EP 1110-1-1930 Jun 01
4-12
Exhibit 4-9Example Summary of Project Costs (Section 8)
The table below provides a summary of the total project costs and a comparison of the actual costs with the RODestimate. Appendix B provides additional project cost breakdown.
1 ROD Cost was adjusted from 1996 $$ to 1998 $$ using average 1996 and 1998 ENR building cost index factors.2 Groundwater monitoring was not included in original ROD. Assumed length of monitoring = 5 years3 Difference between project cost and ROD estimate is largely attributable to 18 months of actual treatment instead of 24 months
planned in the ROD.
4-10. Observations and Lessons Learned. This section should discuss site- or OU-specificobservations and lessons learned, highlighting successes, problems and their resolutions. Thediscussion of the problems and their resolutions will be included in the useful technicalinformation that will be extracted by the government and compiled for use in future remedyselections. The information presented should be technical in nature and specific to the site.Observations or lessons learned relating to both cost and performance of the remedial action areimportant to note. An example section is provided in Exhibit 4-10.
Exhibit 4-10Example Observations and Lessons Learned (Section 9)
♦ The project cost 22% less than the adjusted ROD estimate, largely due to reduced labor and materials costsassociated with achieving remediation objectives in 18 instead of 24 months. Use of an on-site laboratoryalso contributed to savings.
♦ The land treatment application was found to be more effective at remediating soils on the site when the soilswere tilled once every two weeks, rather than once every four weeks, as was originally planned.
♦ Application of fertilizers to the soils at the site proved to be unnecessary because of the naturally highconcentrations of inorganic nitrogen and phosphorous in the soil.
Cost Summary
Cost Item ROD Estimate(1996 $$)
ROD Estimate(1998 $$)1
Actual Cost(1998 $$)
RA Capital Cost $266,000 $282,000 $303,026
RA Operating Cost 258,000 273,000 132,497
Total Cost 524,000 555,000 435,523
Projected Future O & M Cost2 21,000
Difference between total project costand total ROD cost estimate3 -$119,000 or -22%

EP 1110-1-1930 Jun 01
4-13
Exhibit 4-10, cont.Example Observations and Lessons Learned (Section 9)
♦ The relatively mild year-round temperatures at the site provided a beneficial growing environment for theinoculum of PAH-degrading microorganisms. Consequently, relatively high numbers of microorganismsremained in the soil, thus reducing the need for repeated soil inoculations.
♦ Soils at the site were difficult to till after heavy rains. Natural drying of the soil took an average of two weeksbefore tractors could be operated on the land treatment area.
♦ Nuisance odors were reported on days when soils were tilled. Therefore, measures were taken to till on dayswhen the wind direction was away from neighboring properties.
4-11. Operable Unit Contact Information. This section should provide contact information(names, addresses, phone numbers, and contract reference data) for the major design andremediation contractors and subcontractors, oversight contractors, and the respective projectmanagers for the government and the PRPs, as applicable. If available, O&M contactinformation should be included, such as the prime O&M contractor, subcontractors, andoversight contractors. Contract numbers for the RA and O&M should also be listed, if available.If all available information has already been provided as part of the abstract, this section may beexcluded from the RA report. Example information blocks are shown in Exhibit 4-11.
Exhibit 4-11Example Operable Unit Contact Information (Section 10)
Remedial Action Contractor:
Primary Contact Name and Title:
Company Name:Address:
Phone Number:
RA Oversight Contractor:
CompanyName: Contract Number:
Address:
PhoneNumber:
Work AssignmentNumber:
Analytical Laboratory:
For the PRPs:
Company Name:
Address:Phone Number:
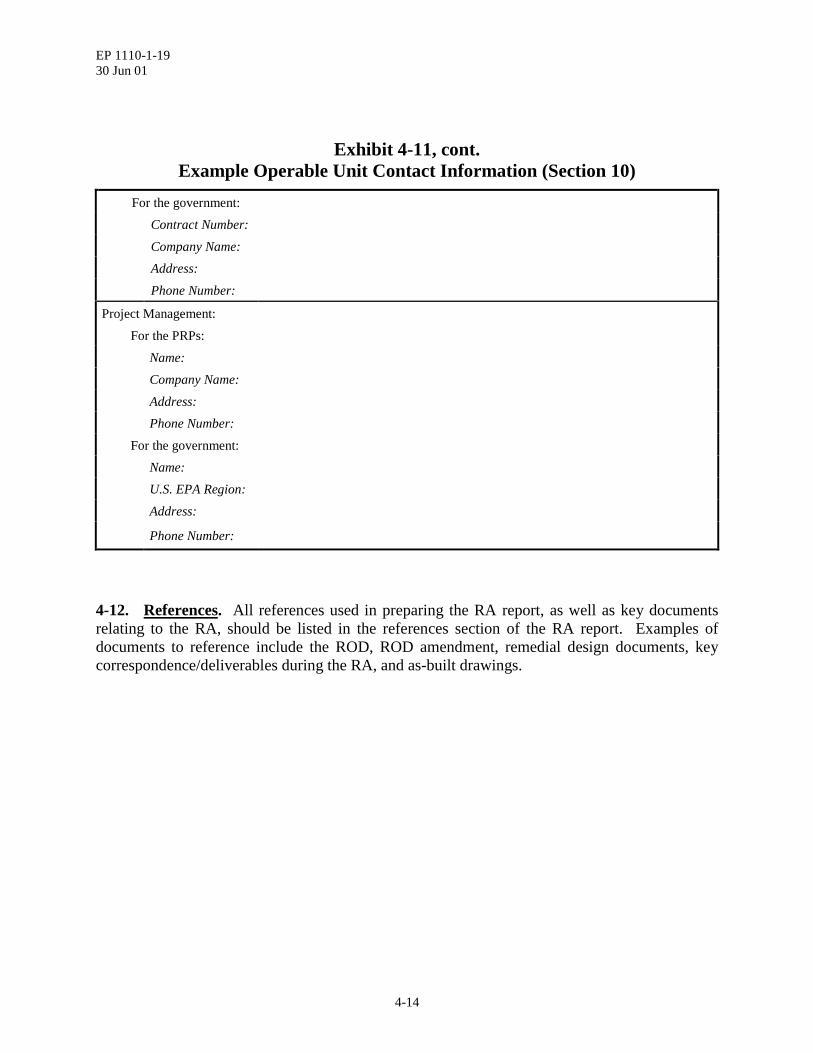
EP 1110-1-1930 Jun 01
4-14
Exhibit 4-11, cont.Example Operable Unit Contact Information (Section 10)
For the government:
Contract Number:
Company Name:Address:
Phone Number:
Project Management:
For the PRPs:
Name:Company Name:
Address:Phone Number:
For the government:
Name:U.S. EPA Region:
Address:
Phone Number:
4-12. References. All references used in preparing the RA report, as well as key documentsrelating to the RA, should be listed in the references section of the RA report. Examples ofdocuments to reference include the ROD, ROD amendment, remedial design documents, keycorrespondence/deliverables during the RA, and as-built drawings.

EP 1110-1-1930 Jun 01
5-1
CHAPTER 5 DOCUMENTING TECHNOLOGY PERFORMANCE
5-1. General. This chapter provides additional information on documenting technologyperformance in the RA report, expanding on concepts presented in the previous chapter(Paragraph 4-6). Technology performance should be documented in Section 5 and Appendix Aof the RA report.
5-2. Recommended Performance Reporting.
a. The performance of a technology is often characterized only in terms of thepercentage of contaminants removed or the concentration of contaminants remediated.However, that information alone will not adequately assess all aspects of a technology’sperformance. For example, this one-dimensional measure of performance will not document anyof the problems that might have arisen during the technology’s application, or how suchproblems were resolved. The information listed in Exhibit 5-1 should be included in the RAreport so that the effectiveness and the appropriateness of the remedy can be quantified andcompared with other alternatives when making future remedy selections at other sites withsimilar characteristics.
b. Exhibit 5-1 provides a guide to ensure that all important information related to theperformance of the technology will be documented in the RA report. The level of detail and dataavailable for each performance topic will vary by technology type and the specific application.
Exhibit 5-1Recommended Performance Reporting
Performance Topic Type of Information
Types of samples collected ♦ Types of media sampled♦ Types of constituents analyzed♦ Use of surrogates (e.g., soil gas as a surrogate for soil borings)
Sample frequency and protocol ♦ Where samples were collected♦ How samples were collected♦ When samples were collected♦ Who collected samples
Quantity of material treated ♦ Quantity of material treated during application♦ For in situ technologies, area and depth of contaminated material treated
Concentrations of untreatedand treated contaminants(range and median values)
♦ Measurement of initial conditions (even if not required to demonstratecompliance with cleanup/remediation criteria)
♦ Measurement of concentrations of contaminants during or after treatment(note whether data exists for both treated and untreated contaminants orwhether operating data exists that corresponds with performance data)
♦ Assessment of percent removal achieved (note procedure used to derivepercent removal)
♦ Correlation of performance data with other variables
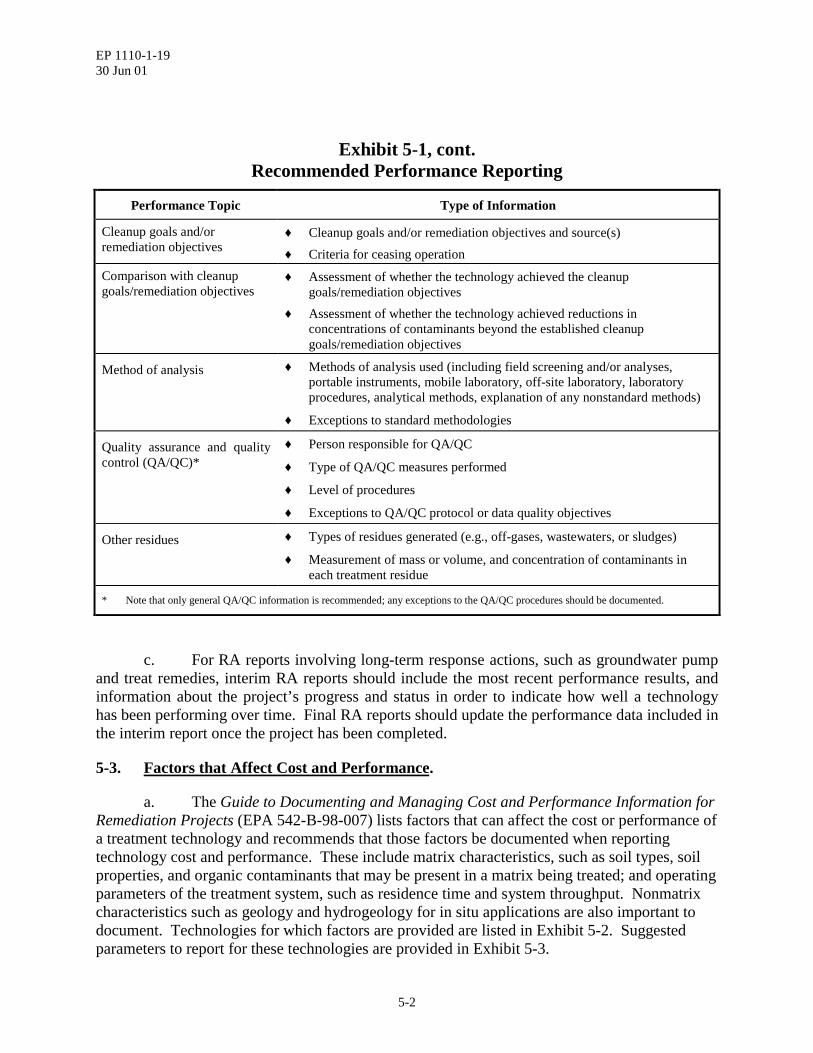
EP 1110-1-1930 Jun 01
5-2
Exhibit 5-1, cont.Recommended Performance Reporting
Performance Topic Type of Information
Cleanup goals and/orremediation objectives
♦ Cleanup goals and/or remediation objectives and source(s)♦ Criteria for ceasing operation
Comparison with cleanupgoals/remediation objectives
♦ Assessment of whether the technology achieved the cleanupgoals/remediation objectives
♦ Assessment of whether the technology achieved reductions inconcentrations of contaminants beyond the established cleanupgoals/remediation objectives
Method of analysis ♦ Methods of analysis used (including field screening and/or analyses,portable instruments, mobile laboratory, off-site laboratory, laboratoryprocedures, analytical methods, explanation of any nonstandard methods)
♦ Exceptions to standard methodologies
Quality assurance and qualitycontrol (QA/QC)*
♦ Person responsible for QA/QC
♦ Type of QA/QC measures performed
♦ Level of procedures
♦ Exceptions to QA/QC protocol or data quality objectives
Other residues ♦ Types of residues generated (e.g., off-gases, wastewaters, or sludges)
♦ Measurement of mass or volume, and concentration of contaminants ineach treatment residue
* Note that only general QA/QC information is recommended; any exceptions to the QA/QC procedures should be documented.
c. For RA reports involving long-term response actions, such as groundwater pumpand treat remedies, interim RA reports should include the most recent performance results, andinformation about the project’s progress and status in order to indicate how well a technologyhas been performing over time. Final RA reports should update the performance data included inthe interim report once the project has been completed.
5-3. Factors that Affect Cost and Performance.
a. The Guide to Documenting and Managing Cost and Performance Information forRemediation Projects (EPA 542-B-98-007) lists factors that can affect the cost or performance ofa treatment technology and recommends that those factors be documented when reportingtechnology cost and performance. These include matrix characteristics, such as soil types, soilproperties, and organic contaminants that may be present in a matrix being treated; and operatingparameters of the treatment system, such as residence time and system throughput. Nonmatrixcharacteristics such as geology and hydrogeology for in situ applications are also important todocument. Technologies for which factors are provided are listed in Exhibit 5-2. Suggestedparameters to report for these technologies are provided in Exhibit 5-3.

EP 1110-1-1930 Jun 01
5-3
Exhibit 5-2Example Remedial Technologies
Ex Situ Soil Remediation Groundwater Remediation and/or Containment
♦ Composting♦ Incineration♦ Land Treatment♦ Slurry-Phase Bioremediation♦ Soil Washing♦ Stabilization♦ Thermal Desorption
In Situ Soil Remediation and/orContainment
♦ Bioventing♦ Capping♦ In Situ Heating♦ Phytoremediation♦ Soil Flushing♦ Soil Vapor Extraction♦ Vitrification
♦ Air Sparging♦ Bioremediation♦ Bioslurping♦ Circulating Wells (UVB)♦ Cosolvents and Surfactants♦ Multi-Phase Extraction♦ Dynamic Underground Stripping♦ In Situ Oxidation (Fenton’s Reagent)♦ Natural Attenuation (Chlorinated Compounds)♦ Natural Attenuation (Nonchlorinated
Hydrocarbons)♦ Permeable Reactive Barriers♦ Phytoremediation♦ Pump and Treat System♦ Steam Flushing♦ Vertical Barrier Walls
b. For the RA report, both matrix characteristics and operating parameters of thetreatment system should be reported in an appendix as well as site conditions (e.g.,geology/hydrogeology), as applicable, that may impact the cost and performance of the treatmenttechnologies used in the remedy. The appendix should report the values or results of eachparameter as well as the procedures used to measure the parameter.
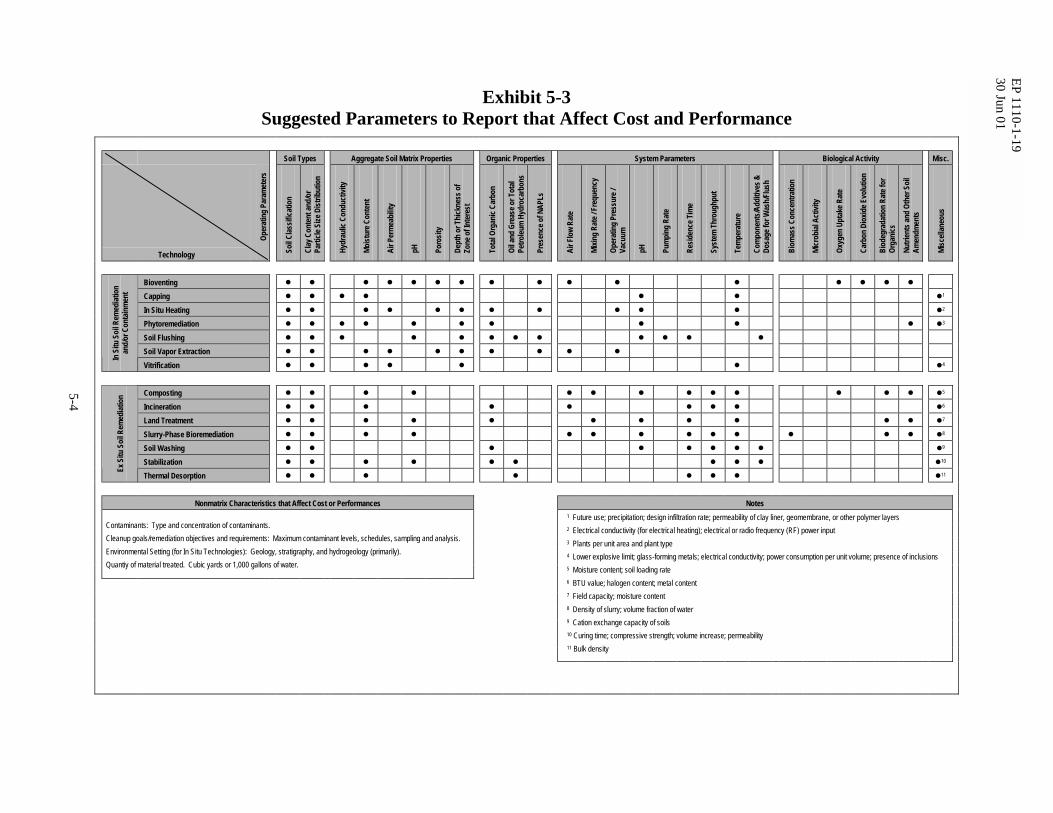
Exhibit 5-3Suggested Parameters to Report that Affect Cost and Performance
Soil Types Aggregate Soil Matrix Properties Organic Properties System Parameters Biological Activity Misc.
TechnologyOp
erat
ing
Para
met
ers
Soil C
lassif
icatio
n
Clay
Con
tent
and/
orPa
rticle
Size
Dist
ribut
ion
Hydr
aulic
Con
duct
ivity
Moist
ure C
onte
nt
Air P
erm
eabi
lity
pH Poro
sity
Dept
h or
Thi
ckne
ss o
fZo
ne o
f Int
eres
t
Tota
l Org
anic
Carb
on
Oil a
nd G
reas
e or T
otal
Petro
leum
Hyd
roca
rbon
s
Pres
ence
of N
APLs
Air F
low
Rate
Mixin
g Ra
te / F
requ
ency
Oper
atin
g Pr
essu
re /
Vacu
um
pH Pum
ping
Rat
e
Resid
ence
Tim
e
Syst
em T
hrou
ghpu
t
Tem
pera
ture
Com
pone
nts/A
dditi
ves &
Dosa
ge fo
r Was
h/Fl
ush
Biom
ass C
once
ntra
tion
Micr
obial
Act
ivity
Oxyg
en U
ptak
e Rat
e
Carb
on D
ioxid
e Evo
lutio
n
Biod
egra
datio
n Ra
te fo
rOr
gani
cs
Nutri
ents
and
Othe
r Soi
lAm
endm
ents
Misc
ellan
eous
Bioventing � � � � � � � � � � � � � � � �
Capping � � � � � � �1
In Situ Heating � � � � � � � � � � � �2
Phytoremediation � � � � � � � � � � �3
Soil Flushing � � � � � � � � � � � �
Soil Vapor Extraction � � � � � � � � � �
In S
itu S
oil R
emed
iatio
nan
d/or
Con
tain
men
t
Vitrification � � � � � � �4
Composting � � � � � � � � � � � � � �5
Incineration � � � � � � � � �6
5-4
Land Treatment � � � � � � � � � � � �7
Slurry-Phase Bioremediation � � � � � � � � � � � � � �8
Soil Washing � � � � � � � � �9
Stabilization � � � � � � � � � �10
Ex S
itu S
oil R
emed
iatio
n
Thermal Desorption � � � � � � � �11
Nonmatrix Characteristics that Affect Cost or Performances Notes
Contaminants: Type and concentration of contaminants.Cleanup goals/remediation objectives and requirements: Maximum contaminant levels, schedules, sampling and analysis.Environmental Setting (for In Situ Technologies): Geology, stratigraphy, and hydrogeology (primarily).Quantiy of material treated. Cubic yards or 1,000 gallons of water.
1 Future use; precipitation; design infiltration rate; permeability of clay liner, geomembrane, or other polymer layers2 Electrical conductivity (for electrical heating); electrical or radio frequency (RF) power input3 Plants per unit area and plant type4 Lower explosive limit; glass-forming metals; electrical conductivity; power consumption per unit volume; presence of inclusions5 Moisture content; soil loading rate6 BTU value; halogen content; metal content7 Field capacity; moisture content8 Density of slurry; volume fraction of water9 Cation exchange capacity of soils10 Curing time; compressive strength; volume increase; permeability11 Bulk density
EP 1110-1-1930 Jun 01
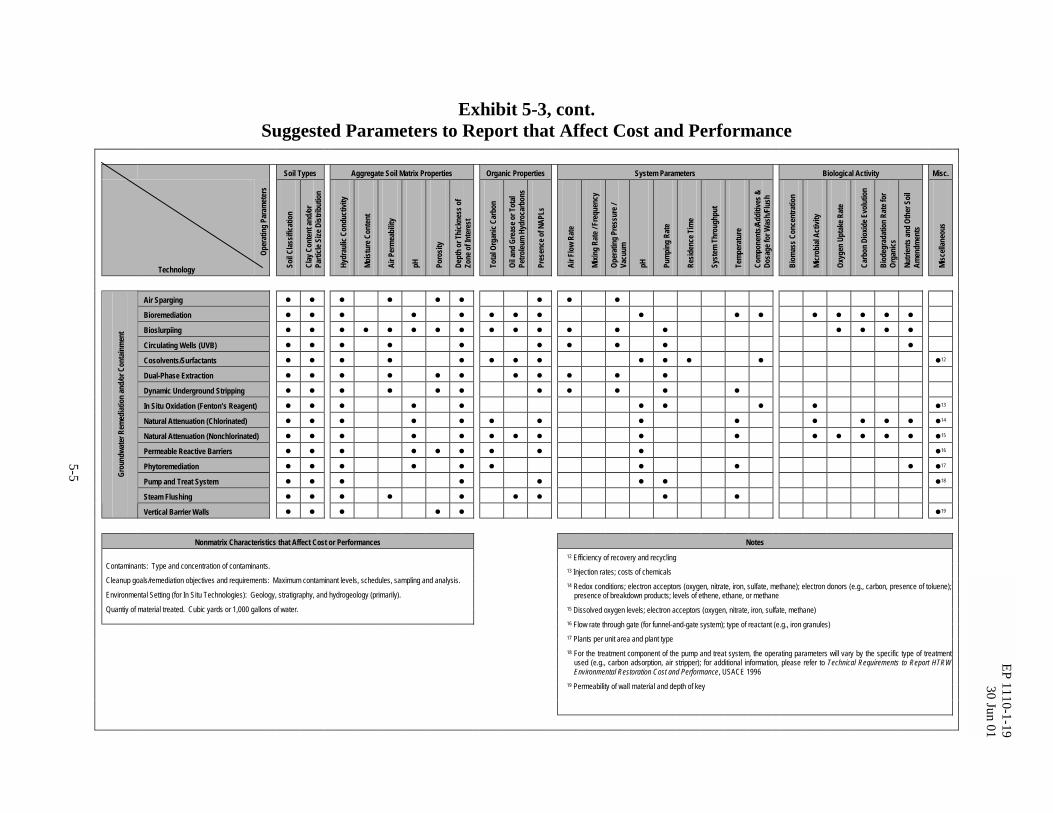
Exhibit 5-3, cont.Suggested Parameters to Report that Affect Cost and Performance
Soil Types Aggregate Soil Matrix Properties Organic Properties System Parameters Biological Activity Misc.
TechnologyOp
erat
ing
Para
met
ers
Soil C
lassif
icatio
n
Clay
Con
tent
and/
orPa
rticle
Size
Dist
ribut
ion
Hydr
aulic
Con
duct
ivity
Moist
ure C
onte
nt
Air P
erm
eabi
lity
pH Poro
sity
Dept
h or
Thi
ckne
ss o
fZo
ne o
f Int
eres
t
Tota
l Org
anic
Carb
on
Oil a
nd G
reas
e or T
otal
Petro
leum
Hyd
roca
rbon
s
Pres
ence
of N
APLs
Air F
low
Rate
Mixin
g Ra
te / F
requ
ency
Oper
atin
g Pr
essu
re /
Vacu
um
pH Pum
ping
Rat
e
Resid
ence
Tim
e
Syst
em T
hrou
ghpu
t
Tem
pera
ture
Com
pone
nts/A
dditi
ves &
Dosa
ge fo
r Was
h/Fl
ush
Biom
ass C
once
ntra
tion
Micr
obial
Act
ivity
Oxyg
en U
ptak
e Rat
e
Carb
on D
ioxid
e Evo
lutio
n
Biod
egra
datio
n Ra
te fo
rOr
gani
cs
Nutri
ents
and
Othe
r Soi
lAm
endm
ents
Misc
ellan
eous
Air Sparging � � � � � � � � �
Bioremediation � � � � � � � � � � � � � � � �
Bioslurpiing � � � � � � � � � � � � � � � � � �
Circulating Wells (UVB) � � � � � � � � � �
Cosolvents/Surfactants � � � � � � � � � � � � �12
Dual-Phase Extraction � � � � � � � � � � �
Dynamic Underground Stripping � � � � � � � � � � �
In Situ Oxidation (Fenton’s Reagent) � � � � � � � � � �13
Natural Attenuation (Chlorinated) � � � � � � � � � � � � � �14
Natural Attenuation (Nonchlorinated) � � � � � � � � � � � � � � � �15
Permeable Reactive Barriers � � � � � � � � � �16
Phytoremediation � � � � � � � � � �17
Pump and Treat System � � � � � � � �18
5-5
Steam Flushing � � � � � � � � �
Grou
ndwa
ter R
emed
iatio
n an
d/or
Con
tain
men
t
Vertical Barrier Walls � � � � � �19
Nonmatrix Characteristics that Affect Cost or Performances Notes
Contaminants: Type and concentration of contaminants.
Cleanup goals/remediation objectives and requirements: Maximum contaminant levels, schedules, sampling and analysis.
Environmental Setting (for In Situ Technologies): Geology, stratigraphy, and hydrogeology (primarily).
Quantiy of material treated. Cubic yards or 1,000 gallons of water.
12 Efficiency of recovery and recycling13 Injection rates; costs of chemicals14 Redox conditions; electron acceptors (oxygen, nitrate, iron, sulfate, methane); electron donors (e.g., carbon, presence of toluene); presence of breakdown products; levels of ethene, ethane, or methane15 Dissolved oxygen levels; electron acceptors (oxygen, nitrate, iron, sulfate, methane)16 Flow rate through gate (for funnel-and-gate system); type of reactant (e.g., iron granules)17 Plants per unit area and plant type18 For the treatment component of the pump and treat system, the operating parameters will vary by the specific type of treatment used (e.g., carbon adsorption, air stripper); for additional information, please refer to Technical Requirements to Report HTRW Environmental Restoration Cost and Performance, USACE 199619 Permeability of wall material and depth of key
EP 1110-1-1930 Jun 01

EP 1110-1-1930 Jun 01
5-6
c. Exhibits 5-4 and 5-5 provide examples of how matrix characteristics andoperating parameters may be reported in Appendix A of the RA report for a remedial action thatuses a land treatment system to remediate contaminated soil.
Exhibit 5-4Example Matrix Characteristics
Parameter Value/Result Measurement Procedure
Soil Types
Soil classification
Mixture of lagoon contents;lagoon had a clay bottom andsandy contents, which ranged fromsilty clay to fine sand
Because the medium treated was amixture of lagoon contents, it did not lenditself to a formal classification analysis.
Aggregate Soil Properties
pH 6.9
The value listed represents an averagemeasured during one of the samplingevents; EPA Method SW-846/9045 wasused to measure the pH of the soil.
Total organic carbon 16,000 mg/kg
The value listed represents an averagemeasured during one of the samplingevents; EPA Method SW-846/9060 wasused to measure the total organic carbonin the soil.
Quantity of soil treated 8,100 yd3 (total for 3 lifts) NANA - not applicable. Measurement procedures are reported only for those parameters where different procedures are available.
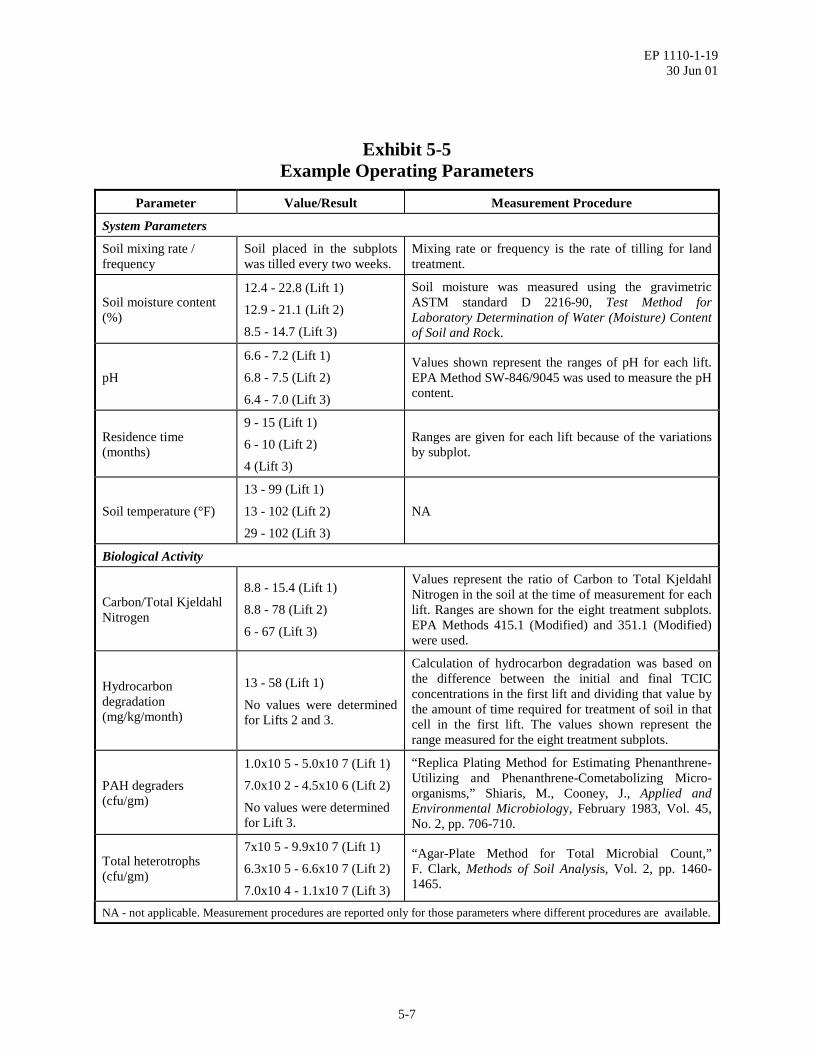
EP 1110-1-1930 Jun 01
5-7
Exhibit 5-5Example Operating Parameters
Parameter Value/Result Measurement Procedure
System Parameters
Soil mixing rate /frequency
Soil placed in the subplotswas tilled every two weeks.
Mixing rate or frequency is the rate of tilling for landtreatment.
Soil moisture content(%)
12.4 - 22.8 (Lift 1)
12.9 - 21.1 (Lift 2)
8.5 - 14.7 (Lift 3)
Soil moisture was measured using the gravimetricASTM standard D 2216-90, Test Method forLaboratory Determination of Water (Moisture) Contentof Soil and Rock.
pH
6.6 - 7.2 (Lift 1)
6.8 - 7.5 (Lift 2)
6.4 - 7.0 (Lift 3)
Values shown represent the ranges of pH for each lift.EPA Method SW-846/9045 was used to measure the pHcontent.
Residence time(months)
9 - 15 (Lift 1)
6 - 10 (Lift 2)
4 (Lift 3)
Ranges are given for each lift because of the variationsby subplot.
Soil temperature (°F)
13 - 99 (Lift 1)
13 - 102 (Lift 2)
29 - 102 (Lift 3)
NA
Biological Activity
Carbon/Total KjeldahlNitrogen
8.8 - 15.4 (Lift 1)
8.8 - 78 (Lift 2)
6 - 67 (Lift 3)
Values represent the ratio of Carbon to Total KjeldahlNitrogen in the soil at the time of measurement for eachlift. Ranges are shown for the eight treatment subplots.EPA Methods 415.1 (Modified) and 351.1 (Modified)were used.
Hydrocarbondegradation(mg/kg/month)
13 - 58 (Lift 1)
No values were determinedfor Lifts 2 and 3.
Calculation of hydrocarbon degradation was based onthe difference between the initial and final TCICconcentrations in the first lift and dividing that value bythe amount of time required for treatment of soil in thatcell in the first lift. The values shown represent therange measured for the eight treatment subplots.
PAH degraders(cfu/gm)
1.0x10 5 - 5.0x10 7 (Lift 1)
7.0x10 2 - 4.5x10 6 (Lift 2)
No values were determinedfor Lift 3.
“Replica Plating Method for Estimating Phenanthrene-Utilizing and Phenanthrene-Cometabolizing Micro-organisms,” Shiaris, M., Cooney, J., Applied andEnvironmental Microbiology, February 1983, Vol. 45,No. 2, pp. 706-710.
Total heterotrophs(cfu/gm)
7x10 5 - 9.9x10 7 (Lift 1)
6.3x10 5 - 6.6x10 7 (Lift 2)
7.0x10 4 - 1.1x10 7 (Lift 3)
“Agar-Plate Method for Total Microbial Count,”F. Clark, Methods of Soil Analysis, Vol. 2, pp. 1460-1465.
NA - not applicable. Measurement procedures are reported only for those parameters where different procedures are available.

EP 1110-1-1930 Jun 01
6-1
CHAPTER 6 DOCUMENTING PROJECT COSTS
6-1. General.
a. This chapter provides more detailed information on documenting project costs inthe RA report, expanding on concepts presented in Chapter 4 (Paragraph 4-9). Forenvironmental restoration projects, project costs should be reported using primarily the RA (forRA capital and operating costs) and O&M (for post-RA costs) work breakdown structures, whichare intended to coincide with the RA and O&Mphases of the remedial response process. Theuse of the RA WBS will help provide RA costdata for input into HCAS. Cost reportingtemplates for HCAS data entry are provided inAppendix D of this guide. The data from thesetemplates will be input by the USACE HTRWCX into the HCAS software upon receiving theRA report. Cost data should be documented inAppendix B of the RA report.
b. Each project typically uses aproject-specific WBS to roll up costs. For thepurposes of upward reporting of costs in a standardized manner in the RA report, these costsmust be mapped from the project-specific WBS to the standard HTRW RA WBS. This willpermit a standardized roll up of costs for nationwide historical cost input to the HCAS database.
6-2. Definitions. The types of costs to document in the RA report include capital, O&M (RAoperating and post-RA O&M), and periodic costs. These are defined below. Figure 6-1illustrates the relationship of these costs to the RA and O&M phases.
a. Capital costs are those expenditures that are required to construct the RA. Theyare exclusive of the costs required to operate or maintain the action throughout its lifetime.Capital costs consist primarily of expenditures initially incurred to build or install the remedialaction (e.g., construction of a groundwater treatment system and related site work). Capital costsinclude all labor, equipment, and material costs, including contractor markups such as overheadand profit, associated with construction activities. The RA WBS should be primarily used toreport capital costs. Capital costs can also include expenditures for professional/technicalservices that are necessary to support construction of the RA.
b. O&M costs are those post-construction costs necessary to ensure or verify thecontinued effectiveness of a remedial action. O&M costs documented in the RA report caninclude RA operating costs and post-RA O&M costs. The RA WBS should be primarily used toreport RA operating costs and the O&M WBS should be primarily used to estimate post-RAO&M costs. O&M costs include all labor, equipment, and material costs, including contractormarkups such as overhead and profit, associated with O&M activities. O&M costs can alsoinclude expenditures for professional/technical services necessary to support O&M activities.
Actual vs. Estimated CostsOften, especially at sites involving
groundwater remediation, the actual costsassociated with the RA will not be available at thetime the RA report is being written. In addition,costs may not be available at PRP sites, orbecause of claims and change orders, which maynot be settled until many years after RAcompletion. In these cases, the best availableestimated costs should be used.

EP 1110-1-1930 Jun 01
6-2
c. Periodic costs are those capital or O&M costs that occur only once every fewyears (e.g., five-year reviews, equipment replacement) or expenditures that occur only onceduring the entire O&M period or remedial timeframe (e.g., site close out). Periodic costs can beincurred during the RA operating period, but are more likely to be incurred during the post-RAO&M period. Either the RA or O&M WBS can be used to report periodic costs.
Exhibit 6-1Relationship of Capital and O&M Costs to Pipeline Phases
6-3. Cost Element Structure. All applicable capital, O&M, and periodic costs should bedocumented in the RA report. To help identify the cost element structure to report costs; capital,O&M, and periodic cost elements are described in Exhibits 6-2, 6-3, and 6-4, respectively.Exhibits 6-2 and 6-3 includes second-level elements from the HTRW RA and O&M workbreakdown structures, respectively, for construction and O&M activities. Professional/technicalservices and institutional controls have been added to the descriptions in Exhibits 6-2 and 6-3;however, these costs are not reported into HCAS. More information on the RA and O&M workbreakdown structures is provided below.
a. The RA WBS, Account 33XXX, includes construction (RA capital) and operationduring the remedial action (RA operating). Account 33XXX excludes all project management atall phases and excludes pre construction investigations and remedial design. Account 33XXXexcludes post construction O&M, which is in Account 34XXX.
b. The O&M WBS, Account 34XXX, includes post construction O&M (post RAO&M), which is long term, indefinite term, or caretaker status following remedial action.Account 34XXX includes such items as operation labor and equipment, maintenance and repair,fuel, utilities, bulk chemicals, raw materials, plant ownership/rental, plant upgrades andreplacements, transport waste materials to the plant, preparation and handling of waste materialsat the plant, training, regulatory approvals, etc.
6-4. Capital Cost Elements. The majority of the capital cost elements listed in Exhibit 6-2are construction activities (e.g., sitework) that are incurred as part of the physical construction ofthe RA. Project management, remedial design, and construction management are
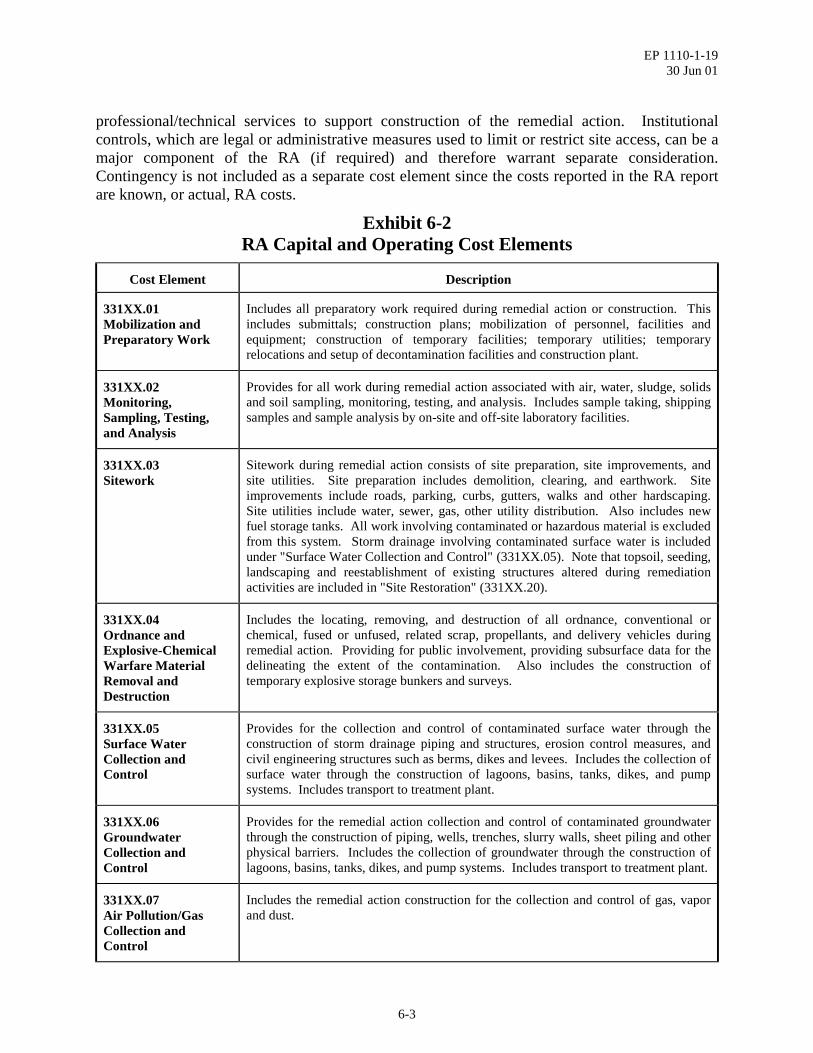
EP 1110-1-1930 Jun 01
6-3
professional/technical services to support construction of the remedial action. Institutionalcontrols, which are legal or administrative measures used to limit or restrict site access, can be amajor component of the RA (if required) and therefore warrant separate consideration.Contingency is not included as a separate cost element since the costs reported in the RA reportare known, or actual, RA costs.
Exhibit 6-2RA Capital and Operating Cost Elements
Cost Element Description
331XX.01Mobilization andPreparatory Work
Includes all preparatory work required during remedial action or construction. Thisincludes submittals; construction plans; mobilization of personnel, facilities andequipment; construction of temporary facilities; temporary utilities; temporaryrelocations and setup of decontamination facilities and construction plant.
331XX.02Monitoring,Sampling, Testing,and Analysis
Provides for all work during remedial action associated with air, water, sludge, solidsand soil sampling, monitoring, testing, and analysis. Includes sample taking, shippingsamples and sample analysis by on-site and off-site laboratory facilities.
331XX.03Sitework
Sitework during remedial action consists of site preparation, site improvements, andsite utilities. Site preparation includes demolition, clearing, and earthwork. Siteimprovements include roads, parking, curbs, gutters, walks and other hardscaping.Site utilities include water, sewer, gas, other utility distribution. Also includes newfuel storage tanks. All work involving contaminated or hazardous material is excludedfrom this system. Storm drainage involving contaminated surface water is includedunder "Surface Water Collection and Control" (331XX.05). Note that topsoil, seeding,landscaping and reestablishment of existing structures altered during remediationactivities are included in "Site Restoration" (331XX.20).
331XX.04Ordnance andExplosive-ChemicalWarfare MaterialRemoval andDestruction
Includes the locating, removing, and destruction of all ordnance, conventional orchemical, fused or unfused, related scrap, propellants, and delivery vehicles duringremedial action. Providing for public involvement, providing subsurface data for thedelineating the extent of the contamination. Also includes the construction oftemporary explosive storage bunkers and surveys.
331XX.05Surface WaterCollection andControl
Provides for the collection and control of contaminated surface water through theconstruction of storm drainage piping and structures, erosion control measures, andcivil engineering structures such as berms, dikes and levees. Includes the collection ofsurface water through the construction of lagoons, basins, tanks, dikes, and pumpsystems. Includes transport to treatment plant.
331XX.06GroundwaterCollection andControl
Provides for the remedial action collection and control of contaminated groundwaterthrough the construction of piping, wells, trenches, slurry walls, sheet piling and otherphysical barriers. Includes the collection of groundwater through the construction oflagoons, basins, tanks, dikes, and pump systems. Includes transport to treatment plant.
331XX.07Air Pollution/GasCollection andControl
Includes the remedial action construction for the collection and control of gas, vaporand dust.

EP 1110-1-1930 Jun 01
6-4
Exhibit 6-2, cont.RA Capital and Operating Cost Elements
Cost Element Description
331XX.08Solids Collection andContainment
Provides for exhuming and handling of solid hazardous, toxic and radioactive waste(HTRW) during remedial action through excavation, sorting, stockpiling, and fillingcontainers. Provides for containment of solid waste through the construction ofmultilayered caps as well as dynamic compaction of burial grounds, cribs, or otherwaste disposal units. Includes transport to treatment plant.
331XX.09Liquids/Sediment/Sludge Collection andContainment
Includes collection during remedial action of HTRW-contaminated liquids and sludgesthrough dredging and vacuuming, and the furnishing and filling of portable containers.Includes the containment of liquids and sludges through the construction of lagoons,basins, tanks, dikes, and drain system. Includes transport to treatment plant.
331XX.10Drums/Tanks/Structures/MiscellaneousDemolition andRemoval
Includes the demolition and removal during remedial action of HTRW contaminateddrums, tanks, contaminated paint removal, and other structures by excavation anddownsizing. Does not include filling portable hazardous waste containers or transportof wastes to treatment or disposal facilities. See "Solids Collection and Containment"(331XX.08), "Disposal (Other than Commercial)" (331XX.18), and "Disposal(Commercial)" (331XX.19)
331XX.11Biological Treatment
Includes operation (separate items for each subsystem technology) of the plant facilityduring the remedial action phase, based on the volume of waste material treated,including portable treatment equipment which is charged on a time basis and can beused on more than one project (331XX.11.(01.-14.)). Includes a separate item for theconstruction of a permanent plant facility, including permanent treatment equipmentwhich is purchased for one project only (331XX.11.50.). Biological treatment is themicrobial transformation of organic compounds. Biological treatment processes canalter inorganic compounds such as ammonia and nitrate, and can change the oxidationstate of certain metal compounds. Includes in-situ biological treatment such as landfarming as well as activated sludge, composting, trickling filters, anaerobic, andaerobic digestion. Includes process equipment and chemicals required for treatment.For transportation see "Transport to Treatment Plant" (331XX.05.11, 331XX.06.08,331XX.08.03 or 331XX.09.04).
331XX.12Chemical Treatment
Includes operation (separate items for each subsystem technology) of the plant facilityduring the remedial action phase, based on the volume of waste material treated,including portable treatment equipment which is charged on a time basis and can beused on more than one project (331XX.12.(01.-14.)). Includes a separate item for theconstruction of a permanent plant facility, including permanent treatment equipmentwhich is purchased for one project only (331XX.12.50.). Chemical treatment is theprocess in which hazardous wastes are chemically changed to remove toxiccontaminants from the environment. Type of treatment included in this system areoxidation/reduction, solvent extraction, chlorination, ozonation, ion exchange,neutralization, hydrolysis, photolysis, dechlorination, and electrolysis reactions.Includes process equipment and chemicals required for treatment. For transportationsee "Transport to Treatment Plant" (331XX.05.11, 331XX.06.08, 331XX.08.03 or331XX.09.04).
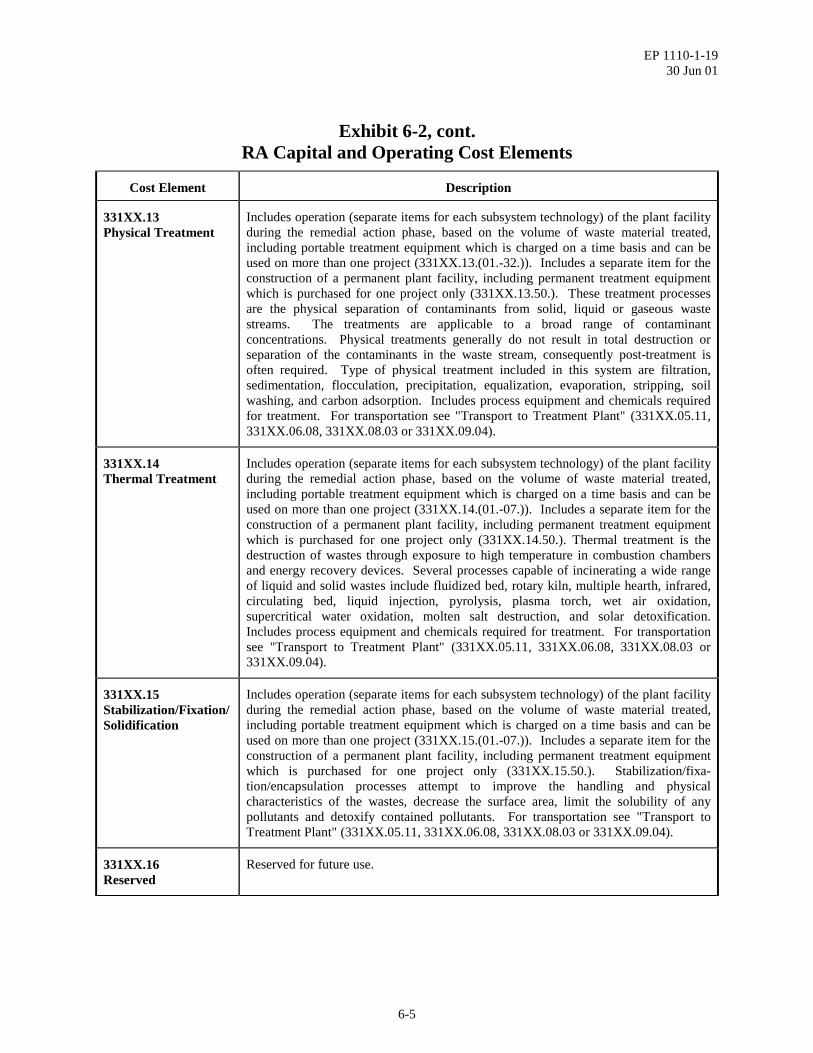
EP 1110-1-1930 Jun 01
6-5
Exhibit 6-2, cont.RA Capital and Operating Cost Elements
Cost Element Description
331XX.13Physical Treatment
Includes operation (separate items for each subsystem technology) of the plant facilityduring the remedial action phase, based on the volume of waste material treated,including portable treatment equipment which is charged on a time basis and can beused on more than one project (331XX.13.(01.-32.)). Includes a separate item for theconstruction of a permanent plant facility, including permanent treatment equipmentwhich is purchased for one project only (331XX.13.50.). These treatment processesare the physical separation of contaminants from solid, liquid or gaseous wastestreams. The treatments are applicable to a broad range of contaminantconcentrations. Physical treatments generally do not result in total destruction orseparation of the contaminants in the waste stream, consequently post-treatment isoften required. Type of physical treatment included in this system are filtration,sedimentation, flocculation, precipitation, equalization, evaporation, stripping, soilwashing, and carbon adsorption. Includes process equipment and chemicals requiredfor treatment. For transportation see "Transport to Treatment Plant" (331XX.05.11,331XX.06.08, 331XX.08.03 or 331XX.09.04).
331XX.14Thermal Treatment
Includes operation (separate items for each subsystem technology) of the plant facilityduring the remedial action phase, based on the volume of waste material treated,including portable treatment equipment which is charged on a time basis and can beused on more than one project (331XX.14.(01.-07.)). Includes a separate item for theconstruction of a permanent plant facility, including permanent treatment equipmentwhich is purchased for one project only (331XX.14.50.). Thermal treatment is thedestruction of wastes through exposure to high temperature in combustion chambersand energy recovery devices. Several processes capable of incinerating a wide rangeof liquid and solid wastes include fluidized bed, rotary kiln, multiple hearth, infrared,circulating bed, liquid injection, pyrolysis, plasma torch, wet air oxidation,supercritical water oxidation, molten salt destruction, and solar detoxification.Includes process equipment and chemicals required for treatment. For transportationsee "Transport to Treatment Plant" (331XX.05.11, 331XX.06.08, 331XX.08.03 or331XX.09.04).
331XX.15Stabilization/Fixation/Solidification
Includes operation (separate items for each subsystem technology) of the plant facilityduring the remedial action phase, based on the volume of waste material treated,including portable treatment equipment which is charged on a time basis and can beused on more than one project (331XX.15.(01.-07.)). Includes a separate item for theconstruction of a permanent plant facility, including permanent treatment equipmentwhich is purchased for one project only (331XX.15.50.). Stabilization/fixa-tion/encapsulation processes attempt to improve the handling and physicalcharacteristics of the wastes, decrease the surface area, limit the solubility of anypollutants and detoxify contained pollutants. For transportation see "Transport toTreatment Plant" (331XX.05.11, 331XX.06.08, 331XX.08.03 or 331XX.09.04).
331XX.16Reserved
Reserved for future use.

EP 1110-1-1930 Jun 01
6-6
Exhibit 6-2, cont.RA Capital and Operating Cost Elements
Cost Element Description
331XX.17Decontamination andDecommissioning(D&D)
Decontamination and decommissioning during remedial action are all activitiesassociated with shutdown and final cleanup of a nuclear or other facility. Includesfacility shutdown and dismantling activities, preparation of decommissioning plans,procurement of equipment and materials, research and development, spent fuelhandling, and hot cell cleanup.
331XX.18Disposal (Other thanCommercial)
Includes operation (separate items for each subsystem disposal method) of the plantfacility during the remedial action phase, based on the volume of waste materialdisposed, including portable treatment equipment which is charged on a time basis andcan be used on more than one project (331XX.18.(01.-10.)). Includes a separate itemfor the construction of a permanent disposal facility, including permanent disposalequipment, which is purchased for one disposal facility only (331XX.18.15.).Disposal (Other than Commercial) provides for the final placement of HTRW orordnance at facilities owned or controlled by the Government. An example would bethe disposal of wastes through burial at a DOE nuclear facility or ordnance disposal atDOD facilities. Includes handling, disposal fees, and transportation to the finalDestruction/Disposal/Storage facility. Excluded is the transportation to a facility fortreatment prior to final disposal. For transportation prior to final disposal see"Transport to Treatment Plant" (331XX.05.11, 331XX.06.08, 331XX.08.03 or331XX.09.04). Disposal may be accomplished through the use of secure landfills,burial grounds, trench, pits, above ground vault, underground vault, undergroundmine/shaft, tanks, pads (tumulus / retrievable storage, other), storage buildings orprotective cover structures, cribs, deep well injection, incinerator, or other.
331XX.19Disposal(Commercial)
Commercial disposal during remedial action provides for the final placement ofHTRW at third party commercial facilities that charge a fee to accept waste dependingon a variety of waste acceptance criteria. Fees are assessed based on different wastecategories, methods of handling, and characterization. Disposal may be accomplishedthrough the use of secure landfills, surface impoundments, deep well injection, orincineration. Includes transportation to the final Destruction/Disposal/Storage facility.Excludes transportation to a facility for treatment prior to disposal. For transportationsee "Transport to Treatment Plant" (331XX.05.11, 331XX.06.08, 331XX.08.03 or331XX.09.04).
331XX.20Site Restoration
Site restoration during remedial action includes topsoil, seeding, landscaping,restoration of roads and parking, and other hardscaping disturbed during siteremediation. Note that all vegetation and planting is to be included as well as theinstallation of any site improvement damaged or altered during construction. Allvegetation and planting for the purpose of erosion control during constructionactivities should be placed under "Erosion Control" (331XX.05.13). Treated soil usedas backfill will be placed under "Disposal (Other than Commercial)" (331XX.18). Allnew site improvements, those not disturbed during construction, are to be includedunder "Sitework" (331XX.03).

EP 1110-1-1930 Jun 01
6-7
Exhibit 6-2, cont.RA Capital and Operating Cost Elements
Cost Element Description
331XX.21Demobilization
Provides for all work associated with remedial action plant takedown and removal oftemporary facilities, utilities, equipment, material, and personnel.
331XX.9xOther
Includes all Hazardous, Toxic, Radioactive Waste Remedial Action work notdescribed by the above-listed systems.
Project Management Professional/technical services to support construction or installation of remedialaction not specific to remedial design or construction management.
Remedial Design Professional/technical services to design the remedial action, including pre-designactivities to collect the necessary data.
ConstructionManagement
Professional/technical services to manage construction or installation of remedialaction, excluding any similar services provided as part of construction activities.
Institutional Controls Non-engineering (i.e., administrative or legal) measures to reduce or minimizepotential for exposure to site contamination or hazards (i.e., limit site access or restrictsite access).
6-5. O&M Cost Elements.
a. Many of the O&M cost elements listed in Exhibit 6-3 are incurred as part ofphysical operation and maintenance activities. Project management and technical support areprofessional/technical services to support O&M activities. Institutional controls may requireannual update or maintenance to ensure potential for exposure to site contamination or hazards isreduced or minimized. Contingency, which covers unknowns or unanticipated conditionsassociated with future O&M activities, should be added to the total of projected O&M costs (i.e.,post-RA O&M), which are estimated only at the time of the RA report.
b. O&M costs can vary and may be estimated for different time periods, dependingon the operating conditions and requirements. For example, the first five years of a groundwatermonitoring program may require semiannual sampling, while the next twenty years may onlyrequire annual sampling. Likewise, an installed cap or cover may require more frequentinspections during the first year of O&M than during subsequent years.
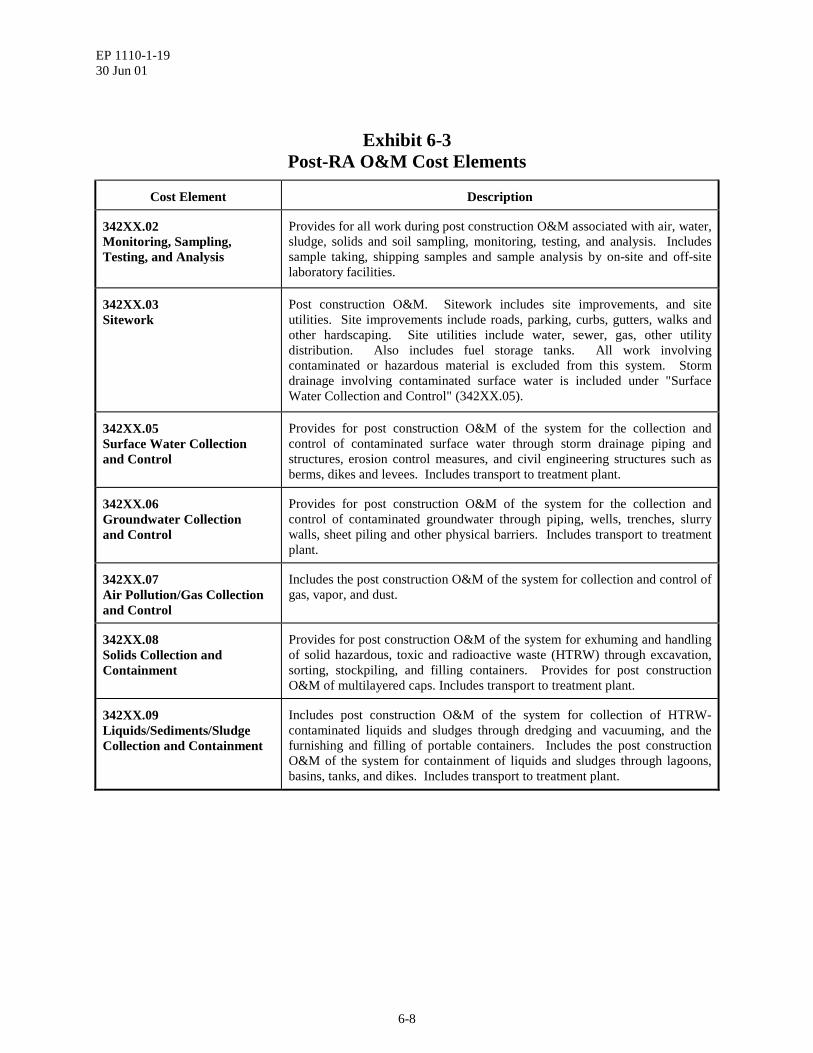
EP 1110-1-1930 Jun 01
6-8
Exhibit 6-3Post-RA O&M Cost Elements
Cost Element Description
342XX.02Monitoring, Sampling,Testing, and Analysis
Provides for all work during post construction O&M associated with air, water,sludge, solids and soil sampling, monitoring, testing, and analysis. Includessample taking, shipping samples and sample analysis by on-site and off-sitelaboratory facilities.
342XX.03Sitework
Post construction O&M. Sitework includes site improvements, and siteutilities. Site improvements include roads, parking, curbs, gutters, walks andother hardscaping. Site utilities include water, sewer, gas, other utilitydistribution. Also includes fuel storage tanks. All work involvingcontaminated or hazardous material is excluded from this system. Stormdrainage involving contaminated surface water is included under "SurfaceWater Collection and Control" (342XX.05).
342XX.05Surface Water Collectionand Control
Provides for post construction O&M of the system for the collection andcontrol of contaminated surface water through storm drainage piping andstructures, erosion control measures, and civil engineering structures such asberms, dikes and levees. Includes transport to treatment plant.
342XX.06Groundwater Collectionand Control
Provides for post construction O&M of the system for the collection andcontrol of contaminated groundwater through piping, wells, trenches, slurrywalls, sheet piling and other physical barriers. Includes transport to treatmentplant.
342XX.07Air Pollution/Gas Collectionand Control
Includes the post construction O&M of the system for collection and control ofgas, vapor, and dust.
342XX.08Solids Collection andContainment
Provides for post construction O&M of the system for exhuming and handlingof solid hazardous, toxic and radioactive waste (HTRW) through excavation,sorting, stockpiling, and filling containers. Provides for post constructionO&M of multilayered caps. Includes transport to treatment plant.
342XX.09Liquids/Sediments/SludgeCollection and Containment
Includes post construction O&M of the system for collection of HTRW-contaminated liquids and sludges through dredging and vacuuming, and thefurnishing and filling of portable containers. Includes the post constructionO&M of the system for containment of liquids and sludges through lagoons,basins, tanks, and dikes. Includes transport to treatment plant.
EP 1110-1-1930 Jun 01
6-9
Exhibit 6-3, cont.Post-RA O&M Cost Elements
Cost Element Description
342XX.11Biological Treatment
Includes post construction O&M (separate for each subsystem technology) ofthe plant facility, based on the volume of waste material treated, includingportable treatment equipment which is charged on a time basis and can be usedon more than one project (342XX.11.(01.-14.)). Includes a separate item forthe yearly post construction O&M of a permanent plant facility(342XX.11.50.). Biological treatment is the microbial transformation oforganic compounds. Biological treatment processes can alter inorganiccompounds such as ammonia and nitrate, and can change the oxidation state ofcertain metal compounds. Includes in-situ biological treatment such as landfarming as well as activated sludge, composting, trickling filters, anaerobic,and aerobic digestion. Includes process equipment and chemicals required fortreatment. For transportation see "Transport to Treatment Plant"(342XX.05.11, 342XX.06.08, 342XX.08.03 or 342XX.09.04).
342XX.12Chemical Treatment
Includes post construction O&M (separate for each subsystem technology) ofthe plant facility, based on the volume of waste material treated, includingportable treatment equipment which is charged on a time basis and can be usedon more than one project (342XX.12.(01.-14.)). Includes a separate item forthe yearly post construction O&M of a permanent plant facility(342XX.12.50.). Chemical treatment is the process in which hazardous wastesare chemically changed to remove toxic contaminants from the environment.Type of treatment included in this system are oxidation/reduction, solventextraction, chlorination, ozonation, ion exchange, neutralization, hydrolysis,photolysis, dechlorination, and electrolysis reactions. Includes processequipment and chemicals required for treatment. For transportation see"Transport to Treatment Plant" (342XX.05.11, 342XX.06.08, 342XX.08.03 or342XX.09.04).
342XX.13Physical Treatment
Includes post construction O&M (separate for each subsystem technology) ofthe plant facility, based on the volume of waste material treated, includingportable treatment equipment which is charged on a time basis and can be usedon more than one project (342XX.13.(01.-32.)). Includes a separate item forthe yearly post construction O&M of a permanent plant facility(342XX.13.50.). These treatment processes are the physical separation ofcontaminants from solid, liquid or gaseous waste streams. The treatments areapplicable to a broad range of contaminant concentrations. Physical treatmentsgenerally do not result in total destruction or separation of the contaminants inthe waste stream, consequently post-treatment is often required. Type ofphysical treatment included in this system are filtration, sedimentation,flocculation, precipitation, equalization, evaporation, stripping, soil washing,and carbon adsorption. Includes process equipment and chemicals required fortreatment. For transportation see "Transport to Treatment Plant"(342XX.05.11, 342XX.06.08, 342XX.08.03 or 342XX.09.04).
EP 1110-1-1930 Jun 01
6-10
Exhibit 6-3, cont.Post-RA O&M Cost Elements
Cost Element Description
342XX.14Thermal Treatment
Includes post construction O&M (separate for each subsystem technology) ofthe plant facility, based on the volume of waste material treated, includingportable treatment equipment which is charged on a time basis and can be usedon more than one project (342XX.14.(01.-07.)). Includes a separate item forthe yearly post construction O&M of a permanent plant facility(342XX.14.50.). Thermal treatment is the destruction of wastes throughexposure to high temperature in combustion chambers and energy recoverydevices. Several processes capable of incinerating a wide range of liquid andsolid wastes include fluidized bed, rotary kiln, multiple hearth, infrared,circulating bed, liquid injection, pyrolysis, plasma torch, wet air oxidation,supercritical water oxidation, molten salt destruction, and solar detoxification.Includes process equipment and chemicals required for treatment. Fortransportation see "Transport to Treatment Plant" (342XX.05.11,342XX.06.08, 342XX.08.03 or 342XX.09.04).
342XX.15Stabilization/Fixation/Capsulation
Includes post construction O&M (separate for each subsystem technology) ofthe plant facility, based on the volume of waste material treated, includingportable treatment equipment which is charged on a time basis and can be usedon more than one project (342XX.15.(01.-07.)). Includes a separate item forthe yearly post construction O&M of a permanent plant facility(342XX.15.50.). Stabilization/fixation/encapsulation processes attempt toimprove the handling and physical characteristics of the wastes, decrease thesurface area, limit the solubility of any pollutants and detoxify containedpollutants. For transportation see "Transport to Treatment Plant"(342XX.05.11, 342XX.06.08, 342XX.08.03 or 342XX.09.04).
342XX.18Disposal (Other thanCommercial)
Includes post construction O&M (separate for each subsystem disposalmethod) of the plant facility, based on the volume of waste material disposed,including portable treatment equipment which is charged on a time basis andcan be used on more than one project (331XX.18.(01.-10.)). Includes aseparate item for the yearly post construction O&M of a permanent disposalfacility (342XX.18.15.). Disposal (Other than Commercial) provides for thefinal placement of HTRW or ordnance at facilities owned or controlled by theGovernment. An example would be the disposal of wastes through burial at aDOE nuclear facility or ordnance disposal at DOD facilities. Includeshandling, disposal fees, and transportation to the final Destruction/Disposal/Storage facility. Excluded is the transportation to a facility for treatment priorto final disposal. For transportation prior to final disposal see "Transport toTreatment Plant" (342XX.05.11, 342XX.06.08, 342XX.08.03 or342XX.09.04). Disposal may be accomplished through the use of securelandfills, burial grounds, trench, pits, above ground vault, underground vault,underground mine/shaft, tanks, pads (tumulus / retrievable storage, other),storage buildings or protective cover structures, cribs, deep well injection,incinerator, or other.
342XX.9XOther
Includes all Hazardous, Toxic, Radioactive Waste post construction O&Mwork not described by the above listed systems.
Contingency Costs to cover unknowns, unforeseen circumstances, or unanticipatedconditions associated with projected post-RA O&M.
EP 1110-1-1930 Jun 01
6-11
Exhibit 6-3, cont.Post-RA O&M Cost Elements
Cost Element Description
Project Management Professional/technical services to manage O&M activities not specific totechnical support listed below.
Technical Support Professional/technical services to monitor, evaluate, and report progress ofoperation and maintenance.
Institutional Controls Update or maintenance of non-engineering measures to reduce or minimizepotential for exposure to site contamination or hazards.
6-6. Periodic Cost Elements. The periodic cost elements listed in Exhibit 6-4 include bothconstruction or O&M-type activities and professional/technical services. Distinctions should bemade between periodic costs that occur during the RA operating and post-RA O&M periods.Contingency should be added to projected periodic costs that may occur during the post-RAO&M period. Periodic costs should be rolled up into the appropriate items of the RA WBSand/or the O&M WBS.
Exhibit 6-4RA or Post-RA O&M Periodic Cost Elements
Cost Element Description
Remedy Failure orReplacement
Construction activity to replace an installed remedy or key components of theremedy.
Demobilization of On-SiteExtraction, Containment, orTreatment Systems*
Construction activity to dismantle or take down extraction , containment, ortreatment facilities upon completion of remedial action.* Specify extraction, containment, or treatment system. Examples include groundwater extraction
system, soil vapor extraction system, groundwater treatment facility, etc. More than one systemmay be associated with an individual alternative.
Contingency (post-RA only) Costs to cover unknowns, unforeseen circumstances, or unanticipatedconditions associated with projected periodic construction/operation activities.
Five-Year Reviews Professional/technical services to prepare five-year review reports (ifhazardous substances, pollutants, or contaminants remain on-site above levelsthat allow for unrestricted use and unlimited exposure).
Groundwater Performanceand Optimization Study
Professional/technical services to analyze and optimize on-going groundwaterpump and treat systems.
Remedial Action Report Professional/technical services to prepare remedial action report uponcompletion of RA.
Institutional Controls Periodic update or maintenance of non-engineering measures to reduce orminimize potential for exposure to site contamination or hazards.

EP 1110-1-1930 Jun 01
6-12
6-7. Project Cost Appendix. To support the summary of total project costs in the RA report(Paragraph 4-9 of this guide), cost information should be provided in an appendix to the RAreport. This should include a cost breakdown and, if treatment was part of the remedy,calculation of technology-specific unit cost(s).
a. Cost Breakdown
(1) The cost breakdown should be in the form of one- to two-page table(s) thatpresents all RA capital and operating costs, post-RA O&M costs, and RA or post-RA O&Mperiodic costs, actual or projected. The table(s)should follow an activity-based format thatidentifies all cost elements and sub-elementsusing the RA WBS or O&M WBS, asapplicable for each of the types of costspresented (e.g., RA capital costs, RA operatingcosts, post-RA O&M costs).
(2) Exhibit 6-5 provides an exampleof how a cost breakdown may be reported inAppendix B of the RA report for a remedialaction that uses land treatment system toremediate contaminated soil. In this example,no periodic costs apply.
b. Technology-Specific Unit Cost
(1) The Guide to Documenting andManaging Cost and Performance Informationfor Remediation Projects (EPA 542-B-98-007)presents a recommended format for reportingtechnology-specific costs. One of the purposesof this format is to enable the calculation of aunit cost using only those items directly relatedto the performance of a technology. This unitcost could then be used for comparison withunit costs of other technologies. The unit cost calculation excludes all project costs associatedwith remediation that are not directly attributable to a specific technology. In addition, thetechnology-specific unit cost calculation should exclude all costs for project management,remedial design, construction management, and technical support that are typically added at thebottom of an estimate or cost breakdown.
(2) For the RA report, if treatment using one or more technologies is part of theremedy, technology-specific unit costs should be calculated and reported in the project costappendix. The total costs and quantities used for the calculation should be clearly stated.
(3) In the example shown in Exhibit 6-5, the subtotal RA capital costs and subtotalRA operating costs would all be considered specific to land treatment, but not projected
Cost GrowthAs a project moves from the planning
stage to the implementation stage, more andmore becomes known about the actual costs ofthe project. During the course of RA projects,the expected accuracy of cost estimates rangesfrom about –30% to +50% for the ROD toabout –10% to +15% at the time of RA bid andaward to 0% at the completion of work.
Contingency is typically added toestimates at various stages to account for costgrowth potential. Scope (design) contingencycovers unknowns associated with anincomplete design. Bid (construction)contingency accounts for unforeseen costs thatbecome known as construction proceeds. Thisamount represents a reserve for quantityoverruns, modifications, change orders, claims,etc.
In addition to comparison to the RODestimate, reporting of actual costs in the RAreport allows for comparison to the bid/awardestimate and assess the amount and possiblecauses of cost growth during implementationof the RA.

EP 1110-1-1930 Jun 01
6-13
groundwater monitoring costs. As shown by the calculation in Exhibit 6-6, the unit cost for landtreatment would be $33.73 per cubic yard using a total technology-specific cost of $273,247 andquantity treated of 8,100 cubic yards.
(4) For more detailed information on calculation of technology-specific unit cost, seethe Guide to Developing and Managing Cost and Performance Information for RemediationProjects at http://www.frtr.gov/cost/.
c. HCAS Reporting. HCAS project and WBS cost breakdown forms shall becompleted and included in the RA report. Exhibit 6-7 shows an example. Note that costs ofproject management, remedial design, construction management, and other items without WBSnumbers (33 or 34 series) are not reported to HCAS.

EP 1110-1-1930 Jun 01
6-14
Exhibit 6-5Example Cost Breakdown
Site: U Creosote Superfund Site Description:Location:Phase:Date:
ACTUAL RA CAPITAL COSTS:
331XX HTRW Remedial Action
.01 Mobilization and Preparatory Work.01 Mob Construction Equipment & Facilities Excavator, etc..03 Submittals/ Implementation Plans QAPP, SSHP, etc..04 Setup/Construct Temporary Facilities Roads/parking/signs, trailer.05 Construct Temporary Utilities Electrical and water hookup
SUBTOTAL
.03 Sitework.02 Clearing and Grubbing Work area.05 Fencing
SUBTOTAL
.08 Solids Collection and Containment.01 Contaminated Soil Excavation
.11 Biological Treatment.03 Construction of Land Treatment Unit
.90 Installation of Clay Liner Impermeable layer
.91 Shaping of Retention Pond
.92 Installation of Subsurface Drainage
.93 Construction of Perimeter Berms
.94 Installation of Run-On Drainage Swales
.95 Installation of Irrigation System
.96 Rental of Tractor and Tiller
.97 Level D PPE Boots, hard hats, etc. for 20 peopleSUBTOTAL
.20 Site Restoration.01 Earthwork Backfill, grading
SUBTOTAL
.21 Demobilization.01 Removal of Temporary Facilities Roads/parking/signs, trailer.02 Removal of Temporary Utilities Electrical and water hookup.04 Demob Construction Equipment & Facilities Excavator, etc..06 Submittals Post-const. reports
SUBTOTAL
SUBTOTAL
Project ManagementRemedial DesignConstruction Management
TOTAL RA CAPITAL COSTS
$8,4458,100
EAEA
EAEA
CY $1.04 $8,445
$1,651$929
$303,026
$929
1 EA $4,939 $4,939$9,635
$2,116EA $2,116
ACTUAL & PROJECTED COSTS (1 of 2)The selected treatment consisted of a land treatment system to remediate excavated site soils. All costs are expressed in 1998 dollars.Live Oak, Florida
Final RA Report (OU 2)October 27, 1998
UNIT
EA
TOTALDESCRIPTION QTY UNIT COST (1998 $$)
1 EA
NOTES
1 EA $8,466 $8,466$5,350 $5,350
1 EA $6,602 $6,6021 EA $3,716 $3,716
$24,134
4.0 AC $4,090 $16,3607,500 LF $2.89 $21,666
$38,026
7,000 CY $5.70 $39,900
8,100 CY $0.95 $7,695
$5,658 $5,6581 $48,216 $48,2161
2,000 LF $5.65 $11,3003,000 LF $1.98 $5,940
1 $15,802 $15,8021 $10,653 $10,65320 EA $102.60 $2,052
$139,521
$227,456
18,320
1 EA $1,65111
34,35022,900

EP 1110-1-1930 Jun 01
6-15
Exhibit 6-5, cont.Example Cost Breakdown
ACTUAL RA OPERATING COSTS:
331XX HTRW Remedial Action
.02 Monitoring, Sampling, Testing, & Analysis.13 Peformance Monitoring (On-Site Lab)
SUBTOTAL
.11 Biological Treatment.03 Land Treatment
.90 Equipment Operation Sprayer and tiller
.91 Spread Soil Contaminated soil
.92 Maintenance/Repair Site vehicles
.93 Additional Costs Diesel fuel/fertilizer/seed culturesSUBTOTAL
SUBTOTAL
Project Management
TOTAL ACTUAL RA OPERATING COSTS
PROJECTED POST-RA O&M COSTS:
342XX HTRW Operation and Maintenance
.02 Monitoring, Sampling, Testing, & Analysis.04 Groundwater Monitoring
SUBTOTAL
TOTAL PROJECTED POST-RA O&M COSTS
TOTAL PROJECT COST
$21,000
$21,000
$456,523
NOTES
$132,497
UNIT TOTALDESCRIPTION QTY UNIT COST (1998 $$)
$61,331
$126,031
6,466
1 $4,292 $4,2921 $3,251 $3,251
EAEA
1 $15,232 $15,2328,100 CY $4.76 $38,556
EA
NOTES(1998 $$)DESCRIPTION QTY UNIT COSTTOTAL
ACTUAL & PROJECTED COSTS (2 of 2)
UNIT
$64,7001 EA $64,700 $64,700
5 EA $4,200 $21,000

EP 1110-1-1930 Jun 01
6-16
Exhibit 6-6Example Technology-Specific Unit Cost Calculation
LAND TREATMENT
RA CAPITAL COSTS:
Solids Collection and ContainmentBiological TreatmentSUBTOTAL
RA OPERATING COSTS:
Monitoring, Sampling, Testing, & AnalysisBiological TreatmentSUBTOTAL
TOTAL TECHNOLOGY-SPECIFIC COST
Cubic Yards of Soil Treated
TECHNOLOGY-SPECIFIC UNIT COST (Per Cubic Yard) $33.73
$273,247
$126,031
$7,695$139,521$147,216
8,100
$64,700$61,331
EP 1110-1-1930 Jun 01
6-17
Exhibit 6-7Example HCAS Data Report and WBS Cost Breakdown
Historical Cost Analysis System (HCAS)Project Data Entry Form (Sheet 1)
Project InformationProject Name U Creosote Operable Unit 2Project Number XXXX-YYYY-ZZProject Phase (Select one)
Studies and DesignRemedial Action �
Operations and MaintenanceProject Note (Describe the project)Landfarming treatment technology was used to remediate 8,100 cubic yards ofPAH-contaminated soil.
Contract InformationContract Number DACW62-97-C-0100
Managing Organization U.S. Army Corps of EngineersOrganization Name Jacksonville DistrictSite Owner Private PartyOther ID Number Prime Contractor Cleanup, Inc.Contract Type (Select one)
Cost + Award FeeCost + Base + Award FeeCost + Fixed Fee �
Cost + Incentive AwardFixed PriceNot AvailiableOther
Procurement Type (Select one) Two Step Sealed Bid
Sealed Bid (IFB)Competitive Negotiation (RFP) �
Sole Source (SSC)Other

EP 1110-1-1930 Jun 01
6-18
Exhibit 6-7, cont.Example HCAS Data Report and WBS Cost Breakdown
Historical Cost Analysis System (HCAS)Project Data Entry Form (Sheet 2)
Site InformationState/Country Florida/USAInstallation Site Name Live Oak, FLSite Number EPA Region IVCurrent Use (Select one)
Installation OperationIndustry OperationResidentialRecreationalWildlife RefugeWaste Disposal �
Administrative OfficeCommercialOtherUnknown
Future Use (Select one)Installation OperationIndustry OperationResidentialRecreationalWildlife RefugeWaste DisposalAdministrative OfficeCommercialOtherUnknown �
Point of ContactData Entry Person POC#2 POC#3
Title/Role Contractor Estimator Organization Cleanup, Inc. Name E.S. Timator Address 123 Main St. City, State Cleantown, FL Zip 12345 Telephone 999-999-9999 Fax 999-999-8888 Email [email protected]
Enter up to 3 POC's.
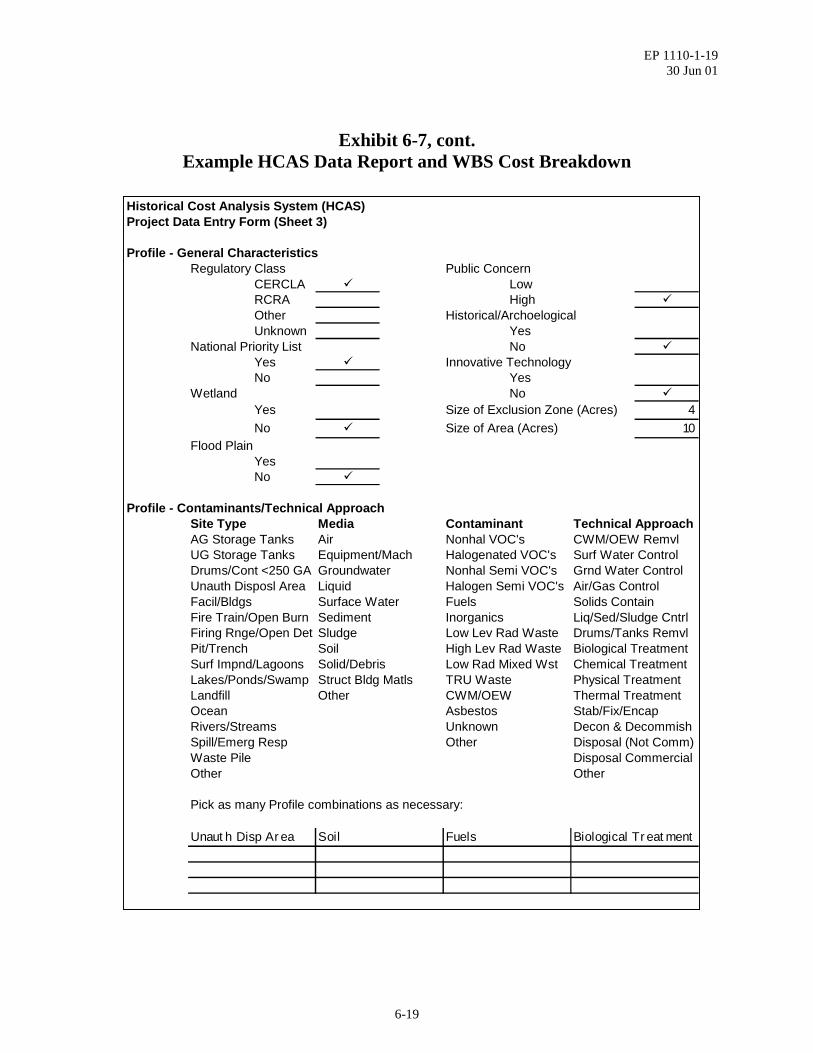
EP 1110-1-1930 Jun 01
6-19
Exhibit 6-7, cont.Example HCAS Data Report and WBS Cost Breakdown
Historical Cost Analysis System (HCAS)Project Data Entry Form (Sheet 3)
Profile - General CharacteristicsRegulatory Class Public Concern
CERCLA � LowRCRA High �
Other Historical/ArchoelogicalUnknown Yes
National Priority List No �
Yes � Innovative TechnologyNo Yes
Wetland No �
Yes Size of Exclusion Zone (Acres) 4No � Size of Area (Acres) 10
Flood PlainYesNo �
Profile - Contaminants/Technical Approach Site Type Media Contaminant Technical Approach
AG Storage Tanks Air Nonhal VOC's CWM/OEW RemvlUG Storage Tanks Equipment/Mach Halogenated VOC's Surf Water ControlDrums/Cont <250 GA Groundwater Nonhal Semi VOC's Grnd Water ControlUnauth Disposl Area Liquid Halogen Semi VOC's Air/Gas ControlFacil/Bldgs Surface Water Fuels Solids ContainFire Train/Open Burn Sediment Inorganics Liq/Sed/Sludge CntrlFiring Rnge/Open Det Sludge Low Lev Rad Waste Drums/Tanks RemvlPit/Trench Soil High Lev Rad Waste Biological TreatmentSurf Impnd/Lagoons Solid/Debris Low Rad Mixed Wst Chemical TreatmentLakes/Ponds/Swamp Struct Bldg Matls TRU Waste Physical TreatmentLandfill Other CWM/OEW Thermal TreatmentOcean Asbestos Stab/Fix/EncapRivers/Streams Unknown Decon & DecommishSpill/Emerg Resp Other Disposal (Not Comm)Waste Pile Disposal CommercialOther Other
Pick as many Profile combinations as necessary:
Unauth Disp Area Soil Fuels Biological Treatment
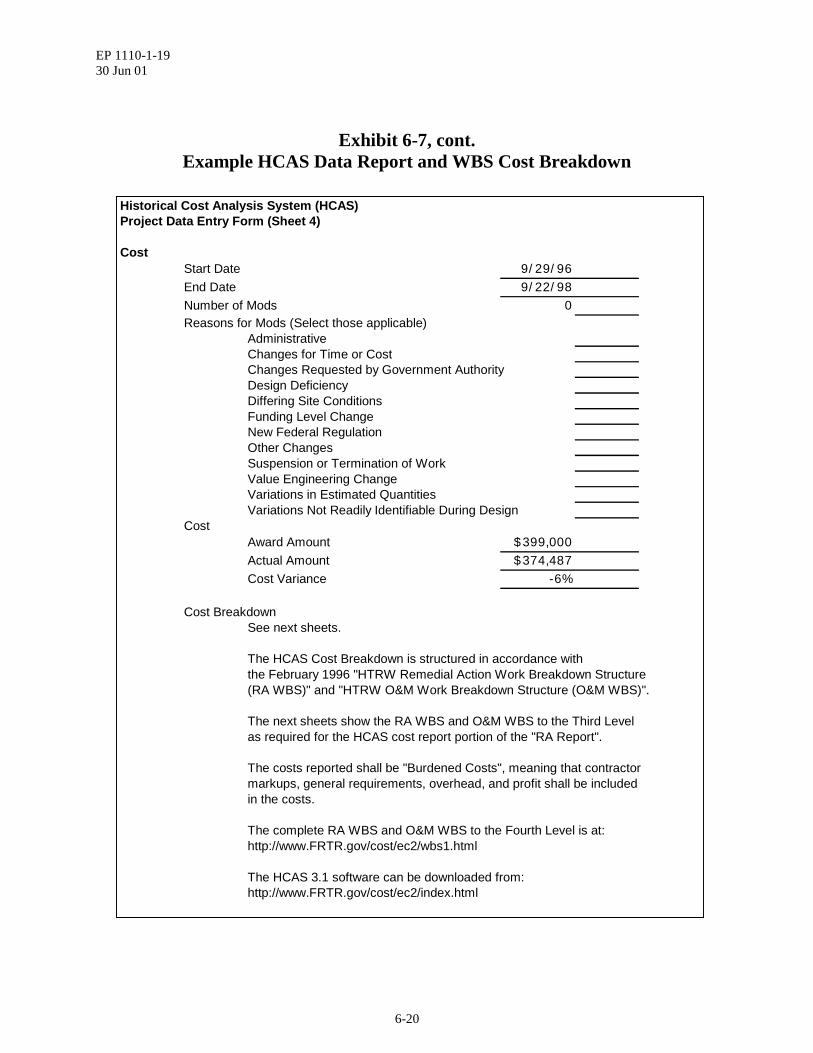
EP 1110-1-1930 Jun 01
6-20
Exhibit 6-7, cont.Example HCAS Data Report and WBS Cost Breakdown
Historical Cost Analysis System (HCAS)Project Data Entry Form (Sheet 4)
CostStart Date 9/29/96End Date 9/22/98Number of Mods 0Reasons for Mods (Select those applicable)
AdministrativeChanges for Time or CostChanges Requested by Government AuthorityDesign DeficiencyDiffering Site ConditionsFunding Level ChangeNew Federal RegulationOther ChangesSuspension or Termination of WorkValue Engineering ChangeVariations in Estimated QuantitiesVariations Not Readily Identifiable During Design
CostAward Amount $399,000Actual Amount $374,487Cost Variance -6%
Cost Breakdown See next sheets.
The HCAS Cost Breakdown is structured in accordance with the February 1996 "HTRW Remedial Action Work Breakdown Structure(RA WBS)" and "HTRW O&M Work Breakdown Structure (O&M WBS)".
The next sheets show the RA WBS and O&M WBS to the Third Level as required for the HCAS cost report portion of the "RA Report".
The costs reported shall be "Burdened Costs", meaning that contractor markups, general requirements, overhead, and profit shall be includedin the costs.
The complete RA WBS and O&M WBS to the Fourth Level is at: http://www.FRTR.gov/cost/ec2/wbs1.html
The HCAS 3.1 software can be downloaded from:http://www.FRTR.gov/cost/ec2/index.html
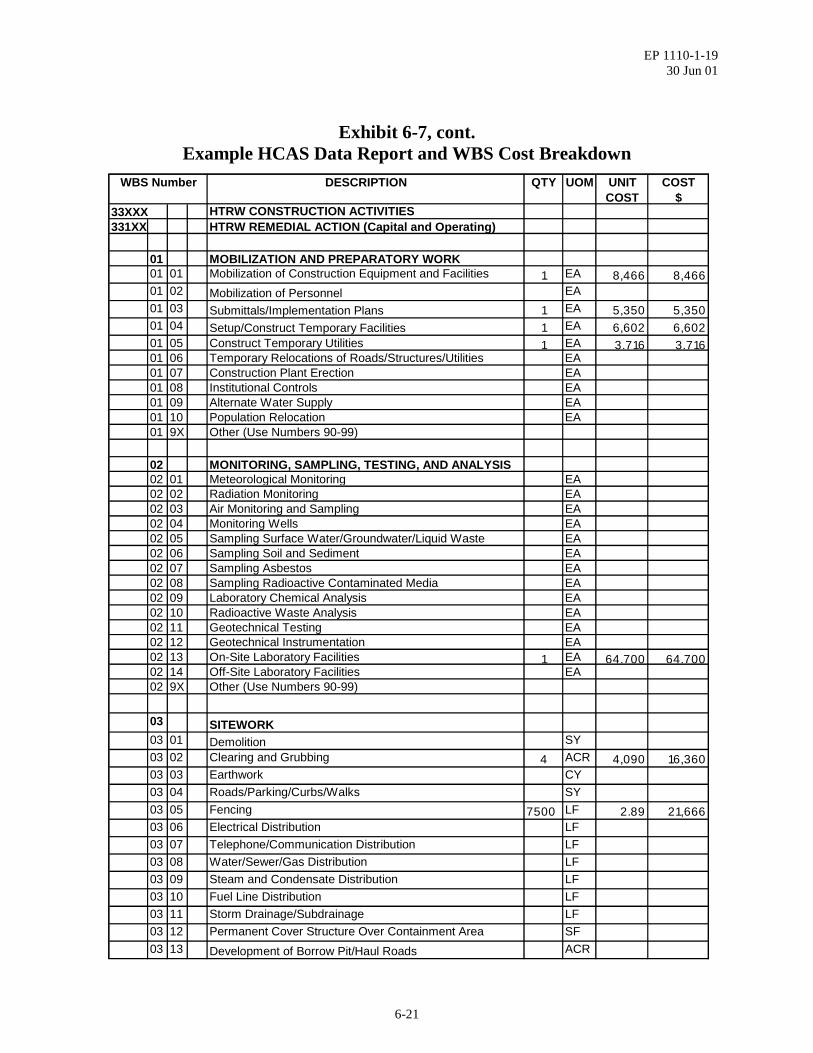
EP 1110-1-1930 Jun 01
6-21
Exhibit 6-7, cont.Example HCAS Data Report and WBS Cost Breakdown
WBS Number DESCRIPTION QTY UOM UNIT COST
COST $
33XXX HTRW CONSTRUCTION ACTIVITIES331XX HTRW REMEDIAL ACTION (Capital and Operating)
01 MOBILIZATION AND PREPARATORY WORK 01 01 Mobilization of Construction Equipment and Facilities 1 EA 8,466 8,46601 02 Mobilization of Personnel EA01 03 Submittals/Implementation Plans 1 EA 5,350 5,35001 04 Setup/Construct Temporary Facilities 1 EA 6,602 6,60201 05 Construct Temporary Utilities 1 EA 3,716 3,71601 06 Temporary Relocations of Roads/Structures/Utilities EA01 07 Construction Plant Erection EA01 08 Institutional Controls EA01 09 Alternate Water Supply EA01 10 Population Relocation EA01 9X Other (Use Numbers 90-99)
02 MONITORING, SAMPLING, TESTING, AND ANALYSIS 02 01 Meteorological Monitoring EA02 02 Radiation Monitoring EA02 03 Air Monitoring and Sampling EA02 04 Monitoring Wells EA02 05 Sampling Surface Water/Groundwater/Liquid Waste EA02 06 Sampling Soil and Sediment EA02 07 Sampling Asbestos EA02 08 Sampling Radioactive Contaminated Media EA02 09 Laboratory Chemical Analysis EA02 10 Radioactive Waste Analysis EA02 11 Geotechnical Testing EA02 12 Geotechnical Instrumentation EA02 13 On-Site Laboratory Facilities 1 EA 64,700 64,70002 14 Off-Site Laboratory Facilities EA02 9X Other (Use Numbers 90-99)
03 SITEWORK03 01 Demolition SY03 02 Clearing and Grubbing 4 ACR 4,090 16,36003 03 Earthwork CY03 04 Roads/Parking/Curbs/Walks SY03 05 Fencing 7500 LF 2.89 21,66603 06 Electrical Distribution LF03 07 Telephone/Communication Distribution LF03 08 Water/Sewer/Gas Distribution LF03 09 Steam and Condensate Distribution LF03 10 Fuel Line Distribution LF03 11 Storm Drainage/Subdrainage LF03 12 Permanent Cover Structure Over Containment Area SF03 13 Development of Borrow Pit/Haul Roads ACR

EP 1110-1-1930 Jun 01
6-22
Exhibit 6-7, cont.Example HCAS Data Report and WBS Cost Breakdown
WBS Number DESCRIPTION QTY UOM UNIT COST
COST $
331XX 03 14 Fuel Storage Tanks (New) EA03 9X Other (Use Numbers 90-99)
04 ORDNANCE AND EXPLOSIVE - CHEMICAL WARFARE 04 01 Ordnance Removal and Destruction ACR04 9x Other (Use Numbers 90-99)
05 SURFACE WATER COLLECTION AND CONTROL05 01 Berms/Dikes LF05 02 Floodwalls SF05 03 Levees LF05 04 Terraces and Benches LF05 05 Channels/Waterways (Soil/Rock) LF05 06 Chutes or Flumes LF05 07 Sediment Barriers LF05 08 Storm Drainage LF05 09 Lagoons/Basins/Tanks/Dikes/Pump System ACR05 10 Pumping/Draining/Collection MGA05 11 Transport to Treatment Plant MGA05 12 Earthwork CY05 13 Erosion Control ACR05 14 Development of Borrow Pit/Haul Roads ACR05 9X Other (Use Numbers 90-99)
06 GROUNDWATER COLLECTION AND CONTROL06 01 Extraction and Injection Wells EA06 02 Subsurface Drainage/Collection LF06 03 Slurry Walls SF06 04 Grout Curtain SF06 05 Sheet Piling SF06 06 Lagoons/Basins/Tanks/Dikes/Pump System ACR06 07 Pumping/Collection MGA06 08 Transport to Treatment Plant MGA06 09 Development of Borrow Pit/Haul Roads ACR06 9x Other (Use Numbers 90-99)
07 AIR POLLUTION/GAS COLLECTION AND CONTROL 07 01 Gas/Vapor Collection Trench System LF07 02 Gas/Vapor Collection Well System EA07 03 Gas/Vapor Collection at Lagoon Cover SY07 04 Fugitive Dust/Vapor/Gas Emissions Control ACR07 9x Other (Use Numbers 90-99)
08 SOLIDS COLLECTION AND CONTAINMENT 08 01 Contaminated Soil Collection 8,100 CY 0.95 7,69508 02 Waste Containment, Portable (Furnish/Fill) CY08 03 Transport to Treatment Plant CY

EP 1110-1-1930 Jun 01
6-23
Exhibit 6-7, cont.Example HCAS Data Report and WBS Cost Breakdown
WBS Number DESCRIPTION QTY UOM UNIT COST
COST $
331XX 08 04 Radioactive Specific Waste Containment (Furnish/Fill) CY08 05 Capping of Contaminated Area/Waste Pile (Soil/Asphalt ACR08 06 Nuclear Waste Densification (Dynamic Compaction) CY08 07 Development of Borrow Pit/Haul Roads ACR08 9x Other (Use Numbers 90-99)
09 LIQUIDS/SEDIMENTS/SLUDGES COLLECTION AND 09 01 Dredging/Excavating CY09 02 Industrial Vacuuming CY09 03 Waste Containment, Portable (Furnish/Fill) MGA09 04 Transport to Treatment Plant MGA09 05 Radioactive Specific Waste Containment (Furnish/Fill) MGA09 06 Pumping/Draining/Collection MGA09 07 Lagoons/Basins/Tanks/Pump System ACR09 08 Development of Borrow Pit/Haul Roads ACR09 9x Other (Use Numbers 90-99)
10 DRUMS/TANKS/STRUCTURES/MISCELLANEOUS 10 01 Drum Removal EA10 02 Tank Removal EA10 03 Structure Removal SF10 04 Asbestos Abatement SF10 05 Piping and Pipeline Removal LF10 06 Radioactive Specific Waste Containment (Furnish/Fill) CY10 07 Miscellaneous Items ACR10 08 Contaminated Paint Removal SF10 9x Other (Use Numbers 90-99)
11 BIOLOGICAL TREATMENT 11 01 Activated Sludge (Sequencing Batch Reactors) MGA11 02 Rotating Biological Contactors MGA11 03 Land Treatment/Farming (Solid Phase Biodegradation) 8,100 CY 24.80 200,85211 04 In-Situ Biodegradation/Bioreclamation CY11 05 Trickling Filters MGA11 06 Biological Lagoons MGA11 07 Composting CY11 08 Sludge Stabilization - Aerobic CY11 09 Sludge Stabilization - Anaerobic CY11 10 Genetically Engineered Organisms (White Rot Fungus) CY11 11 Slurry Biodegradation CY11 12 Bioventing SF11 13 Bioslurping SF11 14 Biopile (Heap Pile Remediation) CY11 50 Construction of Permanent Plant Facility EA11 9x Other (Use Numbers 90-99)
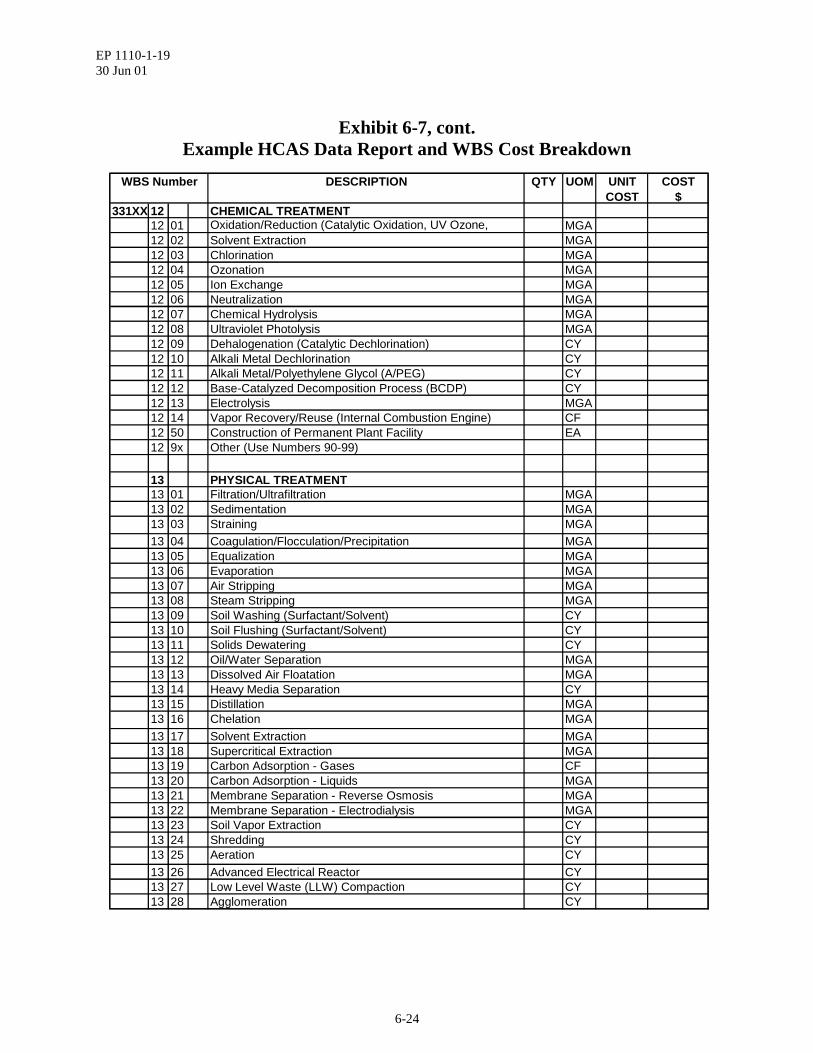
EP 1110-1-1930 Jun 01
6-24
Exhibit 6-7, cont.Example HCAS Data Report and WBS Cost Breakdown
WBS Number DESCRIPTION QTY UOM UNIT COST
COST $
331XX 12 CHEMICAL TREATMENT12 01 Oxidation/Reduction (Catalytic Oxidation, UV Ozone, MGA12 02 Solvent Extraction MGA12 03 Chlorination MGA12 04 Ozonation MGA12 05 Ion Exchange MGA12 06 Neutralization MGA12 07 Chemical Hydrolysis MGA12 08 Ultraviolet Photolysis MGA12 09 Dehalogenation (Catalytic Dechlorination) CY12 10 Alkali Metal Dechlorination CY12 11 Alkali Metal/Polyethylene Glycol (A/PEG) CY12 12 Base-Catalyzed Decomposition Process (BCDP) CY12 13 Electrolysis MGA12 14 Vapor Recovery/Reuse (Internal Combustion Engine) CF12 50 Construction of Permanent Plant Facility EA12 9x Other (Use Numbers 90-99)
13 PHYSICAL TREATMENT13 01 Filtration/Ultrafiltration MGA13 02 Sedimentation MGA13 03 Straining MGA13 04 Coagulation/Flocculation/Precipitation MGA13 05 Equalization MGA13 06 Evaporation MGA13 07 Air Stripping MGA13 08 Steam Stripping MGA13 09 Soil Washing (Surfactant/Solvent) CY13 10 Soil Flushing (Surfactant/Solvent) CY13 11 Solids Dewatering CY13 12 Oil/Water Separation MGA13 13 Dissolved Air Floatation MGA13 14 Heavy Media Separation CY13 15 Distillation MGA13 16 Chelation MGA13 17 Solvent Extraction MGA13 18 Supercritical Extraction MGA13 19 Carbon Adsorption - Gases CF13 20 Carbon Adsorption - Liquids MGA13 21 Membrane Separation - Reverse Osmosis MGA13 22 Membrane Separation - Electrodialysis MGA13 23 Soil Vapor Extraction CY13 24 Shredding CY13 25 Aeration CY13 26 Advanced Electrical Reactor CY13 27 Low Level Waste (LLW) Compaction CY13 28 Agglomeration CY
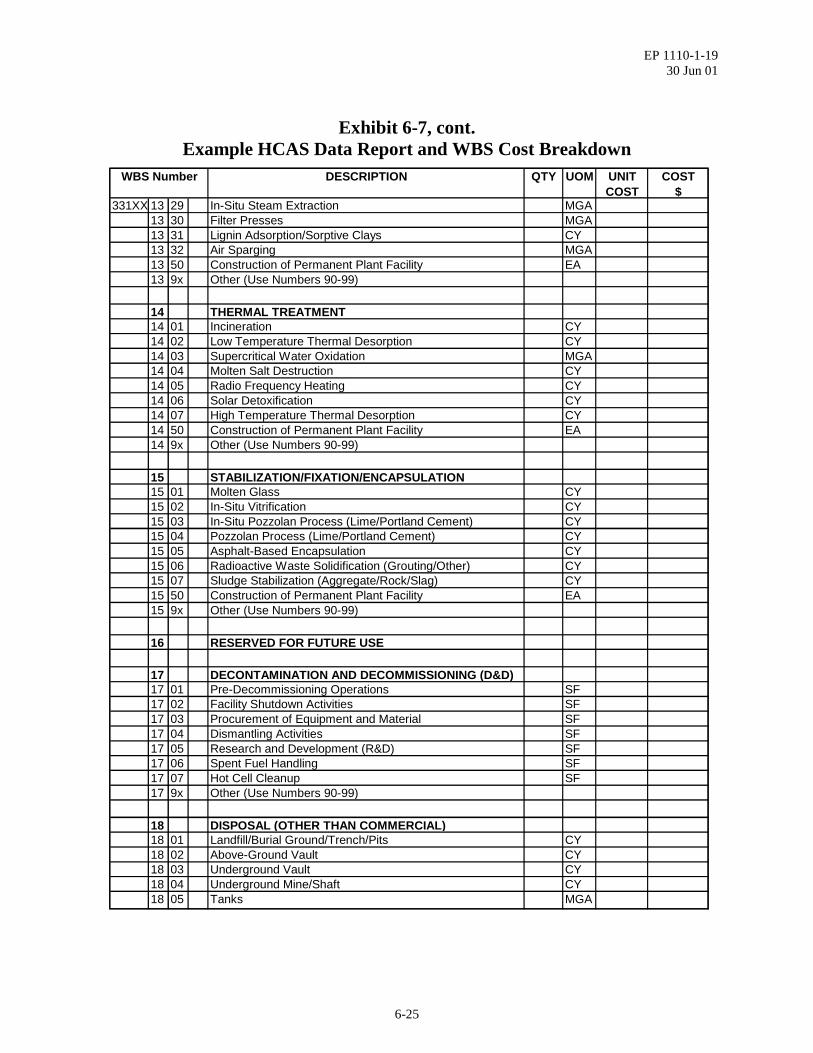
EP 1110-1-1930 Jun 01
6-25
Exhibit 6-7, cont.Example HCAS Data Report and WBS Cost Breakdown
WBS Number DESCRIPTION QTY UOM UNIT COST
COST $
331XX 13 29 In-Situ Steam Extraction MGA13 30 Filter Presses MGA13 31 Lignin Adsorption/Sorptive Clays CY13 32 Air Sparging MGA13 50 Construction of Permanent Plant Facility EA13 9x Other (Use Numbers 90-99)
14 THERMAL TREATMENT 14 01 Incineration CY14 02 Low Temperature Thermal Desorption CY14 03 Supercritical Water Oxidation MGA14 04 Molten Salt Destruction CY14 05 Radio Frequency Heating CY14 06 Solar Detoxification CY14 07 High Temperature Thermal Desorption CY14 50 Construction of Permanent Plant Facility EA14 9x Other (Use Numbers 90-99)
15 STABILIZATION/FIXATION/ENCAPSULATION15 01 Molten Glass CY15 02 In-Situ Vitrification CY15 03 In-Situ Pozzolan Process (Lime/Portland Cement) CY15 04 Pozzolan Process (Lime/Portland Cement) CY15 05 Asphalt-Based Encapsulation CY15 06 Radioactive Waste Solidification (Grouting/Other) CY15 07 Sludge Stabilization (Aggregate/Rock/Slag) CY15 50 Construction of Permanent Plant Facility EA15 9x Other (Use Numbers 90-99)
16 RESERVED FOR FUTURE USE
17 DECONTAMINATION AND DECOMMISSIONING (D&D)17 01 Pre-Decommissioning Operations SF17 02 Facility Shutdown Activities SF17 03 Procurement of Equipment and Material SF17 04 Dismantling Activities SF17 05 Research and Development (R&D) SF17 06 Spent Fuel Handling SF17 07 Hot Cell Cleanup SF17 9x Other (Use Numbers 90-99)
18 DISPOSAL (OTHER THAN COMMERCIAL)18 01 Landfill/Burial Ground/Trench/Pits CY18 02 Above-Ground Vault CY18 03 Underground Vault CY18 04 Underground Mine/Shaft CY18 05 Tanks MGA

EP 1110-1-1930 Jun 01
6-26
Exhibit 6-7, cont.Example HCAS Data Report and WBS Cost Breakdown
WBS Number DESCRIPTION QTY UOM UNIT COST
COST $
331XX 18 06 Pads (Tumulus/Retrievable Storage/Other) CY18 07 Storage Bldgs/Protective Cvr Structures/Other Bldgs & CY 18 08 Cribs CY18 09 Deep Well Injection MGA18 10 Incinerator CY18 15 Construction of Permanent Disposal Facility EA18 20 Container Handling EA18 21 Transportation to Storage/Disposal Facility TON18 22 Disposal Fees and Taxes TON18 23 Mixed Waste Storage Fees and Taxes TON18 9x Other (Use Numbers 90-99)
19 DISPOSAL (COMMERCIAL)19 20 Container Handling EA19 21 Transportation to Storage/Disposal Facility TON19 22 Disposal Fees and Taxes TON19 23 Mixed Waste Storage Fees and Taxes TON19 9x Other (Use Numbers 90-99)
20 SITE RESTORATION20 01 Earthwork 8,100 CY 1.04 8,44520 02 Permanent Markers EA20 03 Permanent Features EA20 04 Revegetation and Planting ACR20 05 Removal of Barriers EA20 9x Other (Use Numbers 90-99)
21 DEMOBILIZATION21 01 Removal of Temporary Facilities 1 EA 1,651 1,65121 02 Removal of Temporary Utilities 1 EA 929 92921 03 Final Decontamination EA21 04 Demobilization of Construction Equipment and Facilities 1 EA 2,116 2,11621 05 Demobilization of Personnel EA21 06 Submittals 1 EA 4,939 4,93921 07 Construction Plant Takedown EA21 9x Other (Use Numbers 90-99)
9X OTHER (Use Numbers 90-99)
TOTAL AMOUNT $ 353,487
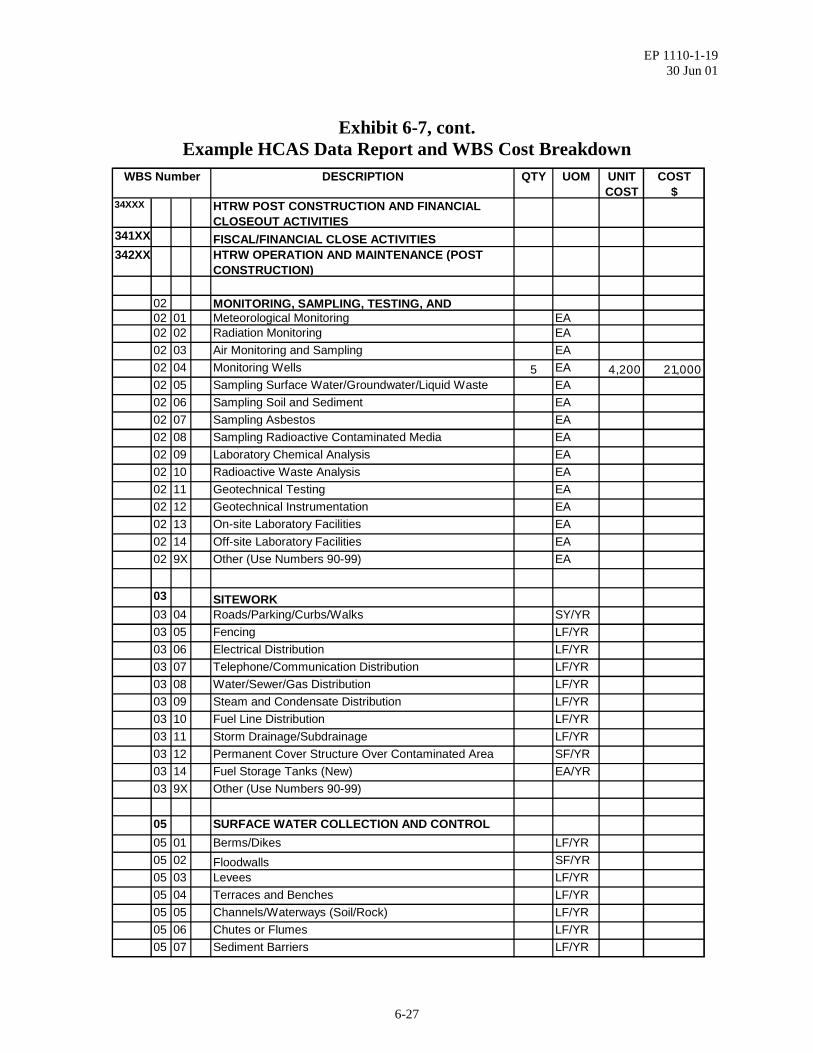
EP 1110-1-1930 Jun 01
6-27
Exhibit 6-7, cont.Example HCAS Data Report and WBS Cost Breakdown
WBS Number DESCRIPTION QTY UOM UNIT COST
COST $
34XXX HTRW POST CONSTRUCTION AND FINANCIAL CLOSEOUT ACTIVITIES
341XX FISCAL/FINANCIAL CLOSE ACTIVITIES342XX HTRW OPERATION AND MAINTENANCE (POST
CONSTRUCTION)
02 MONITORING, SAMPLING, TESTING, AND 02 01 Meteorological Monitoring EA02 02 Radiation Monitoring EA02 03 Air Monitoring and Sampling EA02 04 Monitoring Wells 5 EA 4,200 21,00002 05 Sampling Surface Water/Groundwater/Liquid Waste EA02 06 Sampling Soil and Sediment EA02 07 Sampling Asbestos EA02 08 Sampling Radioactive Contaminated Media EA02 09 Laboratory Chemical Analysis EA02 10 Radioactive Waste Analysis EA02 11 Geotechnical Testing EA02 12 Geotechnical Instrumentation EA02 13 On-site Laboratory Facilities EA02 14 Off-site Laboratory Facilities EA02 9X Other (Use Numbers 90-99) EA
03 SITEWORK03 04 Roads/Parking/Curbs/Walks SY/YR03 05 Fencing LF/YR03 06 Electrical Distribution LF/YR03 07 Telephone/Communication Distribution LF/YR03 08 Water/Sewer/Gas Distribution LF/YR03 09 Steam and Condensate Distribution LF/YR03 10 Fuel Line Distribution LF/YR03 11 Storm Drainage/Subdrainage LF/YR03 12 Permanent Cover Structure Over Contaminated Area SF/YR03 14 Fuel Storage Tanks (New) EA/YR03 9X Other (Use Numbers 90-99)
05 SURFACE WATER COLLECTION AND CONTROL05 01 Berms/Dikes LF/YR05 02 Floodwalls SF/YR05 03 Levees LF/YR05 04 Terraces and Benches LF/YR05 05 Channels/Waterways (Soil/Rock) LF/YR05 06 Chutes or Flumes LF/YR05 07 Sediment Barriers LF/YR
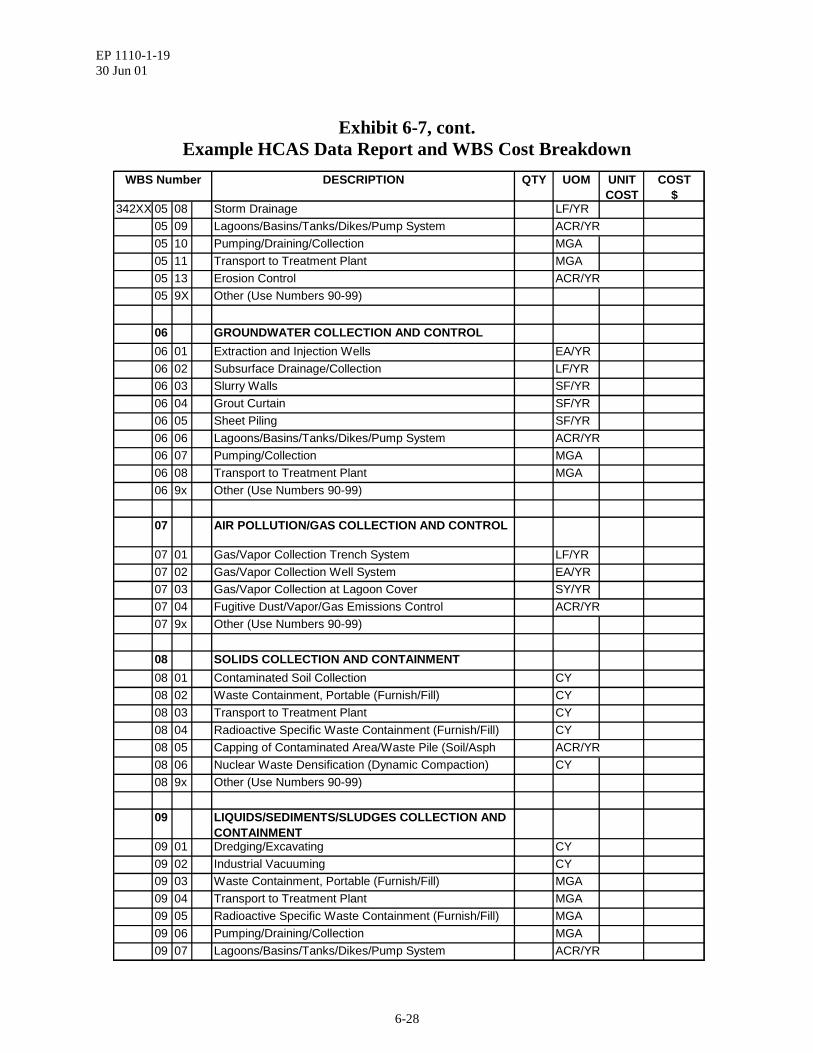
EP 1110-1-1930 Jun 01
6-28
Exhibit 6-7, cont.Example HCAS Data Report and WBS Cost Breakdown
WBS Number DESCRIPTION QTY UOM UNIT COST
COST $
342XX 05 08 Storm Drainage LF/YR05 09 Lagoons/Basins/Tanks/Dikes/Pump System ACR/YR05 10 Pumping/Draining/Collection MGA05 11 Transport to Treatment Plant MGA05 13 Erosion Control ACR/YR05 9X Other (Use Numbers 90-99)
06 GROUNDWATER COLLECTION AND CONTROL06 01 Extraction and Injection Wells EA/YR06 02 Subsurface Drainage/Collection LF/YR06 03 Slurry Walls SF/YR06 04 Grout Curtain SF/YR06 05 Sheet Piling SF/YR06 06 Lagoons/Basins/Tanks/Dikes/Pump System ACR/YR06 07 Pumping/Collection MGA06 08 Transport to Treatment Plant MGA06 9x Other (Use Numbers 90-99)
07 AIR POLLUTION/GAS COLLECTION AND CONTROL
07 01 Gas/Vapor Collection Trench System LF/YR07 02 Gas/Vapor Collection Well System EA/YR07 03 Gas/Vapor Collection at Lagoon Cover SY/YR07 04 Fugitive Dust/Vapor/Gas Emissions Control ACR/YR07 9x Other (Use Numbers 90-99)
08 SOLIDS COLLECTION AND CONTAINMENT 08 01 Contaminated Soil Collection CY08 02 Waste Containment, Portable (Furnish/Fill) CY08 03 Transport to Treatment Plant CY08 04 Radioactive Specific Waste Containment (Furnish/Fill) CY08 05 Capping of Contaminated Area/Waste Pile (Soil/Asph ACR/YR08 06 Nuclear Waste Densification (Dynamic Compaction) CY08 9x Other (Use Numbers 90-99)
09 LIQUIDS/SEDIMENTS/SLUDGES COLLECTION AND CONTAINMENT
09 01 Dredging/Excavating CY09 02 Industrial Vacuuming CY09 03 Waste Containment, Portable (Furnish/Fill) MGA09 04 Transport to Treatment Plant MGA09 05 Radioactive Specific Waste Containment (Furnish/Fill) MGA09 06 Pumping/Draining/Collection MGA09 07 Lagoons/Basins/Tanks/Dikes/Pump System ACR/YR

EP 1110-1-1930 Jun 01
6-29
Exhibit 6-7, cont.Example HCAS Data Report and WBS Cost Breakdown
WBS Number DESCRIPTION QTY UOM UNIT COST
COST $
342XX 09 9x Other (Use Numbers 90-99)
11 BIOLOGICAL TREATMENT 11 01 Activated Sludge (Seq Batch Reactors) MGA11 02 Rotating Biological Contactors MGA11 03 Land Treatment/Farming (Solid Phase Biodegradation) CY11 04 In-Situ Biodegradation/Bioreclamation CY11 05 Trickling Filters MGA11 06 Biological Lagoons MGA11 07 Composting (Soil Pile Bioremediation) CY11 08 Sludge Stabilization - Aerobic CY11 09 Sludge Stabilization - Anaerobic CY11 10 Genetically Engineered Organisms (White Rot Fungus) CY
11 11 Slurry Biodegradation CY11 12 Bioventing SF11 13 Bioslurping SF11 14 Biopile (Heap Pile Remediation) CY 11 50 Post Construction O&M of Permanent Plant Facility EA/YR11 9x Other (Use Numbers 90-99)
12 CHEMICAL TREATMENT12 01 Oxidation/Reduction (Catalytic) MGA12 02 Solvent Extraction MGA12 03 Chlorination MGA12 04 Ozonation MGA12 05 Ion Exchange MGA12 06 Neutralization MGA12 07 Chemical Hydrolysis MGA12 08 Ultraviolet Photolysis (UV Oxidation) MGA12 09 Dehalogenation (Catalytic Dechlorination) CY12 10 Alkali Metal Dechlorination CY12 11 Alkali Metal/Polyethylene Glycol (A/PEG) CY12 12 Base-Catalyzed Decomposition Process CY12 13 Electrolysis MGA12 14 Vapor Recovery/Reuse (Internal Combustion Engine) CF12 50 Post Construction O&M of Permanent Plant Facility EA/YR12 9x Other (Use Numbers 90-99)
13 PHYSICAL TREATMENT13 01 Filtration/Ultrafiltration MGA13 02 Sedimentation MGA13 03 Straining MGA13 04 Coagulation/Flocculation/Precipitation MGA
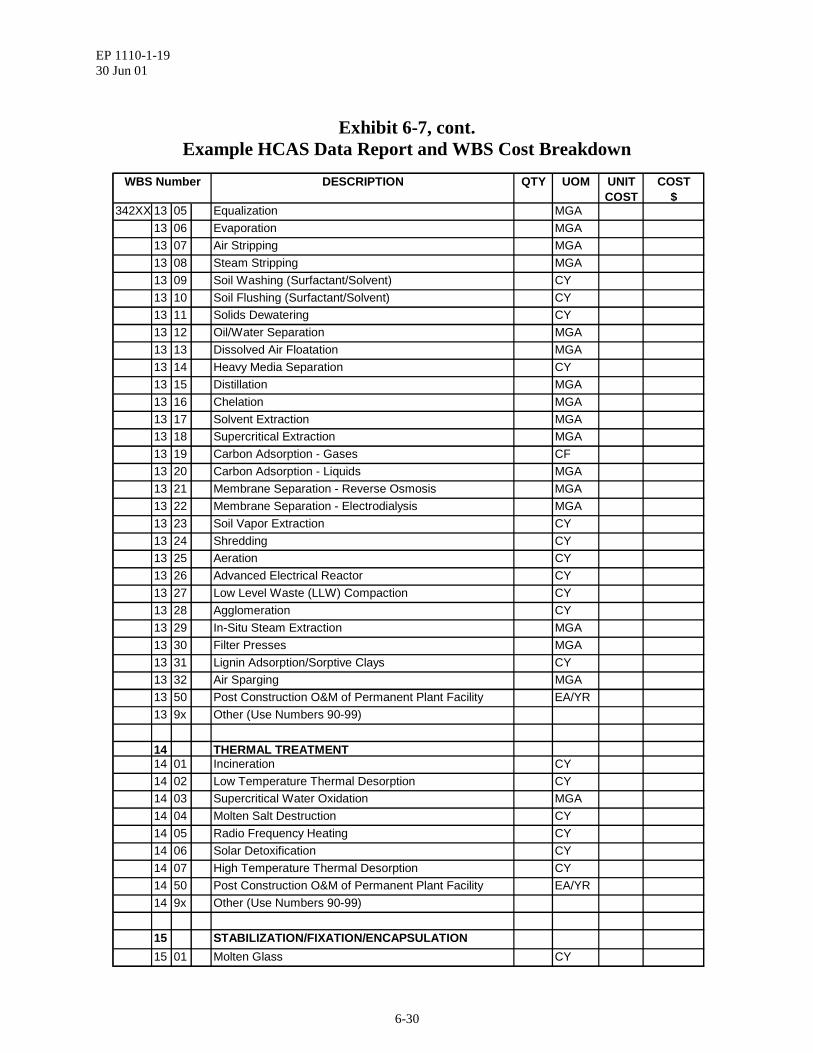
EP 1110-1-1930 Jun 01
6-30
Exhibit 6-7, cont.Example HCAS Data Report and WBS Cost Breakdown
WBS Number DESCRIPTION QTY UOM UNIT COST
COST $
342XX 13 05 Equalization MGA13 06 Evaporation MGA13 07 Air Stripping MGA13 08 Steam Stripping MGA13 09 Soil Washing (Surfactant/Solvent) CY13 10 Soil Flushing (Surfactant/Solvent) CY13 11 Solids Dewatering CY13 12 Oil/Water Separation MGA13 13 Dissolved Air Floatation MGA13 14 Heavy Media Separation CY13 15 Distillation MGA13 16 Chelation MGA13 17 Solvent Extraction MGA13 18 Supercritical Extraction MGA13 19 Carbon Adsorption - Gases CF13 20 Carbon Adsorption - Liquids MGA13 21 Membrane Separation - Reverse Osmosis MGA13 22 Membrane Separation - Electrodialysis MGA13 23 Soil Vapor Extraction CY13 24 Shredding CY13 25 Aeration CY13 26 Advanced Electrical Reactor CY13 27 Low Level Waste (LLW) Compaction CY13 28 Agglomeration CY13 29 In-Situ Steam Extraction MGA13 30 Filter Presses MGA13 31 Lignin Adsorption/Sorptive Clays CY13 32 Air Sparging MGA13 50 Post Construction O&M of Permanent Plant Facility EA/YR13 9x Other (Use Numbers 90-99)
14 THERMAL TREATMENT 14 01 Incineration CY14 02 Low Temperature Thermal Desorption CY14 03 Supercritical Water Oxidation MGA14 04 Molten Salt Destruction CY14 05 Radio Frequency Heating CY14 06 Solar Detoxification CY14 07 High Temperature Thermal Desorption CY14 50 Post Construction O&M of Permanent Plant Facility EA/YR14 9x Other (Use Numbers 90-99)
15 STABILIZATION/FIXATION/ENCAPSULATION15 01 Molten Glass CY

EP 1110-1-1930 Jun 01
6-31
Exhibit 6-7, cont.Example HCAS Data Report and WBS Cost Breakdown
WBS Number DESCRIPTION QTY UOM UNIT COST
COST $
342XX 15 02 In-Situ Vitrification CY15 03 In-Situ Pozzolan Process (Lime/Portland Cement) CY15 04 Pozzolan Process (Lime/Portland Cement) CY15 05 Asphalt-Based Encapsulation CY15 06 Radioactive Waste Solidification (Grouting/Other) CY15 07 Sludge Stabilization (Aggregate/Rock/Slag) CY15 50 Post Construction O&M of Permanent Plant Facility EA/YR15 9x Other (Use Numbers 90-99)
18 DISPOSAL (OTHER THAN COMMERCIAL)18 01 Landfill/Burial Ground/Trench/Pits CY18 02 Above-Ground Vault CY18 03 Underground Vault CY18 04 Underground Mine/Shaft CY18 05 Tanks MGA18 06 Pads (Tumulus/Retrievable Storage/Other) CY18 07 Storage Bldgs/Protective Cvr Structures/Other Bldgs & CY 18 08 Cribs CY18 09 Deep Well Injection MGA18 10 Incinerator CY18 15 Post Construction O&M of Permanent Disposal Fac EA/YR18 20 Container Handling EA18 21 Transportation to Storage/Disposal Facility TON18 22 Disposal Fees & Taxes TON18 23 Mixed Waste Storage Fees & Taxes TON18 9x Other (Use Numbers 90-99)
9X OTHER (Use Numbers 90-99)
TOTAL AMOUNT $ 21,000
EP 1110-1-1930 Jun 01
A-1
APPENDIX AGLOSSARY OF ENVIRONMENTAL RESTORATION TERMS
The following definitions were taken primarily from Superfund/Oil Program ImplementationManual FY 2001, Appendix B: Response Actions (OSWER Publication 9200.3-14-1F-P).
Cleanup GoalsAchieved
This measure is used to indicate when cleanup goals have been achievedfor groundwater and surface water restoration, including monitorednatural attenuation. It is necessary to track achievement of cleanup goalsfor these remedies because the goals will not have been achieved at thetime that remedial action (RA) has been completed. Cleanup GoalsAchieved has been accomplished once the final RA report has beenapproved in writing.
Feasibility Study The primary objective of a feasibility study (FS) is to ensure thatappropriate remedial alternatives are developed and evaluated such thatan appropriate remedy may be selected. A FS involves the identificationand detailed evaluation of potential remedial alternatives. This processbegins with the formulation of viable alternatives, which involvesdefining remediation objectives/cleanup goals, general response actions,volumes or area of media to be addressed, and potentially applicabletechnologies. Following a preliminary screening of alternatives, areasonable number of appropriate alternatives undergo a detailed analysisusing the nine evaluation criteria in the National Contingency Plan(NCP). During a remedial investigation/feasibility study (RI/FS),information is gathered to support an informed decision regarding theremedy (if any) that is most appropriate for a given site or an operableunit within a site. Interim or early actions to initiate risk reductionactivities can be undertaken throughout the RI/FS process.
Long-TermResponse Action
Long-term response action (LTRA) is defined as the Fund-financedoperation of groundwater and surface water restoration measures,including monitored natural attenuation, for the first ten years ofrestoration. The Fund continues to pay up to 90 percent of the costsduring the LTRA period, then the State funds the entire operation after theten year period has expired. LTRA begins on the date that the designatedRegional official approves the interim RA report in writing. LTRA iscomplete after 10 years, after a technical impracticability determinationhas been made, or after cleanup goals have been achieved anddocumented in a final RA report, whichever occurs first. LTRAtransitions to O&M if cleanup goals have not been achieved, or ifcontinued monitoring will be required, once ten years have expired. Theterm LTRA does not apply to groundwater and surface water restorationmeasures conducted under other financing mechanisms, groundwater orsurface water containment measures, groundwater or surface watermeasures initiated for the primary purpose of providing a safe drinkingwater supply, or groundwater monitoring.

EP 1110-1-1930 Jun 01
A-2
Natural ResourceTrustees
Natural Resource Trustees are authorized by the ComprehensiveEnvironmental Response, Compensation, and Liability Act of 1980(CERCLA) to assist EPA in characterizing the nature and extent of site-related contamination and impacts. The Trustees also act on behalf of thepublic to determine whether environmental restoration is needed in lightof the response actions at a given site.
Operable Unit The NCP defines an operable unit (OU) as a “discrete action thatcomprises an incremental step toward comprehensively addressing siteproblems. This discrete portion of a remedial response managesmigration, or eliminates or mitigates a release, threat of a release, orpathway of exposure” (NCP §300.5). Hence, an OU can be a certaingeographic portion of a site or can address an environmental medium atthe site (e.g., groundwater, soil). OUs may also be comprehensive buttemporary remedies (e.g., temporary caps across a site) that provideinterim protection of human health and the environment before finalremediation. The cleanup of a site can be divided into a number of OUs,depending on the complexity of the problems associated with the site.
Operational andFunctional
For many sites, the completion of RA also marks the completion of theoperational and functional (O&F) period. O&F activities are conductedafter physical construction of the remedy is complete to ensure that it isfunctioning properly and operating as designed. The NCP provides amaximum timeframe of one year for performing O&F activities; however,EPA may extend the one-year period, as appropriate. O&F activities maybe conducted for containment, groundwater restoration, and surface waterrestoration remedies in order to ensure that the remedy functions properlyand operates as designed. Monitored natural attenuation remedies do notgo through an O&F determination. The O&F period is part of the RA andoccurs during the last year of the RA. Formal O&F determinations aremade primarily for Fund-financed projects, since O&F governs whenO&M or LTRA begins. O&F is considered complete on the date that thedesignated Regional official approves the interim RA report (for siteswith groundwater or surface water restoration remedies) or final RAreport in writing.
Operation andMaintenance
Operation and maintenance (O&M) are the activities required to maintainthe effectiveness or the integrity of the remedy. In the case of Fund-financed measures, O&M activities are required to restore groundwater orsurface waters, and to continue the operation of such measures beyond theLTRA period until the cleanup goals have been achieved. Except forFund-financed groundwater or surface water restoration actions coveredunder NCP §300.435(f)(4), O&M measures are initiated after the remedyhas achieved the remediation objectives and/or cleanup goals listed in theROD, and the remedy has been determined to be O&F. O&M typicallystarts on the date that the designated Regional official approves the final

EP 1110-1-1930 Jun 01
A-3
RA report. In the case of Fund-financed LTRA that continues for a fullten years without achieving the cleanup goals, O&M starts uponcompletion of LTRA. In the case of Federal facility-lead groundwaterand surface water restorations, including monitored natural attenuation,O&M starts on the date that the designated Regional official approves theinterim RA report in writing. O&M completion is defined, whereappropriate, as the date that the remediation objectives/cleanup goals orconditions specified has been met with respect to O&M. O&M may becompleted when the cleanup goals have been achieved, or it may beindefinite, as in the case of a landfill cap.
PotentiallyResponsible Party
Under CERCLA §104, a person or entity potentially responsible for arelease of hazardous substances, pollutants, or contaminants into theenvironment (i.e., a potentially responsible party [PRP]), may also beallowed to conduct certain response actions in accordance with CERCLA§122, if the lead agency determines that party is qualified and otherwisecapable. For a PRP-lead RI/FS response action, either EPA or the Stateserves as the lead agency and oversees the PRP’s work and developmentof the proposed plan and the ROD. The lead agency determines whetherthe PRP, or the PRP’s contractor, is qualified and capable of doing thework. PRPs may participate in the remedy selection process bysubmitting comments on the proposed plan or other information containedin the administrative record file during the formal public comment periodthat is held before the final remedy selection. However, PRPs generallyshould not be permitted to write proposed plans, RODs, or anyamendments to those.
PotentiallyResponsible PartyLong-TermResponse
Potentially responsible party long-term response (PRP LR) is a type ofO&M. In the past, the term LTRA has been used to describe PRP-leadgroundwater and surface water restoration measures, including monitorednatural attenuation. However, PRP-lead groundwater and surface waterrestoration measures, including monitored natural attenuation, are coveredby a separate action, PRP LR. Because PRP LR is a specific type ofO&M, the ten-year timeframe does not apply. LTRA begins on the datethat the designated Regional official approves the interim RA report inwriting. PRP LR is complete after a technical impracticabilitydetermination has been made, or cleanup goals have been achieved anddocumented in a final RA report, whichever occurs first. The term PRPLR does not apply to groundwater and surface water restoration measuresconducted under other leads, to groundwater or surface water containmentmeasures, groundwater or surface water measures initiated for the primarypurpose of providing a safe drinking water supply, or to groundwatermonitoring.
EP 1110-1-1930 Jun 01
A-4
Record of Decision The record of decision (ROD) documents the remedy selection and theRA plan for a site or an operable unit and serves the following three basicfunctions: it certifies that the remedy selection process was carried out inaccordance with CERCLA and with the NCP; it describes the technicalparameters of the remedy, specifying the methods selected to protecthuman health and the environment including treatment, engineering, andinstitutional control components, as well as remediationobjectives/cleanup goals; and, it provides the public with a consolidatedsummary of information about the site and the chosen remedy, includingthe rationale behind the selection. While the ROD should provide acomprehensive description of site conditions, the scope of the action, theselected remedy, remediation objectives/cleanup goals, and the reason forselecting the remedy, it is only one part of the administrative record file,which contains the full details of site characterization, alternativesevaluation, and remedy selection.
RegionalContingency Plan
Each EPA Region is responsible for developing regional contingencyplans “to coordinate timely, effective response by various Federalagencies and other organizations to discharges of oil or releases ofhazardous substances, pollutants, or contaminants” (40 CFR 300.210 (b)).Each plan includes information on facilities and resources within theRegion that may be useful in responses. To the extent possible, regionalcontingency plans must follow the format of the NCP and be coordinatedwith the appropriate state emergency response plans.
Remedial Action A remedial action (RA) is the implementation of the remedy selected inthe ROD. A RA is complete when the remediation objectives and/orcleanup goals stated in the ROD have been achieved, and the remedy hasbeen determined to be O&F.
Remedial Design Remedial design (RD) is an engineering phase during which additionaltechnical information and data identified are incorporated into technicaldrawings and specifications developed for the subsequent RA. Thesespecifications are based on the detailed description of the selected remedyand on the remediation/cleanup criteria provided in the ROD.
RemedialInvestigation
A remedial investigation (RI) involves collecting the data necessary toadequately characterize the site for the purpose of developing andevaluating effective remedial alternatives. In general, the RI consists ofthe following actions: determining the nature and extent of thecontamination at the site or operable unit; assessing risks to human healthand the environment from this contamination; and, conducting treatabilitytests to evaluate the potential performance and cost of the treatmenttechnologies being considered to address these risks. In characterizingthe site, the lead agency or PRP identifies the source of contamination,the potential routes of migration, and the current and the potential human
EP 1110-1-1930 Jun 01
A-5
and environmental receptors. During a RI/ FS, information is gathered tosupport an informed decision regarding the remedy (if any) that is mostappropriate for a given site or an operable unit within a site. Interim orearly actions to initiate risk reduction activities can be undertakenthroughout the RI/FS process.
Revised ModelCERCLA RD/RAConsent Decree
The Revised Model CERCLA RD/RA Consent Decree, published July1995, superseded the 1991 interim model. The Model Consent Decreeserves as a template for binding settlement agreements that serve asdeterminations of responsibility under CERCLA and the NCP.

EP 1110-1-1930 Jun 01
B-1
APPENDIX BEXAMPLE REMEDIAL ACTION REPORT –
EX SITU SOIL REMEDIATION
NOTE:
The following example remedial action report is based on an actual Superfund site, but someinformation has been altered to illustrate the concepts of the guide. In addition, names have beenchanged to avoid confusion with the actual site.
Content and format of actual RA reports may vary from this example due to considerations suchas project lead and support roles, availability of information, and site-specific conditions. Theinformation presented in this example report (e.g., costs) should not necessarily be used as atechnical basis for completing remedial action at an actual site (e.g., as a source of costinformation).

F I N A LR E M E D I A L A C T I O N R E P O R T
SLIPPERY CHEMICAL SUPERFUNDSITE, OPERABLE UNIT 3GREASE, TEXAS
September 2000

TABLE OF CONTENTS
Slippery Chemical OU 3 Final RA Report i
Abstract............................................................................................................................................iii
Section 1 Introduction............................................................................................................ 1-1
Site Description.................................................................................................... 1-1Geology and Stratigraphy..................................................................................... 1-1Relevant Operations and Waste Management Practices...................................... 1-1Regulatory History............................................................................................... 1-2Nature and Extent of contamination..................................................................... 1-2
Section 2 Operable Unit Background ..................................................................................... 2-1
Remedy Selection................................................................................................. 2-1Cleanup Goals/Standards ..................................................................................... 2-1
Section 3 Construction Activities........................................................................................... 3-1
Construction and Implementation of the Treatment Remedy.............................. 3-1
Section 4 Chronology of Major Events for the Operable Unit.................................................. 4-1
Section 5 Performance Standards and Construction Quality Control ..................................... 5-1
Performance Standards......................................................................................... 5-1Quality Assurance and Quality Control............................................................... 5-2
Data Assessment ...................................................................................... 5-2Data Quality............................................................................................. 5-3
Section 6 Final Inspections and Certifications ....................................................................... 6-1
Inspections............................................................................................................ 6-1Certifications ........................................................................................................ 6-1Health and Safety................................................................................................. 6-1
Section 7 Operations and Maintenance Activities................................................................... 7-1
Section 8 Summary of Project Costs...................................................................................... 8-1
Procurement Process............................................................................................ 8-1Treatment System Cost ........................................................................................ 8-1
Section 9 Observations and Lessons Learned....................................................................... 9-1
Cost-Related......................................................................................................... 9-1Performance-Related............................................................................................ 9-1Other Lessons Learned......................................................................................... 9-2

TABLE OF CONTENTS
Slippery Chemical OU 3 Final RA Report ii
Section 10 Operable Unit Contacts ........................................................................................ 10-1
Section 11 References........................................................................................................... 11-1
Appendix A – Cost and Performance Factors.................................................................................A-1Appendix B – Project Costs............................................................................................................B-1
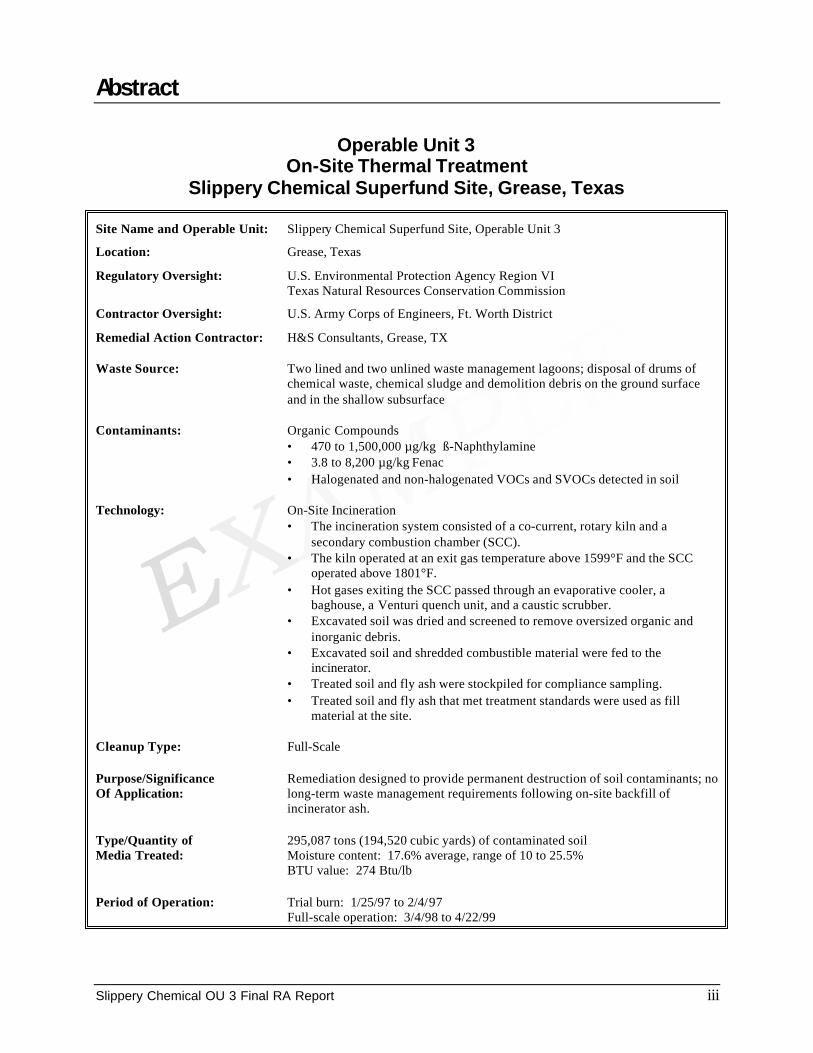
Abstract
Slippery Chemical OU 3 Final RA Report iii
Operable Unit 3On-Site Thermal Treatment
Slippery Chemical Superfund Site, Grease, Texas
Site Name and Operable Unit: Slippery Chemical Superfund Site, Operable Unit 3
Location: Grease, Texas
Regulatory Oversight: U.S. Environmental Protection Agency Region VITexas Natural Resources Conservation Commission
Contractor Oversight: U.S. Army Corps of Engineers, Ft. Worth District
Remedial Action Contractor: H&S Consultants, Grease, TX
Waste Source: Two lined and two unlined waste management lagoons; disposal of drums ofchemical waste, chemical sludge and demolition debris on the ground surfaceand in the shallow subsurface
Contaminants: Organic Compounds• 470 to 1,500,000 µg/kg ß-Naphthylamine• 3.8 to 8,200 µg/kg Fenac• Halogenated and non-halogenated VOCs and SVOCs detected in soil
Technology: On-Site Incineration• The incineration system consisted of a co-current, rotary kiln and a
secondary combustion chamber (SCC).• The kiln operated at an exit gas temperature above 1599°F and the SCC
operated above 1801°F.• Hot gases exiting the SCC passed through an evaporative cooler, a
baghouse, a Venturi quench unit, and a caustic scrubber.• Excavated soil was dried and screened to remove oversized organic and
inorganic debris.• Excavated soil and shredded combustible material were fed to the
incinerator.• Treated soil and fly ash were stockpiled for compliance sampling.• Treated soil and fly ash that met treatment standards were used as fill
material at the site.
Cleanup Type: Full-Scale
Purpose/Significance Remediation designed to provide permanent destruction of soil contaminants; noOf Application: long-term waste management requirements following on-site backfill of
incinerator ash.
Type/Quantity of 295,087 tons (194,520 cubic yards) of contaminated soilMedia Treated: Moisture content: 17.6% average, range of 10 to 25.5%
BTU value: 274 Btu/lb
Period of Operation: Trial burn: 1/25/97 to 2/4/97Full-scale operation: 3/4/98 to 4/22/99
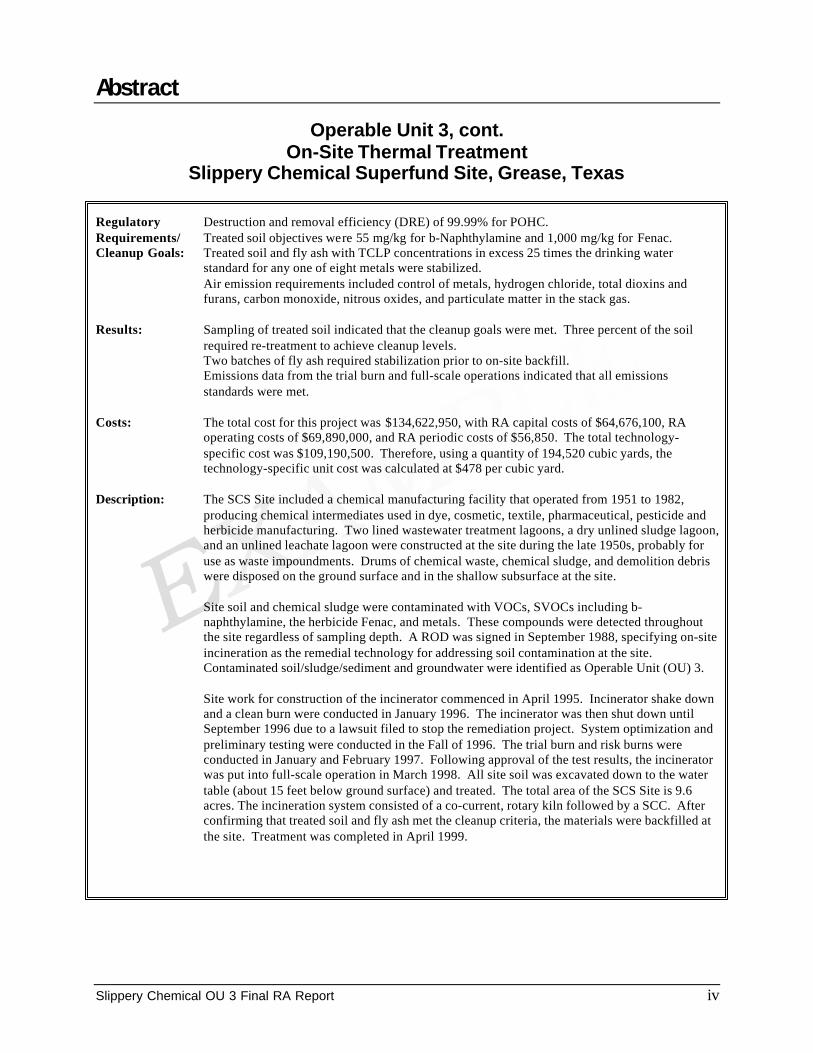
Abstract
Slippery Chemical OU 3 Final RA Report iv
Operable Unit 3, cont.On-Site Thermal Treatment
Slippery Chemical Superfund Site, Grease, Texas
Regulatory Destruction and removal efficiency (DRE) of 99.99% for POHC.Requirements/ Treated soil objectives were 55 mg/kg for b-Naphthylamine and 1,000 mg/kg for Fenac.Cleanup Goals: Treated soil and fly ash with TCLP concentrations in excess 25 times the drinking water
standard for any one of eight metals were stabilized.Air emission requirements included control of metals, hydrogen chloride, total dioxins andfurans, carbon monoxide, nitrous oxides, and particulate matter in the stack gas.
Results: Sampling of treated soil indicated that the cleanup goals were met. Three percent of the soilrequired re-treatment to achieve cleanup levels.Two batches of fly ash required stabilization prior to on-site backfill.Emissions data from the trial burn and full-scale operations indicated that all emissionsstandards were met.
Costs: The total cost for this project was $134,622,950, with RA capital costs of $64,676,100, RAoperating costs of $69,890,000, and RA periodic costs of $56,850. The total technology-specific cost was $109,190,500. Therefore, using a quantity of 194,520 cubic yards, thetechnology-specific unit cost was calculated at $478 per cubic yard.
Description: The SCS Site included a chemical manufacturing facility that operated from 1951 to 1982,producing chemical intermediates used in dye, cosmetic, textile, pharmaceutical, pesticide andherbicide manufacturing. Two lined wastewater treatment lagoons, a dry unlined sludge lagoon,and an unlined leachate lagoon were constructed at the site during the late 1950s, probably foruse as waste impoundments. Drums of chemical waste, chemical sludge, and demolition debriswere disposed on the ground surface and in the shallow subsurface at the site.
Site soil and chemical sludge were contaminated with VOCs, SVOCs including b-naphthylamine, the herbicide Fenac, and metals. These compounds were detected throughoutthe site regardless of sampling depth. A ROD was signed in September 1988, specifying on-siteincineration as the remedial technology for addressing soil contamination at the site.Contaminated soil/sludge/sediment and groundwater were identified as Operable Unit (OU) 3.
Site work for construction of the incinerator commenced in April 1995. Incinerator shake downand a clean burn were conducted in January 1996. The incinerator was then shut down untilSeptember 1996 due to a lawsuit filed to stop the remediation project. System optimization andpreliminary testing were conducted in the Fall of 1996. The trial burn and risk burns wereconducted in January and February 1997. Following approval of the test results, the incineratorwas put into full-scale operation in March 1998. All site soil was excavated down to the watertable (about 15 feet below ground surface) and treated. The total area of the SCS Site is 9.6acres. The incineration system consisted of a co-current, rotary kiln followed by a SCC. Afterconfirming that treated soil and fly ash met the cleanup criteria, the materials were backfilled atthe site. Treatment was completed in April 1999.
SECTIONONE Introduction
Slippery Chemical OU 3 Final RA Report 1-1
SITE DESCRIPTION
The Slippery Chemical Superfund (SCS) Site is located in Slick County, Texas, in the city ofGrease. The site was a chemical manufacturing facility that operated from 1951 to 1982. Duringits operation, the Slippery Chemical Company produced chemical intermediates used in dye,cosmetic, textile, pharmaceutical, pesticide and herbicide manufacturing. The total area of thesite is 9.6 acres and includes the previous location of the Slippery Chemical Company and theadjacent Oily Chemical Company property. Figure 1 shows the general layout of the site.
The Slippery Chemical plant included several major buildings, two lined wastewater treatmentlagoons, a dry unlined sludge lagoon, and an unlined leachate lagoon. The lagoons wereconstructed during the late 1950s, probably for use as waste impoundments. The leachate lagoonwas constructed in the lowest portion of the site, and is assumed to be the collection point for allsurface runoff at the site. Approximately 60 process tanks and reactors were located inside andsurrounding the process buildings. Approximately 10 additional larger tanks were staged outsideof the buildings for bulk storage of acids, bases, and fuel oils.
The area surrounding the site includes the Oily Chemical Company to the west, Rough PaperCompany to the southwest, Wet Creek to the south, the west branch of the Roaring River to thenorth, and an apartment complex and shopping center to the east.
GEOLOGY AND STRATIGRAPHY
The general lithology of the upper 15 feet of overburden material at the SCS Site consists ofsandy clay floodplain deposits with various lenses of clay dispersed throughout. Belowapproximately 15 feet, the alluvial sediments increase in grain size with increasing depth to sandand gravel and then to sand with gravel and cobble-sized sandstone fragments. The bedrock is asoft gray to shaley claystone and medium hard limestone ranging from less than 1 foot to 31 feetin thickness, and occurs at approximately 110 feet bgs.
Groundwater at the SCS Site flows to the north, east and south. Local groundwater flows to thesouth and southeast toward Wet Creek. Groundwater is typically encountered at 12 to 15 feetbgs.
RELEVANT OPERATIONS AND WASTE MANAGEMENT PRACTICES
From the late 1950s through the early 1980s, four waste management lagoons (wasteimpoundments) were operated at the SCS Site. The two wastewater lagoons were lined, but thesludge lagoon and leachate lagoon were unlined. Additionally, drums of chemical waste,chemical sludge, and demolition debris were disposed on the ground surface and in the shallowsubsurface at the site.
SECTIONONE Introduction
Slippery Chemical OU 3 Final RA Report 1-2
REGULATORY HISTORY
Slippery Chemical was cited many times by state and federal agencies for violatingenvironmental and health and safety regulations. In 1982, after Slippery Chemical failed torespond to the U.S. Environmental Protection Agency’s (USEPA’s) request to clean up the site,the USEPA initiated an emergency removal action during which drums, surface sludges, andstorage tanks were removed. During this removal action, USEPA removed 1,700 exposed drumsand drained and neutralized approximately 10 large tanks used for bulk storage of acids, bases,and fuel oil. Access to the site was controlled using an 8-foot fence, and warning signs wereposted.
A Superfund remedial investigation and feasibility study (RI/FS) was initiated in 1983. The firsttwo phases of the RI/FS led to interim remedial actions, specifically: Operable Unit (OU) -1 –the remediation of a leachate stream that was discharging to an off-site area; and OU-2 – theremoval of the two lined wastewater treatment lagoons and the on-site structures. Phase I wascompleted in 1987. Phase II was completed in 1988.
The September 1988 Record of Decision (ROD) addressed both soil/sludge/sedimentcontamination and groundwater contamination at the SCS site; however, OU-3, the subject ofthis report, only addresses soil/sludge/sediment.
The Phase III RI/FS was initiated in January 1987. During Phase III field investigations,samples of soil, groundwater, surface water and sediment were collected. Forty-one test pitswere excavated to characterize contaminated soil and sludge at the site. Each test pit wasexcavated to the water table or to a depth of 15 feet below ground surface (bgs), whichever wasmore shallow.
NATURE AND EXTENT OF CONTAMINATION
During the Phase III RI/FS, soil, groundwater, surface water, and sediment contamination wasobserved throughout the site. OU-3 addressed all of these contaminated media. The degree ofcontamination varied throughout the study area. In general, the frequency of occurrence andconcentrations of contaminants were greatest on the Slippery Chemical property andimmediately off-site, particularly on the Oily Chemical property, which is located immediatelynorth of the Slippery Chemical property. Based on local groundwater patterns, the OilyChemical property is considered to be down gradient of the Slippery Chemical Property.
Chemical sludge and contaminated soil were observed in all of the open area on the SCS Site.The soil and sludge were contaminated with volatile organic compounds (VOCs), semivolatileorganic compounds (SVOCs), Fenac, β-naphthylamine, and metals. Organic contaminants (i.e.,Fenac) were consistently observed in samples collected throughout the site. Field screeningrevealed that the vadose zone at the site was contaminated to varying concentrations withchlorinated solvents and benzene, toluene, ethylbenzene, and xylenes (BTEX). Substitutedchlorinated phenols and alkyl phenols were also present. These compounds occurred throughoutthe site regardless of sampling depth; therefore, no one particular area of the Slippery Chemicalproperty or the adjacent Oily Chemical property could have been considered the most likely
SECTIONONE Introduction
Slippery Chemical OU 3 Final RA Report 1-3
source of contamination. Metals were also detected in soil samples; however, it is not clearwhether activities at the Slippery Chemical plant were the source of metals contamination.
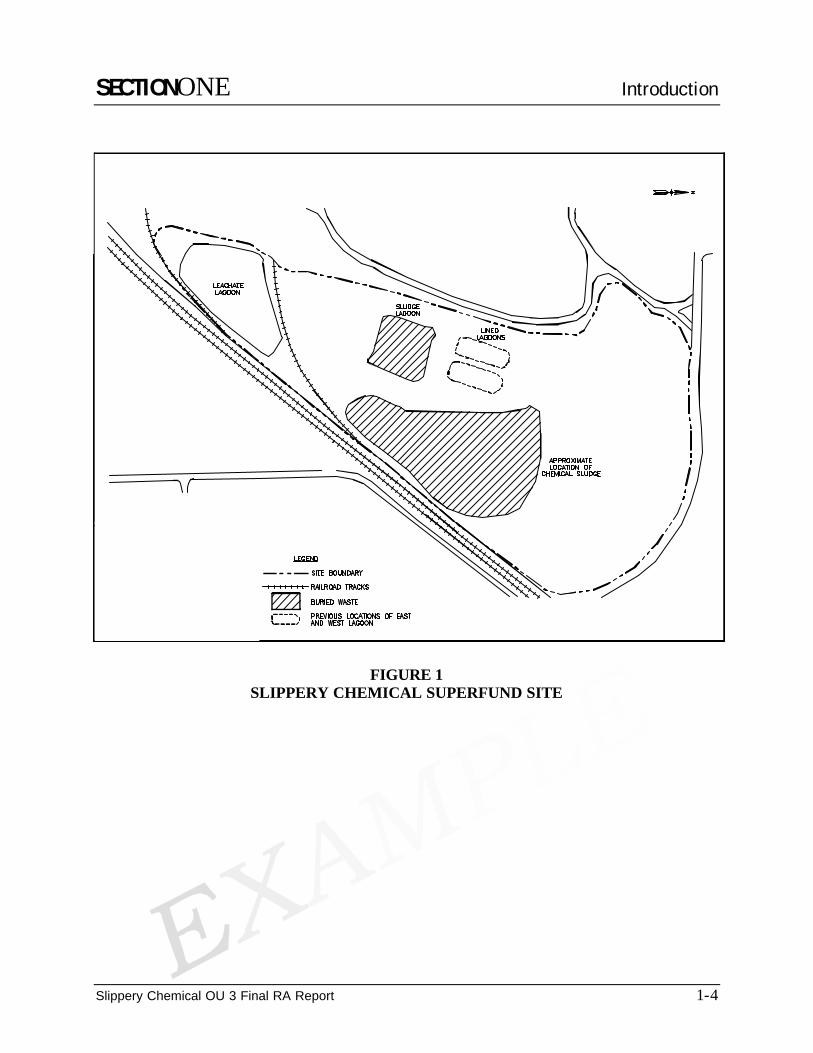
SECTIONONE Introduction
Slippery Chemical OU 3 Final RA Report 1-4
FIGURE 1SLIPPERY CHEMICAL SUPERFUND SITE
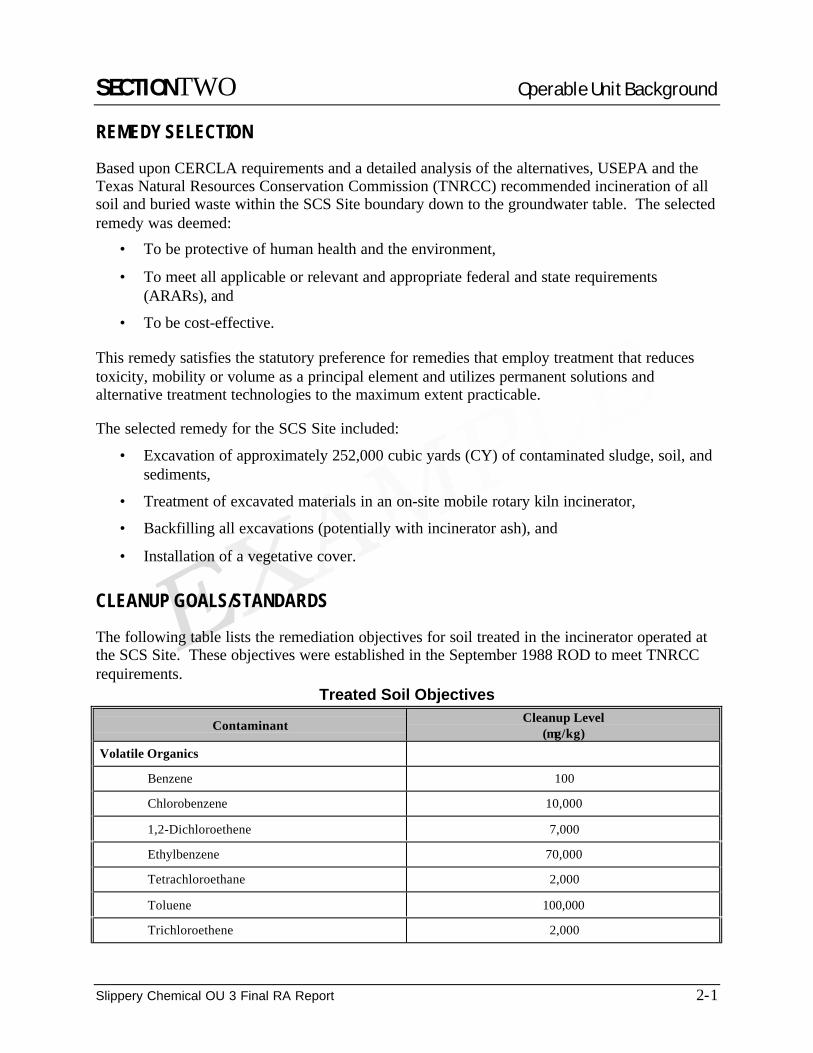
SECTIONTWO Operable Unit Background
Slippery Chemical OU 3 Final RA Report 2-1
REMEDY SELECTION
Based upon CERCLA requirements and a detailed analysis of the alternatives, USEPA and theTexas Natural Resources Conservation Commission (TNRCC) recommended incineration of allsoil and buried waste within the SCS Site boundary down to the groundwater table. The selectedremedy was deemed:
• To be protective of human health and the environment,
• To meet all applicable or relevant and appropriate federal and state requirements(ARARs), and
• To be cost-effective.
This remedy satisfies the statutory preference for remedies that employ treatment that reducestoxicity, mobility or volume as a principal element and utilizes permanent solutions andalternative treatment technologies to the maximum extent practicable.
The selected remedy for the SCS Site included:
• Excavation of approximately 252,000 cubic yards (CY) of contaminated sludge, soil, andsediments,
• Treatment of excavated materials in an on-site mobile rotary kiln incinerator,
• Backfilling all excavations (potentially with incinerator ash), and
• Installation of a vegetative cover.
CLEANUP GOALS/STANDARDS
The following table lists the remediation objectives for soil treated in the incinerator operated atthe SCS Site. These objectives were established in the September 1988 ROD to meet TNRCCrequirements.
Treated Soil Objectives
Contaminant Cleanup Level(µg/kg)
Volatile Organics
Benzene 100
Chlorobenzene 10,000
1,2-Dichloroethene 7,000
Ethylbenzene 70,000
Tetrachloroethane 2,000
Toluene 100,000
Trichloroethene 2,000
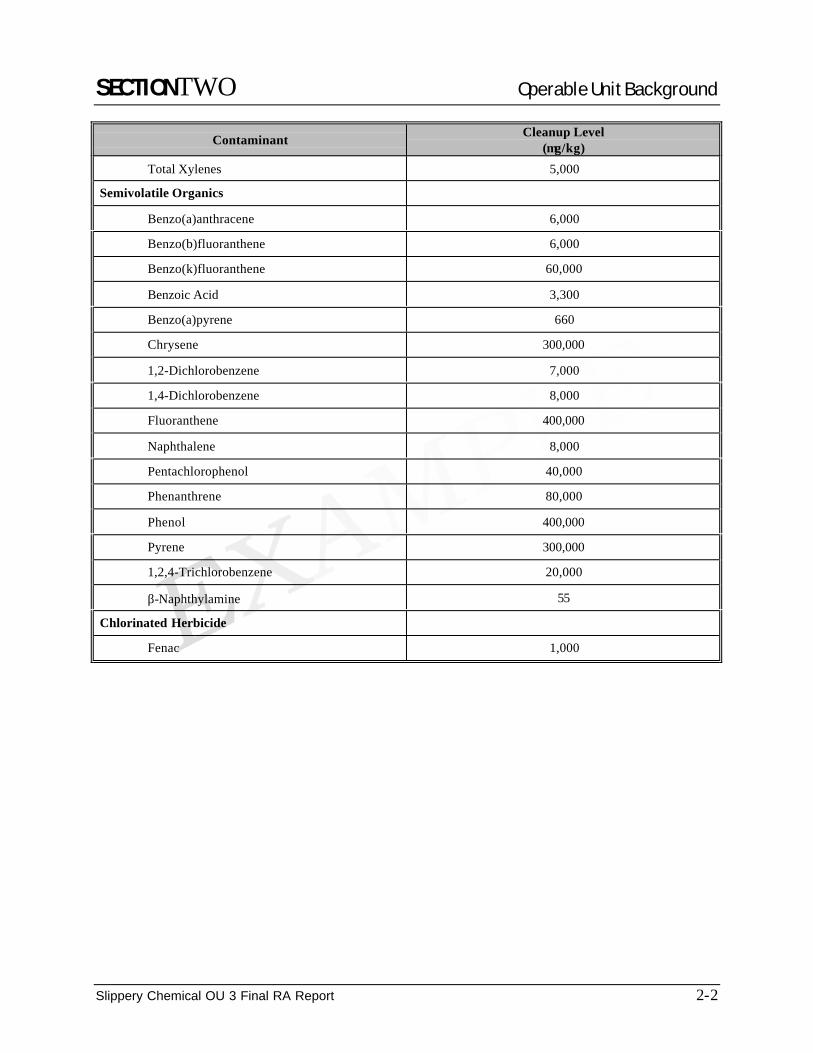
SECTIONTWO Operable Unit Background
Slippery Chemical OU 3 Final RA Report 2-2
Contaminant Cleanup Level(µg/kg)
Total Xylenes 5,000
Semivolatile Organics
Benzo(a)anthracene 6,000
Benzo(b)fluoranthene 6,000
Benzo(k)fluoranthene 60,000
Benzoic Acid 3,300
Benzo(a)pyrene 660
Chrysene 300,000
1,2-Dichlorobenzene 7,000
1,4-Dichlorobenzene 8,000
Fluoranthene 400,000
Naphthalene 8,000
Pentachlorophenol 40,000
Phenanthrene 80,000
Phenol 400,000
Pyrene 300,000
1,2,4-Trichlorobenzene 20,000
β-Naphthylamine 55
Chlorinated Herbicide
Fenac 1,000
SECTIONTHREE Construction Activities
Slippery Chemical OU 3 Final RA Report 3-1
CONSTRUCTION AND IMPLEMENTATION OF THE TREATMENT REMEDY
A background air monitoring study was performed prior to on-site construction activities. Thestudy was conducted from October 10 through December 5, 1994. The perimeter air monitoringprogram was initiated in March 1995, and excavation began in April 1995. In order to supportthe vertical excavation at the site boundaries, a sheet pile excavation support system wasinstalled to allow “straight cut” excavations. Soil excavation was the first step in incineratorconstruction, and the unit was sited on imported clean fill placed after the initial excavation.Construction of the incineration system was completed in December 1995. System shakedownand a clean burn were conducted on January 13, 1996. The incinerator was then shut down untilSeptember 23, 1996 due to a lawsuit that was filed by a local opposition group against theUSEPA to stop the remediation project. Approval to continue the project was issued on August14, 1996.
A mobile, on-site incineration system was used to decontaminate soil, sludge, and sediment atthe SCS Site. The incineration system consisted of a rotary kiln, a secondary combustionchamber (SCC), and an air pollution control system (APCS). Rotary kiln incinerators are able toprocess a wide variety of waste feed compositions and handle oversized wastes with minimalprocessing pre-treatment. The rotary kiln portion of the system is used to volatilize and destroythe majority of the organic contaminants. The remaining organic contaminants exit the kiln withthe hot gases into the SCC where additional destruction occurs. The APCS is used to provideparticulate matter and acid gas control. Figure 2 shows a schematic of the on-site incinerationsystem.
Site characteristics, operating limits, and operating parameters of the incineration system arepresented in Appendix A. The system was operated using the following steps:
• Contaminated soil was excavated down to the water table over the entire site and was driedby adding cement kiln dust or lime. Soil was then transported to the debris separationbuilding. Material greater than 4 inches in diameter was removed from the soil by rotatingbarrel screens and underwent manual segregation into organic and inorganic debris. Organicdebris (e.g., wood) was shredded. Inorganic debris was either landfilled (e.g., plastic),recycled (e.g., steel) or cleaned for backfill (e.g., rocks). Material less than 4 inches indiameter was stockpiled in the feed preparation building after ferrous material waselectromagnetically removed.
• Soil was blended with shredded brush, roots, trees, and other combustible material. The soilwas fed onto a variable-speed, apron conveyor, a weigh belt conveyor, and into the kiln feedhopper. Feed material was delivered from the hopper to the kiln via dual, water-cooled, feedscrews. The feed material was sampled and analyzed for metals, SVOCs (including β-naphthylamine), VOCs, Fenac, and physical/chemical parameters (e.g., BTU, moisture, ash,and chlorine).
• The rotary kiln was 60 feet long and had an inside diameter of 11 feet. The kiln was operatedconcurrently with the waste feed located at the same end as the oxygen-natural gas burners.
SECTIONTHREE Construction Activities
Slippery Chemical OU 3 Final RA Report 3-2
Contaminated soil traveled through the kiln via gravity. The kiln was operated at a minimumexit gas temperature of 1599°F.
• The kiln discharge chamber was sized to reduce the flue gas velocity and remove largeparticulate matter in the exit gas stream. The hot gas cyclone subsequently removedadditional particulate matter in the flue gas prior to entering the SCC. The SCC was operatedat a minimum temperature of 1801°F and a minimum gas retention time of 2 seconds.
• Exhaust gases from the SCC were cooled to 400°F using air-atomized, water spray nozzles inan evaporative cooler. The cooled flue gases then passed through a baghouse for removal ofparticulate matter. The baghouse was designed with a 3-to-1 air-to-cloth ratio.
• The baghouse gas discharged to an induced draft (ID) fan, which drew gases through theentire system and discharged them through the wet scrubber system to the discharge stack.The fan produced negative pressure throughout the incineration system to eliminate fugitiveemissions.
• Exhaust gases from the baghouse were cooled from approximately 350°F to 185°F withwater sprays in the Venturi quench unit. A mildly caustic scrubber water solution neutralizeddissolved acid gases in one of two countercurrent, packed-bed absorbers, which wereoperated in parallel. The pH of the scrubber water was maintained between 6.5 and 9 byaddition of a sodium hydroxide solution. The cleaned gas passed through a high-efficiency,multi-pass mist eliminator for removal of entrained water droplets.
• Cleaned flue gas was exhausted through a 150-foot tall stack equipped with continuousemission monitors (CEMs) that analyzed the gas for oxygen (O2), carbon monoxide (CO),carbon dioxide (CO2), total hydrocarbons (THC), and nitrogen oxides (NOx).
• Bottom ash and fly ash were segregated prior to disposal. Bottom ash consisted of treatedsoil from the kiln and ash collected by the cyclone and SCC. Fly ash consisted of ash fromthe evaporative cooler and baghouse. Each ash stream was cooled and wetted by sprayingwith excess scrubber system water, after which it was conveyed to the ash storage area. A10,000 cubic feet per minute (cfm) scrubber and Lamella clarifier system captured steamissuing from the wet ash drag conveyor to prevent off-site migration of particulate matter.
• Fly was were tested for TCLP metals as each storage bin was filled. Each day’s production ofbottom ash was separated for testing of TCLP metals, Fenac, SVOCs (includingb-naphthylamine), and VOCs. Ash failing the cleanup criteria was retreated. Ash meetingthe cleanup criteria was backfilled on-site. Ash with TCLP concentrations greater than 25times any of the drinking water standards was stabilized prior to backfill.
In addition to the incineration system, a 100-gallon per minute (gpm) wastewater treatment plant(WWTP) was installed and operated at the site to remove metals and organic compounds fromvarious water streams generated during the project. Treated wastewater was discharged to WetCreek. Wastewater treated at the WWTP included: incineration system pad cleaning water; ashhandling pad cleaning water; wash water from equipment and personnel decontamination

SECTIONTHREE Construction Activities
Slippery Chemical OU 3 Final RA Report 3-3
activities; water collected from the leachate lagoon; water collected from the soil excavationcavities; and potentially-contaminated storm water. The WWTP included the followingtreatment technologies:
• Primary settling;
• Wastewater equalization tanks;
• Metals removal through chemical addition, flocculation, and clarification;
• Neutralization;
• Sand filtration for suspended solids removal;
• Air stripping with activated carbon columns for treating organics transferred to the airstream;
• Bag filtration for removal of small-diameter suspended solids;
• Activated carbon adsorption for removal of residual organics; and
• Sludge dewatering with a filter press.
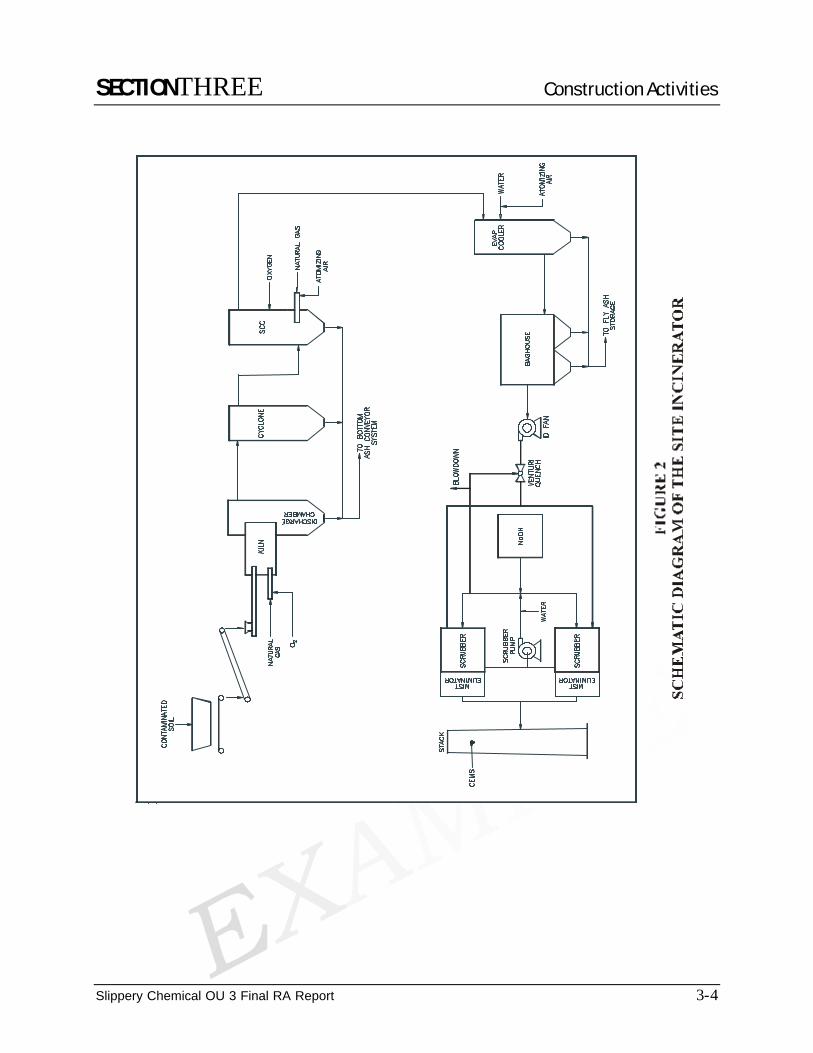
SECTIONTHREE Construction Activities
Slippery Chemical OU 3 Final RA Report 3-4

SECTIONFOUR Chronology of Major Events for the Operable Unit
Slippery Chemical OU 3 Final RA Report 4-1
The following table includes the dates of the most significant events in the operation of theincinerator system and WWTP at the SCS site.
Date Activity
September 29, 1988 Phase III ROD signed by the U.S. EPA and the Army
Spring 1989 Phase II remediation completed
October 1990 – August 1991 Incineration feasibility study conducted
September 30, 1993 Contract awarded
November 15, 1993 Notice to proceed issued
November 14, 1994 Mobilization to the site
May 13, 1995 WWTP put into operation
January 3, 1996 Construction of incinerator and supporting facilities complete
January 13, 1996 Shakedown and clean burn complete
January 14, 1996 – August 14, 1996 Stop work in effect due to lawsuit
September 19, 1996 Public meeting held on the revised trial burn risk assessment protocol
January 20 – 22, 1997 Risk Burn No. 1 conducted
January 25 – February 4, 1997 Trial Burn conducted
February 7 – 9, 1997 Risk Burn No. 2 conducted
February 10, 1997 – March 4, 1998 Project shutdown for risk and trial burn data review
February 10, 1998 Public meeting held on the risk assessment
March 9, 1998 Full-scale operations started
April 22, 1999 Soil incineration completed
November 23, 1999 Project completion

SECTIONFIVE Performance Standards and Construction Quality Control
Slippery Chemical OU 3 Final RA Report 5-1
PERFORMANCE STANDARDS
The following table provides the performance objectives that were established for the SCS Siteincinerator in the September 1988 ROD:
Incinerator Performance ObjectivesParameter Performance Criteria
Principal Organic Hazardous Constituent(POHC) destruction removal efficiency (DRE) ≥ 99.99%
Particulate Matter (PM) Emissions ≤0.01 grains/dry standard cubic foot (gr/dscf) @ 7% O2
Hydrochloric Acid (HCl) Emissions ≤4 lb/hr or 99% reduction
Total Dioxins and Furans Emissions ≤30 nanograms/dry standard cubic meter (ng/dscm) @ 7% O2
NOx Emissions ≤300 parts per million – volume (ppmv) @ 7% O2 (dailyaverage)
CO Emissions ≤100 ppmv @ 7% O2 (hourly rolling average)Metal Emissions
AsBeCdCr+6
CrPb
<0.11 g/sec<0.20 g/sec<0.27 g/sec<0.04 g/sec<0.12 g/sec<1,384 g/sec
Fly ash and bottom ash were analyzed for metals using the toxicity characteristic leachingprocedure (TCLP). The results were compared to the Texas drinking water standards listed inthe table below. Ash meeting these standards could be backfilled on-site without restriction.Ash failing these standards, but with TCLP concentrations less than 25 times the drinking waterstandards, could be returned to the site as fill material but could not be placed below 553 feetmean sea level (8 feet above the average water table). As specified in the 1988 ROD, treated soilwith TCLP concentrations greater than 25 times the drinking water standard requiredstabilization prior to backfill.
Ash TCLP Concentration Objectives
Metal Drinking Water Standard(mg/L)
25 x Standard(mg/L)
Arsenic 0.05 1.25
Barium 1.0 25
Cadmium 0.01 0.25
Chromium 0.05 1.25
Lead 0.05 1.25
Mercury 0.002 0.05
Selenium 0.01 0.25
Silver 0.05 1.25

SECTIONFIVE Performance Standards and Construction Quality Control
Slippery Chemical OU 3 Final RA Report 5-2
As discussed previously, perimeter air monitoring was routinely performed at the site. ThreeVOCs were selected as key indicator compounds to be monitored by the HNu if the averageNMOC reading exceeded 1 parts per million (ppm). Perimeter action levels were set at 10% ofthe OSHA permissible exposure limits (PELs) for each of the three selected contaminants. Theperimeter action levels were:
• 9.146 ppm for toluene
• 7.777 ppm for chlorobenzene
• 2.511 ppm for tetrachloroethene
The table below provides the discharge limitations for the WWTP at the SCS Site as specified inthe September 1988 ROD. Weekly samples of the WWTP effluent were required whenever theWWTP was in operation.
Wastewater Discharge LimitationsParameter Monthly Average (mg/L) Daily Maximum (mg/L)
β-Naphthylamine 0.012 0.024
Fenac 0.100 0.200
Toluene 0.010 0.020
Chlorobenzene 0.010 0.020
1,2-Dichlorobenzene 0.010 0.020
1,4-Dichlorobenzene 0.010 0.020
1,2-Dichloroethane 0.010 0.020
Trichloroethene 0.005 0.010
Total Arsenic 0.100 0.200
Total Barium 2.000 4.000
Total Cadmium 0.060 0.120
Total Nickel 0.200 0.400
Total Chromium 0.150 0.300
Total Lead 1.000 2.000
pH 6 to 9 standard units 6 to 9 standard units
QUALITY ASSURANCE AND QUALITY CONTROL
Data Assessment
An incineration feasibility study was conducted between October 1990 and August 1991. All testruns met the cleanup criteria established for the SCS Site. The pilot-scale rotary kiln incineratorachieved 99.99% destruction removal efficiency (DRE) of Principal Organic HazardousConstituents (POHCs), which were spiked into the soil. The leachable metal concentrations in
SECTIONFIVE Performance Standards and Construction Quality Control
Slippery Chemical OU 3 Final RA Report 5-3
the ash from the pilot study were either non-detect or were below TCLP limits for characteristichazardous waste, so no fixation or stabilization was required prior to backfilling incinerator ashon site. Some fly ash had TCLP metal concentrations above the drinking water standards.
A risk assessment concluded that full-scale operation of the incinerator at the SCS Site would notpose a threat to public health. All of the estimated risks were within the range that is consideredacceptable for cleanup activities performed under the Superfund hazardous waste program.
The results from the trial burn demonstrated that the incinerator met the RCRA performancestandards of 40 CFR 264 and other regulatory and contractual requirements while burning sitesoils spiked with POHCs and metals.
During full-scale operations, all treated soil batches met the cleanup criteria for Fenac after thefirst pass; eight treated soil batches did not initially meet the cleanup goal for β-naphthylamine.Of the total mass of soil treated, less than 3% required additional thermal treatment after the firstpass. Soil not meeting the cleanup criteria was sent back to the feed preparation building where itwas blended with the other soil, and then conveyed to the incinerator.
TCLP metals results for 2 batches of fly ash were greater than 25 times the drinking waterstandard (once during a metals spiking test and the other time during full-scale operation). Thefly ash from these batches was stabilized prior to backfill.
Stack testing, perimeter air monitoring and ambient air monitoring performed in the communitynear the project site met all specified objectives.
Data Quality
All trial burn testing was conducted in accordance with the source test sampling and analysisprotocols specified in the quality assurance plan for the trial burn. All data gathered during thetrial burn were found to be of acceptable quality to demonstrate that the incinerator met theperformance standards. The quality assurance/quality control (QA/QC) results were compared tothe data quality objectives specified in the Project Quality Assurance Plan contained in the TrialBurn Plan. This comparison showed that greater than 90% of the accuracy, precision, andmethod performance objectives were met.
The perimeter air sampling and off-site ambient air sampling were conducted in accordance withthe SCS Site Perimeter Air Sampling Plan, including the calibration, sampling and analyticalprocedures. Other sampling and analysis activities during full-scale operations (e.g., soil and ashtests) were conducted according to the protocols in the Chemical Quality Management SamplingPlan.
SECTIONSIX Final Inspections and Certifications
Slippery Chemical OU 3 Final RA Report 6-1
INSPECTIONS
The project utilized the U.S. Army Corps of Engineers (USACE) Three Phase InspectionProgram which included the Preparatory Inspection – prior to the start of work, Initial Inspection– as soon as representative portion of the work was complete, and Follow Up Inspection – dailyuntil the work is complete. Prior to site mobilization a list of the Definable Features of Workwas generated. The Definable Features of Work list was a guideline for initiating the ThreePhase Inspection Program on individual work tasks. The Definable Features of Work list wasupdated monthly and forwarded to the USACE for information only.
CERTIFICATIONS
As part of the submittal process data, drawings, instructions, schedules, statements, reports,certificates, samples, and records were transmitted to the USACE for either review and action orfor information only. Each individual submittal was given a unique transmittal number.Submittals were forwarded to the USACE on Government Form SF4025 and to other reviewerssuch as the USACE Architectural Engineer, USEPA, and TNRCC on Government FormSF4026. Submittals were tracked in the Complete Submittal Register that was updated on amonthly basis. A copy of all submittals was kept on file at the project site.
The Quality Control Department was responsible for generating a Daily Contractors QualityControl Report (DCQCR). Starting with mobilization, through the contract completion date, aDCQCR was generated and issued for each contract day. The report included the followinginformation: date, report number corresponding to the number of contract days, general weatherinformation, work performed by H&S Consultants, attachment reports, work performed bysubcontractors, inspections performed, testing performed, verbal instructions received fromGovernment personnel, verbal instructions received from Government personnel on constructiondeficiencies, safety violations observed, remarks, and worker hours and equipment use. Twocopies of the report (one with the original H&S Consultants QC signature) were forwarded to theUSACE QA Field Office.
Data Quality Objectives (DQOs) were established prior to the start of the project and wereupdated throughout the project. Individual programs such as the Perimeter Air SamplingProgram and the Chemical Quality Management/Sampling Program defined DQOs. Objectivesincluded precision, accuracy, representativeness, comparability, and completeness. In 1997, aprocess to consolidate the DQOs was performed. The result was a document that defined DQOsfor all chemical data generated on the project. The DQOs were summarized using a seven stepprocess outlined in EPA’s “Guidance for the Data Quality Objectives Process” (1994).
HEALTH AND SAFETY
A Permea-Tec pad was used to verify that beta-napthylamine (BNA) had not permeated glovesand protective clothing during usage. To use this method as a field verification of chemicalprotective gloves, a worker wore a pad on the back of the hand over the top of the inner gloveand beneath the outer glove for approximately two hours. After wear, the outer glove was
SECTIONSIX Final Inspections and Certifications
Slippery Chemical OU 3 Final RA Report 6-2
removed and the Permea-Tec pad was retrieved. The analysis of the pad was activated with tapwater. A positive indication of breakthrough of 2-naphthlylamine (2-NA) through the personalprotective equipment (PPE) would result in a predominately red color change of the pad. Duringthe course of the project, no positive results were found with the 780 separate pad tests collected.
A Surface Swype pad was also used to determine surface contamination of aromatic aminecompounds. A monthly wipe sampling program using these pads was implemented to confirmthat support areas were not becoming contaminated during site activities. During the course ofthe project, no positive results were found from the 627 Surface Swype samples collected intrailers and support facilities.
Surface Swype pads were also used to confirm that equipment, which had entered the exclusionzone, was decontaminated of aromatic amines prior to release from the exclusion zone. Duringthe equipment decontamination program, only three of the 2,864 pads showed the characteristiccolor change indicating the presence of aromatic amines. Of the three positive samples, one wasfound to be a false positive through additional testing and research, and the other two wereequipment which were re-cleaned using a decontamination solution formulated to removearomatic amine compounds. After re-cleaning with the decontamination solution, the equipmentSurface Swype was repeated and no color change was indicated.
Another type of pad utilized was a Skin Swype pad. The Skin Swype pad was used todetermine that no inadvertent skin contamination with 2-NA had occurred. When a workerexited the exclusion zone, the worker’s skin was wiped with a Skin Swype pad prior towashing, the pad was placed in a small cup containing developing solution, the developingsolution was allowed to wick through the pad. If a strip near the top of the pad changed color, itwas considered to be positive for an aromatic amine. None of the 770 Skin Swype padsshowed a positive result.

SECTIONSEVEN Operations and Maintenance Activities
Slippery Chemical OU 3 Final RA Report 7-1
The Risk Assessment Report and associated risk analysis were complete in January 1998, atwhich time the USACE notified H&S Consultants to prepare for the operation phase. In lateFebruary 1998, a clean burn demonstration was performed to ensure that the thermal destructionfacility (TDF) was mechanically capable of performing during the Operations Phase. On March4th, with the clean burn successfully complete, and with concurrence from USEPA and USACE,the Operation Phase commenced.
With-in several days of the Operation Phase concerns were raised over whether dust wasentrained in the steam generated from the thermal process and whether, if entrained, it wasleaving the site boundary. Several members of the project team including USEPA, TNRCC,USACE, and H&S Consultants inspected the process and determined that there was no dustleaving the site boundary, but that modifications could be made to help alleviate the dustconcern. The first effort was to install a hood equipped with mist spray nozzles on the ash-receiving bin. The use of mist nozzles in the ash-receiving bin knocked out dust that wasentrained in the steam. The second effort was to partially enclose the fly ash building. Thisallowed additional residence time in the building for steam to settle. The first two efforts wereimplemented immediately. The third effort included locating a steam scrubber that could beinstalled as final precaution to scrub the steam of any entrained dust. By the end of April 1998, asteam scrubber was mobilized to the site, modified for the site-specific application, and installedin the ash-receiving bin.
In early April 1998, after preliminary kiln refractory brick repairs failed, a decision was made tore-line the kiln with a castable refractory. Installation of the new refractory took place during thelast three weeks of April and the first week of May. The Operation Phase resumed during thefirst week of May 1998.
As per the TNRCC Air Equivalency Document and the Trial Burn Plan, Operation Phase StackTesting was performed. Once per month for the first three months of operations stack testingwas performed for dioxin and Furan analysis. Once per quarter for the duration of the projectstack testing was performed for particulate and metals analysis.
During the Operation Phase several statistical operating goals were established. A “utilizationpercentage” was calculated to illustrate performance of the TDF as compared to a benchmarkoperating rate of 47 tons per hour. A “utilization average” was calculated to summarize theperformance of the TDF. An “availability percentage” was calculated to illustrate the time theTDF was physically available to operate. An “availability average daily tons” was calculated tosummarize the TDF production during available operating hours. An “availability TPH” wascalculated to summarize the TDF production rate during available operating hours. Thepercentage of ash requiring additional thermal treatment was calculated and compared to aproject goal. The following table summarizes the Operation Phase performance versusestablished goals.
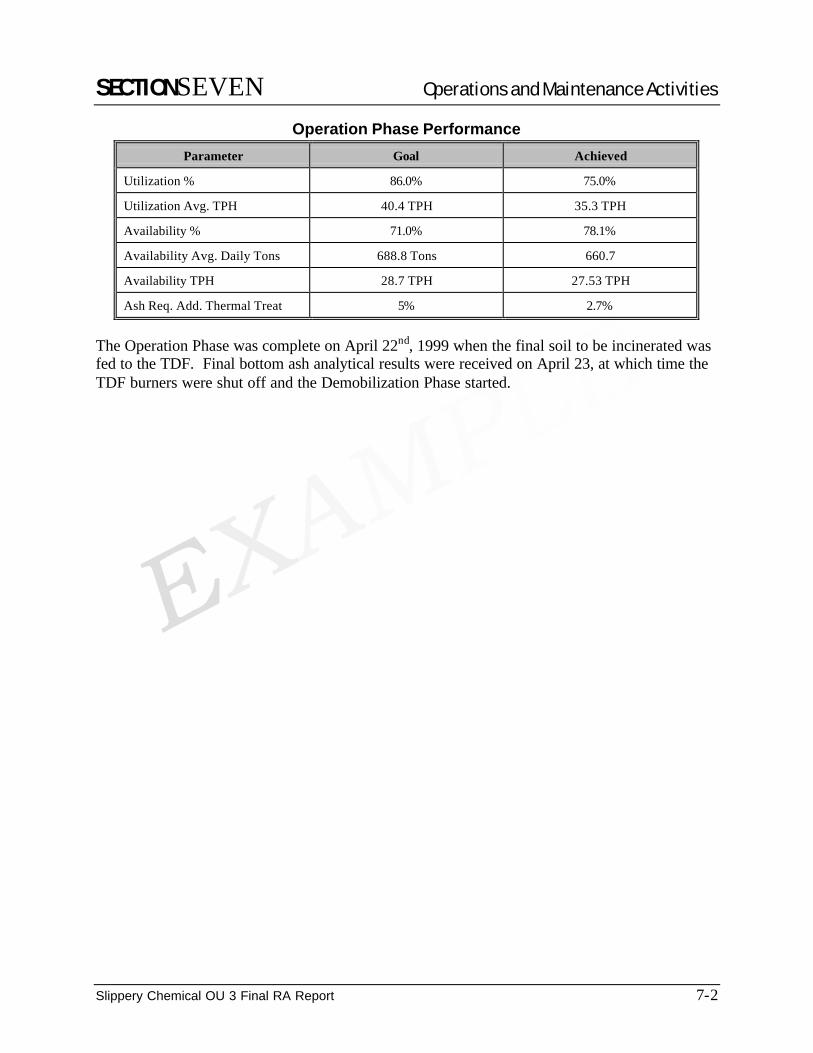
SECTIONSEVEN Operations and Maintenance Activities
Slippery Chemical OU 3 Final RA Report 7-2
Operation Phase PerformanceParameter Goal Achieved
Utilization % 86.0% 75.0%
Utilization Avg. TPH 40.4 TPH 35.3 TPH
Availability % 71.0% 78.1%
Availability Avg. Daily Tons 688.8 Tons 660.7
Availability TPH 28.7 TPH 27.53 TPH
Ash Req. Add. Thermal Treat 5% 2.7%
The Operation Phase was complete on April 22nd, 1999 when the final soil to be incinerated wasfed to the TDF. Final bottom ash analytical results were received on April 23, at which time theTDF burners were shut off and the Demobilization Phase started.

SECTIONEIGHT Summary of Project Costs
Slippery Chemical OU 3 Final RA Report 8-1
PROCUREMENT PROCESS
USACE awarded the contract to perform the soil remediation at OU-3 to Remedial ServicesInternational on September 30, 1993, with remediation activities performed by RemedialServices International. Remedial Services International was subsequently acquired by H&SConsultants, which was later acquired by ABC Corporation. The contract was awarded using afirm fixed-price cost structure. On September 23, 1996, the contract was converted to a cost plusfixed fee contract.
TREATMENT SYSTEM COST
The table below summarizes total project costs for the RA at OU 3. Appendix B provides abreakdown of these costs.
Cost Item AdjustedROD Estimate
Actual Cost1 Difference2
RA Capital Costs (1994-1999) $78,150,000 $64,676,100 - 17 %
RA Operating Costs (1998-1999)3 $45,800,000 69,890,000 + 53 %
RA Periodic Costs (1999) $45,000 56,850 + 26 %
Total Costs Incurred, Years 0-5 (Actual $$) $123,995,000 $134,622,950 + 9 %
1 Costs are based on the respective years that the costs were incurred. The ROD estimates were adjusted from1988 dollars to the appropriate year’s dollar basis using ENR building cost index factors.
2 Differences between the actual RA operating costs and the adjusted ROD estimate are largely attributable to thewaiting phase associated with a project shutdown pending the outcome of a lawsuit filed by a citizens group($14,268,000). Costs were saved during site restoration by using clean, excavated rock as backfill and byeliminating the need for vegetative cover (see Section 9 for additional information).
.
SECTIONNINE Observations and Lessons Learned
Slippery Chemical OU 3 Final RA Report 9-1
COST-RELATED
Costs on similar future projects could be reduced by taking preliminary steps to minimize thechances for shutdowns caused by legal actions. Millions of dollars in costs were incurred whilethe incinerator was shutdown pending the outcome of a lawsuit brought by an opposition group.
A significant cost savings was realized due to a change incorporated into the contractspecifications allowing for the cleaning and backfilling of excavated rock. The reuse of rockeliminated costs associated with importing stone from an outside source.
The initial remedial design included laying cover material capable of supporting vegetation overtreated soil depleted of organic material. Two studies demonstrated that the addition of compostand fertilizer to the treated soil would be sufficient to allow sustained growth of a vegetativecover. The amended design resulted in elimination of costs associated with importing fillmaterials and topsoil.
PERFORMANCE-RELATED
Project managers of future similar projects should perform a thorough review of the proposedequipment layout plans. Equipment locations are particularly important to consider with materialhandling systems. Bins and buildings to store and/or stabilize ash should be located in closeproximity to ash sources to minimize the amount of high wear/severe duty equipment (e.g.,screw augers and drag conveyors) necessary.
The feed preparation area should be as large as physically possible to allow sufficient room forany additional equipment, which may become necessary for trash separation, drum handlingoperations, pre-drying and similar operations.
Dust suppression is an important aspect of managing soil and ash on-site. When possible, soiland ash management operations should be conducted within an enclosed structure such as abuilding under slight negative pressure or using enclosed equipment.
During the preliminary site investigation and incinerator conceptual design, the moisture contentof site soil should be characterized. Worst case moisture content should be included in the RFPso the contractor design engineers can size the kiln and burners accordingly. Soil moisture willgreatly affect the allowable throughput rate and the ability of the system to remove contaminantsfrom the soil. A heat transfer specialist should do a thorough review of the assumptions andcalculations used to size the incineration equipment.
The temperature of the treated soil exiting the kiln is a primary indicator of whether the soil willmeet the treatment requirements. The contractor should measure the kiln exit soil temperatures toobtain a real-time indication of the kiln efficiency, rather than waiting 72 hours for the analyticalresults of the treated soil samples.
Due to the severe environments under which they operate, the ash conveyance system may beparticularly susceptible to mechanical failure. A thorough review of the contractor’s proposed

SECTIONNINE Observations and Lessons Learned
Slippery Chemical OU 3 Final RA Report 9-2
system should be performed. The review should draw upon the vast quantity of material handlinginformation and experience available within the combustion industry.
Whenever cost and space allow, redundant systems should be implemented in order to keep theincinerator operational. The incinerator cannot physically operate without certain systems online(e.g., drag conveyors or pumps) and the incinerator must not be allowed to operate if certainequipment is not operational per permit requirements (e.g., Continuous Emission Monitors[CEMs]). Incinerator downtime can be costly because site personnel must be paid and equipmentrental fees are incurred whether the incinerator is operating or not.
Performing a clean burn prior to feeding hazardous waste to the incinerator can have thefollowing benefits:
• Serves as a mechanical shakedown of the system;
• Provides an opportunity to do performance testing on the CEMs; and
• Provides an opportunity to debug any programming or control systems without the risk ofany sort of a release or labor-intensive decontamination prior to correcting any problems.
During the incinerator optimization stage and the trial burn tests, the incinerator should beoperated under a wide range of operating conditions (e.g., varied feed rate, kiln rotation speed,and combustion temperature) to ensure that the permit limits allow the desired level of operatingflexibility.
OTHER LESSONS LEARNED
The USACE and the state regulatory agency were involved with a proactive, USEPA-lead publicrelations effort that was implemented from the beginning of the project. This was achieved bydeveloping a public relations plan in conjunction with the local community.
Ninety to one hundred twenty days was allowed for state review of permit equivalencydocuments, including the Trial Burn Plan.
The RFP specifications delineated which activities were construction-related and which activitieswere service-related. Difficulties can arise when personnel working side-by-side on the sameequipment are paid different wages.
Staffing requirements for an incineration project are greater than the typical USACE constructionproject. Required staff included an on-site project chemist, thermal incineration experts, officeengineers, project engineers, quality assurance staff, and an on-site authorized contractingofficer’s representative. In addition, the contracting officer’s representative was given moreauthority to process changes so the changes could be incorporated in a timely manner.
A Construction Management Plan was developed that included the roles and responsibilities ofthe participating organizations and individuals.

SECTIONNINE Observations and Lessons Learned
Slippery Chemical OU 3 Final RA Report 9-3
The project manager prepared for the worst weather possible at the site. Freezing pipes, poweroutages, late deliveries, inability to move equipment and excavations filling with water areexamples of weather-related problems. These occurrences, if not anticipated, could have delayedthe project and been a source of additional costs.
Local emergency responders were involved with emergency response planning and drills. Theywere provided with the required training and the necessary response equipment if they were notalready prepared for incinerator-related emergencies.
All pertinent federal and state regulations and guidance documents identified in the projectspecifications were available on-site for reference.
Due to the large volume of information gathered and shared with outside agencies, a computer-based information and issue tracking system was used for this project. The system containedcomplete descriptions of the issues, responsible individuals, inception dates, and anticipatedresolution dates. The system was reviewed on a regular basis to track the status of outstandingissues.
Before initiating site work, a cost-benefit analysis was performed to determine if a backup to theprimary laboratory should be selected. Selection of a backup laboratory at the beginning of theproject eliminated time spent for laboratory validation and approval, which could have impactedthe project in progress if a laboratory had not been selected prior to start of work.
An active safety incentive program increased worker safety awareness and reduced injuries andaccidents.

SECTIONTEN Operable Unit Contacts
Slippery Chemical OU 3 Final RA Report 10-1
Remedial Action Contractor:
Primary Contact Name and Title: Mr. Frederick Stanley, President
Company Name: H&S Consultants
Address: 630 Hilton Street, Grease, TX 99990
Phone Number: (555) 555-4102
RA Oversight Contractor:
Company Name: RJB Consultants Contract Number: 9999-8888-5555RT
Address: 999 What Street, Sometown, TX 99994
Phone Number: (555) 555-4444
Work AssignmentNumber: 44444-66-22222XJ
Analytical Laboratory:
For the USACE:
Company Name: Eastern Laboratories, Inc.
Address: 101 South 16th Street, Padre Island, TX 99998
Phone Number: (555) 555-4455
Project Management:
For the USACE:
Name: Joe Civil
Company Name: U.S. Army Corps of Engineers
Address: Ft. Worth District
Phone Number: (888) 555-1234
Email: [email protected]
For the EPA:
Name: Alice Jones
U.S. EPA Region: VI
Address: 1445 Ross Avenue, Suite 1200, Dallas, TX 75202
Phone Number: (214) 665-1212
Email: [email protected]
SECTIONELEVEN References
Slippery Chemical OU 3 Final RA Report 11-1
1. USEPA Region 3, Record of Decision – Slippery Chemical Superfund Site, Operable Unit 3,August 1988.
2. USEPA’s Slippery Chemical Home Page,http://www.epa.gov/reg3hwmd/super/slippery/pad.htm.
3. Fact Sheet, “Slippery Chemical Superfund Site On-Site Soil Incineration”, October 1, 1999.4. Slippery Project Summary Milestones
5. USACE, Specifications (for Fixed-Price Services Contract), On-Site Soil Incineration,Slippery Chemical Superfund Site, April 1993.
6. James Q. Public, Consulting Engineers, Inc., Incineration Treatability Study Report, SlipperyChemical Superfund Site, August 1991.
7. Texarkana Research Institute, Trial Burn Plan for the Slippery Chemical Superfund Site,September 20, 1996.
8. H&S Consultants, Wastewater Management Plan, Revision No. 3, for On-Site SoilIncineration, Slippery Chemical Superfund Site, August 1997.
9. Sandra Upps of TNRCC, Air Equivalency Permit, February 6, 1998.10. Eastern, Slippery Chemical Site, Incinerator Full-Scale Operation, Integrated Risk
Assessment, November 1997.11. H&S Consultants, Quantity Tracking Logs and Volume Calculation Information, October 28,
1999.
12. H&S Consultants, Test Report for Trial Burns No. 1 and No. 2 on the Slippery ChemicalSuperfund Site’s Mobile On-Site Hazardous Waste Incinerator, September 12, 1997.
13. Perry’s Chemical Engineers’ Handbook, Sixth Edition, McGraw Hill Book Company, NewYork, 1984.
14. http://pmep.cce.cornell.edu/profiles/herb-growthreg/fatty-alcohol-monuron/fenac/herb-prof-fenac.html
15. Analytical results from full-scale incineration operations (not bound in a report).
16. Chad R. Rogers and Michael B. Provo, USACE, Slippery Chemical Superfund OnsiteIncineration Project Lessons Learned.
17. USACE, Internal Project Description, Slippery Chemical Superfund Site.
18. MTV Laboratories, Hydrometer Analysis Reports, Slippery Chemical Superfund Site,November 15, 1996 through April 1, 1999.
19. Stan Bopp, USACE, Final Cost Report, Slippery Chemical Superfund Site, April 21, 2000.

APPENDIXA Cost and Performance Factors
Slippery Chemical OU 3 Final RA Report A-1
The table below lists selected characteristics for the soil at the SCS Site. Except where noted,data provided are average values for pre-treatment soil samples collected during the 1997 trialburns.
Site CharacteristicsCharacteristic Value Measurement Procedure
Soil Classification1 SM(silty sands and silt-sand mixtures) USCS
Clay Content1 3.8 to 8.8% ASTM D422
Moisture Content 16%2 ASTM D-3173
Total Petroleum Hydrocarbon(TPH) Content 181 to 6,569 mg/kg EPA 418.1
Bulk Density 99.8 to 109.6 lbs/ft3 ASTM D 4253 and 4254
BTU Value 274 BTU/lb ASTM D 2015
Halogen Content 260 mg/kg Chlorine ASTM E 442 or D 808/D 4327
Metal ContentArsenicBerylliumCadmiumChromiumLead
7.65 mg/kg0.67 mg/kg0.16 mg/kg24.5 mg/kg41.6 mg/kg
ICPICP
ICP, GFAAICPICP
1 These data correspond to treated soil samples. Data was not available for untreated soil.2 During full-scale operations, the soil moisture content ranged from 10.0 to 25.5% and averaged 17.6%.
The following table lists the operating limits for the incineration system that were approved bythe USEPA and TNRCC prior to full-scale operation of the system. These operating limits weredeveloped based on the results of the trial burns and risk burns.
Operating LimitsParameter Value
Waste Feed Rate, Maximum Allowable 47.3 tons/hr rolling average
Kiln Hood Pressure, Maximum Allowable 0 inches water column (wc) instantaneous-0.1 inches wc for 10 seconds or more
Kiln Exit Temperature, Minimum Allowable 1599ºF hourly average1000ºF instantaneous
Kiln Exit Temperature, Maximum Allowable 2200ºF
Kiln Rotation, Minimum Allowable 0.4 revolutions per minute (rpm)
SCC Temperature, Minimum Allowable 1801ºF
SCC Temperature, Maximum Allowable 2600ºF
SCC Residence Time, Minimum Allowable 2 seconds
Baghouse Inlet Temperature, Maximum Allowable 500ºF
Baghouse Air-to-Cloth ratio, Maximum Allowable 3.6 to 1
Bag House Pressure Drop, Minimum Allowable 1.0 inches wc for more than 5 minutes
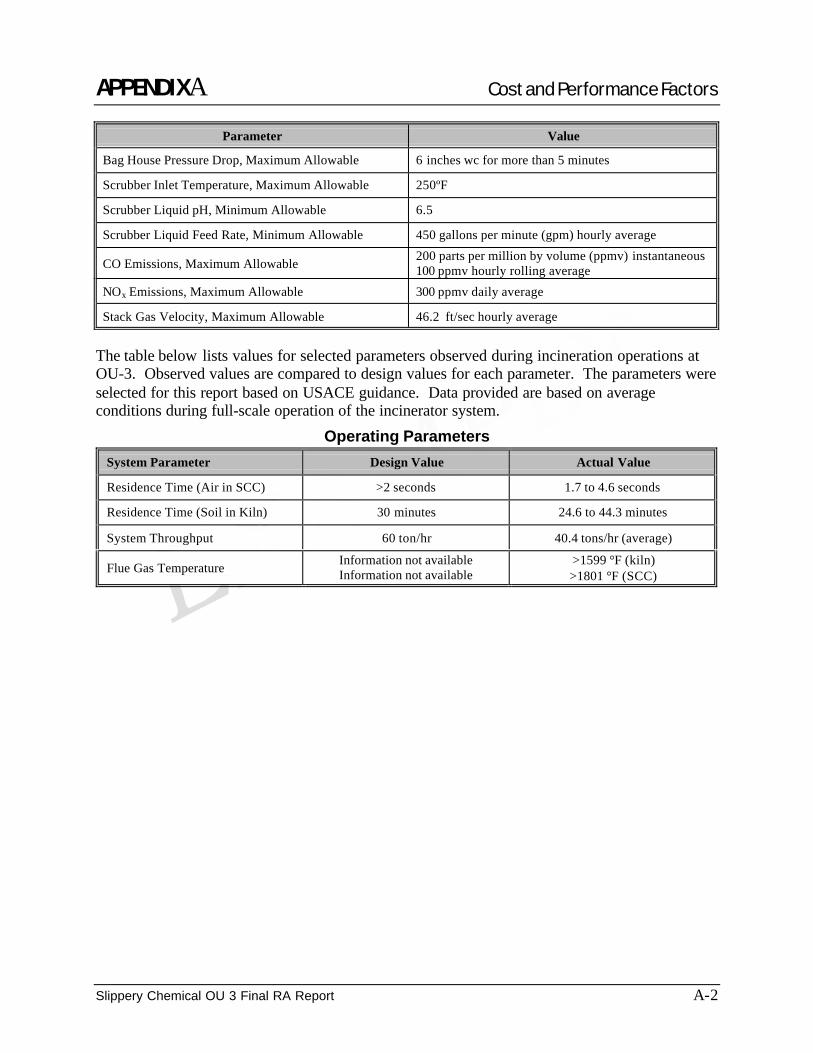
APPENDIXA Cost and Performance Factors
Slippery Chemical OU 3 Final RA Report A-2
Parameter Value
Bag House Pressure Drop, Maximum Allowable 6 inches wc for more than 5 minutes
Scrubber Inlet Temperature, Maximum Allowable 250ºF
Scrubber Liquid pH, Minimum Allowable 6.5
Scrubber Liquid Feed Rate, Minimum Allowable 450 gallons per minute (gpm) hourly average
CO Emissions, Maximum Allowable 200 parts per million by volume (ppmv) instantaneous100 ppmv hourly rolling average
NOx Emissions, Maximum Allowable 300 ppmv daily average
Stack Gas Velocity, Maximum Allowable 46.2 ft/sec hourly average
The table below lists values for selected parameters observed during incineration operations atOU-3. Observed values are compared to design values for each parameter. The parameters wereselected for this report based on USACE guidance. Data provided are based on averageconditions during full-scale operation of the incinerator system.
Operating ParametersSystem Parameter Design Value Actual Value
Residence Time (Air in SCC) >2 seconds 1.7 to 4.6 seconds
Residence Time (Soil in Kiln) 30 minutes 24.6 to 44.3 minutes
System Throughput 60 ton/hr 40.4 tons/hr (average)
Flue Gas Temperature Information not availableInformation not available
>1599 °F (kiln)>1801 °F (SCC)

APPENDIXB Project Costs
Slippery Chemical OU 3 Final RA Report B-1
The following tables present a breakdown of actual costs incurred for the project and calculationof technology-specific unit cost for incineration. HCAS data entry sheets are also attached tothis appendix.
Site: Slippery Chemical Site Description:Location:Phase:Date:
RA CAPITAL COSTS:
331XX HTRW Remedial Action
.01 Mobilization and Preparatory Work.02 Mob of Personnel.03 Submittals/ Implementation Plans.04 Setup/Construct Temporary Facilities Fence, roads/parking, signs, trailers.05 Construct Temporary Utilities
SUBTOTAL
.03 Sitework.08 Water/Sewer Relocation
.06 Groundwater Collection.05 Earthwork - Sheet Piling
.08 Solids Collection and Containment.01 Contaminated Soil Excavation
.10 Drums/Tanks/Struct/Misc Removal.01 Drum Handling and Removal.07 Debris Removal
SUBTOTAL
.13 Physical Treatment.20 Carbon Adsorption - Liquids WWTP
.05 Mobilize/Setup/Relocate Plant
.07 Demobilize PlantSUBTOTAL
.14 Thermal Treatment.01 Incineration
.04 Pads/Foundations/Spill Control
.05 Mobilize/Setup Plant
.06 Startup/Readiness Test/Trial Burn
.07 Demobilize PlantSUBTOTAL
.18 Disposal (Other than Commercial).21 Transport to Storage/Disposal Facility Load/Haul/Unload
.19 Disposal (Commercial).21 Transport to Storage/Disposal Facility Load/Haul/Unload
.20 Site Restoration.01.03 Earthwork - Backfill.01.04 Earthwork - Borrow.01.90 Grading & Topsoil.03.90 Storm Drainage.04 Revegetation and Planting Seeding/mulch/fertilizer
SUBTOTAL
.21 Demobilization.01 Removal of Temporary Facilities Fence, roads/parking, signs, trailers.02 Removal of Temporary Utilities.03 Final Decontamination.04 Demobilization of Construction Equipment Excavator, etc.
SUBTOTAL
SUBTOTAL
Project ManagementRemedial DesignConstruction Management
TOTAL RA CAPITAL COSTS
EA $245,000 $245,0001 EA $378,000 $378,000
$64,676,100
5,915,6005,640,000
$882,000
$49,576,000
3,544,500
1 EA $408,000 $408,000
EA $811,000 $811,0001 EA $71,000 $71,000
EA $12,910,000 $12,910,000EA $2,248,000 $2,248,000
$21,492,000
1 EA
1
1
8 AC $10,750 $86,000
$8,641,000
39,875 SF $48 $1,914,000
2,425 LF $378 $916,000
1
1 EA $122,000 $122,0001 EA $2,665,000 $2,665,000
NOTES
1 EA $2,683,000 $2,683,000
UNIT TOTALDESCRIPTION QTY UNIT COST (1994 $$)
ACTUAL COSTS (1 of 2)
Grease, TexasFinal RA Report (OU-3)June 7, 1999
The selected treatment consisted of a mobile rotary kiln incinerator used to treat excavated sludge, soil and sediments onsite. In addition, a waste water treatment plant (WWTP) used granular activated carbon (GAC) to treat all water produced from the excavation and incineration processes.
EA $99,000 $99,000
1 EA $318,000 $318,000$1,637,000
1 EA $812,000 $812,000
1 EA $3,171,000 $3,171,000
$3,448,000
194,520 CY $13 $2,544,00012,376 CY $16 $195,000
1
194,520 CY $15 $2,856,000
$4,420,000 $4,420,0001
$315,000$529,000
185 EA $1,157 $214,0008 AC $39,375
87,204 SF $55 $4,809,000
275,467 TON $14 $3,762,000
2,200 TON $275 $604,000
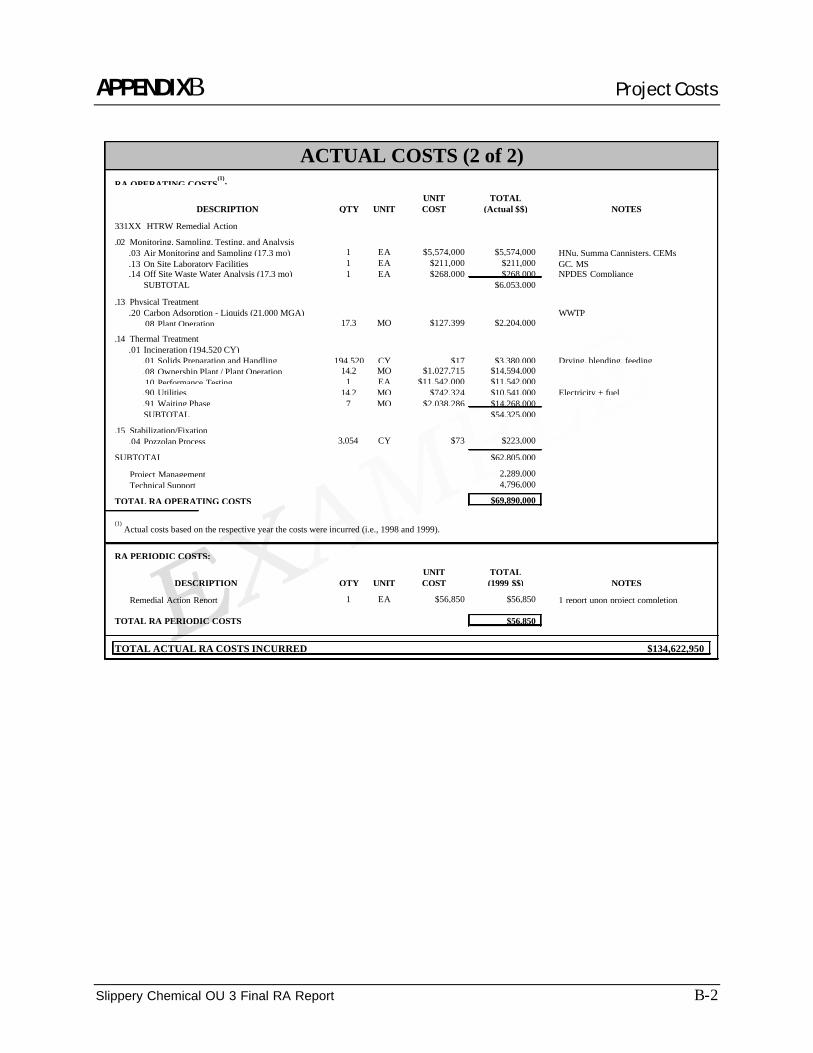
APPENDIXB Project Costs
Slippery Chemical OU 3 Final RA Report B-2
RA OPERATING COSTS(1)
:
331XX HTRW Remedial Action
.02 Monitoring, Sampling, Testing, and Analysis.03 Air Monitoring and Sampling (17.3 mo) HNu, Summa Cannisters, CEMs.13 On Site Laboratory Facilities GC, MS.14 Off Site Waste Water Analysis (17.3 mo) NPDES Compliance
SUBTOTAL
.13 Physical Treatment.20 Carbon Adsorption - Liquids (21,000 MGA) WWTP
.08 Plant Operation
.14 Thermal Treatment.01 Incineration (194,520 CY)
.01 Solids Preparation and Handling Drying, blending, feeding
.08 Ownership Plant / Plant Operation
.10 Performance Testing
.90 Utilities Electricity + fuel
.91 Waiting PhaseSUBTOTAL
.15 Stabilization/Fixation.04 Pozzolan Process
SUBTOTAL
Project ManagementTechnical Support
TOTAL RA OPERATING COSTS
RA PERIODIC COSTS:
Remedial Action Report 1 report upon project completion
TOTAL RA PERIODIC COSTS
TOTAL ACTUAL RA COSTS INCURRED $134,622,950
(1) Actual costs based on the respective year the costs were incurred (i.e., 1998 and 1999).
$56,850
COST (1999 $$) NOTES
1 EA $56,850 $56,850
DESCRIPTION QTY UNITUNIT TOTAL
4,796,000
$69,890,000
$62,805,000
2,289,000
$54,325,000
17.3 MO $127,399 $2,204,000
3,054 CY $73 $223,000
EA $268,000 $268,000$6,053,000
$5,574,000 $5,574,0001 EA $211,000 $211,000
1 EA $11,542,000 $11,542,000
7 MO $2,038,286 $14,268,00014.2 MO $742,324 $10,541,000
14.2 MO $1,027,715 $14,594,000
UNIT TOTALDESCRIPTION QTY UNIT COST (Actual $$)
ACTUAL COSTS (2 of 2)
NOTES
$17 $3,380,000194,520 CY
1 EA
1
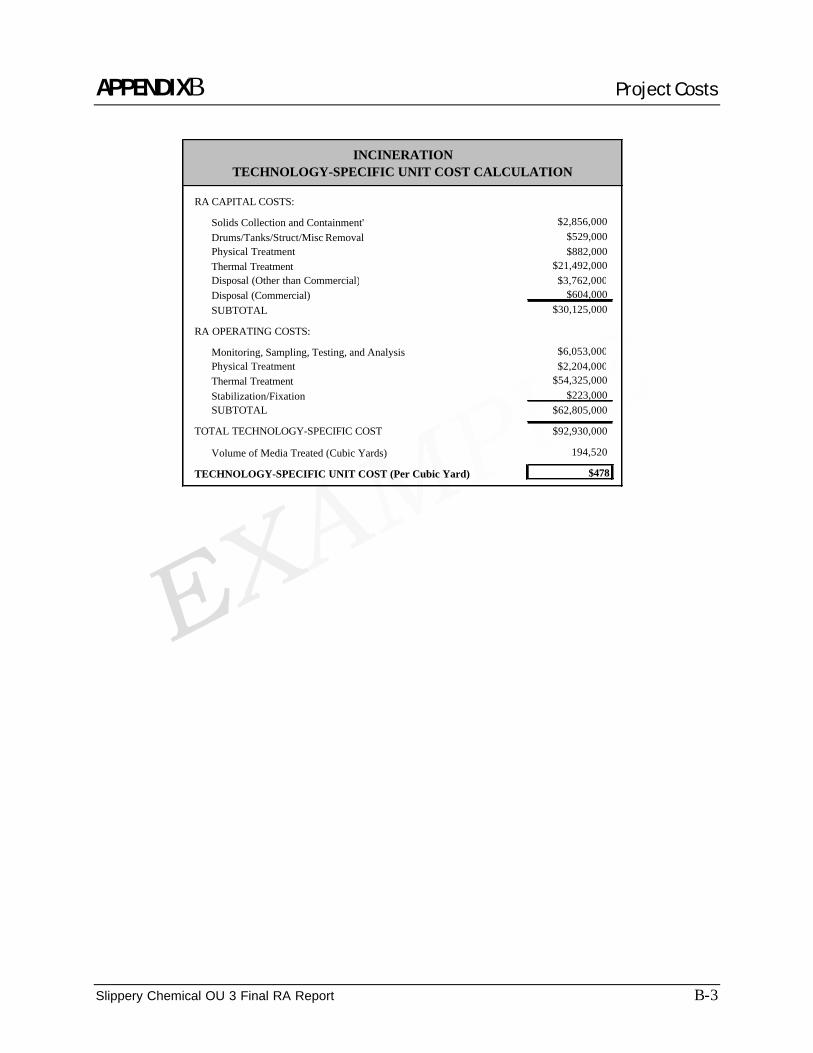
APPENDIXB Project Costs
Slippery Chemical OU 3 Final RA Report B-3
INCINERATIONTECHNOLOGY-SPECIFIC UNIT COST CALCULATION
RA CAPITAL COSTS:
Solids Collection and Containment'Drums/Tanks/Struct/Misc RemovalPhysical TreatmentThermal TreatmentDisposal (Other than Commercial)Disposal (Commercial)SUBTOTAL
RA OPERATING COSTS:
Monitoring, Sampling, Testing, and AnalysisPhysical TreatmentThermal TreatmentStabilization/FixationSUBTOTAL
TOTAL TECHNOLOGY-SPECIFIC COST
Volume of Media Treated (Cubic Yards)
TECHNOLOGY-SPECIFIC UNIT COST (Per Cubic Yard) $478
$92,930,000
$2,856,000$529,000$882,000
$21,492,000
$604,000$3,762,000
$30,125,000
194,520
$62,805,000
$6,053,000$2,204,000
$54,325,000$223,000
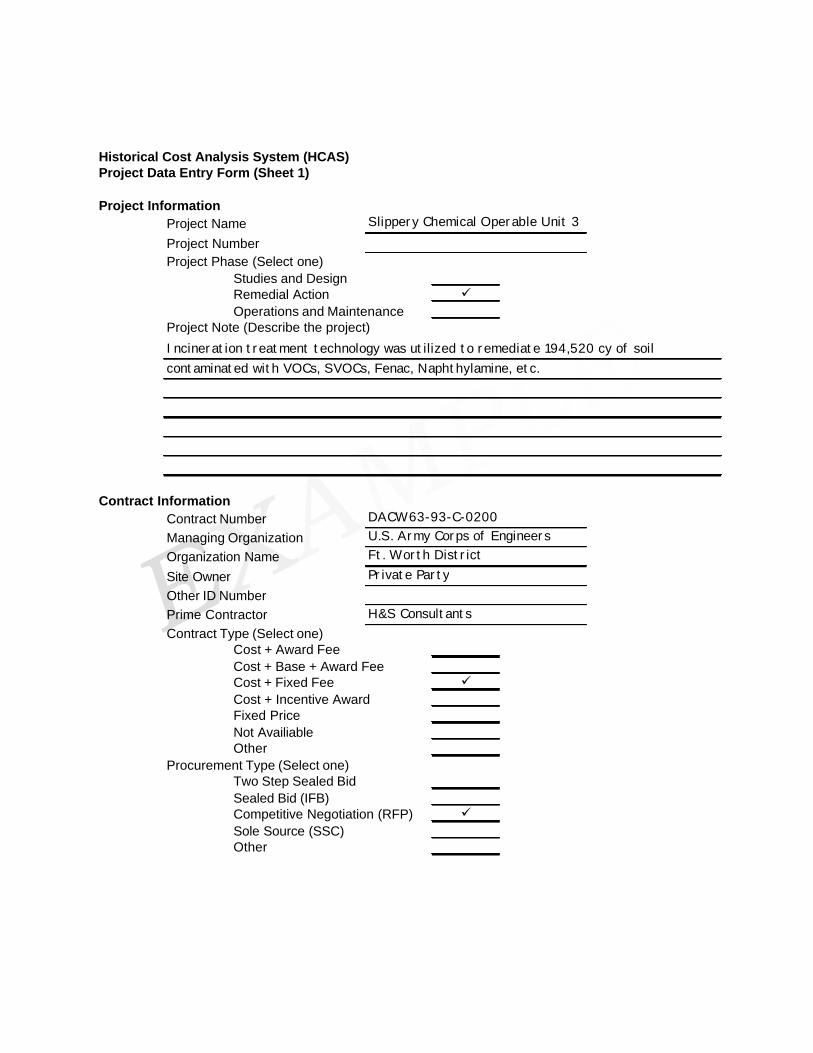
Historical Cost Analysis System (HCAS)Project Data Entry Form (Sheet 1)
Project InformationProject Name Slippery Chemical Operable Unit 3Project NumberProject Phase (Select one)
Studies and DesignRemedial Action üOperations and Maintenance
Project Note (Describe the project)Incineration treatment technology was utilized to remediate 194,520 cy of soilcontaminated with VOCs, SVOCs, Fenac, Naphthylamine, etc.
Contract InformationContract Number DACW63-93-C-0200
Managing Organization U.S. Army Corps of EngineersOrganization Name Ft. Worth DistrictSite Owner Private PartyOther ID Number Prime Contractor H&S ConsultantsContract Type (Select one)
Cost + Award FeeCost + Base + Award FeeCost + Fixed Fee üCost + Incentive AwardFixed PriceNot AvailiableOther
Procurement Type (Select one) Two Step Sealed Bid
Sealed Bid (IFB)Competitive Negotiation (RFP) üSole Source (SSC)Other

Historical Cost Analysis System (HCAS)Project Data Entry Form (Sheet 2)
Site InformationState/Country Texas/USAInstallation Site Name Grease, TXSite Number EPA Region VICurrent Use (Select one)
Installation OperationIndustry OperationResidentialRecreationalWildlife RefugeWaste Disposal üAdministrative OfficeCommercialOtherUnknown
Future Use (Select one)Installation OperationIndustry OperationResidentialRecreationalWildlife RefugeWaste DisposalAdministrative OfficeCommercialOtherUnknown ü
Point of ContactData Entry Person POC#2 POC#3
Title/Role Contractor Estimator Organization H&S Consultants Name John Jones Address 630 Hilton St. City, State Grease, TX Zip 99990 Telephone 555-555-4102 Fax 555-555-4103 Email jjones@h&s.com
Enter up to 3 POC's.

Historical Cost Analysis System (HCAS)Project Data Entry Form (Sheet 3)
Profile - General CharacteristicsRegulatory Class Public Concern
CERCLA ü LowRCRA High üOther Historical/ArchoelogicalUnknown Yes
National Priority List No üYes ü Innovative TechnologyNo Yes
Wetland No üYes Size of Exclusion Zone (Acres) 9.6No ü Size of Area (Acres) 9.6
Flood PlainYesNo ü
Profile - Contaminants/Technical Approach Site Type Media Contaminant Technical Approach
AG Storage Tanks Air Nonhal VOC's CWM/OEW RemvlUG Storage Tanks Equipment/Mach Halogenated VOC's Surf Water ControlDrums/Cont <250 GA Groundwater Nonhal Semi VOC's Grnd Water ControlUnauth Disposl Area Liquid Halogen Semi VOC's Air/Gas ControlFacil/Bldgs Surface Water Fuels Solids ContainFire Train/Open Burn Sediment Inorganics Liq/Sed/Sludge CntrlFiring Rnge/Open Det Sludge Low Lev Rad Waste Drums/Tanks RemvlPit/Trench Soil High Lev Rad Waste Biological TreatmentSurf Impnd/Lagoons Solid/Debris Low Rad Mixed Wst Chemical TreatmentLakes/Ponds/Swamp Struct Bldg Matls TRU Waste Physical TreatmentLandfill Other CWM/OEW Thermal TreatmentOcean Asbestos Stab/Fix/EncapRivers/Streams Unknown Decon & DecommishSpill/Emerg Resp Other Disposal (Not Comm)Waste Pile Disposal CommercialOther Other
Pick as many Profile combinations as necessary:
Surf Impnd/Lagoons Nonhal VOCs Thermal TreatmentSurf Impnd/Lagoons Halogenated VOCs Thermal TreatmentSurf Impnd/Lagoons Nonhal SVOCs Thermal TreatmentSurf Impnd/Lagoons Halogenated SVOCs Thermal Treatment
SoilSoilSoilSoil
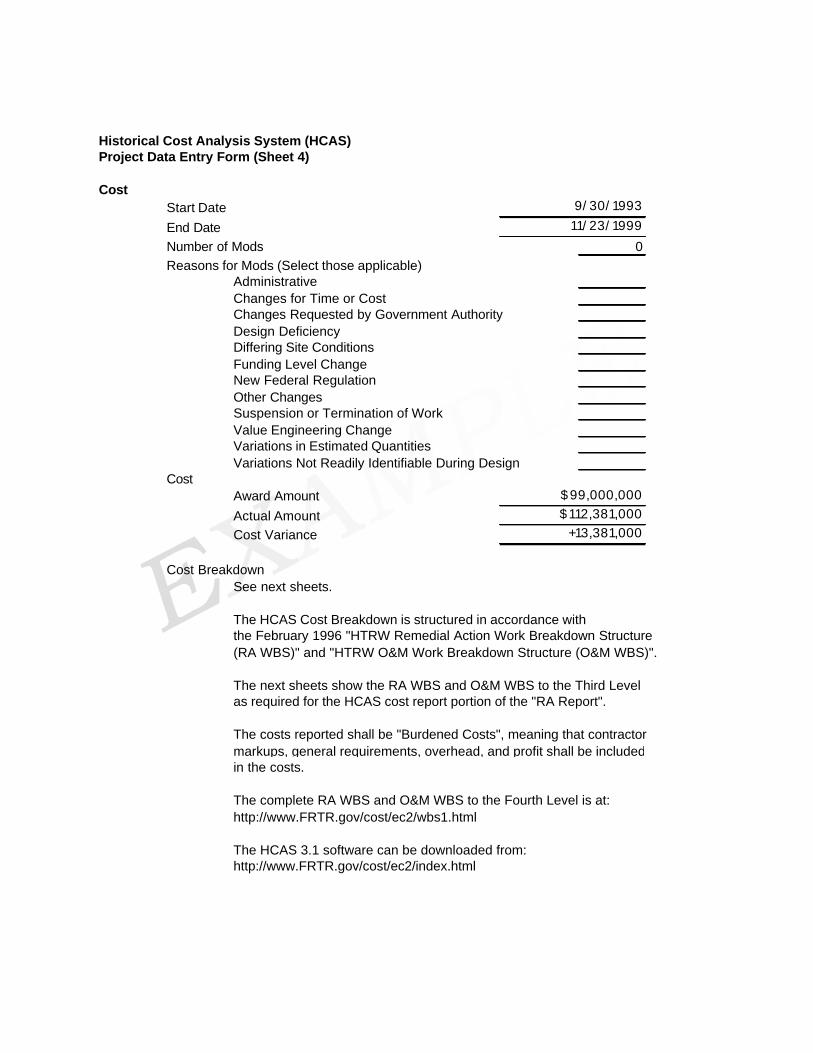
Historical Cost Analysis System (HCAS)Project Data Entry Form (Sheet 4)
CostStart DateEnd DateNumber of Mods 0Reasons for Mods (Select those applicable)
AdministrativeChanges for Time or CostChanges Requested by Government AuthorityDesign DeficiencyDiffering Site ConditionsFunding Level ChangeNew Federal RegulationOther ChangesSuspension or Termination of WorkValue Engineering ChangeVariations in Estimated QuantitiesVariations Not Readily Identifiable During Design
CostAward AmountActual AmountCost Variance
Cost Breakdown See next sheets.
The HCAS Cost Breakdown is structured in accordance with the February 1996 "HTRW Remedial Action Work Breakdown Structure(RA WBS)" and "HTRW O&M Work Breakdown Structure (O&M WBS)".
The next sheets show the RA WBS and O&M WBS to the Third Level as required for the HCAS cost report portion of the "RA Report".
The costs reported shall be "Burdened Costs", meaning that contractor markups, general requirements, overhead, and profit shall be includedin the costs.
The complete RA WBS and O&M WBS to the Fourth Level is at: http://www.FRTR.gov/cost/ec2/wbs1.html
The HCAS 3.1 software can be downloaded from:http://www.FRTR.gov/cost/ec2/index.html
+13,381,000
9/30/199311/23/1999
$99,000,000$112,381,000
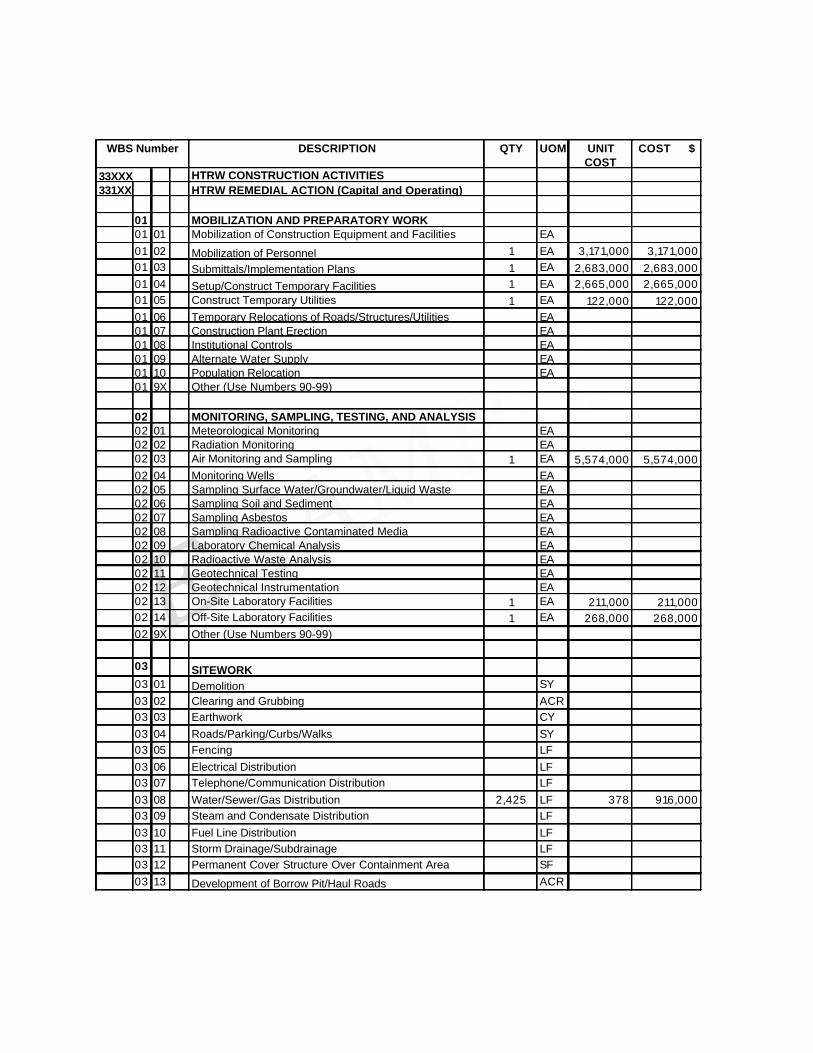
WBS Number DESCRIPTION QTY UOM UNIT COST
COST $
33XXX HTRW CONSTRUCTION ACTIVITIES331XX HTRW REMEDIAL ACTION (Capital and Operating)
01 MOBILIZATION AND PREPARATORY WORK 01 01 Mobilization of Construction Equipment and Facilities EA01 02 Mobilization of Personnel 1 EA 3,171,000 3,171,00001 03 Submittals/Implementation Plans 1 EA 2,683,000 2,683,00001 04 Setup/Construct Temporary Facilities 1 EA 2,665,000 2,665,00001 05 Construct Temporary Utilities 1 EA 122,000 122,00001 06 Temporary Relocations of Roads/Structures/Utilities EA01 07 Construction Plant Erection EA01 08 Institutional Controls EA01 09 Alternate Water Supply EA01 10 Population Relocation EA01 9X Other (Use Numbers 90-99)
02 MONITORING, SAMPLING, TESTING, AND ANALYSIS 02 01 Meteorological Monitoring EA02 02 Radiation Monitoring EA02 03 Air Monitoring and Sampling 1 EA 5,574,000 5,574,00002 04 Monitoring Wells EA02 05 Sampling Surface Water/Groundwater/Liquid Waste EA02 06 Sampling Soil and Sediment EA02 07 Sampling Asbestos EA02 08 Sampling Radioactive Contaminated Media EA02 09 Laboratory Chemical Analysis EA02 10 Radioactive Waste Analysis EA02 11 Geotechnical Testing EA02 12 Geotechnical Instrumentation EA02 13 On-Site Laboratory Facilities 1 EA 211,000 211,00002 14 Off-Site Laboratory Facilities 1 EA 268,000 268,00002 9X Other (Use Numbers 90-99)
03 SITEWORK03 01 Demolition SY03 02 Clearing and Grubbing ACR03 03 Earthwork CY03 04 Roads/Parking/Curbs/Walks SY03 05 Fencing LF03 06 Electrical Distribution LF03 07 Telephone/Communication Distribution LF03 08 Water/Sewer/Gas Distribution 2,425 LF 378 916,00003 09 Steam and Condensate Distribution LF03 10 Fuel Line Distribution LF03 11 Storm Drainage/Subdrainage LF03 12 Permanent Cover Structure Over Containment Area SF03 13 Development of Borrow Pit/Haul Roads ACR
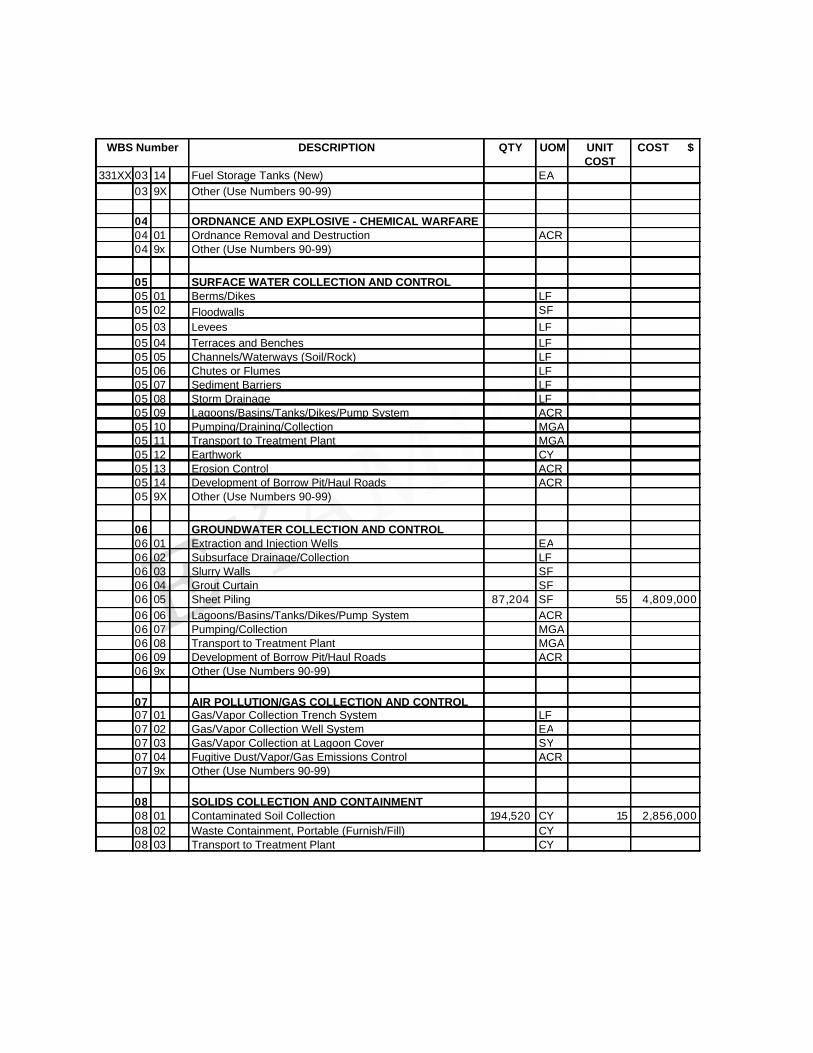
WBS Number DESCRIPTION QTY UOM UNIT COST
COST $
331XX 03 14 Fuel Storage Tanks (New) EA03 9X Other (Use Numbers 90-99)
04 ORDNANCE AND EXPLOSIVE - CHEMICAL WARFARE 04 01 Ordnance Removal and Destruction ACR04 9x Other (Use Numbers 90-99)
05 SURFACE WATER COLLECTION AND CONTROL05 01 Berms/Dikes LF05 02 Floodwalls SF05 03 Levees LF05 04 Terraces and Benches LF05 05 Channels/Waterways (Soil/Rock) LF05 06 Chutes or Flumes LF05 07 Sediment Barriers LF05 08 Storm Drainage LF05 09 Lagoons/Basins/Tanks/Dikes/Pump System ACR05 10 Pumping/Draining/Collection MGA05 11 Transport to Treatment Plant MGA05 12 Earthwork CY05 13 Erosion Control ACR05 14 Development of Borrow Pit/Haul Roads ACR05 9X Other (Use Numbers 90-99)
06 GROUNDWATER COLLECTION AND CONTROL06 01 Extraction and Injection Wells EA06 02 Subsurface Drainage/Collection LF06 03 Slurry Walls SF06 04 Grout Curtain SF06 05 Sheet Piling 87,204 SF 55 4,809,00006 06 Lagoons/Basins/Tanks/Dikes/Pump System ACR06 07 Pumping/Collection MGA06 08 Transport to Treatment Plant MGA06 09 Development of Borrow Pit/Haul Roads ACR06 9x Other (Use Numbers 90-99)
07 AIR POLLUTION/GAS COLLECTION AND CONTROL 07 01 Gas/Vapor Collection Trench System LF07 02 Gas/Vapor Collection Well System EA07 03 Gas/Vapor Collection at Lagoon Cover SY07 04 Fugitive Dust/Vapor/Gas Emissions Control ACR07 9x Other (Use Numbers 90-99)
08 SOLIDS COLLECTION AND CONTAINMENT 08 01 Contaminated Soil Collection 194,520 CY 15 2,856,00008 02 Waste Containment, Portable (Furnish/Fill) CY08 03 Transport to Treatment Plant CY
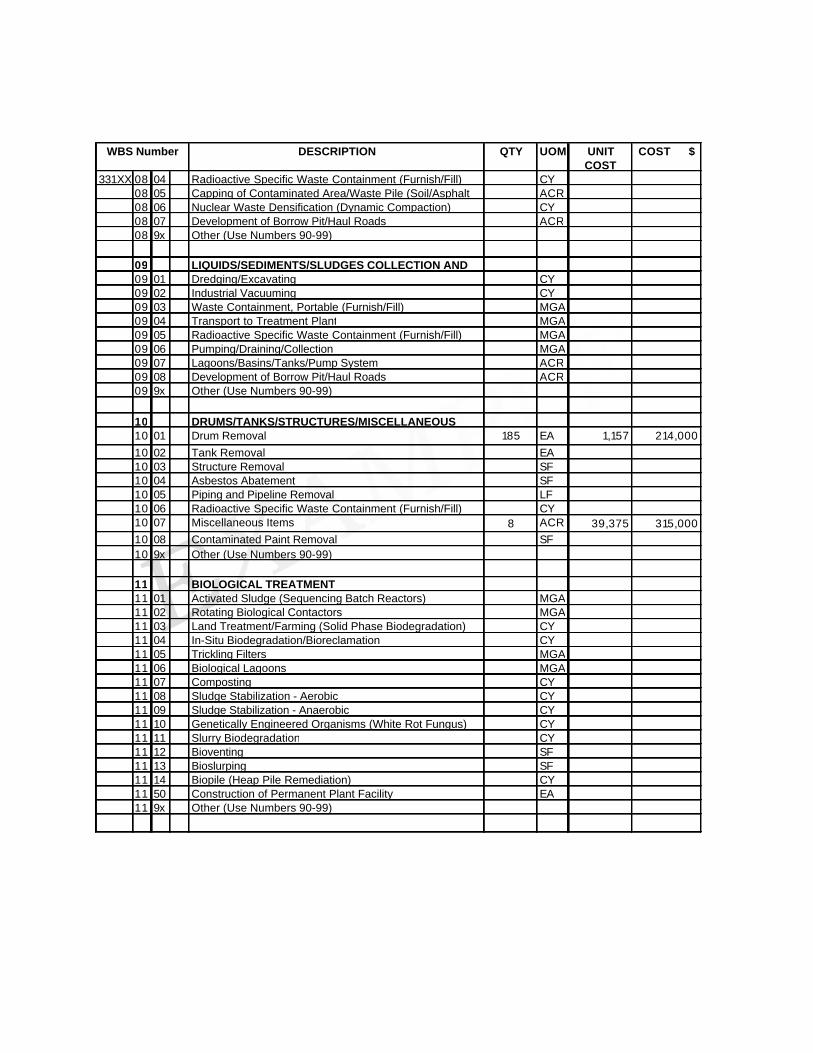
WBS Number DESCRIPTION QTY UOM UNIT COST
COST $
331XX 08 04 Radioactive Specific Waste Containment (Furnish/Fill) CY08 05 Capping of Contaminated Area/Waste Pile (Soil/Asphalt ACR08 06 Nuclear Waste Densification (Dynamic Compaction) CY08 07 Development of Borrow Pit/Haul Roads ACR08 9x Other (Use Numbers 90-99)
09 LIQUIDS/SEDIMENTS/SLUDGES COLLECTION AND 09 01 Dredging/Excavating CY09 02 Industrial Vacuuming CY09 03 Waste Containment, Portable (Furnish/Fill) MGA09 04 Transport to Treatment Plant MGA09 05 Radioactive Specific Waste Containment (Furnish/Fill) MGA09 06 Pumping/Draining/Collection MGA09 07 Lagoons/Basins/Tanks/Pump System ACR09 08 Development of Borrow Pit/Haul Roads ACR09 9x Other (Use Numbers 90-99)
10 DRUMS/TANKS/STRUCTURES/MISCELLANEOUS 10 01 Drum Removal 185 EA 1,157 214,00010 02 Tank Removal EA10 03 Structure Removal SF10 04 Asbestos Abatement SF10 05 Piping and Pipeline Removal LF10 06 Radioactive Specific Waste Containment (Furnish/Fill) CY10 07 Miscellaneous Items 8 ACR 39,375 315,00010 08 Contaminated Paint Removal SF10 9x Other (Use Numbers 90-99)
11 BIOLOGICAL TREATMENT 11 01 Activated Sludge (Sequencing Batch Reactors) MGA11 02 Rotating Biological Contactors MGA11 03 Land Treatment/Farming (Solid Phase Biodegradation) CY11 04 In-Situ Biodegradation/Bioreclamation CY11 05 Trickling Filters MGA11 06 Biological Lagoons MGA11 07 Composting CY11 08 Sludge Stabilization - Aerobic CY11 09 Sludge Stabilization - Anaerobic CY11 10 Genetically Engineered Organisms (White Rot Fungus) CY11 11 Slurry Biodegradation CY11 12 Bioventing SF11 13 Bioslurping SF11 14 Biopile (Heap Pile Remediation) CY11 50 Construction of Permanent Plant Facility EA11 9x Other (Use Numbers 90-99)

WBS Number DESCRIPTION QTY UOM UNIT COST
COST $
331XX 12 CHEMICAL TREATMENT12 01 Oxidation/Reduction (Catalytic Oxidation, UV Ozone, MGA12 02 Solvent Extraction MGA12 03 Chlorination MGA12 04 Ozonation MGA12 05 Ion Exchange MGA12 06 Neutralization MGA12 07 Chemical Hydrolysis MGA12 08 Ultraviolet Photolysis MGA12 09 Dehalogenation (Catalytic Dechlorination) CY12 10 Alkali Metal Dechlorination CY12 11 Alkali Metal/Polyethylene Glycol (A/PEG) CY12 12 Base-Catalyzed Decomposition Process (BCDP) CY12 13 Electrolysis MGA12 14 Vapor Recovery/Reuse (Internal Combustion Engine) CF12 50 Construction of Permanent Plant Facility EA12 9x Other (Use Numbers 90-99)
13 PHYSICAL TREATMENT13 01 Filtration/Ultrafiltration MGA13 02 Sedimentation MGA13 03 Straining MGA13 04 Coagulation/Flocculation/Precipitation MGA13 05 Equalization MGA13 06 Evaporation MGA13 07 Air Stripping MGA13 08 Steam Stripping MGA13 09 Soil Washing (Surfactant/Solvent) CY13 10 Soil Flushing (Surfactant/Solvent) CY13 11 Solids Dewatering CY13 12 Oil/Water Separation MGA13 13 Dissolved Air Floatation MGA13 14 Heavy Media Separation CY13 15 Distillation MGA13 16 Chelation MGA13 17 Solvent Extraction MGA13 18 Supercritical Extraction MGA13 19 Carbon Adsorption - Gases CF13 20 Carbon Adsorption - Liquids 21,000 MGA 146.95 3,086,00013 21 Membrane Separation - Reverse Osmosis MGA13 22 Membrane Separation - Electrodialysis MGA13 23 Soil Vapor Extraction CY13 24 Shredding CY13 25 Aeration CY13 26 Advanced Electrical Reactor CY13 27 Low Level Waste (LLW) Compaction CY13 28 Agglomeration CY
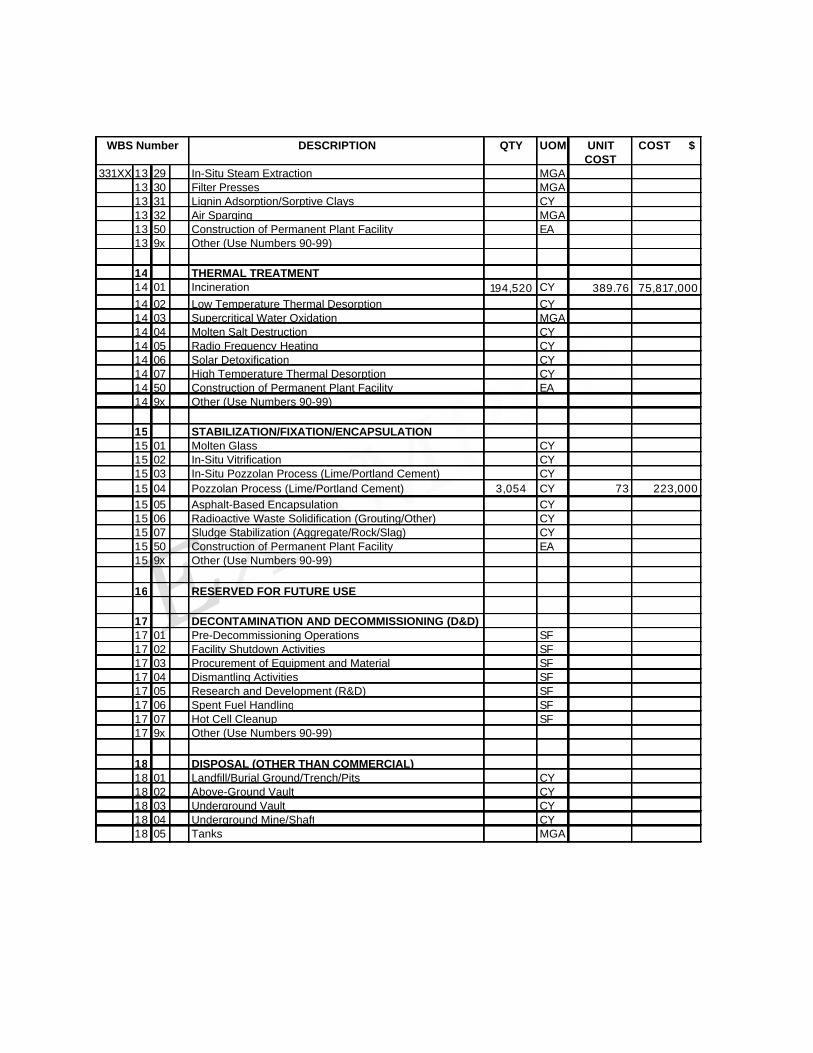
WBS Number DESCRIPTION QTY UOM UNIT COST
COST $
331XX 13 29 In-Situ Steam Extraction MGA13 30 Filter Presses MGA13 31 Lignin Adsorption/Sorptive Clays CY13 32 Air Sparging MGA13 50 Construction of Permanent Plant Facility EA13 9x Other (Use Numbers 90-99)
14 THERMAL TREATMENT 14 01 Incineration 194,520 CY 389.76 75,817,00014 02 Low Temperature Thermal Desorption CY14 03 Supercritical Water Oxidation MGA14 04 Molten Salt Destruction CY14 05 Radio Frequency Heating CY14 06 Solar Detoxification CY14 07 High Temperature Thermal Desorption CY14 50 Construction of Permanent Plant Facility EA14 9x Other (Use Numbers 90-99)
15 STABILIZATION/FIXATION/ENCAPSULATION15 01 Molten Glass CY15 02 In-Situ Vitrification CY15 03 In-Situ Pozzolan Process (Lime/Portland Cement) CY15 04 Pozzolan Process (Lime/Portland Cement) 3,054 CY 73 223,00015 05 Asphalt-Based Encapsulation CY15 06 Radioactive Waste Solidification (Grouting/Other) CY15 07 Sludge Stabilization (Aggregate/Rock/Slag) CY15 50 Construction of Permanent Plant Facility EA15 9x Other (Use Numbers 90-99)
16 RESERVED FOR FUTURE USE
17 DECONTAMINATION AND DECOMMISSIONING (D&D)17 01 Pre-Decommissioning Operations SF17 02 Facility Shutdown Activities SF17 03 Procurement of Equipment and Material SF17 04 Dismantling Activities SF17 05 Research and Development (R&D) SF17 06 Spent Fuel Handling SF17 07 Hot Cell Cleanup SF17 9x Other (Use Numbers 90-99)
18 DISPOSAL (OTHER THAN COMMERCIAL)18 01 Landfill/Burial Ground/Trench/Pits CY18 02 Above-Ground Vault CY18 03 Underground Vault CY18 04 Underground Mine/Shaft CY18 05 Tanks MGA

WBS Number DESCRIPTION QTY UOM UNIT COST
COST $
331XX 18 06 Pads (Tumulus/Retrievable Storage/Other) CY18 07 Storage Bldgs/Protective Cvr Structures/Other Bldgs & CY 18 08 Cribs CY18 09 Deep Well Injection MGA18 10 Incinerator CY18 15 Construction of Permanent Disposal Facility EA18 20 Container Handling EA18 21 Transportation to Storage/Disposal Facility 275,467 TON 14 3,762,00018 22 Disposal Fees and Taxes TON18 23 Mixed Waste Storage Fees and Taxes TON18 9x Other (Use Numbers 90-99)
19 DISPOSAL (COMMERCIAL)19 20 Container Handling EA19 21 Transportation to Storage/Disposal Facility 2,200 TON 275 604,00019 22 Disposal Fees and Taxes TON19 23 Mixed Waste Storage Fees and Taxes TON19 9x Other (Use Numbers 90-99)
20 SITE RESTORATION20 01 Earthwork 207,896 CY 14.99 3,117,00020 02 Permanent Markers EA20 03 Permanent Features 1 EA 245,000 245,00020 04 Revegetation and Planting 8 ACR 10,750 86,00020 05 Removal of Barriers EA20 9x Other (Use Numbers 90-99)
21 DEMOBILIZATION21 01 Removal of Temporary Facilities 1 EA 408,000 408,00021 02 Removal of Temporary Utilities 1 EA 99,000 99,00021 03 Final Decontamination 1 EA 812,000 812,00021 04 Demobilization of Construction Equipment and Facilities 1 EA 318,000 318,00021 05 Demobilization of Personnel EA21 06 Submittals EA21 07 Construction Plant Takedown EA21 9x Other (Use Numbers 90-99)
9X OTHER (Use Numbers 90-99)
TOTAL AMOUNT $ 112,381,000
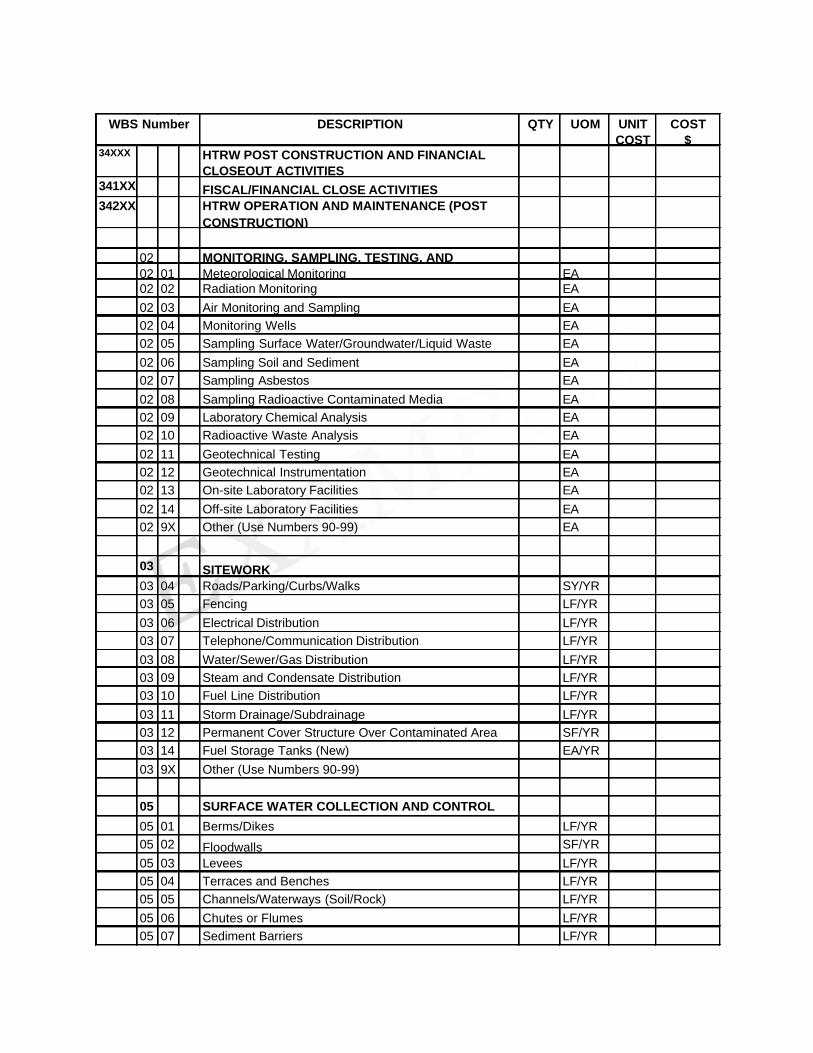
WBS Number DESCRIPTION QTY UOM UNIT COST
COST $
34XXX HTRW POST CONSTRUCTION AND FINANCIAL CLOSEOUT ACTIVITIES
341XX FISCAL/FINANCIAL CLOSE ACTIVITIES342XX HTRW OPERATION AND MAINTENANCE (POST
CONSTRUCTION)
02 MONITORING, SAMPLING, TESTING, AND 02 01 Meteorological Monitoring EA02 02 Radiation Monitoring EA02 03 Air Monitoring and Sampling EA02 04 Monitoring Wells EA02 05 Sampling Surface Water/Groundwater/Liquid Waste EA02 06 Sampling Soil and Sediment EA02 07 Sampling Asbestos EA02 08 Sampling Radioactive Contaminated Media EA02 09 Laboratory Chemical Analysis EA02 10 Radioactive Waste Analysis EA02 11 Geotechnical Testing EA02 12 Geotechnical Instrumentation EA02 13 On-site Laboratory Facilities EA02 14 Off-site Laboratory Facilities EA02 9X Other (Use Numbers 90-99) EA
03 SITEWORK03 04 Roads/Parking/Curbs/Walks SY/YR03 05 Fencing LF/YR03 06 Electrical Distribution LF/YR03 07 Telephone/Communication Distribution LF/YR03 08 Water/Sewer/Gas Distribution LF/YR03 09 Steam and Condensate Distribution LF/YR03 10 Fuel Line Distribution LF/YR03 11 Storm Drainage/Subdrainage LF/YR03 12 Permanent Cover Structure Over Contaminated Area SF/YR03 14 Fuel Storage Tanks (New) EA/YR03 9X Other (Use Numbers 90-99)
05 SURFACE WATER COLLECTION AND CONTROL05 01 Berms/Dikes LF/YR05 02 Floodwalls SF/YR05 03 Levees LF/YR05 04 Terraces and Benches LF/YR05 05 Channels/Waterways (Soil/Rock) LF/YR05 06 Chutes or Flumes LF/YR05 07 Sediment Barriers LF/YR
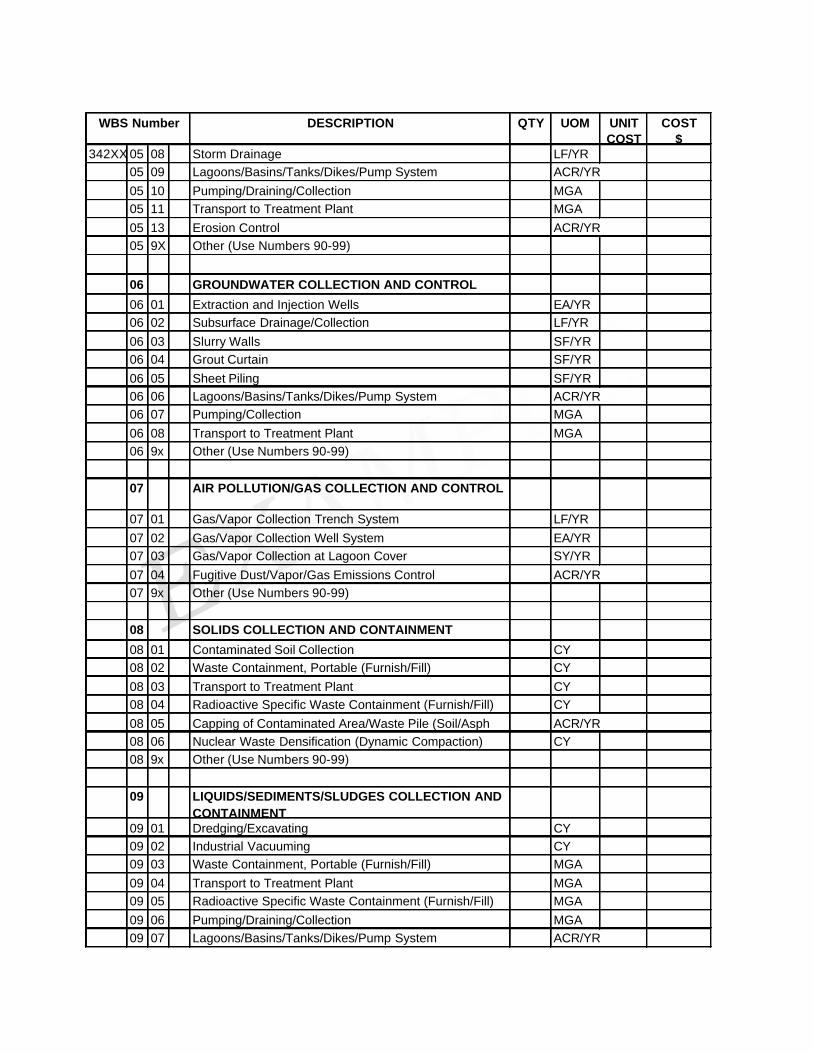
WBS Number DESCRIPTION QTY UOM UNIT COST
COST $
342XX 05 08 Storm Drainage LF/YR05 09 Lagoons/Basins/Tanks/Dikes/Pump System ACR/YR05 10 Pumping/Draining/Collection MGA05 11 Transport to Treatment Plant MGA05 13 Erosion Control ACR/YR05 9X Other (Use Numbers 90-99)
06 GROUNDWATER COLLECTION AND CONTROL06 01 Extraction and Injection Wells EA/YR06 02 Subsurface Drainage/Collection LF/YR06 03 Slurry Walls SF/YR06 04 Grout Curtain SF/YR06 05 Sheet Piling SF/YR06 06 Lagoons/Basins/Tanks/Dikes/Pump System ACR/YR06 07 Pumping/Collection MGA06 08 Transport to Treatment Plant MGA06 9x Other (Use Numbers 90-99)
07 AIR POLLUTION/GAS COLLECTION AND CONTROL
07 01 Gas/Vapor Collection Trench System LF/YR07 02 Gas/Vapor Collection Well System EA/YR07 03 Gas/Vapor Collection at Lagoon Cover SY/YR07 04 Fugitive Dust/Vapor/Gas Emissions Control ACR/YR07 9x Other (Use Numbers 90-99)
08 SOLIDS COLLECTION AND CONTAINMENT 08 01 Contaminated Soil Collection CY08 02 Waste Containment, Portable (Furnish/Fill) CY08 03 Transport to Treatment Plant CY08 04 Radioactive Specific Waste Containment (Furnish/Fill) CY08 05 Capping of Contaminated Area/Waste Pile (Soil/Asph ACR/YR08 06 Nuclear Waste Densification (Dynamic Compaction) CY08 9x Other (Use Numbers 90-99)
09 LIQUIDS/SEDIMENTS/SLUDGES COLLECTION AND CONTAINMENT
09 01 Dredging/Excavating CY09 02 Industrial Vacuuming CY09 03 Waste Containment, Portable (Furnish/Fill) MGA09 04 Transport to Treatment Plant MGA09 05 Radioactive Specific Waste Containment (Furnish/Fill) MGA09 06 Pumping/Draining/Collection MGA09 07 Lagoons/Basins/Tanks/Dikes/Pump System ACR/YR
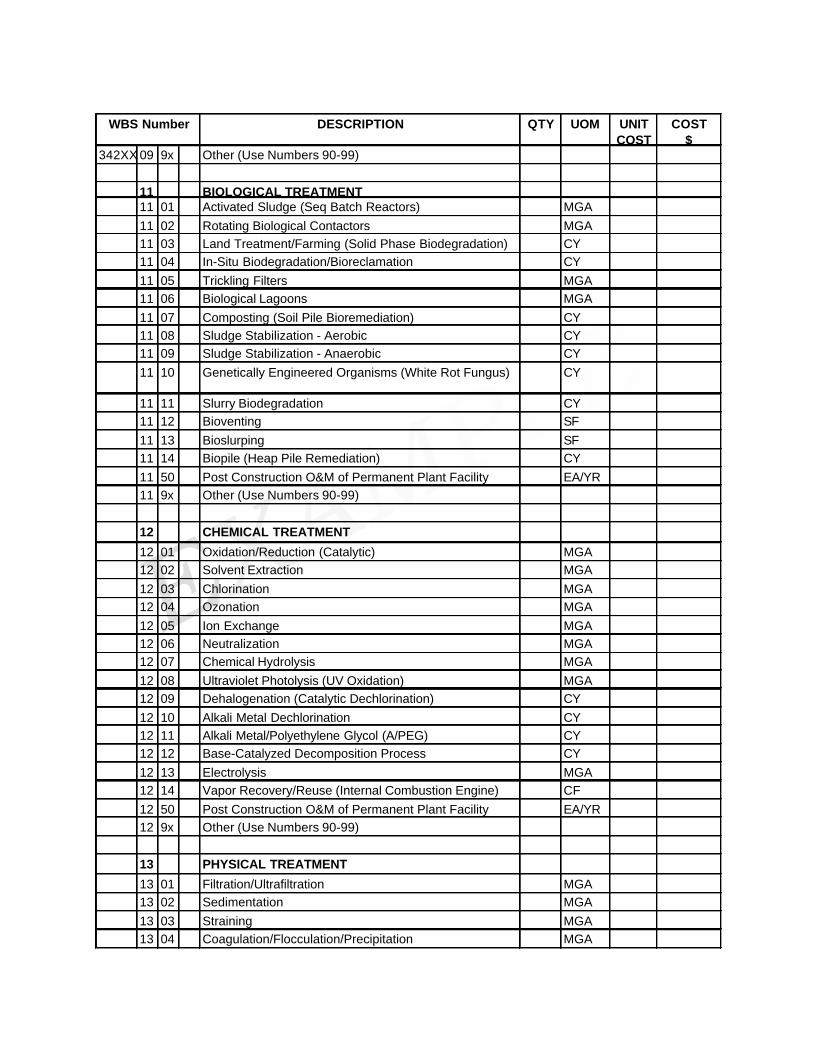
WBS Number DESCRIPTION QTY UOM UNIT COST
COST $
342XX 09 9x Other (Use Numbers 90-99)
11 BIOLOGICAL TREATMENT 11 01 Activated Sludge (Seq Batch Reactors) MGA11 02 Rotating Biological Contactors MGA11 03 Land Treatment/Farming (Solid Phase Biodegradation) CY11 04 In-Situ Biodegradation/Bioreclamation CY11 05 Trickling Filters MGA11 06 Biological Lagoons MGA11 07 Composting (Soil Pile Bioremediation) CY11 08 Sludge Stabilization - Aerobic CY11 09 Sludge Stabilization - Anaerobic CY11 10 Genetically Engineered Organisms (White Rot Fungus) CY
11 11 Slurry Biodegradation CY11 12 Bioventing SF11 13 Bioslurping SF11 14 Biopile (Heap Pile Remediation) CY 11 50 Post Construction O&M of Permanent Plant Facility EA/YR11 9x Other (Use Numbers 90-99)
12 CHEMICAL TREATMENT12 01 Oxidation/Reduction (Catalytic) MGA12 02 Solvent Extraction MGA12 03 Chlorination MGA12 04 Ozonation MGA12 05 Ion Exchange MGA12 06 Neutralization MGA12 07 Chemical Hydrolysis MGA12 08 Ultraviolet Photolysis (UV Oxidation) MGA12 09 Dehalogenation (Catalytic Dechlorination) CY12 10 Alkali Metal Dechlorination CY12 11 Alkali Metal/Polyethylene Glycol (A/PEG) CY12 12 Base-Catalyzed Decomposition Process CY12 13 Electrolysis MGA12 14 Vapor Recovery/Reuse (Internal Combustion Engine) CF12 50 Post Construction O&M of Permanent Plant Facility EA/YR12 9x Other (Use Numbers 90-99)
13 PHYSICAL TREATMENT13 01 Filtration/Ultrafiltration MGA13 02 Sedimentation MGA13 03 Straining MGA13 04 Coagulation/Flocculation/Precipitation MGA
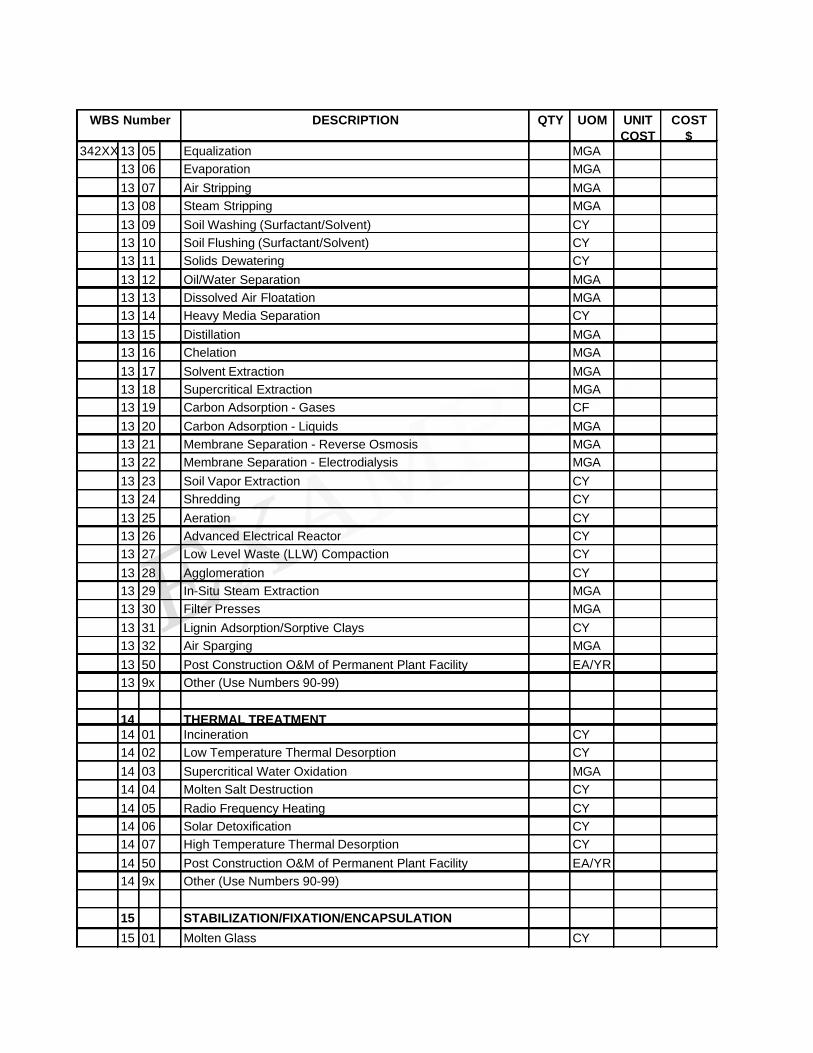
WBS Number DESCRIPTION QTY UOM UNIT COST
COST $
342XX 13 05 Equalization MGA13 06 Evaporation MGA13 07 Air Stripping MGA13 08 Steam Stripping MGA13 09 Soil Washing (Surfactant/Solvent) CY13 10 Soil Flushing (Surfactant/Solvent) CY13 11 Solids Dewatering CY13 12 Oil/Water Separation MGA13 13 Dissolved Air Floatation MGA13 14 Heavy Media Separation CY13 15 Distillation MGA13 16 Chelation MGA13 17 Solvent Extraction MGA13 18 Supercritical Extraction MGA13 19 Carbon Adsorption - Gases CF13 20 Carbon Adsorption - Liquids MGA13 21 Membrane Separation - Reverse Osmosis MGA13 22 Membrane Separation - Electrodialysis MGA13 23 Soil Vapor Extraction CY13 24 Shredding CY13 25 Aeration CY13 26 Advanced Electrical Reactor CY13 27 Low Level Waste (LLW) Compaction CY13 28 Agglomeration CY13 29 In-Situ Steam Extraction MGA13 30 Filter Presses MGA13 31 Lignin Adsorption/Sorptive Clays CY13 32 Air Sparging MGA13 50 Post Construction O&M of Permanent Plant Facility EA/YR13 9x Other (Use Numbers 90-99)
14 THERMAL TREATMENT 14 01 Incineration CY14 02 Low Temperature Thermal Desorption CY14 03 Supercritical Water Oxidation MGA14 04 Molten Salt Destruction CY14 05 Radio Frequency Heating CY14 06 Solar Detoxification CY14 07 High Temperature Thermal Desorption CY14 50 Post Construction O&M of Permanent Plant Facility EA/YR14 9x Other (Use Numbers 90-99)
15 STABILIZATION/FIXATION/ENCAPSULATION15 01 Molten Glass CY
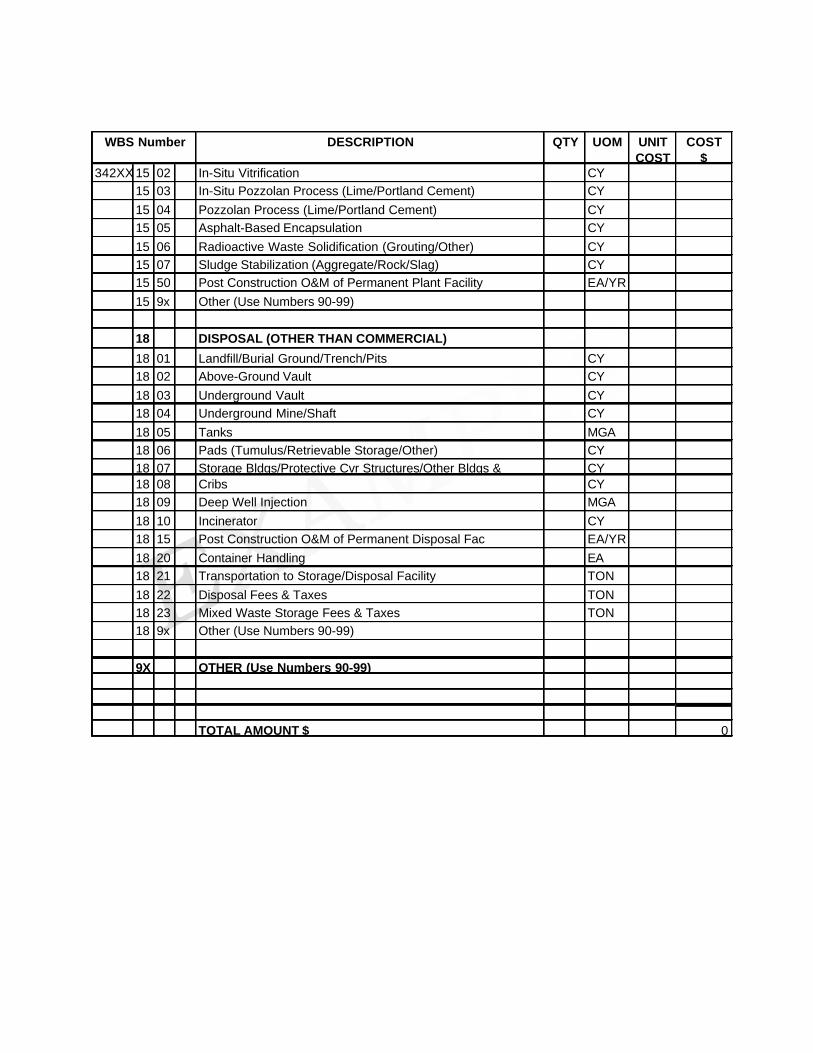
WBS Number DESCRIPTION QTY UOM UNIT COST
COST $
342XX 15 02 In-Situ Vitrification CY15 03 In-Situ Pozzolan Process (Lime/Portland Cement) CY15 04 Pozzolan Process (Lime/Portland Cement) CY15 05 Asphalt-Based Encapsulation CY15 06 Radioactive Waste Solidification (Grouting/Other) CY15 07 Sludge Stabilization (Aggregate/Rock/Slag) CY15 50 Post Construction O&M of Permanent Plant Facility EA/YR15 9x Other (Use Numbers 90-99)
18 DISPOSAL (OTHER THAN COMMERCIAL)18 01 Landfill/Burial Ground/Trench/Pits CY18 02 Above-Ground Vault CY18 03 Underground Vault CY18 04 Underground Mine/Shaft CY18 05 Tanks MGA18 06 Pads (Tumulus/Retrievable Storage/Other) CY18 07 Storage Bldgs/Protective Cvr Structures/Other Bldgs & CY 18 08 Cribs CY18 09 Deep Well Injection MGA18 10 Incinerator CY18 15 Post Construction O&M of Permanent Disposal Fac EA/YR18 20 Container Handling EA18 21 Transportation to Storage/Disposal Facility TON18 22 Disposal Fees & Taxes TON18 23 Mixed Waste Storage Fees & Taxes TON18 9x Other (Use Numbers 90-99)
9X OTHER (Use Numbers 90-99)
TOTAL AMOUNT $ 0
EP 1110-1-1930 Jun 01
C-1
APPENDIX CEXAMPLE REMEDIAL ACTION REPORT –
IN SITU SOIL AND GROUNDWATER REMEDIATION
NOTE:
The following example remedial action report is based on an actual Superfund site, but someinformation has been altered to illustrate the concepts of the guide. In addition, names have beenchanged to avoid confusion with the actual site.
Content and format of actual RA reports may vary from this example due to considerations suchas project lead and support roles, availability of information, and site-specific conditions. Theinformation presented in this example report (e.g., costs) should not necessarily be used as atechnical basis for completing remedial action at an actual site (e.g., as a source of costinformation).
I N T E R I MR E M E D I A L A C T I O N R E P O R T
LANDFILL 5 OPERABLE UNIT
FT. GRIFFEY, OHIO
September 2000
TABLE OF CONTENTS
Ft. Griffey Landfill 5 OU Interim RA Report i
Abstract............................................................................................................................................iii
Section 1 Introduction............................................................................................................ 1-1
Previous Investigations ........................................................................................ 1-1
Section 2 Operable Unit Background ..................................................................................... 2-1
Remedy Selection................................................................................................. 2-1
Section 3 Construction Activities........................................................................................... 3-1
Pilot System.......................................................................................................... 3-1Full-Scale System................................................................................................. 3-1
Section 4 Chronology of Events............................................................................................. 4-1
Section 5 Performance Standards and Construction Quality Control ..................................... 5-1
Performance Objectives ....................................................................................... 5-1Treatment Performance Data and Assessment ..................................................... 5-1
Groundwater Sampling............................................................................. 5-2Air Emissions Sampling........................................................................... 5-2
Performance Data Quality.................................................................................... 5-2
Section 6 Final Inspections and Certifications ....................................................................... 6-1
Inspections............................................................................................................ 6-1Certifications ........................................................................................................ 6-1Health and Safety................................................................................................. 6-1
Section 7 Operation and Maintenance Activities .................................................................... 7-1
Section 8 Summary of Project Costs...................................................................................... 8-1
Section 9 Observations and Lessons Learned....................................................................... 9-1
Performance ......................................................................................................... 9-1Cost ...................................................................................................................... 9-1System Operation................................................................................................. 9-2
Section 10 Operable Unit Contacts ........................................................................................ 10-1
Section 11 References........................................................................................................... 11-1
TABLE OF CONTENTS
Ft. Griffey Landfill 5 OU Interim RA Report ii
List of Appendices
Appendix A Cost and Performance FactorsAppendix B Project Costs
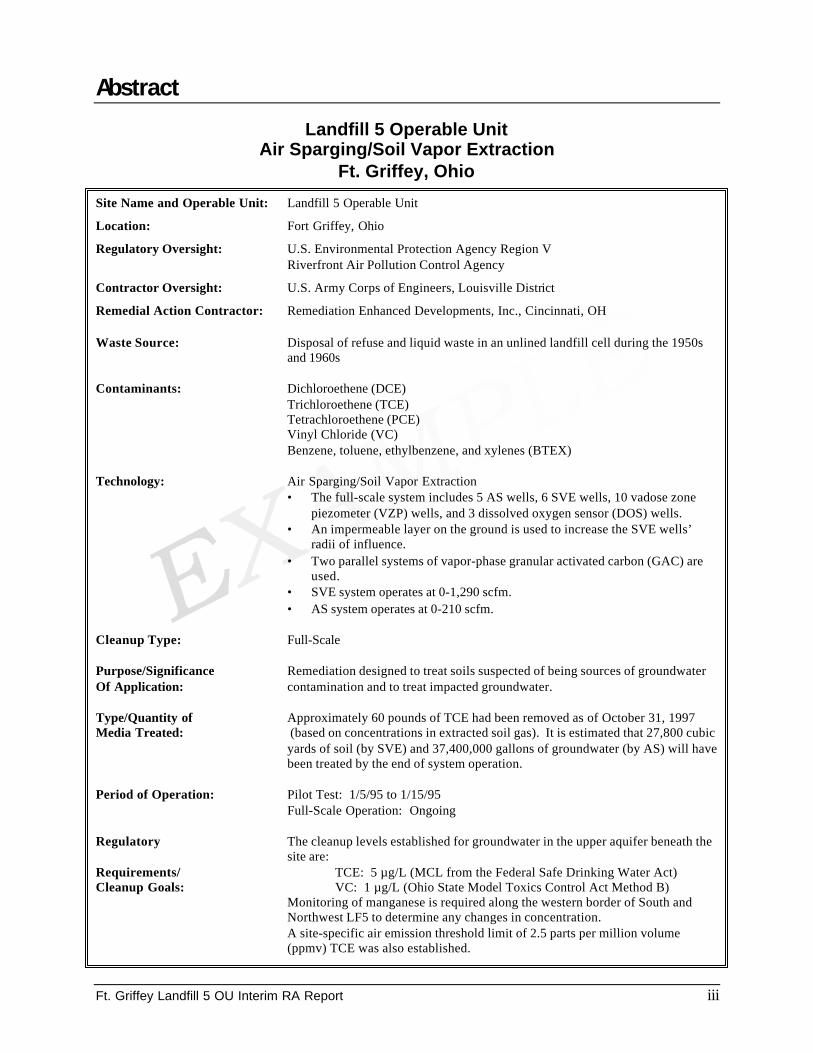
Abstract
Ft. Griffey Landfill 5 OU Interim RA Report iii
Landfill 5 Operable UnitAir Sparging/Soil Vapor Extraction
Ft. Griffey, OhioSite Name and Operable Unit: Landfill 5 Operable Unit
Location: Fort Griffey, Ohio
Regulatory Oversight: U.S. Environmental Protection Agency Region VRiverfront Air Pollution Control Agency
Contractor Oversight: U.S. Army Corps of Engineers, Louisville District
Remedial Action Contractor: Remediation Enhanced Developments, Inc., Cincinnati, OH
Waste Source: Disposal of refuse and liquid waste in an unlined landfill cell during the 1950sand 1960s
Contaminants: Dichloroethene (DCE)Trichloroethene (TCE)Tetrachloroethene (PCE)Vinyl Chloride (VC)Benzene, toluene, ethylbenzene, and xylenes (BTEX)
Technology: Air Sparging/Soil Vapor Extraction• The full-scale system includes 5 AS wells, 6 SVE wells, 10 vadose zone
piezometer (VZP) wells, and 3 dissolved oxygen sensor (DOS) wells.• An impermeable layer on the ground is used to increase the SVE wells’
radii of influence.• Two parallel systems of vapor-phase granular activated carbon (GAC) are
used.• SVE system operates at 0-1,290 scfm.• AS system operates at 0-210 scfm.
Cleanup Type: Full-Scale
Purpose/Significance Remediation designed to treat soils suspected of being sources of groundwaterOf Application: contamination and to treat impacted groundwater.
Type/Quantity of Approximately 60 pounds of TCE had been removed as of October 31, 1997Media Treated: (based on concentrations in extracted soil gas). It is estimated that 27,800 cubic
yards of soil (by SVE) and 37,400,000 gallons of groundwater (by AS) will havebeen treated by the end of system operation.
Period of Operation: Pilot Test: 1/5/95 to 1/15/95Full-Scale Operation: Ongoing
Regulatory The cleanup levels established for groundwater in the upper aquifer beneath thesite are:
Requirements/ TCE: 5 µg/L (MCL from the Federal Safe Drinking Water Act)Cleanup Goals: VC: 1 µg/L (Ohio State Model Toxics Control Act Method B)
Monitoring of manganese is required along the western border of South andNorthwest LF5 to determine any changes in concentration.A site-specific air emission threshold limit of 2.5 parts per million volume(ppmv) TCE was also established.

Abstract
Ft. Griffey Landfill 5 OU Interim RA Report iv
Landfill 5 Operable UnitAir Sparging/Soil Vapor Extraction
Ft. Griffey, Ohio
Results: The concentration of TCE in the soil gas extracted by the SVE system generally decreased from210 parts per billion by volume (ppbv) to 140 ppbv during the period of April 1, 1995 throughJuly 27, 1995. The extracted soil gas concentration then increased to a maximum of 640 ppbvduring the period of August 1, 1995 through December 27, 1999.
Costs: The total actual costs incurred for this project from Years 0-5 (1994-1999) are $1,852,104, with acapital cost of $729,294. The total project costs remaining are $2,111,483 (Years 6-15). Thetechnology-specific unit costs for soil vapor extraction and air sparging were calculated at $65.75per cubic yard and $18.83/1,000 gallons, respectively. These unit costs include both actual andprojected costs that are applicable to each technology.
Description: Ft. Griffey occupies approximately 86,000 acres along the northern bank of the Ohio River,approximately 12 miles from Cincinnati, Ohio. Ft. Griffey began operating in 1917 and currentlyserves as a military reservation. Ft. Griffey is divided by I-5 into North Ft. Griffey and the MainPost.
The RI, completed in 1993 by RED, under contract with USACE, Lousiville District, included anextensive landfill and soil gas survey and a groundwater investigation. The RI confirmed thepresence of chlorinated hydrocarbons and aromatic hydrocarbons contamination at LF5. Elevatedlevels of TCE, PCE, and DCE were detected in the soil. TCE, VC and BTEX contamination wasdetected in the groundwater. Elevated levels of Mn were also detected in the groundwater alongthe western borders of South and Northwest LF5. However, the RI attributes these elevated levelsto the dissolution of Mn from geologic materials in the area of LF5.
The full-scale system operation began when the startup activities were completed on July 29,1995. The full-scale system operation is currently ongoing. The concentration of TCE in the soilgas extracted by the SVE system generally decreased from 210 parts per billion by volume (ppbv)to 140 ppbv during the period of April 1, 1995 through July 27, 1995. The extracted soil gasconcentration then increased to a maximum of 640 ppbv during the period of August 1, 1995through December 27, 1999. This increase generally corresponds to the opening of the passiveinjection wells after July 29, 1995, suggesting that the use of the passive injection wells enhancedthe system’s performance.
SECTIONONE Introduction
Ft. Griffey Landfill 5 OU Interim RA Report 1-1
Ft. Griffey occupies approximately 86,000 acres along the northern bank of the Ohio River,approximately 12 miles from Cincinnati, Ohio. Ft. Griffey began operating in 1917 and currentlyserves as a military reservation. Ft. Griffey is divided by I-5 into North Ft. Griffey and the MainPost.
Landfill 5 (LF5) is located on North Ft. Griffey near Reese Lake and Reese Springs, which is theprimary drinking water supply for the fort. The 52 acre landfill is divided into three cells - South,Northeast, and Northwest - and is located adjacent to a gravel pit (Figure 1).
From the early 1950s to the late 1960s, LF5 was reportedly used for the disposal of refuse,including domestic and light industrial solid waste and construction debris, and for the disposalof liquid waste in unlined cells. In addition, LF5 was reportedly used as a gravel quarry in the1940s and for equipment storage and maintenance. After disposal activities ceased, the landfillwas covered with native materials such as sand, gravel and soil; the landfill is currently coveredwith trees and grass.
PREVIOUS INVESTIGATIONS
According to the 1993 remedial investigation (RI), there were no reports of hazardous wastedisposal in LF5. However, historical aerial photographs show two suspected liquid wastedisposal pits located in Northeast and South LF5 and evidence of equipment maintenanceactivities near Northeast LF5 . Tetrachloroethene (PCE) and trichloroethene (TCE) are suspectedof having been used in degreasing and equipment maintenance operations at Ft. Griffey; leaksand spills of solvents from maintenance operations on or near LF5 and disposal of solvents inunlined pits are the suspected sources of contamination.
In 1988, a limited site investigation of LF5 was conducted by Larkin Midwest Laboratory. Theinvestigation indicated that the shallow groundwater beneath the landfill was contaminated withchlorinated hydrocarbons, aromatic hydrocarbons, and manganese (Mn). While the data were notprovided in the available references, TCE was reported to have been found at concentrationsranging from 1 to 32 micrograms per liter (µg/L).
In 1991, Remediation Enhanced Developments, Inc. (RED) conducted several pre-RI activitiesunder contract with the U.S. Army Corps of Engineers (USACE) Louisville District including atest pit investigation, a passive soil gas survey, and a preliminary ecological assessment.According to RED, the results of these activities indicated that TCE and PCE were widelydistributed in the area of LF5.
The RI, completed in 1993 by RED, again under contract with USACE Louisville District,included a more extensive landfill and soil gas survey and a groundwater investigation. The RIconfirmed the presence of chlorinated hydrocarbons and aromatic hydrocarbons contamination atLF5. Elevated levels of TCE, PCE, and dichloroethene (DCE) were detected in the soil. TCE,vinyl chloride (VC) and benzene, toluene, ethylbenzene, and xylene (BTEX) contamination wasdetected in the groundwater. Elevated levels of Mn were also detected in the groundwater alongthe western borders of South and Northwest LF5. However, the RI attributes these elevatedlevels to the dissolution of Mn from geologic materials in the area of LF5.

SECTIONONE Introduction
Ft. Griffey Landfill 5 OU Interim RA Report 1-2
Low levels of BTEX were detected in the lower aquifer (<0.5 µg/L to 5.8 µg/L). However, TCE,DCE, VC, and PCE, while detected in the upper aquifer, were not detected in the lower aquifer.
Mn and iron were detected in both the upper and lower aquifers. The RI determined that theelevated levels of Mn were caused by dissolution of manganese from geologic material.
Results of groundwater quality indicator parameters measured during the RI, including increasedspecific conductance, dissolved metals and biochemical oxygen demand, indicated that lowlevels of metals and inorganic compounds were leaching from the landfill into the upper aquifer.However, the parameters were reported to rarely exceed five times their background levels.There was no evidence of leaching to the lower aquifer.

SECTIONONE Introduction
Ft. Griffey Landfill 5 OU Interim RA Report 1-3
FIGURE 1LANDFILL 5 – LOCATION OF CELLS
SECTIONTWO Operable Unit Background
Ft. Griffey Landfill 5 OU Interim RA Report 2-1
Based on the findings of the RI, the U.S. Environmental Protection Agency (USEPA), Region V,the U.S. Department of Defense (DoD), the Ohio Environmental Protection Agency (OEPA),and the USACE Louisville District negotiated a cleanup strategy and entered into a Federalfacility agreement under Section 120 of CERCLA to address the contamination at LF5. Theseparties agreed to address LF5 as a single operable unit (OU) and commissioned a feasibilitystudy (FS) in March 1993.
REMEDY SELECTION
In a record of decision (ROD) signed in October 1993, the remedy selected for LF5 included:
• Treatment of contaminated soils in areas that were suspected sources of groundwatercontamination (soil hot spots) using soil vapor extraction (SVE);
• Treatment of contaminated groundwater using air sparging (AS);
• Monitoring of the upper aquifer to determine the effectiveness of the selected remedy; and,
• Maintenance of institutional controls, including access restrictions.
The groundwater AS system was to operate in conjunction with the SVE system.
The ROD also required that Mn be monitored in the groundwater in the localized areas whereelevated levels were detected during the RI. The ROD specified that, if the results of themonitoring indicated that levels were not declining, then the need for remediation was to bereevaluated.
Including limited groundwater extraction and treatment in addition to AS/SVE was considered asan alternative remedy. However, AS/SVE was determined to be more cost effective thanAS/SVE plus groundwater extraction and treatment while still being protective of human healthand the environment.
The ROD specified four objectives for the remedy:• To prevent exposure to contaminated groundwater;
• To restore the contaminated groundwater to its beneficial use (drinking water);
• To minimize movement of contaminants from soil to groundwater; and,
• To prevent exposure to the contents of the landfill.
No soil cleanup levels were identified. The cleanup levels established for groundwater in theupper aquifer beneath the site were:• TCE - 5 µg/L - the Federal Safe Drinking Water Act maximum contaminant level (MCL);
• VC - 1 µg/L - the Ohio State Model Toxics Control Act Method B.

SECTIONTWO Operable Unit Background
Ft. Griffey Landfill 5 OU Interim RA Report 2-2
Monitoring of Mn was required along the western border of South and Northwest LF5 todetermine any changes in concentration.
The remedial design (RD) for the AS/SVE system was completed in nine months and approvedby USEPA October 5, 1994, for implementation of the remedial action.
SECTIONTHREE Construction Activities
Ft. Griffey Landfill 5 OU Interim RA Report 3-1
The AS/SVE system was constructed between October 19 and December 29, 1994. Details ofthe system’s construction are discussed below. Appendix A presents matrix characteristics andoperating parameters.
PILOT SYSTEM
The pilot system used in this application consisted of one AS well, three SVE wells, ten vadosezone piezometer (VZP) wells, two groundwater monitoring wells, and three dissolved oxygensensor (DOS) wells, as well as an impermeable plastic cover for the ground surface and wellmonitoring equipment. The AS and SVE wells were located near monitoring well LF5-MW8A,from which groundwater samples with the highest recorded TCE concentrations in the projectarea had been collected.
The AS well was used to inject clean air into the aquifer, using an above-ground blower, to stripvolatile contaminants from the aquifer into the soil in the subsurface at the site. Dissolvedoxygen (DO) concentrations in the aquifer were measured during AS using DOS wells. The DOresults were used to estimate the radius of influence of the AS well during the pilot test. TheSVE wells were used to extract volatile contaminants from the subsurface soil, and the VZPwells were used to measure the radius of influence of the SVE wells.
The impermeable plastic cover was used to enhance the radius of influence for the SVE wells bymoving the air recharge boundary a greater distance from the SVE wells. The cover wasconstructed of a 20-millimeter (mil) thick layer of very low density polyethylene (VLDPE) andlaid down over a cleared area. The cover had a radius of approximately 200 feet, and wascovered with 4 to 6-inches of gravel to assure tight contact with the ground surface, and to allowfor light vehicular traffic (pickup trucks) over the cover. All wells were drilled using a 4-inchinner diameter (ID) hollow stem auger.
Operation of the pilot system consisted of a SVE pilot test and a combined AS/SVE pilot test.
FULL-SCALE SYSTEM
The full-scale system used in this application consisted of five AS wells, six SVE wells, ten VZPwells, three groundwater monitoring wells, three DOS wells, four passive injection wells, andassociated well-monitoring equipment. The passive injection wells were positioned wheremodeling results showed significant stagnation zones when two adjacent SVE wells wereoperated at the same time. The full-scale system also used the same impermeable plastic coverfor the ground surface that was used in the pilot system. Two parallel systems of vapor-phasegranular activated carbon (GAC) were used in the full-scale system.
Extracted vapors were first treated using a moisture (water/vapor) separator to remove entrainedwater, and then treated using activated carbon filter canisters (GAC), prior to discharge to theatmosphere.
The AS system consisted of an inlet particulate filter, compressor, moisture separator, and flowcontrol valve.
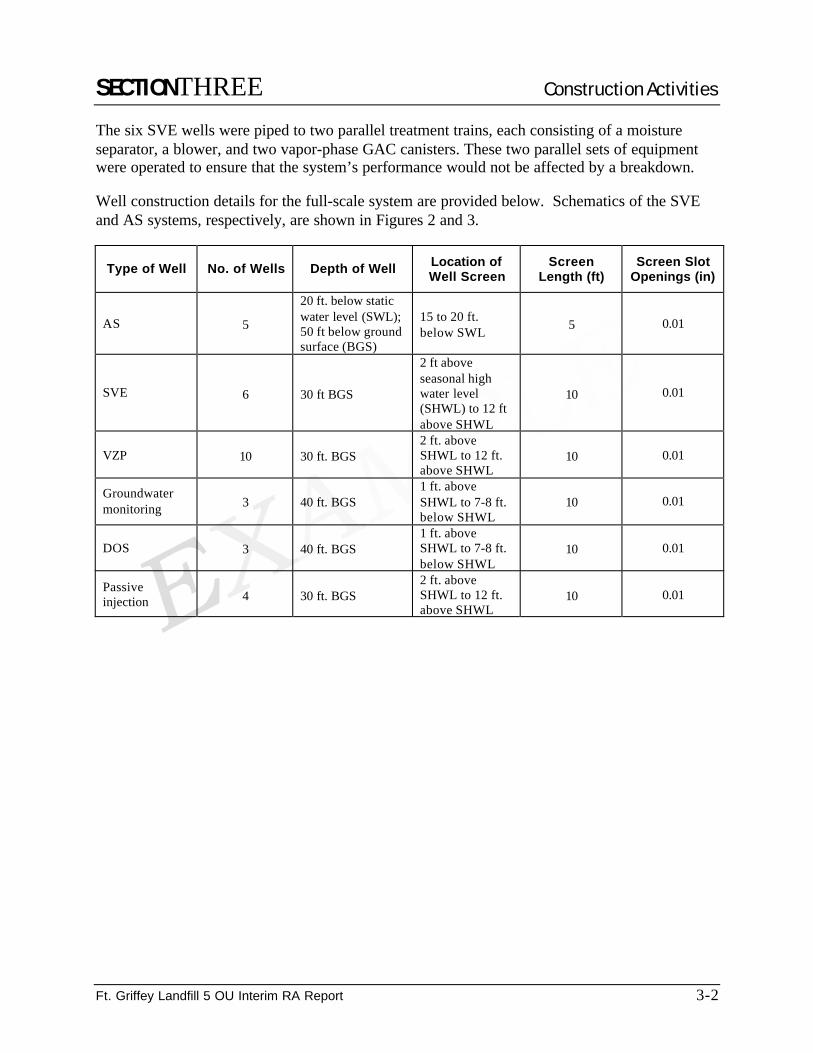
SECTIONTHREE Construction Activities
Ft. Griffey Landfill 5 OU Interim RA Report 3-2
The six SVE wells were piped to two parallel treatment trains, each consisting of a moistureseparator, a blower, and two vapor-phase GAC canisters. These two parallel sets of equipmentwere operated to ensure that the system’s performance would not be affected by a breakdown.
Well construction details for the full-scale system are provided below. Schematics of the SVEand AS systems, respectively, are shown in Figures 2 and 3.
Type of Well No. of Wells Depth of Well Location ofWell Screen
ScreenLength (ft)
Screen SlotOpenings (in)
AS 5
20 ft. below staticwater level (SWL);50 ft below groundsurface (BGS)
15 to 20 ft.below SWL 5 0.01
SVE 6 30 ft BGS
2 ft aboveseasonal highwater level(SHWL) to 12 ftabove SHWL
10 0.01
VZP 10 30 ft. BGS2 ft. aboveSHWL to 12 ft.above SHWL
10 0.01
Groundwatermonitoring 3 40 ft. BGS
1 ft. aboveSHWL to 7-8 ft.below SHWL
10 0.01
DOS 3 40 ft. BGS1 ft. aboveSHWL to 7-8 ft.below SHWL
10 0.01
Passiveinjection 4 30 ft. BGS
2 ft. aboveSHWL to 12 ft.above SHWL
10 0.01
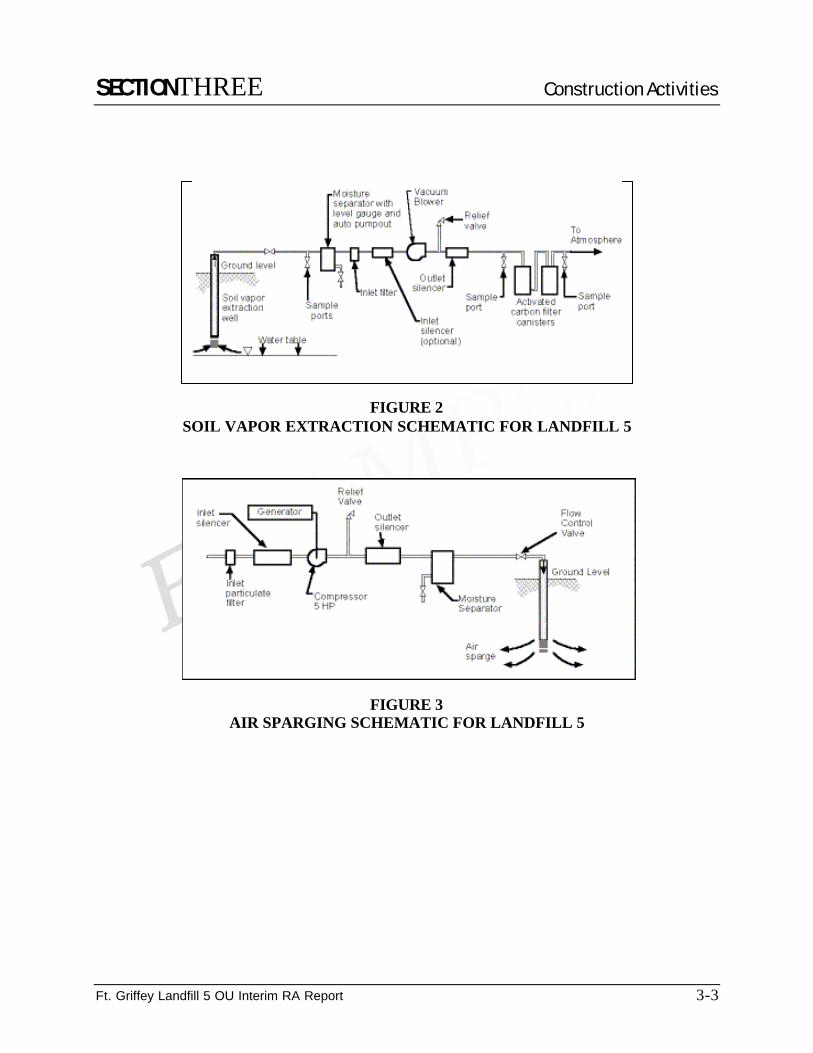
SECTIONTHREE Construction Activities
Ft. Griffey Landfill 5 OU Interim RA Report 3-3
FIGURE 2SOIL VAPOR EXTRACTION SCHEMATIC FOR LANDFILL 5
FIGURE 3AIR SPARGING SCHEMATIC FOR LANDFILL 5

SECTIONFOUR Chronology of Events
Ft. Griffey Landfill 5 OU Interim RA Report 4-1
The following table includes the dates of the most significant events in the operation of theAS/SVE system at LF5.
Date Activity
October 15, 1993 Record of decision signed
July 13, 1994 Remedial design submitted
October 5, 1994 Remedial design approved
October 19, 1994 Construction of the AS/SVE system began
December 29, 1994 Construction of the AS/SVE system completed
January 5-15, 1995 AS/SVE pilot test conducted at LF5
April 1, 1995 AS/SVE startup activities at LF5
July 29, 1995 Preliminary closeout report signed for site construction completion
September 4, 1995 Operating Properly and Successfully determination made
December 7, 1999 Data collection for Chemical Data Report #5 completed
December 27, 1999USEPA, DoD, OEPA, and USACE representatives participated in the contractpre-final inspection and the Federal facilities agreement inspection, heldsimultaneously
Ongoing AS/SVE full-scale operation
SECTIONFIVE Performance Standards and Construction Quality Control
Ft. Griffey Landfill 5 OU Interim RA Report 5-1
The overall performance of the AS/SVE system, as compared to the performance objectives, isdiscussed below.
PERFORMANCE OBJECTIVES
The ROD specified four objectives for the remedy:
• To prevent exposure to contaminated groundwater;
• To restore the contaminated groundwater to its beneficial use (drinking water);
• To minimize movement of contaminants from soil to groundwater; and,
• To prevent exposure to the contents of the landfill.
No soil cleanup levels were identified. The cleanup levels established for groundwater in theupper aquifer beneath the site were:
• TCE - 5 µg/L - the Federal Safe Drinking Water Act MCL
• VC - 1 µg/L - the Ohio State Model Toxics Control Act Method B
Monitoring of Mn was required along the western border of South and Northwest LF5 todetermine any changes in concentration.
A site-specific air emission threshold limit of 2.5 parts per million volume (ppmv) TCE wascalculated by USACE using Screen Model 3 and the Riverfront Air Pollution Control Agency(RAPCA) acceptable source impact levels. The air stream between the first and second carboncanisters is monitored every other week using a photoionization detector (PID). The PIDbreakthrough action level is 1.5 ppmv total VOCs. The breakthrough action level is used todetermine when the first carbon bed needs to be removed from service.
To assess the overall performance of the system, performance monitoring is required throughoutthe operation of the system. The specific requirements are detailed in the compliance monitoringplan and include contaminant reduction monitoring to evaluate progress towards achieving thecleanup goals, contaminant migration monitoring to confirm that the plume is being contained,and contaminant treatment monitoring for air emissions.
TREATMENT PERFORMANCE DATA AND ASSESSMENT
The full-scale system operation began when the startup activities were completed on July 29,1995. The full-scale system operation is currently ongoing. Performance data throughDecember 7, 1999 were included in Chemical Data Report #5, which was the most recentdocument used in preparation of this report.
In general, the SVE system was operated between 0 and 1,290 standard cubic feet per minute(scfm) extracted, and the air sparging system was operated at between 0 and 210 scfm injected.The passive air injection wells initially remained closed from April 1, 1995 and July 29, 1995,
SECTIONFIVE Performance Standards and Construction Quality Control
Ft. Griffey Landfill 5 OU Interim RA Report 5-2
after which they were opened. It was determined that the passive injection wells should remainopen unless a detrimental effect could be demonstrated.
The concentration of TCE in the soil gas extracted by the SVE system generally decreased from210 parts per billion by volume (ppbv) to 140 ppbv during the period of April 1, 1995 throughJuly 27, 1995. The extracted soil gas concentration then increased to a maximum of 640 ppbvduring the period of August 1, 1995 through December 27, 1999. This increase generallycorresponds to the opening of the passive injection wells after July 29, 1995, suggesting that theuse of the passive injection wells enhanced the system’s performance.
Groundwater Sampling
Twenty-two rounds of groundwater sampling have been conducted (two before the remediationsystem was installed and four times per year for five years after the system’s installation). Thefirst round of sampling was performed during March 1994 and the last round for which data wasavailable was performed in December 1999.
TCE was the only contaminant in groundwater consistently identified above the cleanup levelsestablished for the site. In addition, monitoring for Mn was required.
The average TCE concentration in the contaminant reduction monitoring wells has decreasedfrom 79 to 6.4 mg/L from March 1994 to December 1999, while the average TCE concentrationin the migration monitoring wells has showed no consistent trend (average concentrations haveranged from 3.78 to 12.03 mg/L). TCE concentrations in both areas were still above the sitecleanup level of 5 mg/L in December 1999.
The average total Mn concentration in the contaminant reduction monitoring wells has decreasedfrom 11,000 mg/L in March 1994 to 8.0 mg/L in December 1999, while the average Mnconcentration in the migration monitoring wells has generally decreased from 488.0 to40.0 mg/L) during the same time period.
Vinyl chloride, the other contaminant with a cleanup level for the site, was only detected abovemethod detection limits on one occasion (March 1997)and was never detected above site cleanuplevels.
Air Emissions Sampling
Based upon the system performance testing of the AS/SVE system, the air effluent from thesystem was determined to be several magnitudes below the RAPCA emission action levels.Therefore, because the RAPCA emission action levels would not be exceeded during the SVEsystem’s operation, additional air sampling was not required.
PERFORMANCE DATA QUALITY
According to the technical memorandum on the results of the pilot study, the required QA/QCsamples were collected. Field duplicates, field blanks, rinsate blanks, and travel blanks were

SECTIONFIVE Performance Standards and Construction Quality Control
Ft. Griffey Landfill 5 OU Interim RA Report 5-3
required in the final management plan for the LF5 pilot study for QA/QC of the field studysampling program. Method blanks, reagent blanks, matrix spike samples, matrix spikeduplicates, duplicates, and laboratory control samples were required for laboratory QA/QC. Noexceptions to the QA/QC procedures were noted in any of the field sampling or laboratoryreports.
With the exception of DO data from the second quarter of 1996, no significant data qualityproblems were identified. This DO data were determined to be unacceptable as a result ofsignificant fluctuations measured from the sensors. The problem did not reoccur in any of thesubsequent sampling data.
SECTIONSIX Final Inspections and Certifications
Ft. Griffey Landfill 5 OU Interim RA Report 6-1
INSPECTIONS
The pre-final and the Federal facilities agreement inspections of the AS/SVE system constructionwere conducted simultaneously on December 27, 1999, in the presence of USEPA, DoD, OEPA,and USACE representatives.
Observations, inspections, and testing during operation of the AS/SVE treatment system foundno significant operational problems affecting the performance of the remedial action.
CERTIFICATIONS
On September 4, 1995, the AS/SVE system was certified as Operating Properly andSuccessfully. This determination was required under the Federal facilities agreement.
HEALTH AND SAFETY
No health and safety problems were encountered during construction or operation. ModifiedLevel D personal protective equipment (PPE) was required for all site personnel who entered thesite. The equipment included coveralls, safety boots, and nitrile gloves.

SECTIONSEVEN Operation and Maintenance Activities
Ft. Griffey Landfill 5 OU Interim RA Report 7-1
The quarterly groundwater monitoring program began in March 1994. TCE concentrations inboth areas were still above the site cleanup level of 5 mg/L in December 1999. The average totalMn concentration in the contaminant reduction monitoring wells has decreased from11,000 mg/L in March 1994 to 8.0 mg/L in December 1999, while the average Mn concentrationin the migration monitoring wells has generally decreased from 488.0 to 40.0 mg/L) during thesame time period. Vinyl chloride, the other contaminant with a cleanup level for the site, wasonly detected above method detection limits on one occasion and was never detected above sitecleanup levels.
It is anticipated, based on the effectiveness of the AS/SVE system, that the site cleanup level of5 mg/L for TCE concentrations will be attained for all monitoring wells in approximately 2002(Year 7). As specified in the ROD, after this objective has been achieved the AS/SVE systemwill continue to operate for an additional 3 months to ensure that the site has been remediated.
As specified in the ROD, the quarterly monitoring of groundwater will continue through 2009(Year 15) to confirm that groundwater will not be adversely impacted by the land treatmentactivities.
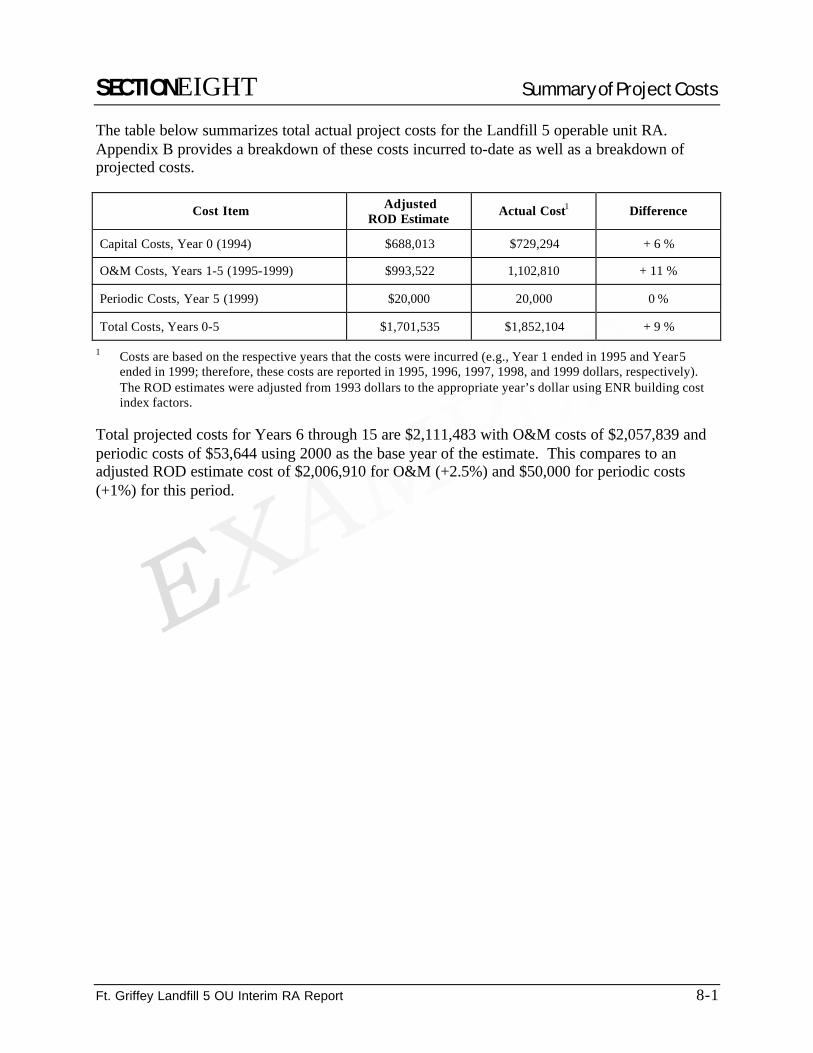
SECTIONEIGHT Summary of Project Costs
Ft. Griffey Landfill 5 OU Interim RA Report 8-1
The table below summarizes total actual project costs for the Landfill 5 operable unit RA.Appendix B provides a breakdown of these costs incurred to-date as well as a breakdown ofprojected costs.
Cost Item AdjustedROD Estimate Actual Cost1 Difference
Capital Costs, Year 0 (1994) $688,013 $729,294 + 6 %
O&M Costs, Years 1-5 (1995-1999) $993,522 1,102,810 + 11 %
Periodic Costs, Year 5 (1999) $20,000 20,000 0 %
Total Costs, Years 0-5 $1,701,535 $1,852,104 + 9 %
1 Costs are based on the respective years that the costs were incurred (e.g., Year 1 ended in 1995 and Year 5ended in 1999; therefore, these costs are reported in 1995, 1996, 1997, 1998, and 1999 dollars, respectively).The ROD estimates were adjusted from 1993 dollars to the appropriate year’s dollar using ENR building costindex factors.
Total projected costs for Years 6 through 15 are $2,111,483 with O&M costs of $2,057,839 andperiodic costs of $53,644 using 2000 as the base year of the estimate. This compares to anadjusted ROD estimate cost of $2,006,910 for O&M (+2.5%) and $50,000 for periodic costs(+1%) for this period.

SECTIONNINE Observations and Lessons Learned
Ft. Griffey Landfill 5 OU Interim RA Report 9-1
PERFORMANCE
During the operation of the treatment system in SVE-only mode, TCE concentrations werereduced from initial concentrations of 235 ppb to 110 ppb. The addition of AS to the systemreduced TCE concentrations in the soil gas from initial concentrations of 110 ppb to 56 ppb.
The AS/SVE system reduced TCE concentrations in groundwater. At the three wells located nearsuspected hot spots of contamination, TCE concentrations were reduced from 310 ppb to170 ppb (DOS-1), from 220 ppb to 170 ppb (DOS-2), and from 140 ppb to 23 ppb (MW8A).However, the concentrations remained above the cleanup goal of 5 ppb for TCE.
The results of Mn sampling before and after sparging indicated that Mn levels decreased in six ofthe eleven wells samples, but increased in five of the wells.
The following observations were made in a technical memorandum summarizing the system’soperation.• With respect to optimal air extraction rate, an extraction rate of 110 scfm is likely to capture
all volatilized contaminants within about 200 feet of each extraction well.• The radius of influence of an air injection well is about 20-30 feet.
• A pressure of approximately 8 psi was required to overcome resistance in the injection well.However, at injection pressures above 8 psi, air bubbles would be more likely to occur. At8 psi, the air injection rate into the aquifer was about 45 scfm. The 45 scfm (8 psi pressure)was determined to be the optimal flow rate, reflecting site and conditions of injections 12 feetbelow static water level. The vendor noted that changes in depth of the injection well willaffect the injection pressure and radius of influence.
• The major problem encountered during the pilot test was that the SVE vacuum pump did notproduce a vacuum sufficient to be detected by the automated sensors. Because of scheduleconstraints, a larger blower could not be obtained. However, according to the vendor,adequate data was obtained from the pilot test to design the full-scale system.
While overall TCE concentrations decreased in the groundwater, there were several instanceswhen TCE concentrations increased during operation. These increases may be attributed to thenew source material (from contaminated soil) infiltrating into the groundwater.
COST
The total cost for the pilot study of the AS/SVE system at LF5 was $241,000. This amount isnot included in the amounts shown in Table 8-1.
Differences between the actual costs and the adjusted ROD estimates are largely attributable tothe installation of passive injections wells, a SVE system capable of sustaining a 600 scfmaverage volumetric airflow rate, and additional groundwater monitoring wells, and the increasedgroundwater sampling costs associated with the additional wells. However, as shown in

SECTIONNINE Observations and Lessons Learned
Ft. Griffey Landfill 5 OU Interim RA Report 9-2
Table 8-1, the actual costs that have been incurred to this point were just 9% above thecorresponding, adjusted ROD estimate.
Subsequent to original negotiations, the contaminant concentrations in system air emissions weredetermined to be significantly below the allowable air emission standards, and RAPCA agreed toallow USACE to eliminate the need to change the carbon units from the system and to reduce aircompliance monitoring requirements. USACE is planning to reallocate money from any savingson air compliance monitoring to increase the number of system performance air tests.
Because the system operation is ongoing, the total costs to operate the system are not known atthis time. Actual costs to date are shown in Table B-1, and projected additional cost to completeis shown in Table B-2.
SYSTEM OPERATION
The emphasis of vapor data collection in the future should shift to the individual extraction wellsrather than the combined extracted flow. In the fifth quarter of the full-scale operation, quarterlyvapor sampling from the individual wells was initiated.
Based on the testing of the untreated and the treated condensate removed by the remediationsystem, the potential life of the aqueous-phase carbon units was estimated to be in excess of tenmillion gallons.
An SVE system flow rate of less than the design maximum flow rate may be more efficient forTCE removal than continuous operation at the maximum flow rate. The vendor recommendedthat the system be evaluated at moderate SVE system flow rates during the ongoing optimizationof the system.
The data supports the remedial investigation findings that numerous TCE hot spots exist at thesite, and that the presence of TCE (and/or its degradation products) at one location may or maynot be related to its presence at other locations at the site.
Studying the natural degradation of the leachate at the site may provide a more widespreadpicture of the fate of contamination at the site than focusing on the natural attenuation ofchlorinated hydrocarbons alone.
Although the impact of the AS system on the degradation of TCE at the site had not beenconclusively determined, it was recommended that the AS system continued to be operated untilan impact/ benefit analysis for the system is completed.
Because one of the contaminant reduction monitoring wells upgradient of the remediation systemhad maintained an elevated concentration of TCE, a TCE hot spot may be located upgradient ofthis location beyond the influence of the remediation system. An additional AS/SVE well paircould be added to this area to increase the reach of the remediation system.

SECTIONNINE Observations and Lessons Learned
Ft. Griffey Landfill 5 OU Interim RA Report 9-3
The concentrations of contaminants downgradient from the treatment system may remain abovethe cleanup levels for the site, even if contaminant concentrations are reduced to below cleanuplevels in the treatment system area.
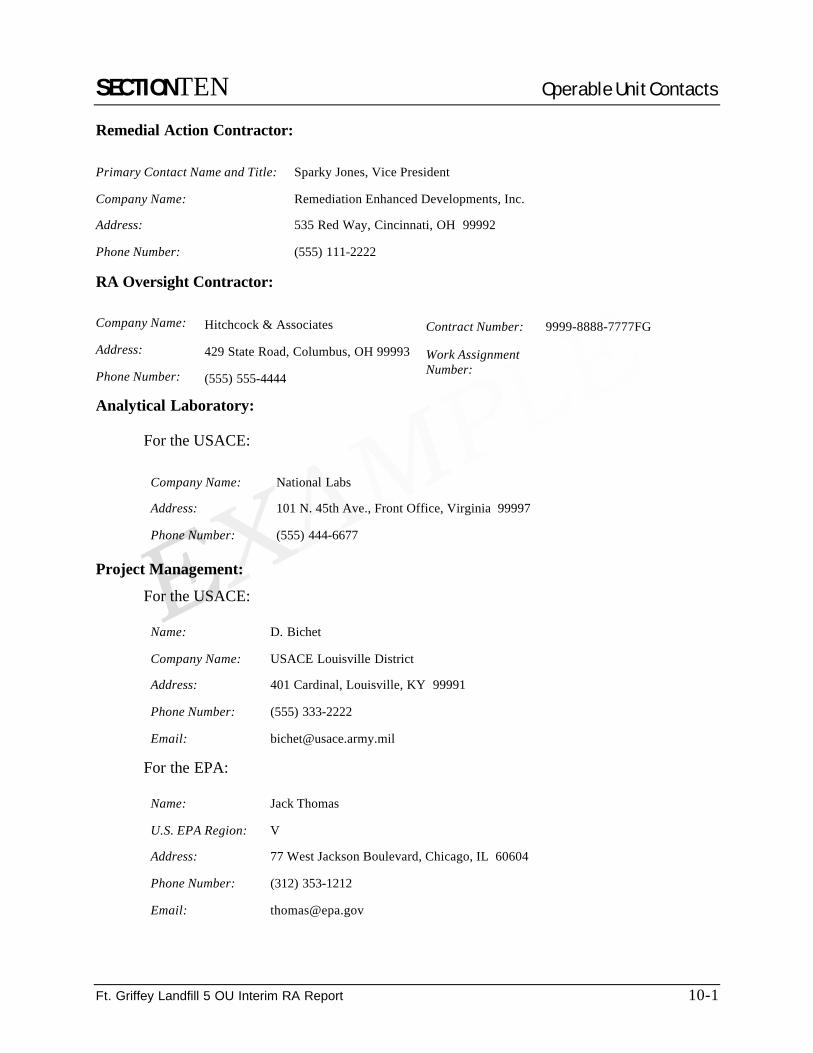
SECTIONTEN Operable Unit Contacts
Ft. Griffey Landfill 5 OU Interim RA Report 10-1
Remedial Action Contractor:
Primary Contact Name and Title: Sparky Jones, Vice President
Company Name: Remediation Enhanced Developments, Inc.
Address: 535 Red Way, Cincinnati, OH 99992
Phone Number: (555) 111-2222
RA Oversight Contractor:
Company Name: Hitchcock & Associates Contract Number: 9999-8888-7777FG
Address: 429 State Road, Columbus, OH 99993
Phone Number: (555) 555-4444
Work AssignmentNumber:
Analytical Laboratory:
For the USACE:
Company Name: National Labs
Address: 101 N. 45th Ave., Front Office, Virginia 99997
Phone Number: (555) 444-6677
Project Management:
For the USACE:
Name: D. Bichet
Company Name: USACE Louisville District
Address: 401 Cardinal, Louisville, KY 99991
Phone Number: (555) 333-2222
Email: [email protected]
For the EPA:
Name: Jack Thomas
U.S. EPA Region: V
Address: 77 West Jackson Boulevard, Chicago, IL 60604
Phone Number: (312) 353-1212
Email: [email protected]

SECTIONELEVEN References
Ft. Griffey Landfill 5 OU Interim RA Report 11-1
1. D. Bichet, USACE. 1998. Response to questions on LF5 cost data. January 9.
2. Remediation Enhanced Developments, Inc. 1993. Final Feasibility Study Report, Landfill 5and Solvent Refined Coal Pilot Plant, Ft. Griffey, Ohio. Prepared for USACE, LouisvilleDistrict. May.
3. Remediation Enhanced Developments, Inc. 1994. AS/SVE Remedial Design, Landfill 5Remediation, Ft. Griffey, Ohio. For USACE Contract No. DACA99-99-Z-9999-99. July 13.
4. Remediation Enhanced Developments, Inc. 1995. Preliminary Closeout Report, Landfill 5Remediation, Ft. Griffey, Ohio. For USACE Contract No. DACA99-99-Z-9999-99. June 1.
5. Remediation Enhanced Developments, Inc. 1995. Chemical Data Report #1, Landfill 5 AirSparging/Soil Vapor Extraction Remediation, Ft. Griffey, Ohio. For USACE Contract No.DACA99-99-Z-9999-99. December 31.
6. Remediation Enhanced Developments, Inc. 1996. Chemical Data Report #2, Landfill 5 AirSparging/Soil Vapor Extraction Remediation, Ft. Griffey, Ohio. For USACE Contract No.DACA99-99-Z-9999-99. December 31.
7. Remediation Enhanced Developments, Inc. 1997. Chemical Data Report #3, Landfill 5AS/SVE Remediation, Ft. Griffey, Ohio. For USACE Contract No. DACA99-99-Z-9999-99.December 31.
8. Remediation Enhanced Developments, Inc. 1998. Chemical Data Report #4, Landfill 5Remediation, Ft. Griffey, Ohio. For USACE Contract No. DACA99-99-Z-9999-99.December 31.
9. Remediation Enhanced Developments, Inc. 1999. Chemical Data Report #5, Landfill 5Remediation, Ft. Griffey, Ohio. For USACE Contract No. DACA99-99-Z-9999-99December 31..
10. Riverfront Air Pollution Control Agency. 1997. Letter from Scott Williamson to PeterHarnish, USACE. December 11.
11. U.S. EPA. 1993. Record of Decision, Ft. Griffey Landfill 5 Remediation. October 15.
12. U.S. EPA. 1994. Letter regarding Approval of Remedial Design, Ft. Griffey Landfill 5Remediation. October 5.
13. U.S. EPA. 1995. Letter regarding Signing of Preliminary Closeout Report, Ft. GriffeyLandfill 5 Remediation. July 29.
14. U.S. EPA. 1995. Letter regarding Operating Properly and Successfully Determination, Ft.Griffey Landfill 5 Remediation. September 4.
SECTIONELEVEN References
Ft. Griffey Landfill 5 OU Interim RA Report 11-2
15. USACE, Louisville District. 1994. Final Management Plan, Pilot Study, Landfill 5, Ft.Griffey, Ohio. June.
16. USACE, Louisville District. 1994. Government Cost Estimate for Cover Air Sparging/SoilVapor Extraction Pilot Test, Landfill 5, Ft. Griffey, Ohio, Department of the Army. August.
17. USACE, Louisville District. 1995. Technical Memorandum, AS/SVE Pilot LF5, Ft. Griffey.March 28.
18. USACE, Louisville District. 1999. Inspection Results: Pre-Final and Federal FacilitiesAgreement. December 30.
19. USACE, Louisville District. 1997. Letter from Sean Casey, P.E. to Jack McKeon, RiverfrontAir Pollution Control Agency. December 5.
20. USACE, Louisville District. Undated. Compliance Monitoring Plan, Ft. Griffey, LF5,AS/SVE Final Remedial Design.
21. USACE, Louisville District. Undated. Design Analysis, Ft. Griffey, LF5, AS/SVE FinalRemedial Design.
22. USACE, Louisville District. Undated. Remedial Action Workplan, Ft. Griffey, LF5, AS/SVEFinal Remedial Design.
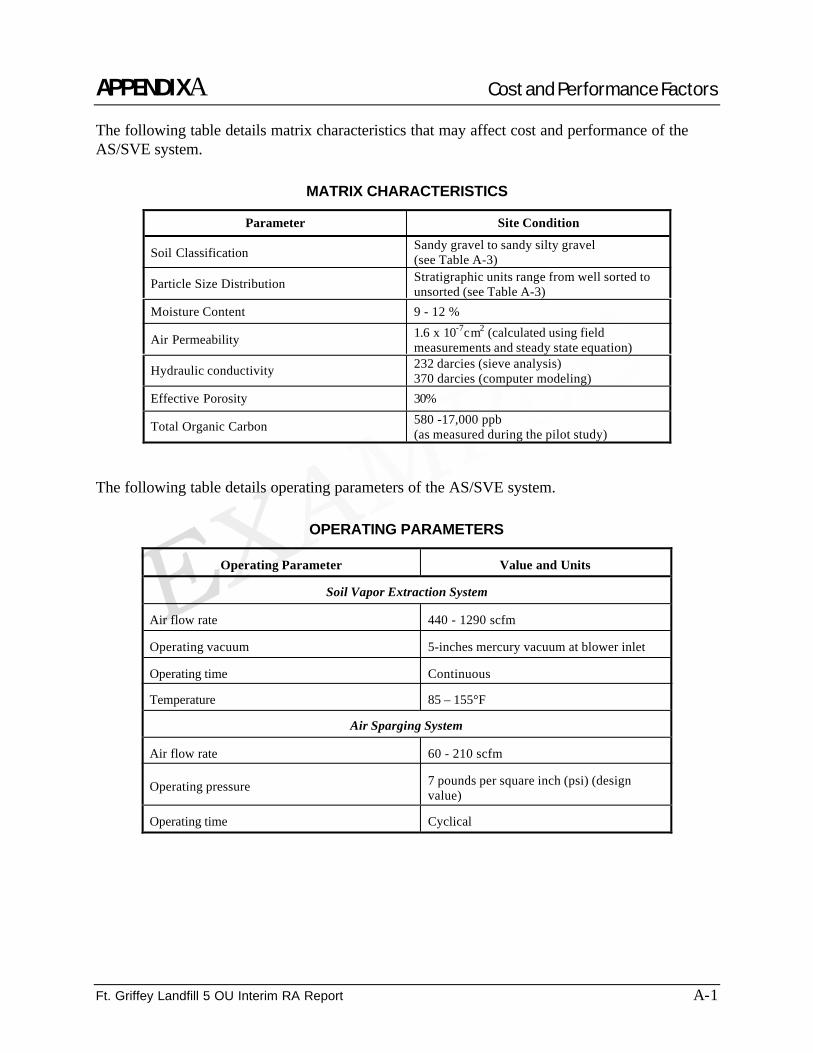
APPENDIXA Cost and Performance Factors
Ft. Griffey Landfill 5 OU Interim RA Report A-1
The following table details matrix characteristics that may affect cost and performance of theAS/SVE system.
MATRIX CHARACTERISTICS
Parameter Site Condition
Soil Classification Sandy gravel to sandy silty gravel(see Table A-3)
Particle Size Distribution Stratigraphic units range from well sorted tounsorted (see Table A-3)
Moisture Content 9 - 12 %
Air Permeability 1.6 x 10⁻⁷cm2 (calculated using fieldmeasurements and steady state equation)
Hydraulic conductivity 232 darcies (sieve analysis)370 darcies (computer modeling)
Effective Porosity 30%
Total Organic Carbon 580 -17,000 ppb(as measured during the pilot study)
The following table details operating parameters of the AS/SVE system.
OPERATING PARAMETERS
Operating Parameter Value and Units
Soil Vapor Extraction System
Air flow rate 440 - 1290 scfm
Operating vacuum 5-inches mercury vacuum at blower inlet
Operating time Continuous
Temperature 85 – 155°F
Air Sparging System
Air flow rate 60 - 210 scfm
Operating pressure 7 pounds per square inch (psi) (designvalue)
Operating time Cyclical
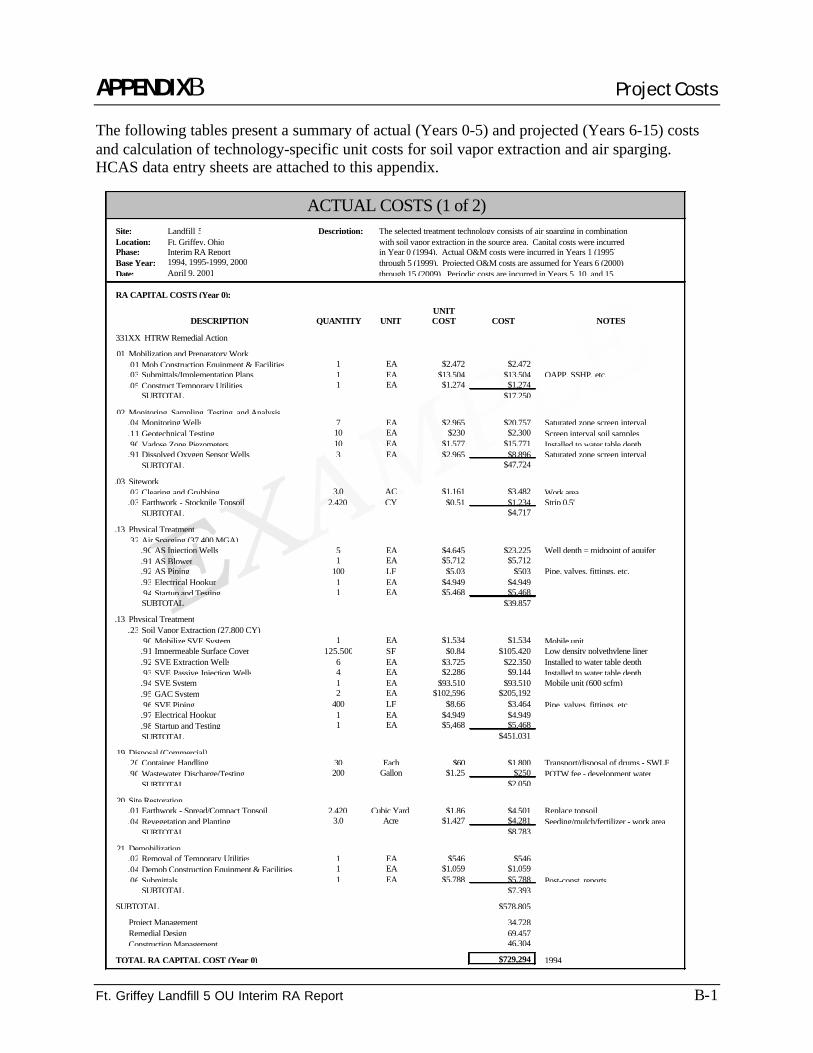
APPENDIXB Project Costs
Ft. Griffey Landfill 5 OU Interim RA Report B-1
The following tables present a summary of actual (Years 0-5) and projected (Years 6-15) costsand calculation of technology-specific unit costs for soil vapor extraction and air sparging.HCAS data entry sheets are attached to this appendix.
Site: Landfill 5 Description: The selected treatment technology consists of air sparging in combinationLocation: Ft. Griffey, Ohio with soil vapor extraction in the source area. Capital costs were incurredPhase: Interim RA Report in Year 0 (1994). Actual O&M costs were incurred in Years 1 (1995)Base Year: 1994, 1995-1999, 2000 through 5 (1999). Projected O&M costs are assumed for Years 6 (2000)Date: through 15 (2009). Periodic costs are incurred in Years 5, 10, and 15.
RA CAPITAL COSTS (Year 0):
331XX HTRW Remedial Action
.01 Mobilization and Preparatory Work.01 Mob Construction Equipment & Facilities.03 Submittals/Implementation Plans QAPP, SSHP, etc..05 Construct Temporary Utilities
SUBTOTAL
.02 Monitoring, Sampling, Testing, and Analysis.04 Monitoring Wells Saturated zone screen interval.11 Geotechnical Testing Screen interval soil samples.90 Vadose Zone Piezometers Installed to water table depth.91 Dissolved Oxygen Sensor Wells Saturated zone screen interval
SUBTOTAL
.03 Sitework.02 Clearing and Grubbing Work area.03 Earthwork - Stockpile Topsoil Strip 0.5'
SUBTOTAL
.13 Physical Treatment.32 Air Sparging (37,400 MGA)
.90 AS Injection Wells Well depth = midpoint of aquifer
.91 AS Blower
.92 AS Piping Pipe, valves, fittings, etc.
.93 Electrical Hookup
.94 Startup and TestingSUBTOTAL
.13 Physical Treatment.23 Soil Vapor Extraction (27,800 CY)
.90 Mobilize SVE System Mobile unit
.91 Impermeable Surface Cover Low density polyethylene liner
.92 SVE Extraction Wells Installed to water table depth
.93 SVE Passive Injection Wells Installed to water table depth
.94 SVE System Mobile unit (600 scfm)
.95 GAC System
.96 SVE Piping Pipe, valves, fittings, etc.
.97 Electrical Hookup
.98 Startup and TestingSUBTOTAL
.19 Disposal (Commercial).20 Container Handling Transport/disposal of drums - SWLF.90 Wastewater Discharge/Testing POTW fee - development water
SUBTOTAL
.20 Site Restoration.01 Earthwork - Spread/Compact Topsoil Replace topsoil.04 Revegetation and Planting Seeding/mulch/fertilizer - work area
SUBTOTAL
.21 Demobilization.02 Removal of Temporary Utilities.04 Demob Construction Equipment & Facilities.06 Submittals Post-const. reports
SUBTOTAL
SUBTOTAL
Project ManagementRemedial DesignConstruction Management
TOTAL RA CAPITAL COST (Year 0) 1994
$5,788
ACTUAL COSTS (1 of 2)
1 EA $546 $546
1 EA
1 EA
$1,534
2,420 Cubic Yard $1.86
125,500 SF $0.84
400
1 EA $1,059 $1,059
3.0 Acre $1,427 $4,281
1 $93,510 $93,510
$105,4206 EA $3,725 $22,3504 EA
2 EA $102,596 $205,192
$1,234
1 EA $5,468 $5,468
EAEA
1
LF $5.03
2,420
1
1
April 9, 2001
34,728
CY $0.51
$8.66 $3,464
$8,783
$4,501
$4,949 $4,949
$7,393
$1,800
LF
EA
$5,468
$9,144
$1,534
EA
$2,286
$250
$39,857
EA $4,949EA $5,468
$4,645
100
EachGallon200 $1.25
15
$5,712
AC $1,161
$1,5773 EA
EA1010
1
$2,4721 EA
EA
EAEA $230
7 $2,965
DESCRIPTION
1
UNIT
EA $2,472
UNITQUANTITY
$13,504
COST
$2,965
30 $60
3.0
$1,274$13,504$1,274
$47,724$8,896
$2,300$15,771
$4,717
$3,482
69,45746,304
NOTES
$17,250
COST
$20,757
$23,225
$503$4,949
$5,712
$451,031
$729,294
$5,788
$2,050
$578,805
APPENDIXB Project Costs
Ft. Griffey Landfill 5 OU Interim RA Report B-2
O&M COSTS (Years 1-5):
342XX HTRW O&M
.02 Monitoring, Sampling, Testing, and Analysis.90 Performance Monitoring - SVE Vapor 1 sample/month * 6 extraction wells.91 Performance Monitoring - SVE Emissions 1 sample/month - SVE exhaust.92 Site Groundwater Sampling (Quarterly) Sample 8 wells/event VOCs, metals.93 Site Groundwater Lab Analysis Analysis for above
SUBTOTAL.13 Physical Treatment
.32 Air Sparging (37,400 MGA).90 Operations Labor 54 manhours per month.91 Maintenance Labor 6 manhours per month.92 Equipment Repair.93 Utilities Electricity + fuelSUBTOTAL
.13 Physical Treatment.23 Soil Vapor Extraction (27,800 CY)
.90 Operations Labor 82 manhours per month
.91 Maintenance Labor 10 manhours per month
.92 Equipment Repair
.93 Utilities Electricity + fuelSUBTOTAL
.18 Disposal (Other than Commercial).90 Wastewater Discharge/Testing Purge & knockout water
SUBTOTALProject ManagementTechnical Support
TOTAL O&M COST (Years 1-5) 1995-1999
PERIODIC COSTS (Year 5):
Five Year Review Report 1 report at end of Year 5Interim RA Report
TOTAL PERIODIC COST (Year 5) 1999
TOTAL COST (Years 0-5)
DESCRIPTION
EA $1,000
5
5 YR $21,839
5 YR
5
$12,000 $12,000
$22,149
$17,280$146,880
$109,195
ACTUAL COSTS (2 of 2)
NOTES
5 YR $36,399
UNIT COSTUNIT
YR $29,376
$46,268
8,000 GA $1.25 $10,000
515 YR
$9,2541
YR
5 YR $3,456
$44,064$5,184$1,500
1 EachQUANTITY
NOTES
$3,692
TOTAL
$420,395
$181,995$18,460
$110,745
TOTALUNIT
COST
YREA
$1,102,810
$69,402$317,142
$1,000
$8,000 $8,000
$20,000
$220,320$25,920
$1,500
$958,965
$211,428
47,94895,897
QUANTITY
1 Each
5 YR
UNIT
5 YR
YEAR55
DESCRIPTION
$13,880
$1,852,104
APPENDIXB Project Costs
Ft. Griffey Landfill 5 OU Interim RA Report B-3
Site: Landfill 5 Description: The selected treatment technology consists of air sparging in combinationLocation: Ft. Griffey, Ohio with soil vapor extraction in the source area. Capital costs were incurredPhase: Interim RA Report in Year 0 (1994). Actual O&M costs were incurred in Years 1 (1995)Base Year: 1994, 1995-1999, 2000 through 5 (1999). Projected O&M costs are assumed for Years 6 (2000)Date: through 15 (2009). Periodic costs are incurred in Years 5, 10, and 15.
O&M COSTS (Years 6-15):
342XX HTRW O&M
.02 Monitoring, Sampling, Testing, and Analysis.90 Performance Monitoring - SVE Vapor 1 sample/month * 6 extraction wells.91 Performance Monitoring - SVE Emissions 1 sample/month - SVE exhaust.92 Site Groundwater Sampling (Quarterly) Sample 8 wells/event VOCs, metals.93 Site Groundwater Lab Analysis Analysis for above
SUBTOTAL
.13 Physical Treatment.32 Air Sparging
.05 Utilities Electricity + fuel
.09 Operations Labor 54 manhours per month
.10 Maintenance Labor 6 manhours per month
.90 Equipment RepairSUBTOTAL
.13 Physical Treatment.23 Soil Vapor Extraction
.05 Utilities Electricity + fuel
.09 Operations Labor 82 manhours per month
.10 Maintenance Labor 10 manhours per month
.90 Equipment RepairSUBTOTAL
.18 Disposal (Other than Commercial).90 Wastewater Discharge/Testing Purge & knockout water
SUBTOTAL
Contingency
SUBTOTAL
Project ManagementTechnical Support
TOTAL O&M COST (Years 6-15) 2000
PERIODIC COSTS (Years 10, 15):
Five Year Review Report 1 report at end of Year 10
Demob SVE System 342XX.13.23.99 Remove equipment and pipingDemob AS System 342XX.13.32.99 Remove equipment and pipingWell Abandon 342XX.02.04.20Contingency (% of Sum) % of construction activitiesProject Mgt. (% of Sum + Cont.) % of construction + contingencyFinal RA ReportSUBTOTAL
TOTAL PERIODIC COST (Years 10, 15) 2000
TOTAL PROJECTED COST (Years 6-15)
15 1 Lump Sum $7,125
16,000 GA $1.25 $20,000
10 YR $13,880 $138,804
1 EA $3,000 $3,00010 YR $5,184 $51,84010 YR $44,064 $440,640
YR $9,254 $92,536
$422,856
$2,111,483
PROJECTED COSTS
10 YR $22,149 $221,49010 YR $3,692 $36,92010 YR $18,200 $182,000
5% 1,79315 1 Each $4,000 $4,000
15%15 28 Each $350
NOTESCOST
15 1 Lump Sum $14,250
5%10%
$14,250
10%
10 YR
10 YR10 YR1 EA
DESCRIPTION QUANTITY UNIT
$9,800
1 Each
QUANTITY UNIT
4,676
$1,626,750
$1,789,425
$12,000
162,675
$2,057,839
TOTAL
$7,125
UNIT
$41,644
178,943
COST
$10,920 $109,200$549,610
$29,376 $293,760$3,456
NOTESTOTAL
$34,560$2,000 $2,000
$634,284
$53,644
March 30, 2001
89,471
YEAR
10
DESCRIPTION
10
UNIT
$12,000

APPENDIXB Project Costs
Ft. Griffey Landfill 5 OU Interim RA Report B-4
SOIL VAPOR EXTRACTIONTECHNOLOGY-SPECIFIC UNIT COST CALCULATION
ACTUAL CAPITAL COSTS (Year 0):
Monitoring, Sampling, Testing, and Analysis1
Physical Treatment2
Disposal (Other than Commercial)3
SUBTOTAL
ACTUAL O&M COSTS (Years 1-5):
Monitoring, Sampling, Testing, and Analysis4
Physical Treatment2
SUBTOTAL
PROJECTED O&M COSTS (Years 6-15):
Monitoring, Sampling, Testing, and Analysis4
Physical Treatment2
SUBTOTAL
PROJECTED PERIODIC COSTS (Years 10, 15):
Demobilize SVE System2
Well Abandonment2
SUBTOTAL
TOTAL TECHNOLOGY-SPECIFIC COST
Soil to be Treated (Cubic Yards)5
TECHNOLOGY-SPECIFIC UNIT COST (Per Cubic Yard)1 SVE vadose zone piezometers
2 SVE system only3 Disposal of SVE piezometer soil cuttings4 SVE performance monitoring5 Within zone of influence
$446,347
$15,771$451,031
$800$467,602
$129,205$317,142
$65.75
$1,827,893
$258,410$634,284$892,694
$14,250$7,000
$21,250
27,800
APPENDIXB Project Costs
Ft. Griffey Landfill 5 OU Interim RA Report B-5
AIR SPARGINGTECHNOLOGY-SPECIFIC UNIT COST CALCULATION
ACTUAL CAPITAL COSTS (Year 0):
Monitoring, Sampling, Testing, and Analysis1
Physical Treatment2
Disposal (Other than Commercial)3
SUBTOTAL
ACTUAL O&M COSTS (Years 1-5):
Physical Treatment2
PROJECTED O&M COSTS (Years 6-15):
Physical Treatment2
PROJECTED PERIODIC COSTS (Years 10, 15):
Demobilize AS System2
Well Abandonment2
TOTAL
TOTAL TECHNOLOGY-SPECIFIC COST
Groundwater to be Treated (MGA)4
TECHNOLOGY-SPECIFIC UNIT COST (Per 1,000 Gal)1 AS monitoring wells (3), DOS wells (3), geotechnical testing2 AS system only3 Disposal of AS wells soil cuttings and development water4 Within treatment zone - includes flushed volume (MGA = 1,000 gallons)
$60,179
37,400
$211,428
$19,172$39,857
$1,150
$18.83
$704,388
$422,856
$7,125$2,800$9,925

Historical Cost Analysis System (HCAS)Project Data Entry Form (Sheet 1)
Project InformationProject NameProject NumberProject Phase (Select one)
Studies and DesignRemedial Action üOperations and Maintenance
Project Note (Describe the project)Soil Vapor Extraction treatment technology was utilized to remediate 27,800 cy (estimated)of contaminated soil in conjunction with Air Sparging treatment technology, which wasutilized to remediate 37,400,000 gallons (estimated) of contaminated groundwater.
Contract InformationContract Number DACA27-94-C-0300
Managing Organization U.S. Army Corps of EngineersOrganization Name Louisville DistrictSite Owner U.S. ArmyOther ID Number Prime Contractor Remediation Enhanced Developments, Inc. (RED)Contract Type (Select one)
Cost + Award FeeCost + Base + Award FeeCost + Fixed Fee üCost + Incentive AwardFixed PriceNot AvailiableOther
Procurement Type (Select one) Two Step Sealed Bid
Sealed Bid (IFB)Competitive Negotiation (RFP) üSole Source (SSC)Other
Landfill 5 Operable Unit
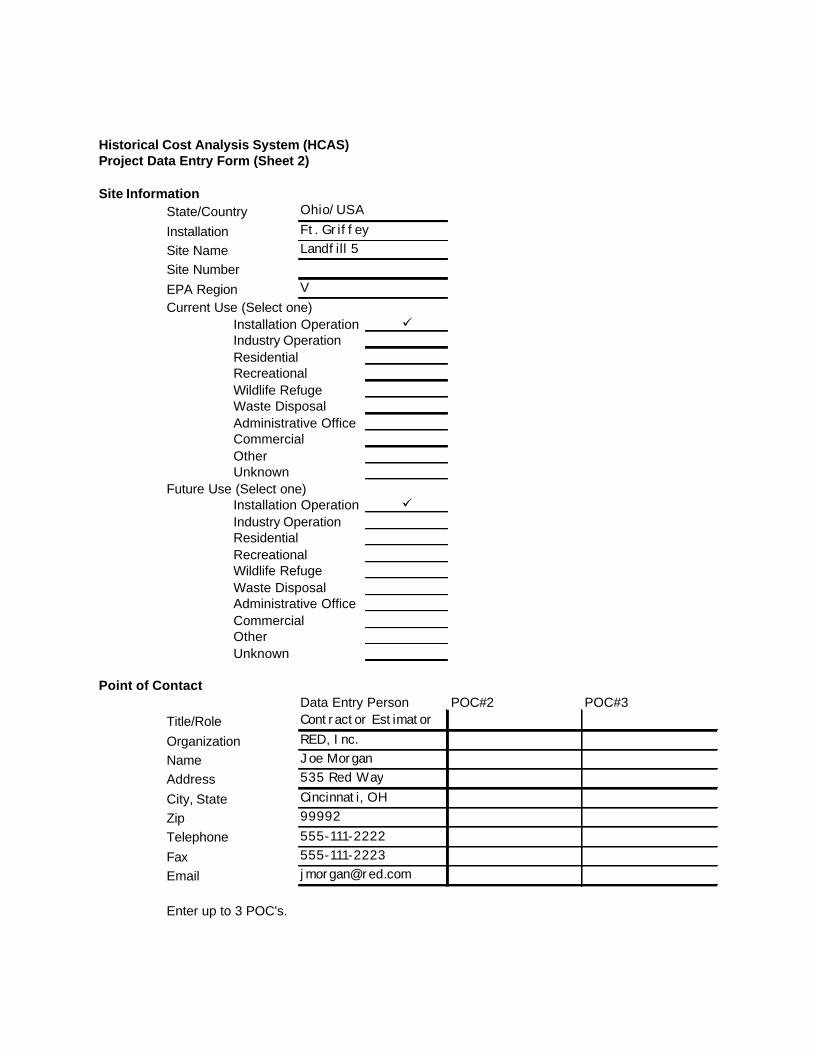
Historical Cost Analysis System (HCAS)Project Data Entry Form (Sheet 2)
Site InformationState/Country Ohio/USAInstallation Ft. GriffeySite Name Landfill 5Site Number EPA Region VCurrent Use (Select one)
Installation Operation üIndustry OperationResidentialRecreationalWildlife RefugeWaste DisposalAdministrative OfficeCommercialOtherUnknown
Future Use (Select one)Installation Operation üIndustry OperationResidentialRecreationalWildlife RefugeWaste DisposalAdministrative OfficeCommercialOtherUnknown
Point of ContactData Entry Person POC#2 POC#3
Title/Role Contractor Estimator Organization RED, Inc. Name Joe Morgan Address 535 Red Way City, State Cincinnati, OH Zip 99992 Telephone 555-111-2222 Fax 555-111-2223 Email [email protected]
Enter up to 3 POC's.
Historical Cost Analysis System (HCAS)Project Data Entry Form (Sheet 3)
Profile - General CharacteristicsRegulatory Class Public Concern
CERCLA ü Low üRCRA HighOther Historical/ArchoelogicalUnknown Yes
National Priority List No üYes ü Innovative TechnologyNo Yes
Wetland No üYes Size of Exclusion Zone (Acres)No ü Size of Area (Acres)
Flood PlainYesNo ü
Profile - Contaminants/Technical Approach Site Type Media Contaminant Technical Approach
AG Storage Tanks Air Nonhal VOC's CWM/OEW RemvlUG Storage Tanks Equipment/Mach Halogenated VOC's Surf Water ControlDrums/Cont <250 GA Groundwater Nonhal Semi VOC's Grnd Water ControlUnauth Disposl Area Liquid Halogen Semi VOC's Air/Gas ControlFacil/Bldgs Surface Water Fuels Solids ContainFire Train/Open Burn Sediment Inorganics Liq/Sed/Sludge CntrlFiring Rnge/Open Det Sludge Low Lev Rad Waste Drums/Tanks RemvlPit/Trench Soil High Lev Rad Waste Biological TreatmentSurf Impnd/Lagoons Solid/Debris Low Rad Mixed Wst Chemical TreatmentLakes/Ponds/Swamp Struct Bldg Matls TRU Waste Physical TreatmentLandfill Other CWM/OEW Thermal TreatmentOcean Asbestos Stab/Fix/EncapRivers/Streams Unknown Decon & DecommishSpill/Emerg Resp Other Disposal (Not Comm)Waste Pile Disposal CommercialOther Other
Pick as many Profile combinations as necessary:
Landfill Physical TreatmentLandfill Physical Treatment
Fuels
Fuels
SoilGroundwater
Historical Cost Analysis System (HCAS)Project Data Entry Form (Sheet 4)
CostStart DateEnd DateNumber of Mods 0Reasons for Mods (Select those applicable)
AdministrativeChanges for Time or CostChanges Requested by Government AuthorityDesign DeficiencyDiffering Site ConditionsFunding Level ChangeNew Federal RegulationOther ChangesSuspension or Termination of WorkValue Engineering ChangeVariations in Estimated QuantitiesVariations Not Readily Identifiable During Design
CostAward AmountActual AmountCost Variance
Cost Breakdown See next sheets.
The HCAS Cost Breakdown is structured in accordance with the February 1996 "HTRW Remedial Action Work Breakdown Structure(RA WBS)" and "HTRW O&M Work Breakdown Structure (O&M WBS)".
The next sheets show the RA WBS and O&M WBS to the Third Level as required for the HCAS cost report portion of the "RA Report".
The costs reported shall be "Burdened Costs", meaning that contractor markups, general requirements, overhead, and profit shall be includedin the costs.
The complete RA WBS and O&M WBS to the Fourth Level is at: http://www.FRTR.gov/cost/ec2/wbs1.html
The HCAS 3.1 software can be downloaded from:http://www.FRTR.gov/cost/ec2/index.html
+10%
10/19/19949/4/1995
$2,900,000$3,195,695
WBS Number DESCRIPTION QTY UOM UNIT COST
COST $
33XXX HTRW CONSTRUCTION ACTIVITIES331XX HTRW REMEDIAL ACTION (Capital and Operating)
01 MOBILIZATION AND PREPARATORY WORK 01 01 Mobilization of Construction Equipment and Facilities 1 EA 2,472 2,47201 02 Mobilization of Personnel EA01 03 Submittals/Implementation Plans 1 EA 13,504 13,50401 04 Setup/Construct Temporary Facilities EA01 05 Construct Temporary Utilities 1 EA 1,274 1,27401 06 Temporary Relocations of Roads/Structures/Utilities EA01 07 Construction Plant Erection EA01 08 Institutional Controls EA01 09 Alternate Water Supply EA01 10 Population Relocation EA01 9X Other (Use Numbers 90-99)
02 MONITORING, SAMPLING, TESTING, AND ANALYSIS 02 01 Meteorological Monitoring EA02 02 Radiation Monitoring EA02 03 Air Monitoring and Sampling EA02 04 Monitoring Wells 7 EA 2,965 20,75502 05 Sampling Surface Water/Groundwater/Liquid Waste EA02 06 Sampling Soil and Sediment EA02 07 Sampling Asbestos EA02 08 Sampling Radioactive Contaminated Media EA02 09 Laboratory Chemical Analysis EA02 10 Radioactive Waste Analysis EA02 11 Geotechnical Testing 10 EA 230 2,30002 12 Geotechnical Instrumentation EA02 13 On-Site Laboratory Facilities EA02 14 Off-Site Laboratory Facilities EA02 9X Other (Use Numbers 90-99) 1 LS 24,667 24,667
03 SITEWORK03 01 Demolition SY03 02 Clearing and Grubbing 3 ACR 1,161 3,48203 03 Earthwork 2,420 CY 0.51 1,23403 04 Roads/Parking/Curbs/Walks SY03 05 Fencing LF03 06 Electrical Distribution LF03 07 Telephone/Communication Distribution LF03 08 Water/Sewer/Gas Distribution LF03 09 Steam and Condensate Distribution LF03 10 Fuel Line Distribution LF03 11 Storm Drainage/Subdrainage LF03 12 Permanent Cover Structure Over Containment Area SF03 13 Development of Borrow Pit/Haul Roads ACR
WBS Number DESCRIPTION QTY UOM UNIT COST
COST $
331XX 03 14 Fuel Storage Tanks (New) EA03 9X Other (Use Numbers 90-99)
04 ORDNANCE AND EXPLOSIVE - CHEMICAL WARFARE 04 01 Ordnance Removal and Destruction ACR04 9x Other (Use Numbers 90-99)
05 SURFACE WATER COLLECTION AND CONTROL05 01 Berms/Dikes LF05 02 Floodwalls SF05 03 Levees LF05 04 Terraces and Benches LF05 05 Channels/Waterways (Soil/Rock) LF05 06 Chutes or Flumes LF05 07 Sediment Barriers LF05 08 Storm Drainage LF05 09 Lagoons/Basins/Tanks/Dikes/Pump System ACR05 10 Pumping/Draining/Collection MGA05 11 Transport to Treatment Plant MGA05 12 Earthwork CY05 13 Erosion Control ACR05 14 Development of Borrow Pit/Haul Roads ACR05 9X Other (Use Numbers 90-99)
06 GROUNDWATER COLLECTION AND CONTROL06 01 Extraction and Injection Wells EA06 02 Subsurface Drainage/Collection LF06 03 Slurry Walls SF06 04 Grout Curtain SF06 05 Sheet Piling SF06 06 Lagoons/Basins/Tanks/Dikes/Pump System ACR06 07 Pumping/Collection MGA06 08 Transport to Treatment Plant MGA06 09 Development of Borrow Pit/Haul Roads ACR06 9x Other (Use Numbers 90-99)
07 AIR POLLUTION/GAS COLLECTION AND CONTROL 07 01 Gas/Vapor Collection Trench System LF07 02 Gas/Vapor Collection Well System EA07 03 Gas/Vapor Collection at Lagoon Cover SY07 04 Fugitive Dust/Vapor/Gas Emissions Control ACR07 9x Other (Use Numbers 90-99)
08 SOLIDS COLLECTION AND CONTAINMENT 08 01 Contaminated Soil Collection CY08 02 Waste Containment, Portable (Furnish/Fill) CY08 03 Transport to Treatment Plant CY
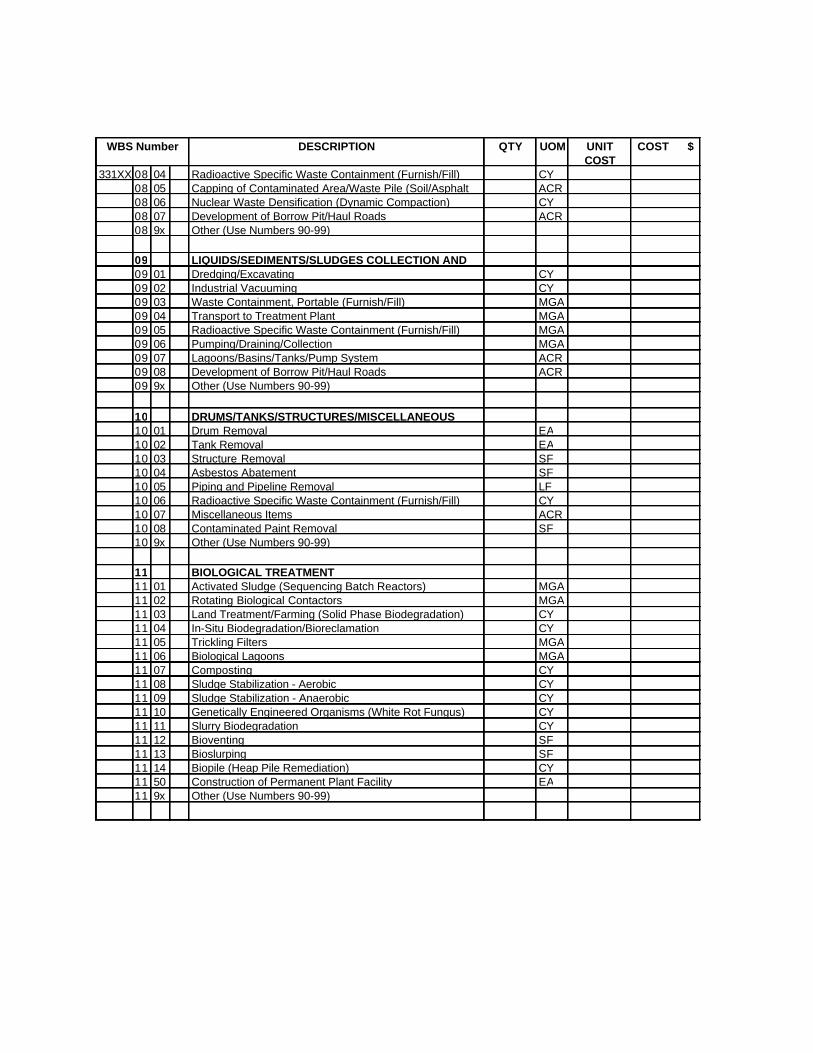
WBS Number DESCRIPTION QTY UOM UNIT COST
COST $
331XX 08 04 Radioactive Specific Waste Containment (Furnish/Fill) CY08 05 Capping of Contaminated Area/Waste Pile (Soil/Asphalt ACR08 06 Nuclear Waste Densification (Dynamic Compaction) CY08 07 Development of Borrow Pit/Haul Roads ACR08 9x Other (Use Numbers 90-99)
09 LIQUIDS/SEDIMENTS/SLUDGES COLLECTION AND 09 01 Dredging/Excavating CY09 02 Industrial Vacuuming CY09 03 Waste Containment, Portable (Furnish/Fill) MGA09 04 Transport to Treatment Plant MGA09 05 Radioactive Specific Waste Containment (Furnish/Fill) MGA09 06 Pumping/Draining/Collection MGA09 07 Lagoons/Basins/Tanks/Pump System ACR09 08 Development of Borrow Pit/Haul Roads ACR09 9x Other (Use Numbers 90-99)
10 DRUMS/TANKS/STRUCTURES/MISCELLANEOUS 10 01 Drum Removal EA10 02 Tank Removal EA10 03 Structure Removal SF10 04 Asbestos Abatement SF10 05 Piping and Pipeline Removal LF10 06 Radioactive Specific Waste Containment (Furnish/Fill) CY10 07 Miscellaneous Items ACR10 08 Contaminated Paint Removal SF10 9x Other (Use Numbers 90-99)
11 BIOLOGICAL TREATMENT 11 01 Activated Sludge (Sequencing Batch Reactors) MGA11 02 Rotating Biological Contactors MGA11 03 Land Treatment/Farming (Solid Phase Biodegradation) CY11 04 In-Situ Biodegradation/Bioreclamation CY11 05 Trickling Filters MGA11 06 Biological Lagoons MGA11 07 Composting CY11 08 Sludge Stabilization - Aerobic CY11 09 Sludge Stabilization - Anaerobic CY11 10 Genetically Engineered Organisms (White Rot Fungus) CY11 11 Slurry Biodegradation CY11 12 Bioventing SF11 13 Bioslurping SF11 14 Biopile (Heap Pile Remediation) CY11 50 Construction of Permanent Plant Facility EA11 9x Other (Use Numbers 90-99)
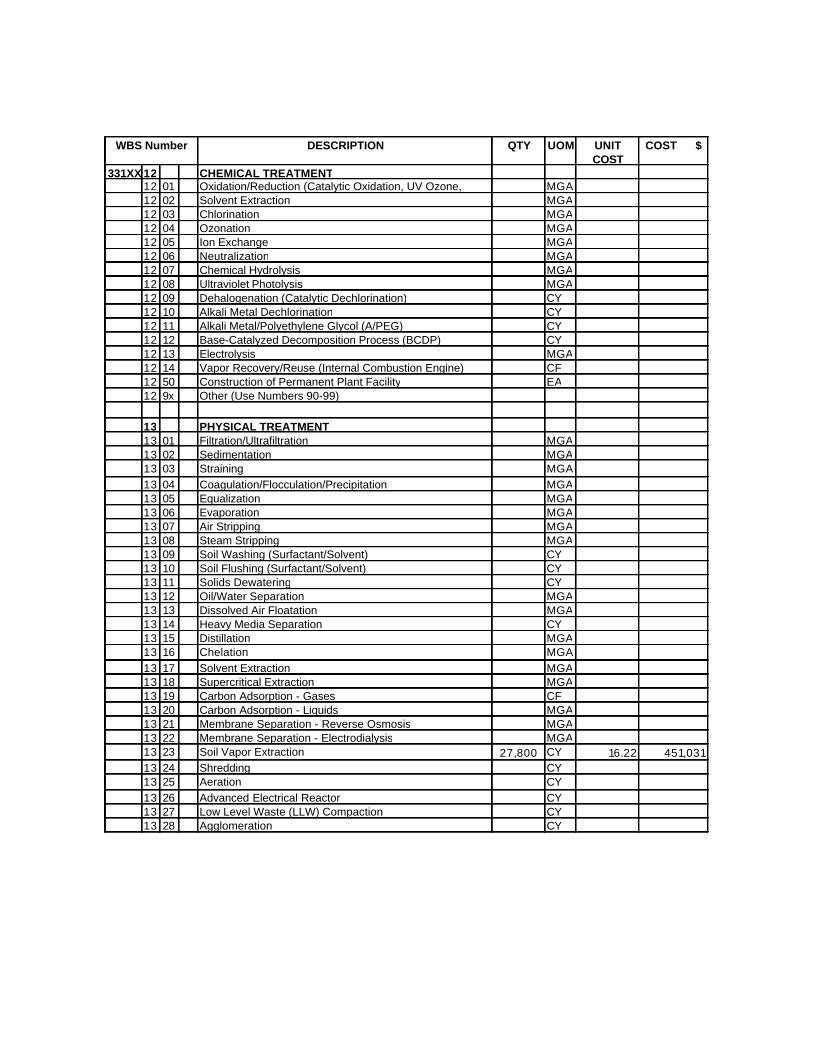
WBS Number DESCRIPTION QTY UOM UNIT COST
COST $
331XX 12 CHEMICAL TREATMENT12 01 Oxidation/Reduction (Catalytic Oxidation, UV Ozone, MGA12 02 Solvent Extraction MGA12 03 Chlorination MGA12 04 Ozonation MGA12 05 Ion Exchange MGA12 06 Neutralization MGA12 07 Chemical Hydrolysis MGA12 08 Ultraviolet Photolysis MGA12 09 Dehalogenation (Catalytic Dechlorination) CY12 10 Alkali Metal Dechlorination CY12 11 Alkali Metal/Polyethylene Glycol (A/PEG) CY12 12 Base-Catalyzed Decomposition Process (BCDP) CY12 13 Electrolysis MGA12 14 Vapor Recovery/Reuse (Internal Combustion Engine) CF12 50 Construction of Permanent Plant Facility EA12 9x Other (Use Numbers 90-99)
13 PHYSICAL TREATMENT13 01 Filtration/Ultrafiltration MGA13 02 Sedimentation MGA13 03 Straining MGA13 04 Coagulation/Flocculation/Precipitation MGA13 05 Equalization MGA13 06 Evaporation MGA13 07 Air Stripping MGA13 08 Steam Stripping MGA13 09 Soil Washing (Surfactant/Solvent) CY13 10 Soil Flushing (Surfactant/Solvent) CY13 11 Solids Dewatering CY13 12 Oil/Water Separation MGA13 13 Dissolved Air Floatation MGA13 14 Heavy Media Separation CY13 15 Distillation MGA13 16 Chelation MGA13 17 Solvent Extraction MGA13 18 Supercritical Extraction MGA13 19 Carbon Adsorption - Gases CF13 20 Carbon Adsorption - Liquids MGA13 21 Membrane Separation - Reverse Osmosis MGA13 22 Membrane Separation - Electrodialysis MGA13 23 Soil Vapor Extraction 27,800 CY 16.22 451,03113 24 Shredding CY13 25 Aeration CY13 26 Advanced Electrical Reactor CY13 27 Low Level Waste (LLW) Compaction CY13 28 Agglomeration CY

WBS Number DESCRIPTION QTY UOM UNIT COST
COST $
331XX 13 29 In-Situ Steam Extraction MGA13 30 Filter Presses MGA13 31 Lignin Adsorption/Sorptive Clays CY13 32 Air Sparging 37,400 MGA 1.07 39,85713 50 Construction of Permanent Plant Facility EA13 9x Other (Use Numbers 90-99)
14 THERMAL TREATMENT 14 01 Incineration CY14 02 Low Temperature Thermal Desorption CY14 03 Supercritical Water Oxidation MGA14 04 Molten Salt Destruction CY14 05 Radio Frequency Heating CY14 06 Solar Detoxification CY14 07 High Temperature Thermal Desorption CY14 50 Construction of Permanent Plant Facility EA14 9x Other (Use Numbers 90-99)
15 STABILIZATION/FIXATION/ENCAPSULATION15 01 Molten Glass CY15 02 In-Situ Vitrification CY15 03 In-Situ Pozzolan Process (Lime/Portland Cement) CY15 04 Pozzolan Process (Lime/Portland Cement) CY15 05 Asphalt-Based Encapsulation CY15 06 Radioactive Waste Solidification (Grouting/Other) CY15 07 Sludge Stabilization (Aggregate/Rock/Slag) CY15 50 Construction of Permanent Plant Facility EA15 9x Other (Use Numbers 90-99)
16 RESERVED FOR FUTURE USE
17 DECONTAMINATION AND DECOMMISSIONING (D&D)17 01 Pre-Decommissioning Operations SF17 02 Facility Shutdown Activities SF17 03 Procurement of Equipment and Material SF17 04 Dismantling Activities SF17 05 Research and Development (R&D) SF17 06 Spent Fuel Handling SF17 07 Hot Cell Cleanup SF17 9x Other (Use Numbers 90-99)
18 DISPOSAL (OTHER THAN COMMERCIAL)18 01 Landfill/Burial Ground/Trench/Pits CY18 02 Above-Ground Vault CY18 03 Underground Vault CY18 04 Underground Mine/Shaft CY18 05 Tanks MGA

WBS Number DESCRIPTION QTY UOM UNIT COST
COST $
331XX 18 06 Pads (Tumulus/Retrievable Storage/Other) CY18 07 Storage Bldgs/Protective Cvr Structures/Other Bldgs & CY 18 08 Cribs CY18 09 Deep Well Injection MGA18 10 Incinerator CY18 15 Construction of Permanent Disposal Facility EA18 20 Container Handling EA18 21 Transportation to Storage/Disposal Facility TON18 22 Disposal Fees and Taxes TON18 23 Mixed Waste Storage Fees and Taxes TON18 9x Other (Use Numbers 90-99)
19 DISPOSAL (COMMERCIAL)19 20 Container Handling 30 EA 60 1,80019 21 Transportation to Storage/Disposal Facility TON19 22 Disposal Fees and Taxes TON19 23 Mixed Waste Storage Fees and Taxes TON19 9x Other (Use Numbers 90-99) 1 LS 250 250
20 SITE RESTORATION20 01 Earthwork 2,420 CY 1.86 4,50120 02 Permanent Markers EA20 03 Permanent Features EA20 04 Revegetation and Planting 3 ACR 1,427 4,28120 05 Removal of Barriers EA20 9x Other (Use Numbers 90-99)
21 DEMOBILIZATION21 01 Removal of Temporary Facilities EA21 02 Removal of Temporary Utilities 1 EA 546 54621 03 Final Decontamination EA21 04 Demobilization of Construction Equipment and Facilities 1 EA 1,059 1,05921 05 Demobilization of Personnel EA21 06 Submittals 1 EA 5,788 5,78821 07 Construction Plant Takedown EA21 9x Other (Use Numbers 90-99)
9X OTHER (Use Numbers 90-99)
TOTAL AMOUNT $ 578,801
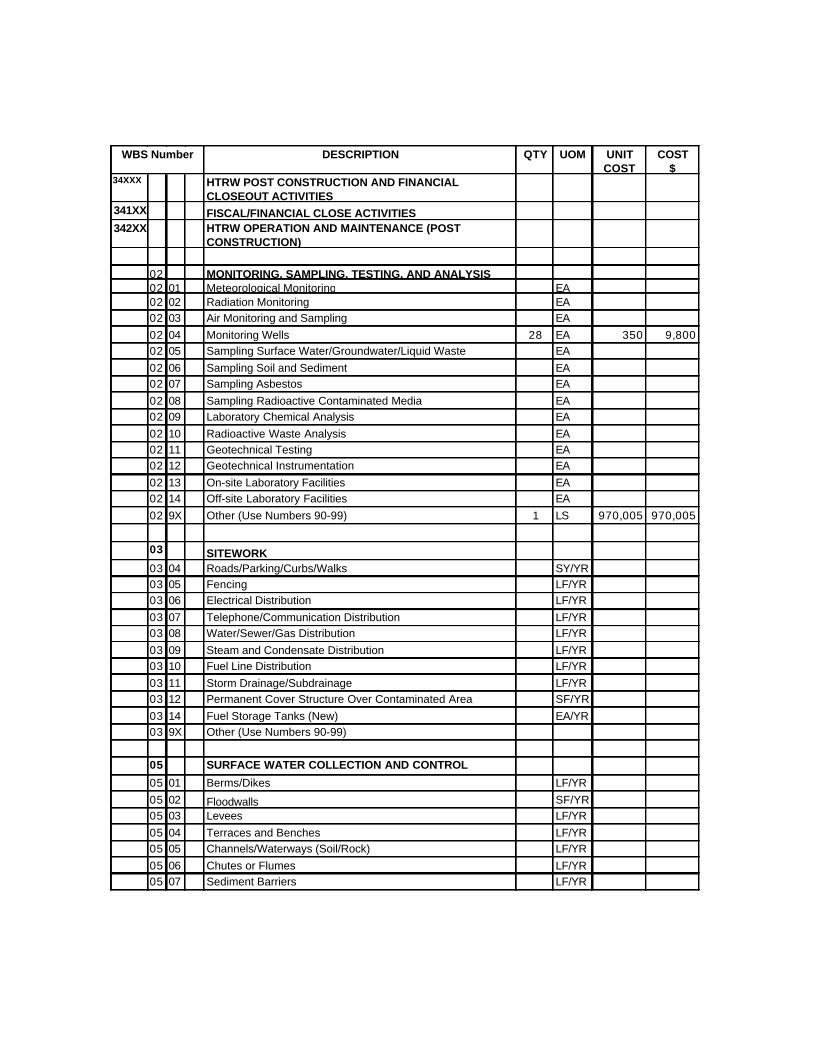
WBS Number DESCRIPTION QTY UOM UNIT COST
COST $
34XXX HTRW POST CONSTRUCTION AND FINANCIAL CLOSEOUT ACTIVITIES
341XX FISCAL/FINANCIAL CLOSE ACTIVITIES342XX HTRW OPERATION AND MAINTENANCE (POST
CONSTRUCTION)
02 MONITORING, SAMPLING, TESTING, AND ANALYSIS02 01 Meteorological Monitoring EA02 02 Radiation Monitoring EA02 03 Air Monitoring and Sampling EA02 04 Monitoring Wells 28 EA 350 9,80002 05 Sampling Surface Water/Groundwater/Liquid Waste EA02 06 Sampling Soil and Sediment EA02 07 Sampling Asbestos EA02 08 Sampling Radioactive Contaminated Media EA02 09 Laboratory Chemical Analysis EA02 10 Radioactive Waste Analysis EA02 11 Geotechnical Testing EA02 12 Geotechnical Instrumentation EA02 13 On-site Laboratory Facilities EA02 14 Off-site Laboratory Facilities EA02 9X Other (Use Numbers 90-99) 1 LS 970,005 970,005
03 SITEWORK03 04 Roads/Parking/Curbs/Walks SY/YR03 05 Fencing LF/YR03 06 Electrical Distribution LF/YR03 07 Telephone/Communication Distribution LF/YR03 08 Water/Sewer/Gas Distribution LF/YR03 09 Steam and Condensate Distribution LF/YR03 10 Fuel Line Distribution LF/YR03 11 Storm Drainage/Subdrainage LF/YR03 12 Permanent Cover Structure Over Contaminated Area SF/YR03 14 Fuel Storage Tanks (New) EA/YR03 9X Other (Use Numbers 90-99)
05 SURFACE WATER COLLECTION AND CONTROL05 01 Berms/Dikes LF/YR05 02 Floodwalls SF/YR05 03 Levees LF/YR05 04 Terraces and Benches LF/YR05 05 Channels/Waterways (Soil/Rock) LF/YR05 06 Chutes or Flumes LF/YR05 07 Sediment Barriers LF/YR
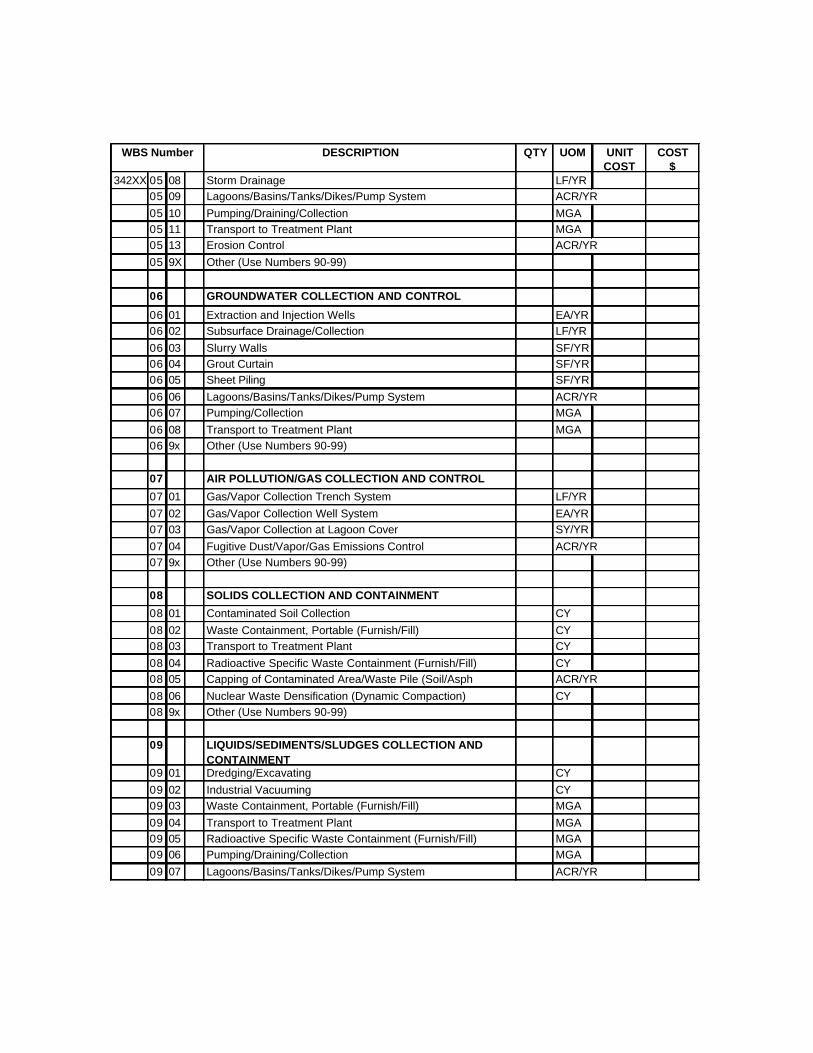
WBS Number DESCRIPTION QTY UOM UNIT COST
COST $
342XX 05 08 Storm Drainage LF/YR05 09 Lagoons/Basins/Tanks/Dikes/Pump System ACR/YR05 10 Pumping/Draining/Collection MGA05 11 Transport to Treatment Plant MGA05 13 Erosion Control ACR/YR05 9X Other (Use Numbers 90-99)
06 GROUNDWATER COLLECTION AND CONTROL06 01 Extraction and Injection Wells EA/YR06 02 Subsurface Drainage/Collection LF/YR06 03 Slurry Walls SF/YR06 04 Grout Curtain SF/YR06 05 Sheet Piling SF/YR06 06 Lagoons/Basins/Tanks/Dikes/Pump System ACR/YR06 07 Pumping/Collection MGA06 08 Transport to Treatment Plant MGA06 9x Other (Use Numbers 90-99)
07 AIR POLLUTION/GAS COLLECTION AND CONTROL 07 01 Gas/Vapor Collection Trench System LF/YR07 02 Gas/Vapor Collection Well System EA/YR07 03 Gas/Vapor Collection at Lagoon Cover SY/YR07 04 Fugitive Dust/Vapor/Gas Emissions Control ACR/YR07 9x Other (Use Numbers 90-99)
08 SOLIDS COLLECTION AND CONTAINMENT 08 01 Contaminated Soil Collection CY08 02 Waste Containment, Portable (Furnish/Fill) CY08 03 Transport to Treatment Plant CY08 04 Radioactive Specific Waste Containment (Furnish/Fill) CY08 05 Capping of Contaminated Area/Waste Pile (Soil/Asph ACR/YR08 06 Nuclear Waste Densification (Dynamic Compaction) CY08 9x Other (Use Numbers 90-99)
09 LIQUIDS/SEDIMENTS/SLUDGES COLLECTION AND CONTAINMENT
09 01 Dredging/Excavating CY09 02 Industrial Vacuuming CY09 03 Waste Containment, Portable (Furnish/Fill) MGA09 04 Transport to Treatment Plant MGA09 05 Radioactive Specific Waste Containment (Furnish/Fill) MGA09 06 Pumping/Draining/Collection MGA09 07 Lagoons/Basins/Tanks/Dikes/Pump System ACR/YR
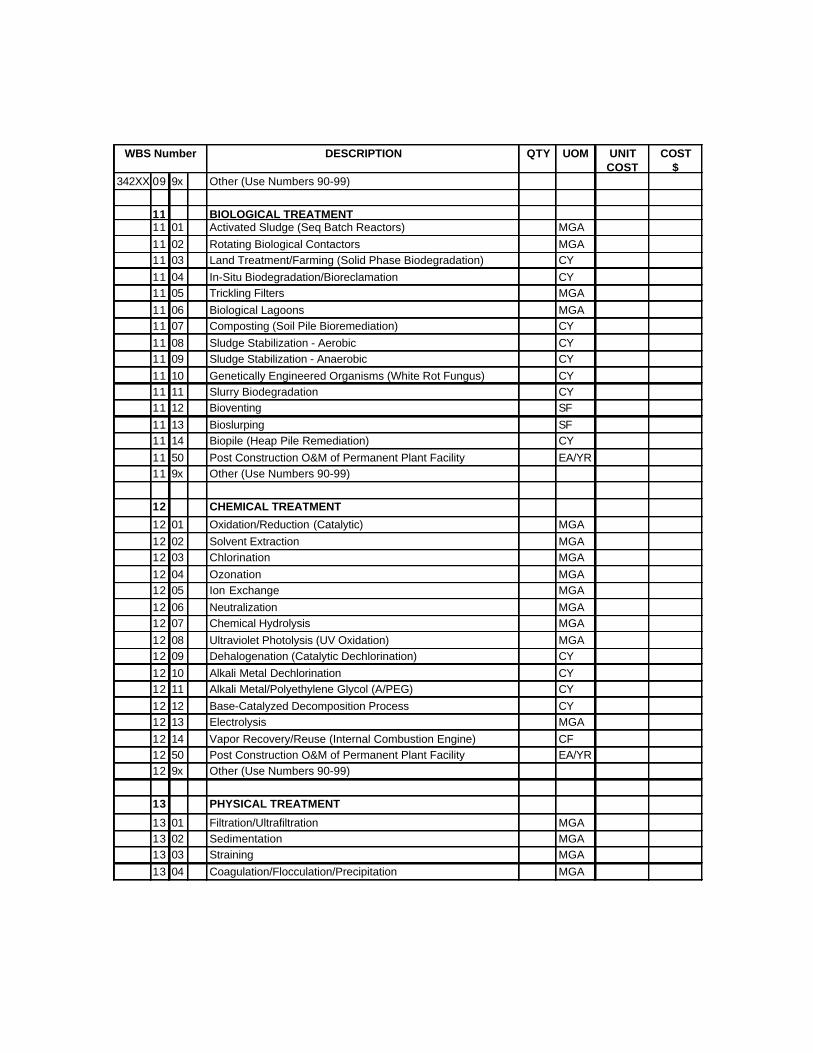
WBS Number DESCRIPTION QTY UOM UNIT COST
COST $
342XX 09 9x Other (Use Numbers 90-99)
11 BIOLOGICAL TREATMENT 11 01 Activated Sludge (Seq Batch Reactors) MGA11 02 Rotating Biological Contactors MGA11 03 Land Treatment/Farming (Solid Phase Biodegradation) CY11 04 In-Situ Biodegradation/Bioreclamation CY11 05 Trickling Filters MGA11 06 Biological Lagoons MGA11 07 Composting (Soil Pile Bioremediation) CY11 08 Sludge Stabilization - Aerobic CY11 09 Sludge Stabilization - Anaerobic CY11 10 Genetically Engineered Organisms (White Rot Fungus) CY11 11 Slurry Biodegradation CY11 12 Bioventing SF11 13 Bioslurping SF11 14 Biopile (Heap Pile Remediation) CY 11 50 Post Construction O&M of Permanent Plant Facility EA/YR11 9x Other (Use Numbers 90-99)
12 CHEMICAL TREATMENT12 01 Oxidation/Reduction (Catalytic) MGA12 02 Solvent Extraction MGA12 03 Chlorination MGA12 04 Ozonation MGA12 05 Ion Exchange MGA12 06 Neutralization MGA12 07 Chemical Hydrolysis MGA12 08 Ultraviolet Photolysis (UV Oxidation) MGA12 09 Dehalogenation (Catalytic Dechlorination) CY12 10 Alkali Metal Dechlorination CY12 11 Alkali Metal/Polyethylene Glycol (A/PEG) CY12 12 Base-Catalyzed Decomposition Process CY12 13 Electrolysis MGA12 14 Vapor Recovery/Reuse (Internal Combustion Engine) CF12 50 Post Construction O&M of Permanent Plant Facility EA/YR12 9x Other (Use Numbers 90-99)
13 PHYSICAL TREATMENT13 01 Filtration/Ultrafiltration MGA13 02 Sedimentation MGA13 03 Straining MGA13 04 Coagulation/Flocculation/Precipitation MGA

WBS Number DESCRIPTION QTY UOM UNIT COST
COST $
342XX 13 05 Equalization MGA13 06 Evaporation MGA13 07 Air Stripping MGA13 08 Steam Stripping MGA13 09 Soil Washing (Surfactant/Solvent) CY13 10 Soil Flushing (Surfactant/Solvent) CY13 11 Solids Dewatering CY13 12 Oil/Water Separation MGA13 13 Dissolved Air Floatation MGA13 14 Heavy Media Separation CY13 15 Distillation MGA13 16 Chelation MGA13 17 Solvent Extraction MGA13 18 Supercritical Extraction MGA13 19 Carbon Adsorption - Gases CF13 20 Carbon Adsorption - Liquids MGA13 21 Membrane Separation - Reverse Osmosis MGA13 22 Membrane Separation - Electrodialysis MGA13 23 Soil Vapor Extraction 27,800 CY 34.74 965,67613 24 Shredding CY13 25 Aeration CY13 26 Advanced Electrical Reactor CY13 27 Low Level Waste (LLW) Compaction CY13 28 Agglomeration CY13 29 In-Situ Steam Extraction MGA13 30 Filter Presses MGA13 31 Lignin Adsorption/Sorptive Clays CY13 32 Air Sparging 37,400 MGA 17.15 641,40913 50 Post Construction O&M of Permanent Plant Facility EA/YR13 9x Other (Use Numbers 90-99)
14 THERMAL TREATMENT 14 01 Incineration CY14 02 Low Temperature Thermal Desorption CY14 03 Supercritical Water Oxidation MGA14 04 Molten Salt Destruction CY14 05 Radio Frequency Heating CY14 06 Solar Detoxification CY14 07 High Temperature Thermal Desorption CY14 50 Post Construction O&M of Permanent Plant Facility EA/YR14 9x Other (Use Numbers 90-99)
15 STABILIZATION/FIXATION/ENCAPSULATION15 01 Molten Glass CY

WBS Number DESCRIPTION QTY UOM UNIT COST
COST $
342XX 15 02 In-Situ Vitrification CY15 03 In-Situ Pozzolan Process (Lime/Portland Cement) CY15 04 Pozzolan Process (Lime/Portland Cement) CY15 05 Asphalt-Based Encapsulation CY15 06 Radioactive Waste Solidification (Grouting/Other) CY15 07 Sludge Stabilization (Aggregate/Rock/Slag) CY15 50 Post Construction O&M of Permanent Plant Facility EA/YR15 9x Other (Use Numbers 90-99)
18 DISPOSAL (OTHER THAN COMMERCIAL)18 01 Landfill/Burial Ground/Trench/Pits CY18 02 Above-Ground Vault CY18 03 Underground Vault CY18 04 Underground Mine/Shaft CY18 05 Tanks MGA18 06 Pads (Tumulus/Retrievable Storage/Other) CY18 07 Storage Bldgs/Protective Cvr Structures/Other Bldgs & CY 18 08 Cribs CY18 09 Deep Well Injection MGA18 10 Incinerator CY18 15 Post Construction O&M of Permanent Disposal Fac EA/YR18 20 Container Handling EA18 21 Transportation to Storage/Disposal Facility TON18 22 Disposal Fees & Taxes TON18 23 Mixed Waste Storage Fees & Taxes TON18 9x Other (Use Numbers 90-99) 1 LS 30,000.00 30,000
9X OTHER (Use Numbers 90-99)
TOTAL AMOUNT $ 2,616,890
EP 1110-1-1930 Jun 01
D-1
APPENDIX DCOST REPORTING TEMPLATES
The following pages provide example summary sheets to report or estimate capital, O&M, andperiodic costs, either RA or post-RA, and templates for HCAS data entry using the HTRW RAWBS for RA capital and RA operating costs that are required for input. These sheets should befilled in with the required information and submitted (1 copy each) to the USACE HTRW Centerof Expertise and HQ USACE. Also provided is the HTRW O&M WBS shown to the third(subsystem) level with columns for input of quantities and costs. The forms are availableelectronically for downloading at http://www.environmental.usace.army.mil/info/technical/cost/cost.html. Mailing addresses are as follows:
U.S. Army Corps of EngineersHTRW Center of Expertise (CENWO-HX-T)12565 West Center RoadOmaha, NE 68144-3869
U.S. Army Corps of EngineersHeadquarters (_____________)441 G Street, NWWashington, D.C. 20314
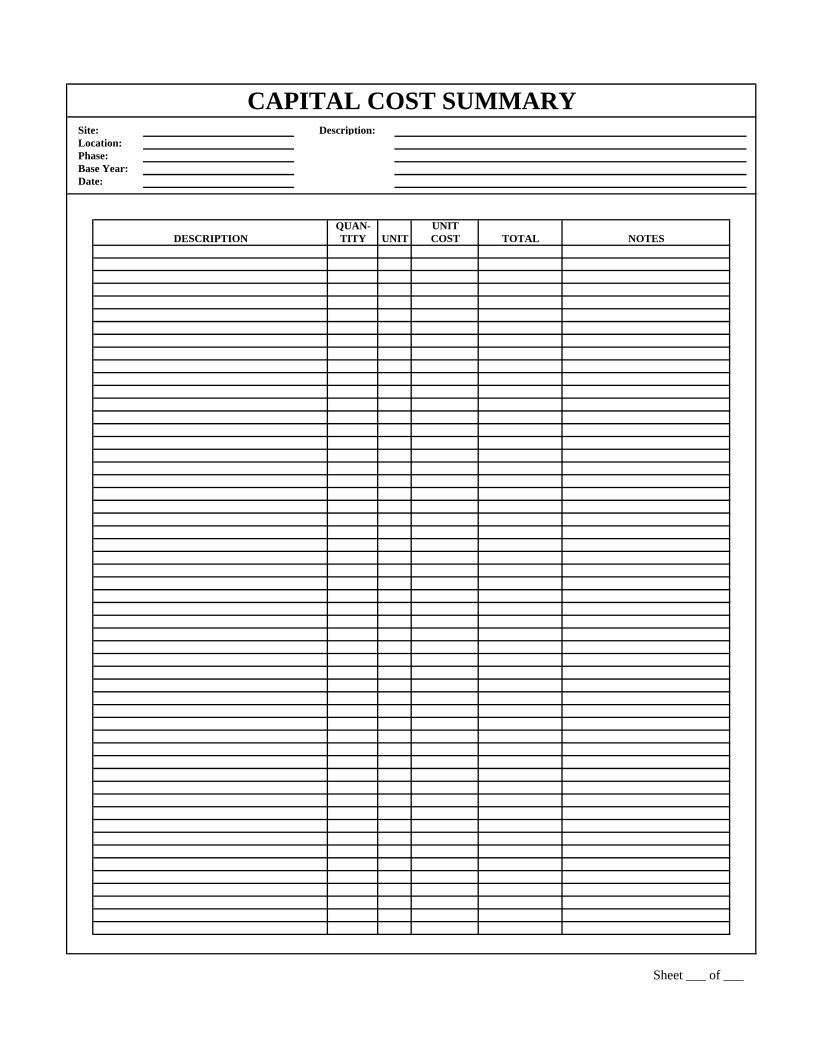
Site: Description:Location:Phase:Base Year:Date:
Sheet ___ of ___
CAPITAL COST SUMMARY
QUAN-COST TOTALUNIT
DESCRIPTION TITY NOTESUNIT

Site: Description:Location:Phase:Base Year:Date:
Sheet ___ of ___
O&M COST SUMMARY
TITYQUAN-
DESCRIPTION NOTESUNITUNITCOST TOTAL

Site: Description:Location:Phase:Base Year:Date:
Sheet ___ of ___
PERIODIC COST SUMMARY
UNIT NOTESCOST TOTALDESCRIPTIONQUAN- UNITTITY
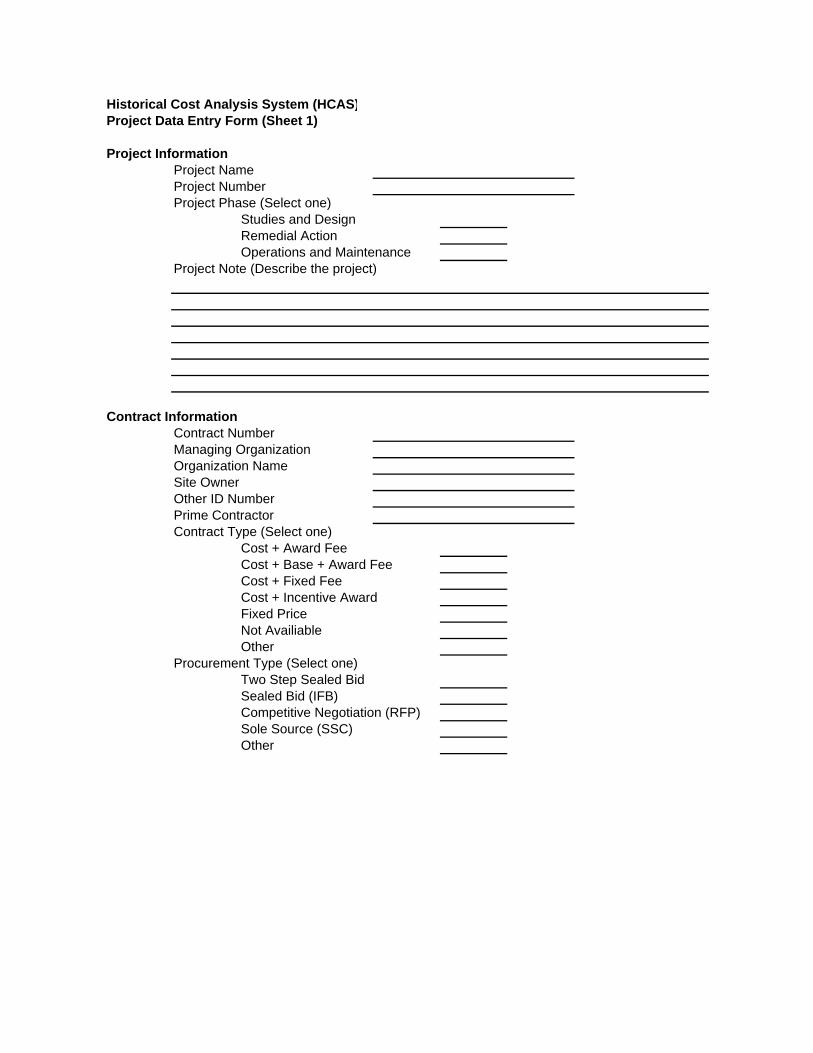
Historical Cost Analysis System (HCAS)Project Data Entry Form (Sheet 1)
Project InformationProject Name Project Number Project Phase (Select one)
Studies and DesignRemedial ActionOperations and Maintenance
Project Note (Describe the project)
Contract InformationContract Number
Managing Organization Organization Name Site Owner Other ID Number Prime Contractor Contract Type (Select one)
Cost + Award FeeCost + Base + Award FeeCost + Fixed FeeCost + Incentive AwardFixed PriceNot AvailiableOther
Procurement Type (Select one) Two Step Sealed Bid
Sealed Bid (IFB)Competitive Negotiation (RFP)Sole Source (SSC)Other

Historical Cost Analysis System (HCAS)Project Data Entry Form (Sheet 2)
Site InformationState/Country Installation Site Name Site Number EPA Region Current Use (Select one)
Installation OperationIndustry OperationResidentialRecreationalWildlife RefugeWaste DisposalAdministrative OfficeCommercialOtherUnknown
Future Use (Select one)Installation OperationIndustry OperationResidentialRecreationalWildlife RefugeWaste DisposalAdministrative OfficeCommercialOtherUnknown
Point of ContactData Entry Person POC#2 POC#3
Title/Role Organization Name Address City, State Zip Telephone Fax Email
Enter up to 3 POC's.
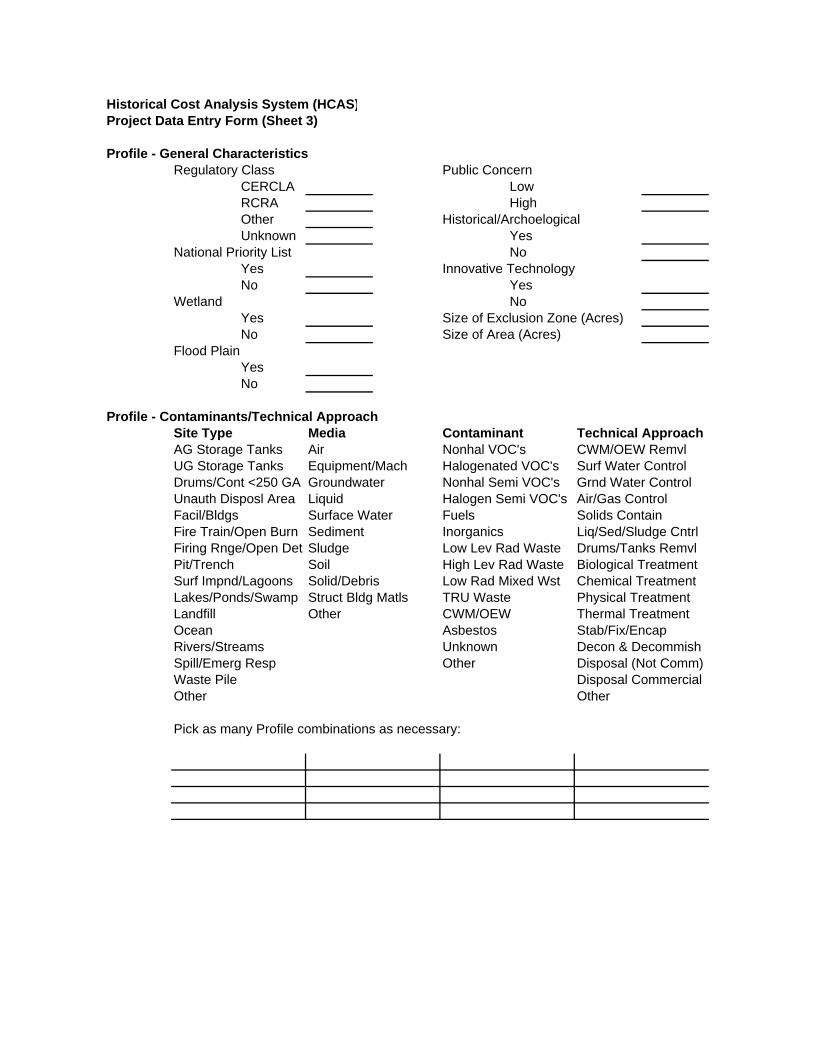
Historical Cost Analysis System (HCAS)Project Data Entry Form (Sheet 3)
Profile - General CharacteristicsRegulatory Class Public Concern
CERCLA LowRCRA HighOther Historical/ArchoelogicalUnknown Yes
National Priority List NoYes Innovative TechnologyNo Yes
Wetland NoYes Size of Exclusion Zone (Acres)No Size of Area (Acres)
Flood PlainYesNo
Profile - Contaminants/Technical Approach Site Type Media Contaminant Technical Approach
AG Storage Tanks Air Nonhal VOC's CWM/OEW RemvlUG Storage Tanks Equipment/Mach Halogenated VOC's Surf Water ControlDrums/Cont <250 GA Groundwater Nonhal Semi VOC's Grnd Water ControlUnauth Disposl Area Liquid Halogen Semi VOC's Air/Gas ControlFacil/Bldgs Surface Water Fuels Solids ContainFire Train/Open Burn Sediment Inorganics Liq/Sed/Sludge CntrlFiring Rnge/Open Det Sludge Low Lev Rad Waste Drums/Tanks RemvlPit/Trench Soil High Lev Rad Waste Biological TreatmentSurf Impnd/Lagoons Solid/Debris Low Rad Mixed Wst Chemical TreatmentLakes/Ponds/Swamp Struct Bldg Matls TRU Waste Physical TreatmentLandfill Other CWM/OEW Thermal TreatmentOcean Asbestos Stab/Fix/EncapRivers/Streams Unknown Decon & DecommishSpill/Emerg Resp Other Disposal (Not Comm)Waste Pile Disposal CommercialOther Other
Pick as many Profile combinations as necessary:
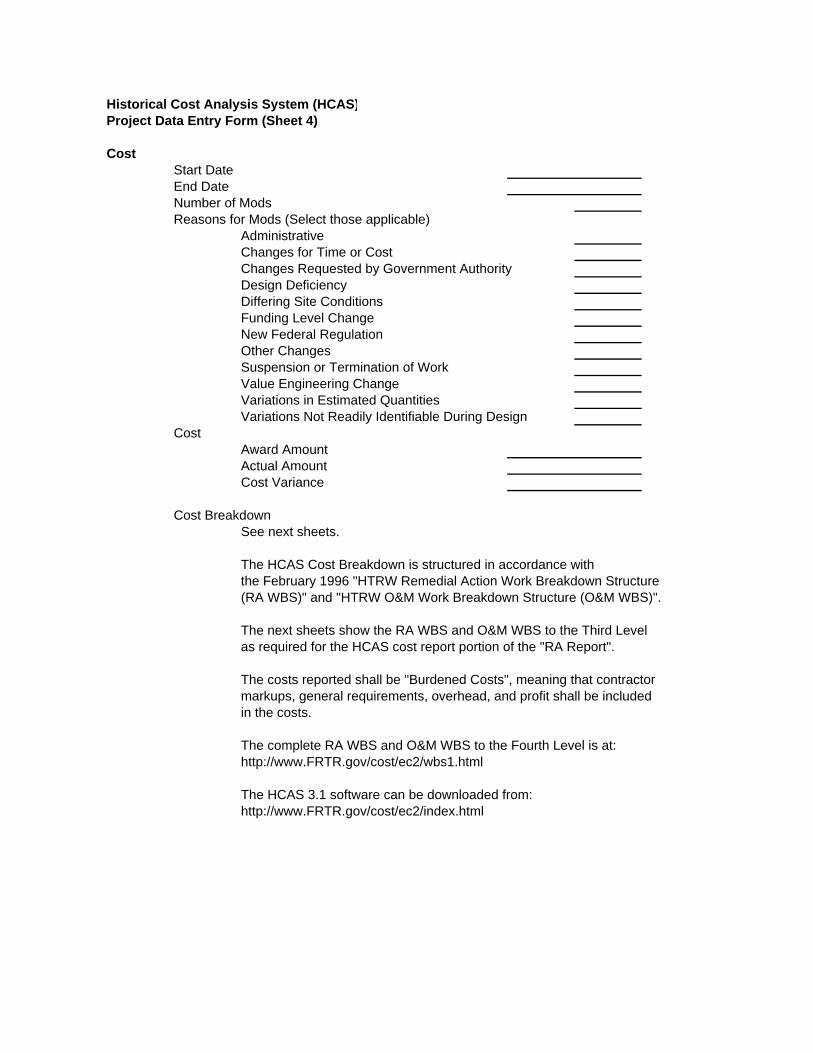
Historical Cost Analysis System (HCAS)Project Data Entry Form (Sheet 4)
CostStart Date End Date Number of ModsReasons for Mods (Select those applicable)
AdministrativeChanges for Time or CostChanges Requested by Government AuthorityDesign DeficiencyDiffering Site ConditionsFunding Level ChangeNew Federal RegulationOther ChangesSuspension or Termination of WorkValue Engineering ChangeVariations in Estimated QuantitiesVariations Not Readily Identifiable During Design
CostAward Amount Actual Amount Cost Variance
Cost Breakdown See next sheets.
The HCAS Cost Breakdown is structured in accordance with the February 1996 "HTRW Remedial Action Work Breakdown Structure(RA WBS)" and "HTRW O&M Work Breakdown Structure (O&M WBS)".
The next sheets show the RA WBS and O&M WBS to the Third Level as required for the HCAS cost report portion of the "RA Report".
The costs reported shall be "Burdened Costs", meaning that contractor markups, general requirements, overhead, and profit shall be includedin the costs.
The complete RA WBS and O&M WBS to the Fourth Level is at: http://www.FRTR.gov/cost/ec2/wbs1.html
The HCAS 3.1 software can be downloaded from:http://www.FRTR.gov/cost/ec2/index.html
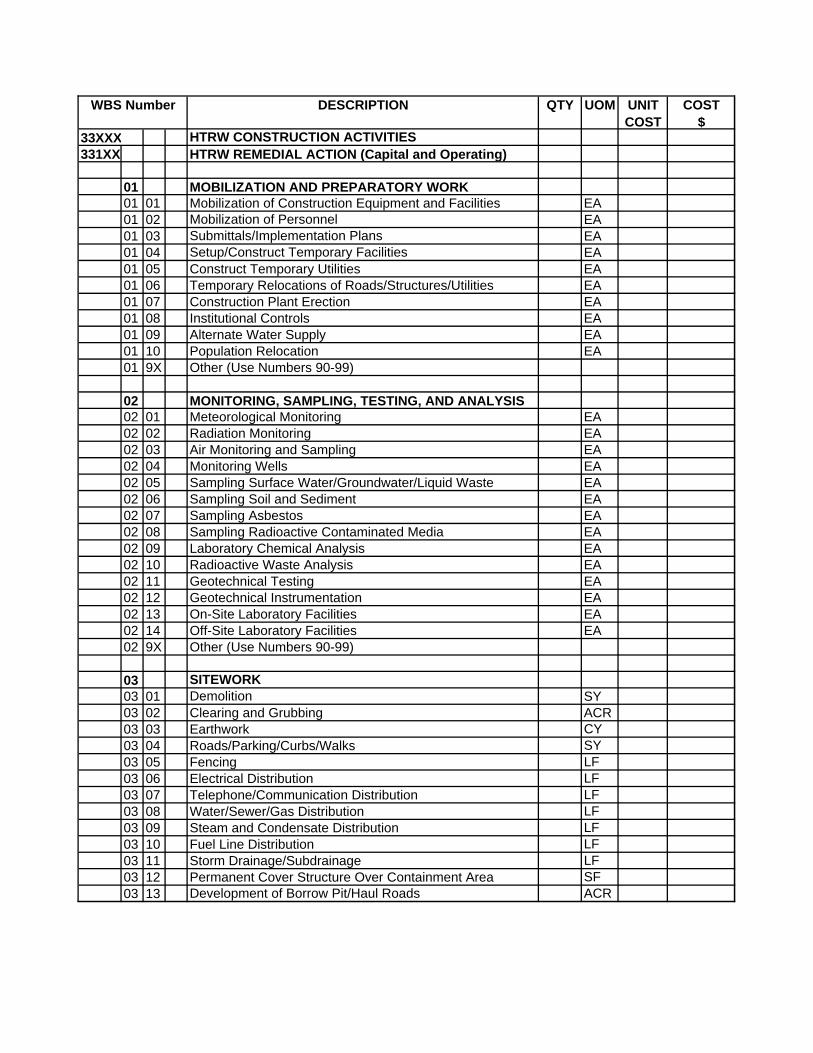
WBS Number DESCRIPTION QTY UOM UNIT COST
COST $
33XXX HTRW CONSTRUCTION ACTIVITIES331XX HTRW REMEDIAL ACTION (Capital and Operating)
01 MOBILIZATION AND PREPARATORY WORK 01 01 Mobilization of Construction Equipment and Facilities EA01 02 Mobilization of Personnel EA01 03 Submittals/Implementation Plans EA01 04 Setup/Construct Temporary Facilities EA01 05 Construct Temporary Utilities EA01 06 Temporary Relocations of Roads/Structures/Utilities EA01 07 Construction Plant Erection EA01 08 Institutional Controls EA01 09 Alternate Water Supply EA01 10 Population Relocation EA01 9X Other (Use Numbers 90-99)
02 MONITORING, SAMPLING, TESTING, AND ANALYSIS 02 01 Meteorological Monitoring EA02 02 Radiation Monitoring EA02 03 Air Monitoring and Sampling EA02 04 Monitoring Wells EA02 05 Sampling Surface Water/Groundwater/Liquid Waste EA02 06 Sampling Soil and Sediment EA02 07 Sampling Asbestos EA02 08 Sampling Radioactive Contaminated Media EA02 09 Laboratory Chemical Analysis EA02 10 Radioactive Waste Analysis EA02 11 Geotechnical Testing EA02 12 Geotechnical Instrumentation EA02 13 On-Site Laboratory Facilities EA02 14 Off-Site Laboratory Facilities EA02 9X Other (Use Numbers 90-99)
03 SITEWORK03 01 Demolition SY03 02 Clearing and Grubbing ACR03 03 Earthwork CY03 04 Roads/Parking/Curbs/Walks SY03 05 Fencing LF03 06 Electrical Distribution LF03 07 Telephone/Communication Distribution LF03 08 Water/Sewer/Gas Distribution LF03 09 Steam and Condensate Distribution LF03 10 Fuel Line Distribution LF03 11 Storm Drainage/Subdrainage LF03 12 Permanent Cover Structure Over Containment Area SF03 13 Development of Borrow Pit/Haul Roads ACR
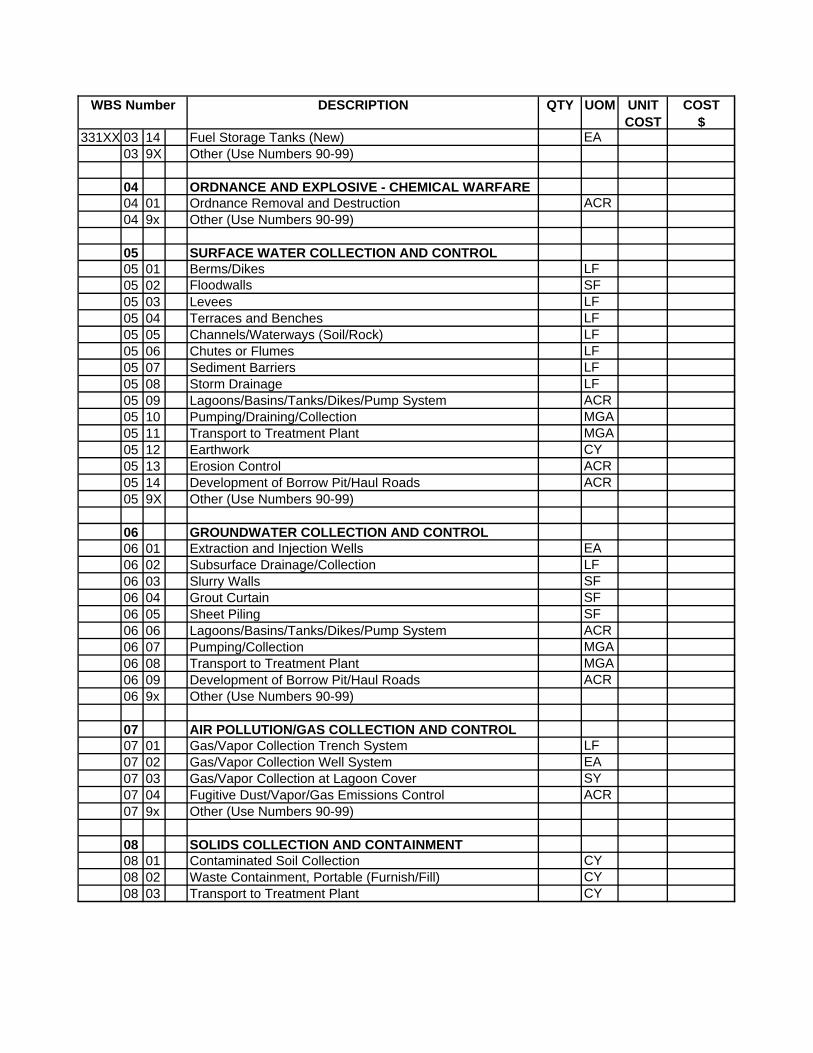
WBS Number DESCRIPTION QTY UOM UNIT COST
COST $
331XX 03 14 Fuel Storage Tanks (New) EA03 9X Other (Use Numbers 90-99)
04 ORDNANCE AND EXPLOSIVE - CHEMICAL WARFARE 04 01 Ordnance Removal and Destruction ACR04 9x Other (Use Numbers 90-99)
05 SURFACE WATER COLLECTION AND CONTROL05 01 Berms/Dikes LF05 02 Floodwalls SF05 03 Levees LF05 04 Terraces and Benches LF05 05 Channels/Waterways (Soil/Rock) LF05 06 Chutes or Flumes LF05 07 Sediment Barriers LF05 08 Storm Drainage LF05 09 Lagoons/Basins/Tanks/Dikes/Pump System ACR05 10 Pumping/Draining/Collection MGA05 11 Transport to Treatment Plant MGA05 12 Earthwork CY05 13 Erosion Control ACR05 14 Development of Borrow Pit/Haul Roads ACR05 9X Other (Use Numbers 90-99)
06 GROUNDWATER COLLECTION AND CONTROL06 01 Extraction and Injection Wells EA06 02 Subsurface Drainage/Collection LF06 03 Slurry Walls SF06 04 Grout Curtain SF06 05 Sheet Piling SF06 06 Lagoons/Basins/Tanks/Dikes/Pump System ACR06 07 Pumping/Collection MGA06 08 Transport to Treatment Plant MGA06 09 Development of Borrow Pit/Haul Roads ACR06 9x Other (Use Numbers 90-99)
07 AIR POLLUTION/GAS COLLECTION AND CONTROL 07 01 Gas/Vapor Collection Trench System LF07 02 Gas/Vapor Collection Well System EA07 03 Gas/Vapor Collection at Lagoon Cover SY07 04 Fugitive Dust/Vapor/Gas Emissions Control ACR07 9x Other (Use Numbers 90-99)
08 SOLIDS COLLECTION AND CONTAINMENT 08 01 Contaminated Soil Collection CY08 02 Waste Containment, Portable (Furnish/Fill) CY08 03 Transport to Treatment Plant CY
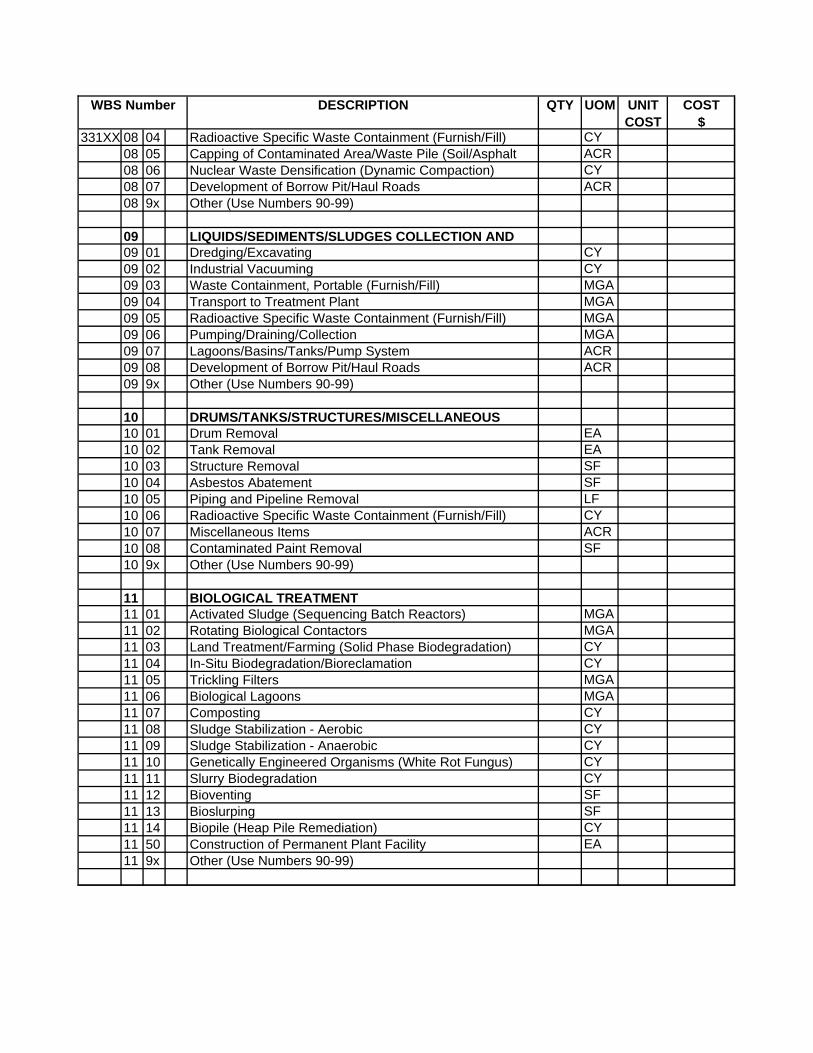
WBS Number DESCRIPTION QTY UOM UNIT COST
COST $
331XX 08 04 Radioactive Specific Waste Containment (Furnish/Fill) CY08 05 Capping of Contaminated Area/Waste Pile (Soil/Asphalt ACR08 06 Nuclear Waste Densification (Dynamic Compaction) CY08 07 Development of Borrow Pit/Haul Roads ACR08 9x Other (Use Numbers 90-99)
09 LIQUIDS/SEDIMENTS/SLUDGES COLLECTION AND 09 01 Dredging/Excavating CY09 02 Industrial Vacuuming CY09 03 Waste Containment, Portable (Furnish/Fill) MGA09 04 Transport to Treatment Plant MGA09 05 Radioactive Specific Waste Containment (Furnish/Fill) MGA09 06 Pumping/Draining/Collection MGA09 07 Lagoons/Basins/Tanks/Pump System ACR09 08 Development of Borrow Pit/Haul Roads ACR09 9x Other (Use Numbers 90-99)
10 DRUMS/TANKS/STRUCTURES/MISCELLANEOUS 10 01 Drum Removal EA10 02 Tank Removal EA10 03 Structure Removal SF10 04 Asbestos Abatement SF10 05 Piping and Pipeline Removal LF10 06 Radioactive Specific Waste Containment (Furnish/Fill) CY10 07 Miscellaneous Items ACR10 08 Contaminated Paint Removal SF10 9x Other (Use Numbers 90-99)
11 BIOLOGICAL TREATMENT 11 01 Activated Sludge (Sequencing Batch Reactors) MGA11 02 Rotating Biological Contactors MGA11 03 Land Treatment/Farming (Solid Phase Biodegradation) CY11 04 In-Situ Biodegradation/Bioreclamation CY11 05 Trickling Filters MGA11 06 Biological Lagoons MGA11 07 Composting CY11 08 Sludge Stabilization - Aerobic CY11 09 Sludge Stabilization - Anaerobic CY11 10 Genetically Engineered Organisms (White Rot Fungus) CY11 11 Slurry Biodegradation CY11 12 Bioventing SF11 13 Bioslurping SF11 14 Biopile (Heap Pile Remediation) CY11 50 Construction of Permanent Plant Facility EA11 9x Other (Use Numbers 90-99)
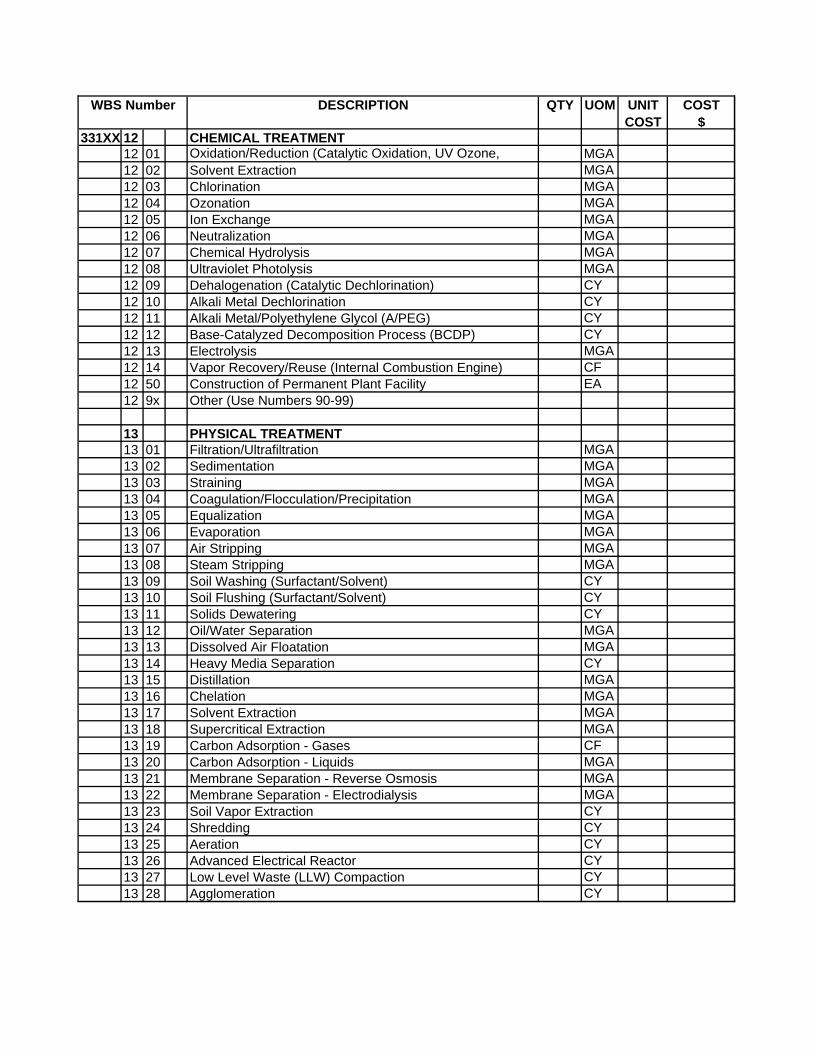
WBS Number DESCRIPTION QTY UOM UNIT COST
COST $
331XX 12 CHEMICAL TREATMENT12 01 Oxidation/Reduction (Catalytic Oxidation, UV Ozone, MGA12 02 Solvent Extraction MGA12 03 Chlorination MGA12 04 Ozonation MGA12 05 Ion Exchange MGA12 06 Neutralization MGA12 07 Chemical Hydrolysis MGA12 08 Ultraviolet Photolysis MGA12 09 Dehalogenation (Catalytic Dechlorination) CY12 10 Alkali Metal Dechlorination CY12 11 Alkali Metal/Polyethylene Glycol (A/PEG) CY12 12 Base-Catalyzed Decomposition Process (BCDP) CY12 13 Electrolysis MGA12 14 Vapor Recovery/Reuse (Internal Combustion Engine) CF12 50 Construction of Permanent Plant Facility EA12 9x Other (Use Numbers 90-99)
13 PHYSICAL TREATMENT13 01 Filtration/Ultrafiltration MGA13 02 Sedimentation MGA13 03 Straining MGA13 04 Coagulation/Flocculation/Precipitation MGA13 05 Equalization MGA13 06 Evaporation MGA13 07 Air Stripping MGA13 08 Steam Stripping MGA13 09 Soil Washing (Surfactant/Solvent) CY13 10 Soil Flushing (Surfactant/Solvent) CY13 11 Solids Dewatering CY13 12 Oil/Water Separation MGA13 13 Dissolved Air Floatation MGA13 14 Heavy Media Separation CY13 15 Distillation MGA13 16 Chelation MGA13 17 Solvent Extraction MGA13 18 Supercritical Extraction MGA13 19 Carbon Adsorption - Gases CF13 20 Carbon Adsorption - Liquids MGA13 21 Membrane Separation - Reverse Osmosis MGA13 22 Membrane Separation - Electrodialysis MGA13 23 Soil Vapor Extraction CY13 24 Shredding CY13 25 Aeration CY13 26 Advanced Electrical Reactor CY13 27 Low Level Waste (LLW) Compaction CY13 28 Agglomeration CY
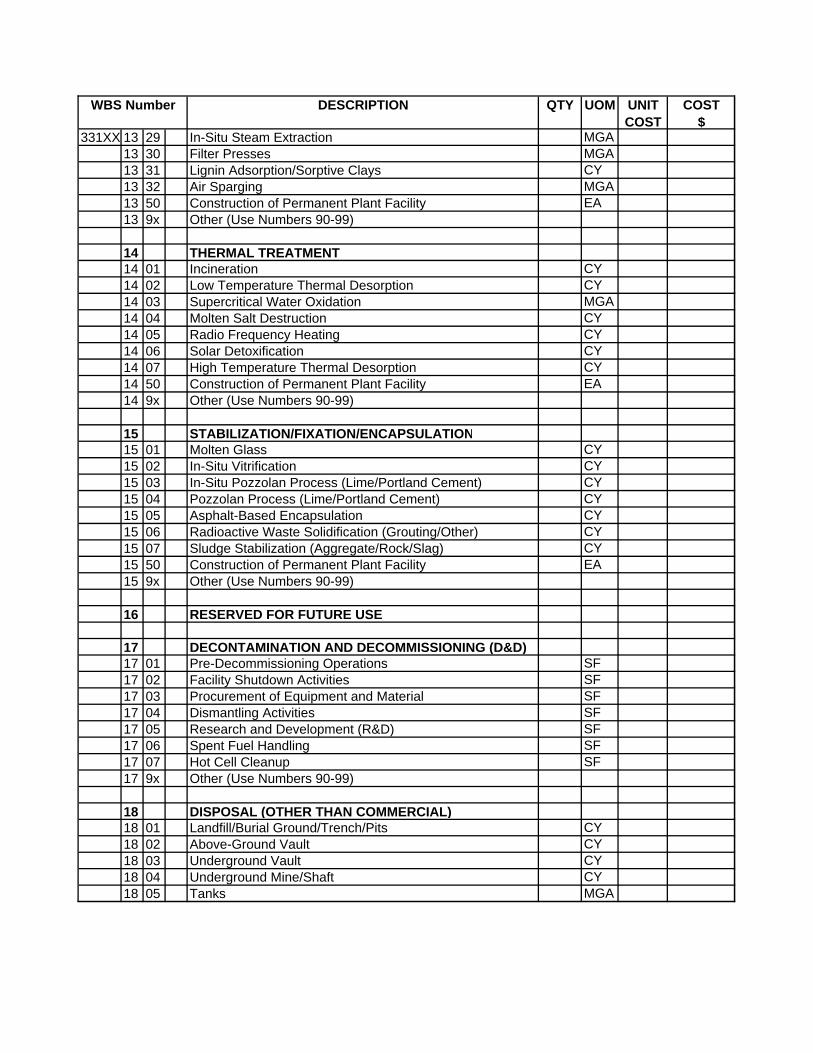
WBS Number DESCRIPTION QTY UOM UNIT COST
COST $
331XX 13 29 In-Situ Steam Extraction MGA13 30 Filter Presses MGA13 31 Lignin Adsorption/Sorptive Clays CY13 32 Air Sparging MGA13 50 Construction of Permanent Plant Facility EA13 9x Other (Use Numbers 90-99)
14 THERMAL TREATMENT 14 01 Incineration CY14 02 Low Temperature Thermal Desorption CY14 03 Supercritical Water Oxidation MGA14 04 Molten Salt Destruction CY14 05 Radio Frequency Heating CY14 06 Solar Detoxification CY14 07 High Temperature Thermal Desorption CY14 50 Construction of Permanent Plant Facility EA14 9x Other (Use Numbers 90-99)
15 STABILIZATION/FIXATION/ENCAPSULATION15 01 Molten Glass CY15 02 In-Situ Vitrification CY15 03 In-Situ Pozzolan Process (Lime/Portland Cement) CY15 04 Pozzolan Process (Lime/Portland Cement) CY15 05 Asphalt-Based Encapsulation CY15 06 Radioactive Waste Solidification (Grouting/Other) CY15 07 Sludge Stabilization (Aggregate/Rock/Slag) CY15 50 Construction of Permanent Plant Facility EA15 9x Other (Use Numbers 90-99)
16 RESERVED FOR FUTURE USE
17 DECONTAMINATION AND DECOMMISSIONING (D&D)17 01 Pre-Decommissioning Operations SF17 02 Facility Shutdown Activities SF17 03 Procurement of Equipment and Material SF17 04 Dismantling Activities SF17 05 Research and Development (R&D) SF17 06 Spent Fuel Handling SF17 07 Hot Cell Cleanup SF17 9x Other (Use Numbers 90-99)
18 DISPOSAL (OTHER THAN COMMERCIAL)18 01 Landfill/Burial Ground/Trench/Pits CY18 02 Above-Ground Vault CY18 03 Underground Vault CY18 04 Underground Mine/Shaft CY18 05 Tanks MGA
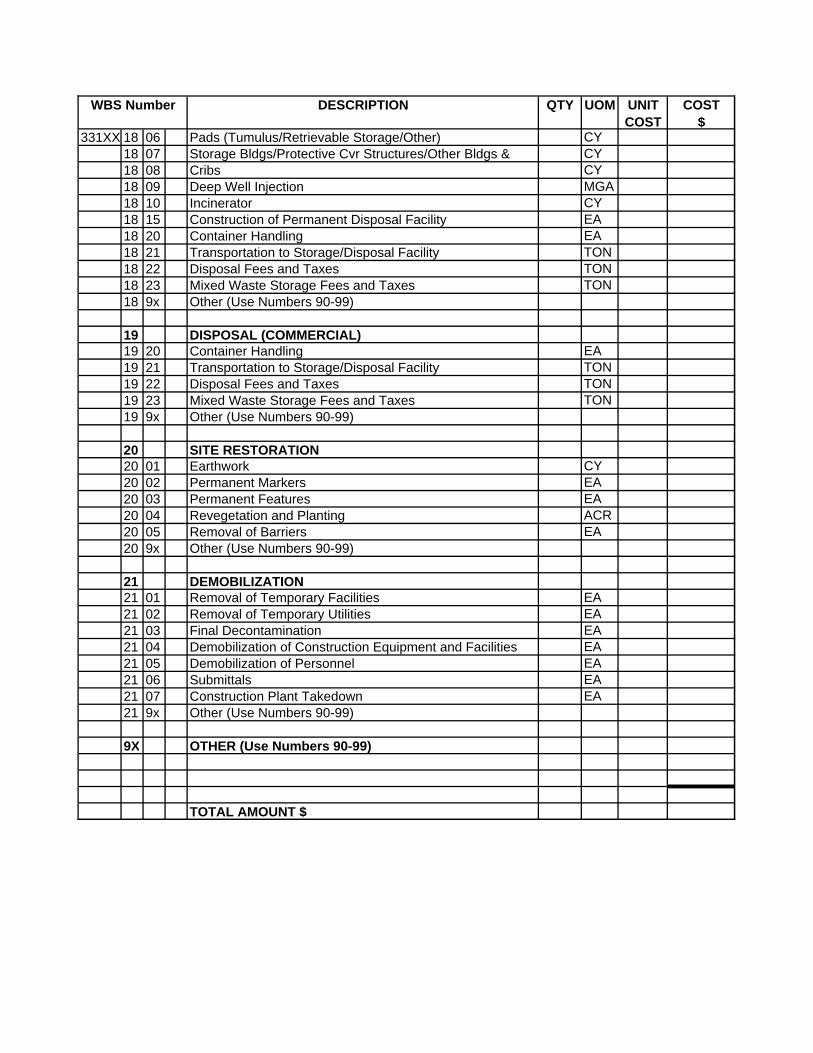
WBS Number DESCRIPTION QTY UOM UNIT COST
COST $
331XX 18 06 Pads (Tumulus/Retrievable Storage/Other) CY18 07 Storage Bldgs/Protective Cvr Structures/Other Bldgs & CY 18 08 Cribs CY18 09 Deep Well Injection MGA18 10 Incinerator CY18 15 Construction of Permanent Disposal Facility EA18 20 Container Handling EA18 21 Transportation to Storage/Disposal Facility TON18 22 Disposal Fees and Taxes TON18 23 Mixed Waste Storage Fees and Taxes TON18 9x Other (Use Numbers 90-99)
19 DISPOSAL (COMMERCIAL)19 20 Container Handling EA19 21 Transportation to Storage/Disposal Facility TON19 22 Disposal Fees and Taxes TON19 23 Mixed Waste Storage Fees and Taxes TON19 9x Other (Use Numbers 90-99)
20 SITE RESTORATION20 01 Earthwork CY20 02 Permanent Markers EA20 03 Permanent Features EA20 04 Revegetation and Planting ACR20 05 Removal of Barriers EA20 9x Other (Use Numbers 90-99)
21 DEMOBILIZATION21 01 Removal of Temporary Facilities EA21 02 Removal of Temporary Utilities EA21 03 Final Decontamination EA21 04 Demobilization of Construction Equipment and Facilities EA21 05 Demobilization of Personnel EA21 06 Submittals EA21 07 Construction Plant Takedown EA21 9x Other (Use Numbers 90-99)
9X OTHER (Use Numbers 90-99)
TOTAL AMOUNT $
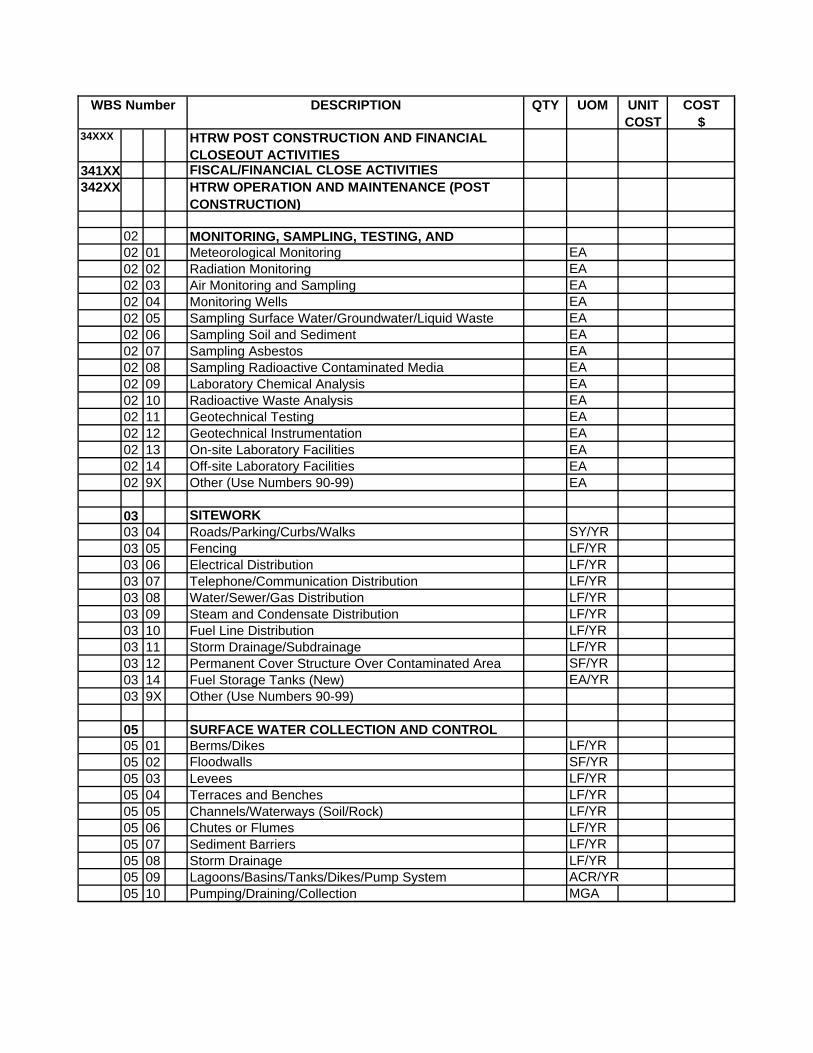
WBS Number DESCRIPTION QTY UOM UNIT COST
COST $
34XXX HTRW POST CONSTRUCTION AND FINANCIAL CLOSEOUT ACTIVITIES
341XX FISCAL/FINANCIAL CLOSE ACTIVITIES342XX HTRW OPERATION AND MAINTENANCE (POST
CONSTRUCTION)
02 MONITORING, SAMPLING, TESTING, AND 02 01 Meteorological Monitoring EA02 02 Radiation Monitoring EA02 03 Air Monitoring and Sampling EA02 04 Monitoring Wells EA02 05 Sampling Surface Water/Groundwater/Liquid Waste EA02 06 Sampling Soil and Sediment EA02 07 Sampling Asbestos EA02 08 Sampling Radioactive Contaminated Media EA02 09 Laboratory Chemical Analysis EA02 10 Radioactive Waste Analysis EA02 11 Geotechnical Testing EA02 12 Geotechnical Instrumentation EA02 13 On-site Laboratory Facilities EA02 14 Off-site Laboratory Facilities EA02 9X Other (Use Numbers 90-99) EA
03 SITEWORK03 04 Roads/Parking/Curbs/Walks SY/YR03 05 Fencing LF/YR03 06 Electrical Distribution LF/YR03 07 Telephone/Communication Distribution LF/YR03 08 Water/Sewer/Gas Distribution LF/YR03 09 Steam and Condensate Distribution LF/YR03 10 Fuel Line Distribution LF/YR03 11 Storm Drainage/Subdrainage LF/YR03 12 Permanent Cover Structure Over Contaminated Area SF/YR03 14 Fuel Storage Tanks (New) EA/YR03 9X Other (Use Numbers 90-99)
05 SURFACE WATER COLLECTION AND CONTROL05 01 Berms/Dikes LF/YR05 02 Floodwalls SF/YR05 03 Levees LF/YR05 04 Terraces and Benches LF/YR05 05 Channels/Waterways (Soil/Rock) LF/YR05 06 Chutes or Flumes LF/YR05 07 Sediment Barriers LF/YR05 08 Storm Drainage LF/YR05 09 Lagoons/Basins/Tanks/Dikes/Pump System ACR/YR05 10 Pumping/Draining/Collection MGA

WBS Number DESCRIPTION QTY UOM UNIT COST
COST $
342XX 05 11 Transport to Treatment Plant MGA05 13 Erosion Control ACR/YR05 9X Other (Use Numbers 90-99)
06 GROUNDWATER COLLECTION AND CONTROL06 01 Extraction and Injection Wells EA/YR06 02 Subsurface Drainage/Collection LF/YR06 03 Slurry Walls SF/YR06 04 Grout Curtain SF/YR06 05 Sheet Piling SF/YR06 06 Lagoons/Basins/Tanks/Dikes/Pump System ACR/YR06 07 Pumping/Collection MGA06 08 Transport to Treatment Plant MGA06 9x Other (Use Numbers 90-99)
07 AIR POLLUTION/GAS COLLECTION AND CONTROL
07 01 Gas/Vapor Collection Trench System LF/YR07 02 Gas/Vapor Collection Well System EA/YR07 03 Gas/Vapor Collection at Lagoon Cover SY/YR07 04 Fugitive Dust/Vapor/Gas Emissions Control ACR/YR07 9x Other (Use Numbers 90-99)
08 SOLIDS COLLECTION AND CONTAINMENT 08 01 Contaminated Soil Collection CY08 02 Waste Containment, Portable (Furnish/Fill) CY08 03 Transport to Treatment Plant CY08 04 Radioactive Specific Waste Containment (Furnish/Fill) CY08 05 Capping of Contaminated Area/Waste Pile (Soil/Asph ACR/YR08 06 Nuclear Waste Densification (Dynamic Compaction) CY08 9x Other (Use Numbers 90-99)
09 LIQUIDS/SEDIMENTS/SLUDGES COLLECTION AND CONTAINMENT
09 01 Dredging/Excavating CY09 02 Industrial Vacuuming CY09 03 Waste Containment, Portable (Furnish/Fill) MGA09 04 Transport to Treatment Plant MGA09 05 Radioactive Specific Waste Containment (Furnish/Fill) MGA09 06 Pumping/Draining/Collection MGA09 07 Lagoons/Basins/Tanks/Dikes/Pump System ACR/YR09 9x Other (Use Numbers 90-99)
11 BIOLOGICAL TREATMENT 11 01 Activated Sludge (Seq Batch Reactors) MGA11 02 Rotating Biological Contactors MGA
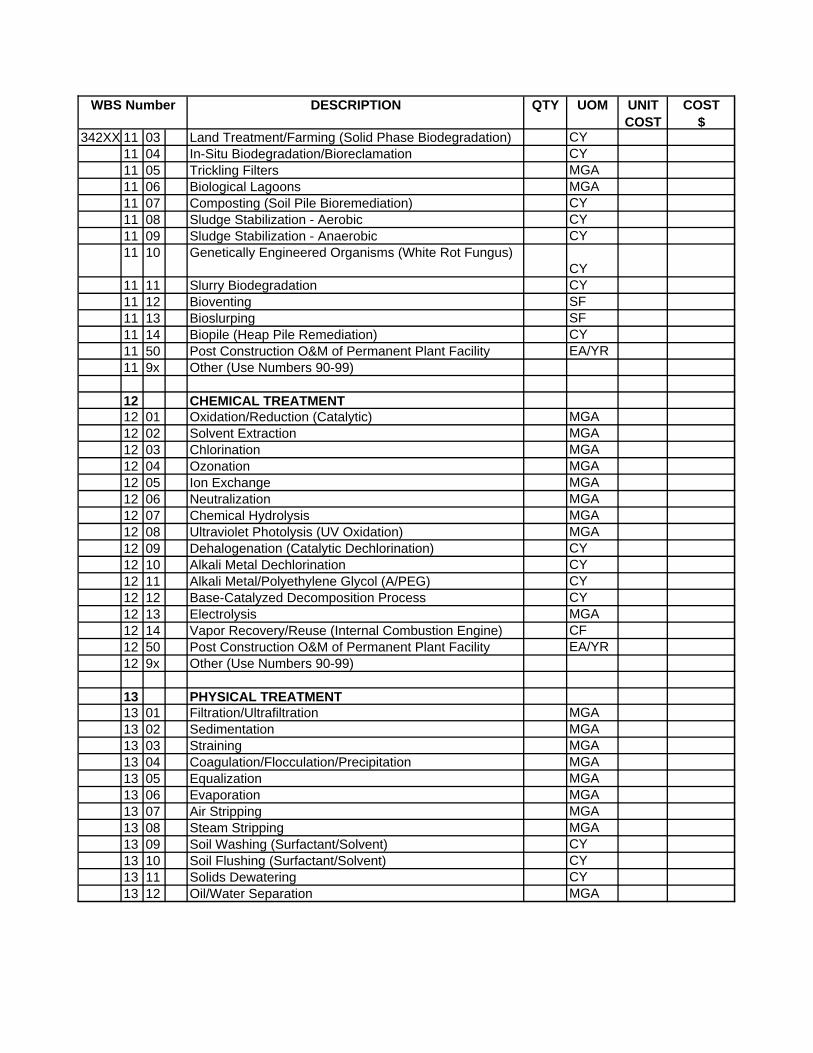
WBS Number DESCRIPTION QTY UOM UNIT COST
COST $
342XX 11 03 Land Treatment/Farming (Solid Phase Biodegradation) CY11 04 In-Situ Biodegradation/Bioreclamation CY11 05 Trickling Filters MGA11 06 Biological Lagoons MGA11 07 Composting (Soil Pile Bioremediation) CY11 08 Sludge Stabilization - Aerobic CY11 09 Sludge Stabilization - Anaerobic CY11 10 Genetically Engineered Organisms (White Rot Fungus)
CY11 11 Slurry Biodegradation CY11 12 Bioventing SF11 13 Bioslurping SF11 14 Biopile (Heap Pile Remediation) CY 11 50 Post Construction O&M of Permanent Plant Facility EA/YR11 9x Other (Use Numbers 90-99)
12 CHEMICAL TREATMENT12 01 Oxidation/Reduction (Catalytic) MGA12 02 Solvent Extraction MGA12 03 Chlorination MGA12 04 Ozonation MGA12 05 Ion Exchange MGA12 06 Neutralization MGA12 07 Chemical Hydrolysis MGA12 08 Ultraviolet Photolysis (UV Oxidation) MGA12 09 Dehalogenation (Catalytic Dechlorination) CY12 10 Alkali Metal Dechlorination CY12 11 Alkali Metal/Polyethylene Glycol (A/PEG) CY12 12 Base-Catalyzed Decomposition Process CY12 13 Electrolysis MGA12 14 Vapor Recovery/Reuse (Internal Combustion Engine) CF12 50 Post Construction O&M of Permanent Plant Facility EA/YR12 9x Other (Use Numbers 90-99)
13 PHYSICAL TREATMENT13 01 Filtration/Ultrafiltration MGA13 02 Sedimentation MGA13 03 Straining MGA13 04 Coagulation/Flocculation/Precipitation MGA13 05 Equalization MGA13 06 Evaporation MGA13 07 Air Stripping MGA13 08 Steam Stripping MGA13 09 Soil Washing (Surfactant/Solvent) CY13 10 Soil Flushing (Surfactant/Solvent) CY13 11 Solids Dewatering CY13 12 Oil/Water Separation MGA
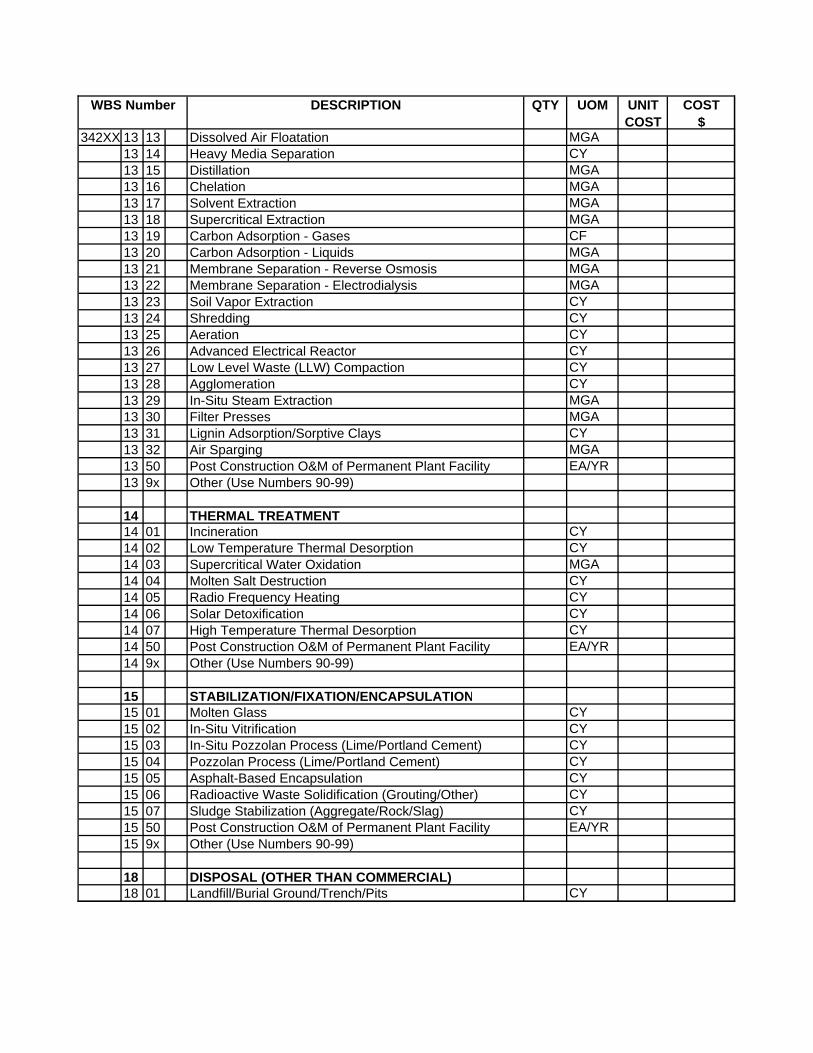
WBS Number DESCRIPTION QTY UOM UNIT COST
COST $
342XX 13 13 Dissolved Air Floatation MGA13 14 Heavy Media Separation CY13 15 Distillation MGA13 16 Chelation MGA13 17 Solvent Extraction MGA13 18 Supercritical Extraction MGA13 19 Carbon Adsorption - Gases CF13 20 Carbon Adsorption - Liquids MGA13 21 Membrane Separation - Reverse Osmosis MGA13 22 Membrane Separation - Electrodialysis MGA13 23 Soil Vapor Extraction CY13 24 Shredding CY13 25 Aeration CY13 26 Advanced Electrical Reactor CY13 27 Low Level Waste (LLW) Compaction CY13 28 Agglomeration CY13 29 In-Situ Steam Extraction MGA13 30 Filter Presses MGA13 31 Lignin Adsorption/Sorptive Clays CY13 32 Air Sparging MGA13 50 Post Construction O&M of Permanent Plant Facility EA/YR13 9x Other (Use Numbers 90-99)
14 THERMAL TREATMENT 14 01 Incineration CY14 02 Low Temperature Thermal Desorption CY14 03 Supercritical Water Oxidation MGA14 04 Molten Salt Destruction CY14 05 Radio Frequency Heating CY14 06 Solar Detoxification CY14 07 High Temperature Thermal Desorption CY14 50 Post Construction O&M of Permanent Plant Facility EA/YR14 9x Other (Use Numbers 90-99)
15 STABILIZATION/FIXATION/ENCAPSULATION15 01 Molten Glass CY15 02 In-Situ Vitrification CY15 03 In-Situ Pozzolan Process (Lime/Portland Cement) CY15 04 Pozzolan Process (Lime/Portland Cement) CY15 05 Asphalt-Based Encapsulation CY15 06 Radioactive Waste Solidification (Grouting/Other) CY15 07 Sludge Stabilization (Aggregate/Rock/Slag) CY15 50 Post Construction O&M of Permanent Plant Facility EA/YR15 9x Other (Use Numbers 90-99)
18 DISPOSAL (OTHER THAN COMMERCIAL)18 01 Landfill/Burial Ground/Trench/Pits CY
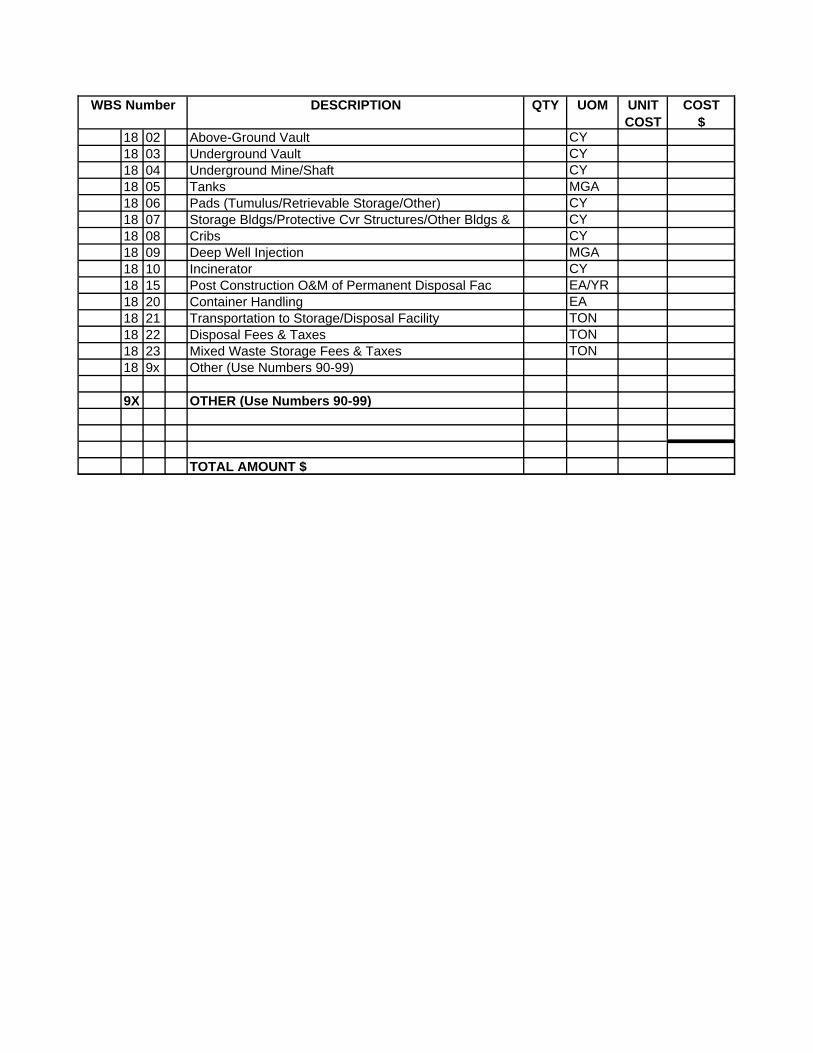
WBS Number DESCRIPTION QTY UOM UNIT COST
COST $
18 02 Above-Ground Vault CY18 03 Underground Vault CY18 04 Underground Mine/Shaft CY18 05 Tanks MGA18 06 Pads (Tumulus/Retrievable Storage/Other) CY18 07 Storage Bldgs/Protective Cvr Structures/Other Bldgs & CY 18 08 Cribs CY18 09 Deep Well Injection MGA18 10 Incinerator CY18 15 Post Construction O&M of Permanent Disposal Fac EA/YR18 20 Container Handling EA18 21 Transportation to Storage/Disposal Facility TON18 22 Disposal Fees & Taxes TON18 23 Mixed Waste Storage Fees & Taxes TON18 9x Other (Use Numbers 90-99)
9X OTHER (Use Numbers 90-99)
TOTAL AMOUNT $