a guide to utilizing combined heat and power in the … guide to utilizing combined heat and power...
TRANSCRIPT

ee
A Guide to Utilizing Combined Heat and Power in the Wood Resources Industry
1
Table of Contents Combined Heat and Power (CHP) Fundamentals ......................................................................................... 4
Definition and Reasons for Use ................................................................................................................. 4
Understanding System Requirements and Capabilities ............................................................................ 5
Load Profiles .......................................................................................................................................... 5
Operating Strategies ............................................................................................................................. 7
Owner Requirements and Additional System Capabilities ................................................................... 9
Types of CHP Systems ................................................................................................................................. 11
Thermal Energy Recovery ....................................................................................................................... 11
CHP Cycles ............................................................................................................................................... 12
Topping Cycle ...................................................................................................................................... 12
Bottoming Cycle .................................................................................................................................. 12
Combined Cycle .................................................................................................................................. 13
Overview of Prime Movers ..................................................................................................................... 14
Steam Turbines ................................................................................................................................... 15
Reciprocating Internal Combustion Engines ....................................................................................... 15
Combustion Turbines and Microturbines ........................................................................................... 16
Fuel Cells ............................................................................................................................................. 18
Stirling Engines .................................................................................................................................... 19
Organic Rankine Cycle ......................................................................................................................... 19
Summary and Comparison of Prime Movers ...................................................................................... 20
Woody Biomass Fuels ................................................................................................................................. 21
Wood Combustion Calculator ................................................................................................................. 22
Examples of Successful Projects ................................................................................................................. 24
Cox Interior ............................................................................................................................................. 24
Rough & Ready Lumber .......................................................................................................................... 24
Evergreen Community Power Plant ........................................................................................................ 26
List of Affiliates ............................................................................................................................................ 28
Technical Assistance Programs ............................................................................................................... 28

A Guide to Utilizing Combined Heat and Power in the Wood Resources Industry
2
Equipment Suppliers ............................................................................................................................... 28
Designers ................................................................................................................................................. 29
Steps for Implementing Design ................................................................................................................... 30
Works Cited ................................................................................................................................................. 32
1. The work on which this publication is based was funded in whole or in part through a grant awarded
by the Wood Education and Resource Center, Northeastern Area State and Private Forestry, and the U.S.
Forest Service.
2. In accordance with Federal law and U.S. Department of Agriculture policy, this institution is prohibited
from discriminating on the basis of race, color, national origin, sex, or disability.
To file a complaint of discrimination, write to the USDA Director, Office of Civil Rights, Room 326-W,
Whitten Building, 1400 Independence Avenue – SW, Washington, DC 20250-9410 or call (202) 720-5964
(voice and TDD). USDA is an equal opportunity provider and employer.
Authors: Peter Clarke, Dr. James Freihaut, Bo Lin, John Pletcher 12/18/2012
A Guide to Utilizing Combined Heat and Power in the Wood Resources Industry
3
Executive Summary
A facility owner with an interest or need to increase energy efficiency, reduce emissions, or increase
energy security should consider using combined heat and power (CHP). Additionally, facilities with
access to on-site, inexpensive, and abundant fuels sources have tremendous potential to fully utilize this
technology. Many facilities in the forest products industry fall into this category. A CHP system can
economically provide heat and electricity for a facility with a steady source of woody biomass. This
guide aims to educate members of the forestry products industry on how to use a source of woody
biomass in a CHP system and provides resources for the development of potential projects. In addition
to a thorough overview of CHP concepts, this guide also contains technical information for woody
biomass fuels.
This guide begins with a general overview of the fundamental principles of CHP systems and highlights
the potential value these CHP systems provide to their host facility. Next, a discussion of operating
classifications explains how the systems operate on a technical level. The general discussion of CHP
systems concludes with a discussion about the characteristics of the most important device in a CHP
system: the prime mover. This guide includes a discussion of common woody biomass products for
combustion. In addition, a wood combustion calculator is available for use that determines the
technical combustion potential for woody biomass under specific conditions. Three examples of existing
woody biomass CHP projects are also provided to show the versatility and viability of CHP technologies.
Finally, a contact list for qualified professionals involved with CHP and a guide for project development
is given to support any future efforts of readers to own or operate their own CHP system.

A Guide to Utilizing Combined Heat and Power in the Wood Resources Industry
4
Combined Heat and Power (CHP) Fundamentals
Definition and Reasons for Use The majority of facilities use electricity and thermal energy that are derived from separate energy
sources. This energy delivery method is known as separate heat and power (SHP) and is depicted in the
left portion of Figure 1. The fuel utilization efficiency for centralized electric power generation and on-
site heat production are 31% and 80%, respectively. In this case, 154 units of fuel would provide 30
units of electricity and 45 units of steam for the end-user resulting in an overall efficiency of 49%.
An alternative approach for meeting the same electricity and thermal requirements is through the use of
combined heat and power (CHP), also known as cogeneration. CHP is defined as “the simultaneous
production of electrical or mechanical energy (power) and useful thermal energy from a single energy
source.” (ASHRAE, 2008) This is achieved by recovering heat energy from another process’ output that
would have otherwise been wasted. The CHP method is depicted in the right portion of Figure 1. By
coupling the production of electricity and thermal energy, an overall fuel utilization efficiency of 75% is
achievable. In other words, 100 units of fuel would provide 30 units of electricity and 45 units of steam
for the end-user.
Figure 1: Comparison of SHP and CHP methods
Source: U.S. Environmental Protection Agency

A Guide to Utilizing Combined Heat and Power in the Wood Resources Industry
5
Combined heat and power strategies have been in use for more than 100 years. In fact, the world’s first
electric power plant (Thomas Edison’s Pearl Street Station, New York City, 1882) used CHP. While only
representing 4.3% of total U.S. electricity generation in 2010, CHP is a time-tested strategy (EIA, 2011).
Understanding System Requirements and Capabilities
Load Profiles
The electric and thermal loads of a facility fluctuate with time. Fortunately, most of these loads have
predictable frequency and magnitude. A load profile curve characterizes a system’s use of energy over a
given period of time. Figure 2 depicts some of the common characteristics of load profiles over the
course of one day. As shown, during the early morning and evening hours, the load is constant and low.
This is called the “base load” and represents the minimum load at all times. In this example, the load
demand begins to rise in the morning, peaks around mid-day, and then decreases into the evening. The
highest point on the load profile is called the “peak load” and represents the maximum load at any time.
The area between the base load and the peak load is considered the “intermediate load.”
Figure 2: Example daily energy load profile
Not all systems have the same daily load profile as the profile shown in Figure 2. Real systems can
operate in very different ways. Figure 3 provides other common daily load profiles for a system.

A Guide to Utilizing Combined Heat and Power in the Wood Resources Industry
6
Figure 3: Various daily load profiles
In order to consider a facility for its suitability for CHP, it is important to understand both the electric
and thermal load profiles. Real systems not only have varying load profiles but also often have
independent load profiles for both electricity and thermal energy. When considering CHP, it is necessary
to contrast the thermal and electric profiles and identify the thermal/electric ratio at each point during
the operation of the facility.
For many applications in the wood resources industry there is a significant thermal load for wood drying,
which can be constant if there are sufficient drying houses with a staggered batch loading strategy. This
load will decrease in summer due to higher ambient temperatures, and can be combined with space
conditioning requirements in winter, such that the winter thermal loads can be several times that of
summer thermal loads. This seasonal load profile is generally only relevant to thermal loads, as much of
the wood resources industry does not typically employ space cooling.
The CHP system can often be sized around this thermal load in a bottoming cycle approach, where
steam is generated by a woody biomass-fired boiler to meet thermal needs and the steam is passed
through a back pressure turbine generator before being applied to the load. In this configuration, the
system is often sized to meet the peak thermal needs, while the turbine is sized to meet the base
electric needs.
When considering topping cycles with natural gas-fired prime movers (converts fuel to energy: engines,
turbines, gensets), the thermal load now becomes more of a limiting factor, while the electric output is
still sized to meet the base load. In this scenario, the CHP system size and type of prime mover should be
selected to meet a thermal and electric load factor of around 80%.

A Guide to Utilizing Combined Heat and Power in the Wood Resources Industry
7
Operating Strategies
The feasibility of any CHP system is dependent on the manner in which it would be operated. The
required loads of the facility and the size and configuration of major equipment will define the technical
limits of the CHP plant. The ultimate operating strategy is determined by the owner’s requirements.
The first general type of operational strategy is when a CHP plant modulates according to the real-time
load demand (load-following strategy). The second strategy is when a CHP plant operates according to
certain triggers, such as the amount of load demanded, price of fuel, time of day, or a signal from a
third-party (conditional strategy). It is common to mix these two general strategies into a hybrid control
system. Typical operating schemes are described in the following sections and are demonstrated in
Figure 4.
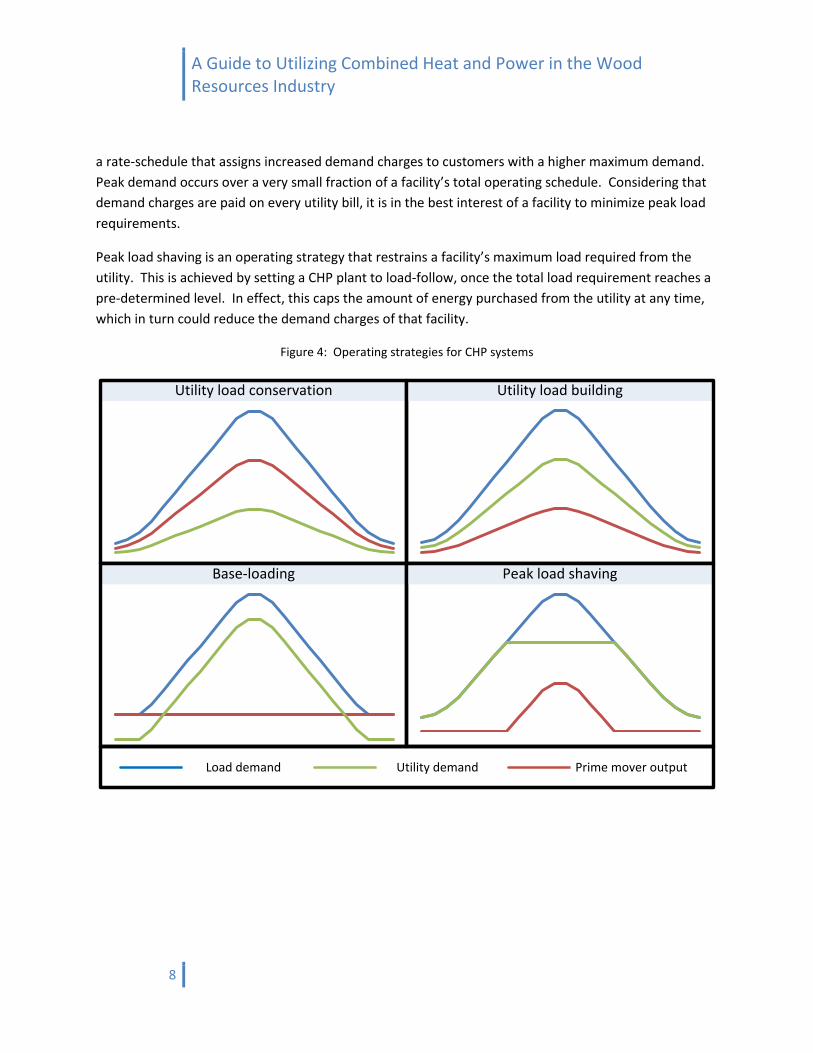
Utility Load Conservation
A CHP plant could utilize a conservation strategy when it is more favorable to produce energy on-site
than it is to purchase energy from a utility. In this arrangement, the CHP plant would increase its output
so that on-site generation represents a more significant portion of the facility’s total load. The total load
demand does not change, but the facility avoids purchasing high-cost or otherwise undesirable energy
from the utility.
Utility Load Building
A facility could implement a load building strategy when it is more favorable to purchase energy from a
utility than it is to produce energy on-site. Under this arrangement, the CHP plant would decrease its
output so that on-site generation represents a less significant portion of the facility’s total load. The
total load demand does not change, but the facility can take advantage of purchasing low-cost or
otherwise desirable energy from the utility.
Base-loading
Most facilities have a year-round minimum load requirement. A base-loading operating strategy sets
the CHP plant output for continuous operation at a pre-determined base load requirement. This
decreases the amount of energy purchased from the utility at all times. The CHP plant can provide base-
loading for either the electric or thermal load. The benefits of the base-loading strategy include
predictability of plant operation, high plant use-factor, and reduced dependence on a utility. Generally,
for successful economic operation the CHP plant should have an annualized electric and thermal load
factor of 80%. (The annual load factor is the amount of thermal and electric energy used by the building
divided by the system output calculated using 8,760 hours at full load).
Peak Load Shaving
Utility companies often require their customers to pay demand charges, which are separate from the
charges for quantity of energy consumed. These demand charges are based on the customer’s
maximum, or peak, demand over a given period of time (typically one month). They are determined by
A Guide to Utilizing Combined Heat and Power in the Wood Resources Industry
8
a rate-schedule that assigns increased demand charges to customers with a higher maximum demand.
Peak demand occurs over a very small fraction of a facility’s total operating schedule. Considering that
demand charges are paid on every utility bill, it is in the best interest of a facility to minimize peak load
requirements.
Peak load shaving is an operating strategy that restrains a facility’s maximum load required from the
utility. This is achieved by setting a CHP plant to load-follow, once the total load requirement reaches a
pre-determined level. In effect, this caps the amount of energy purchased from the utility at any time,
which in turn could reduce the demand charges of that facility.
Figure 4: Operating strategies for CHP systems
Utility load conservation Utility load building
Base-loading Peak load shaving
Load demand Utility demand Prime mover output
A Guide to Utilizing Combined Heat and Power in the Wood Resources Industry
9
Owner Requirements and Additional System Capabilities
After understanding the characteristics of the loads demanded and the available control strategies,
consideration for the owner’s requirements of a CHP system should occur. On-site CHP technologies are
uniquely positioned to provide valuable services and operational flexibility that are not possible with
separate heat and power strategies. However, certain tradeoffs associated with CHP systems should be
considered when planning or operating these facilities.
Installation Considerations
By definition, a CHP system must produce simultaneous heat and power, which requires the installation
of purpose-built CHP equipment. This equipment will require additional space and may produce noise.
These constraints can be problematic in densely populated or sensitive areas. This additional equipment
will also increase the capital costs of the facility. Typically, these higher capital costs are justified by a
reasonable return-on-investment.
Operational Considerations
The operating strategies and equipment required of CHP systems is often more complex than an
equivalent SHP system. To ensure successful operation, the operators of the system need to have a
higher level of technical expertise, typically on par with commercial power generation facilities. The
larger CHP systems typically rely on specialized outside contractors for all operations maintenance,
while the smaller systems can be maintained by in house staff with proper training.
Energy and Fuel Systems
Properly designed CHP systems will out-perform equivalent SHP systems with regard to primary energy
use. Depending on the choice of fuel, this could amount to significant savings in operational fuel costs.
Additionally, this decrease in primary energy use will yield lower pollutant emissions.
An advantage of on-site energy systems is the flexibility in fuel choice. These types of systems allow for
greater utilization of alternative or opportunity fuels due to proximity to the source. Opportunity fuels
are low-cost fuels which would otherwise be considered a waste product. In the forest products
industry that is sawdust, shavings, and chips produced on-site. The use of these types of fuels can help
the host facility reduce its dependence on fossil fuels. Although emissions are reduced as a whole in
CHP systems, the use of alternative fuels can produce different pollutant emissions. Hence, a
comprehensive approach should be used for an analysis of the environmental impact of such a system.
Reliability and Security
Hospitals, data centers, and other 24-hour facilities often require uninterrupted or redundant power. In
the event of a utility outage, an on-site CHP system may have the ability to generate power
independently from the grid. This “standby power” configuration could replace the need for
conventional standby generators. The traditional standby power approach is usually less cost-effective
when compared to a CHP system with standby power capabilities. For example, a traditional standby
generator will only operate during a grid outage, which usually amounts to a few hours out of an entire

A Guide to Utilizing Combined Heat and Power in the Wood Resources Industry
10
year. On the other hand, a properly sized CHP system could serve a facility’s loads near-continuously for
an entire year, inherently providing standby power. The CHP system in this case is providing much more
value to the owner than the traditional standby generator. Additionally, in the event of a long-term
electric grid outage, a natural gas-fueled CHP system is more reliable and is more likely to retain its fuel
supply than a conventional stand-by generator having a finite reserve of liquid fuel.
Some facilities have owner requirements or loads which necessitate “premium power.” These
requirements include electricity with high voltage, current or enhanced power quality. CHP systems are
well-suited for these applications because they have the ability to isolate themselves from the
fluctuations in the electric grid output. Additionally, the local utility distribution network is often fixed
at some intermediate voltage. High voltage applications would require the use of a step-up transformer,
which would entail an efficiency conversion penalty and additional capital costs. A CHP system could
generate high voltage from the start and bypass the need for the step-up transformers.
Additional Revenue Streams
When a CHP system’s capacity exceeds the load demand on-site, the system has the potential to
support the local utility company. Utility companies can enter into contracts with CHP facilities so that
when the need arises, CHP plants can sell electricity directly to the utility. Under this arrangement, a
CHP plant will generate excess electricity for sale only at the request of the utility. This situation often
arises when there is peak demand on the grid and the utility does not want to operate its own “peaking
plants” for economic reasons. Another situation that may require utility support is when the grid’s
capacity is constrained, which may occur in urban environments. Distributed generators in these areas
have the advantage of producing power near the point of demand, relaxing the constraints on the
remaining electricity distribution network.
When a CHP system is in close proximity to other energy users and has excess thermal/electric capacity,
it has the opportunity to sell district energy services. This is only possible if the CHP system consistently
has excess capacity, district energy distribution infrastructure is available to use, and the host facility has
the means to legally sell energy, which often requires certification as an Energy Service Company.
Depending on the type of fuel used in the CHP plant, the host facility could receive tipping charges as a
source of income. Tipping charges are fees that are paid for the service of disposing waste. In waste-to-
energy applications, it is possible to receive enough tipping charges to cover the collection and
transportation expenses. In effect, a facility has the potential to have negative fuel costs.
Load Shifting
Load shifting is the ability to transfer loads from one time period to another. The total facility load over
a given period of time does not change, but the facility load or utility load is manipulated to change the
shape of the load profile. This is often achieved through on-site generation systems and/or thermal
storage strategies. The primary motivation for load shifting is to reduce energy costs by consuming less

A Guide to Utilizing Combined Heat and Power in the Wood Resources Industry
11
in high peak periods and/or consuming more in off-peak periods. Load shifting can also help a facility
flatten its load profile so that it can operate with increased stability and/or efficiency.
Figure 5: Load shifting strategy
Types of CHP Systems
Thermal Energy Recovery The waste heat from a prime mover can be recovered in several ways and used for a variety of
applications. The most common practices are direct heating, indirect heating, and latent heating.
Figure 6: Thermal energy recovery methods
Process
Direct heating Indirect heating Latent heating
Input energy
Cold fluid
Hot fluid
Process
Input energy
Cold fluid
Process
Input energy
Secondary hot fluid
Gaseous fluid
Liquid fluid
Hot fluid
Secondary hot fluid
Prime mover
CondenserHeat
exchanger
Prime mover
Prime mover
Secondary cold fluid
Secondary cold fluid
Unshifted load demand
Shifted load demand

A Guide to Utilizing Combined Heat and Power in the Wood Resources Industry
12
Direct Heating
The working fluid in a direct heating application is typically exhaust gas or coolant fluids from a prime
mover. Common direct heating processes include drying processes, exhaust-fired absorption chillers,
desiccant material regeneration in a dehumidifier, or supplying a bottoming cycle. (ASHRAE, 2008)
Indirect Heating
Two working fluids are present in an indirect heating application. The primary working fluid is typically
exhaust gas or coolant fluids from the prime mover. The heat from the primary working fluid is
transferred to a secondary working fluid, usually steam or hot water. Common indirect heating
processes include generating electric or mechanical power or serving various thermally activated
technologies. (ASHRAE, 2008)
Latent Heating
A latent heating application uses two working fluids. The primary working fluid is typically exhaust gas
or coolant fluids from the prime mover. The heat from the primary working fluid is transferred to a
secondary working fluid. The secondary working fluid is selected to change phases in the typical
operating ranges of the process. This phase change takes advantage of the latent heat of
evaporation/condensation. The secondary working fluid is almost always steam. (ASHRAE, 2008)
CHP Cycles
Topping Cycle
A topping cycle is an equipment configuration in which the first process is the production of power.
Power generation is achieved by applying input energy to a working fluid before it is sent to a prime
mover. The mechanical energy from the prime mover is then used to produce power for another
process. The waste heat from the prime mover is then sent to a heat recovery device. In the heat
recovery device, heat flows from the working fluid to supply useful thermal energy for another process.
The following is an example of a topping cycle using terminology corresponding to Figure 7. A
combustion turbine (prime mover) burns natural gas (input energy) and air (working fluid). The shaft of
the combustion turbine is coupled to a generator (mechanical conversion device) to produce electricity
(useful energy output). The hot exhaust gases from the combustion turbine outlet are ducted to a heat
recovery steam generator (heat exchanger) to produce steam (useful energy output) to supply heat for a
drying process.
Bottoming Cycle
A bottoming cycle is an equipment configuration in which the last process is the production of power.
This is achieved by applying input energy to a working fluid before it is sent to a heat recovery device. In
the heat recovery device, heat flows from the working fluid to supply useful thermal energy for another
process. The remaining thermal energy in the working fluid is then sent to a prime mover. The
mechanical energy from the prime mover is then used to produce power for another process.

A Guide to Utilizing Combined Heat and Power in the Wood Resources Industry
13
The following is an example of a bottoming cycle using terminology that corresponds to Figure 7. The
hot exhaust gases (primary working fluid) from a wood combustion (input energy) process is ducted to a
heat recovery steam generator (heat exchanger) to produce steam (useful energy output) to supply
space heating for a building. The excess steam (secondary working fluid) that is not used for the
separate thermal process is supplied to a steam turbine (prime mover). This steam turbine is coupled to
a generator (mechanical conversion device) to produce electricity (useful energy output).
Combined Cycle
A combined cycle is an equipment configuration in which waste heat from the primary power cycle is
used to generate additional power. In this configuration, a prime mover is supplied with input energy
and a working fluid to produce power. Waste heat from this process is captured by a heat recovery
device. The reclaimed thermal energy is then used by a secondary prime mover to produce additional
power.
A combined cycle can exist in many different configurations. An important distinction pertaining to how
power is produced is dependent on whether the cycle is “single-shaft” or “multi-shaft.” When both the
primary and secondary prime movers are configured so that their output is directed on the same power-
producing device, the system is known as a single-shaft cycle. When the prime movers supply separate
power-producing devices, the system is known as a multi-shaft cycle. Another distinction is whether a
combined cycle qualifies as a combined heat and power cycle. A common use for the combined cycle is
an electric power plant. These plants use the combined cycle to maximize electric power production,
not supply separate thermal processes. Only combined cycles which simultaneously produce power and
supply thermal energy for a separate process from a single energy source are considered combined heat
and power cycles. (ASHRAE, 2008)
The following is an example of a multi-shaft, CHP/combined cycle using terminology that corresponds to
Figure 7. A combustion turbine (primary prime mover) burns natural gas (input energy) and air (primary
working fluid). The shaft of the combustion turbine is coupled to a generator (mechanical conversion
device) to produce electricity (useful energy output). The hot exhaust gases from the combustion
turbine outlet are ducted to a heat recovery steam generator (heat exchanger) to produce steam
(secondary working fluid) to supply a steam turbine (secondary prime mover). The shaft of the steam
turbine is coupled to a generator (mechanical conversion device) to produce additional electricity
(useful energy output). The steam (useful energy output) from the steam turbine outlet supplies
heating to the generator in an absorption chiller.

A Guide to Utilizing Combined Heat and Power in the Wood Resources Industry
14
Figure 7: CHP cycles overview
PM HX
MC
Electricity or shaft power
Useful heat
Fuel or heat
PMHX
MC
Electricity or shaft power
Useful heat
Fuel or heat
PM HX
MC
Electricity or shaft power
Fuel or heat
PM
MC
MC
Electricity or shaft power
PM PM
HX
Fuel or heat
Topping cycle Bottoming cycle
Multi-shaft combined cycle Single-shaft combined cycle
Legend
Input energy: Fuel or heat from another process
Working fluid: Steam or hot combustion exhaust gases
Mechanical energy: Usually the rotation of spinning shaft
Useful energy output: Electricity, shaft power, or heat for another process
Combined heat and power cycles overview
PM (Prime mover): Transforms energy from one form to another (turbine, engine, fuel cell, etc.)
MC (Mechanical conversion): Converts mechanical energy into power (generator, pump, fan, etc.)
HX (Heat exchanger): Allows heat to flow between fluids while preventing the fluids from mixing
Useful heat
Useful heat
Overview of Prime Movers The purpose of the prime mover in a CHP system is to convert fuel or heat energy into mechanical
energy (usually shaft power). The mechanical energy can power other mechanical equipment such as
fans, pumps, or compressors, or can power a generator to produce electricity. The conversion of one

A Guide to Utilizing Combined Heat and Power in the Wood Resources Industry
15
form of energy into another is never a perfectly efficient process. These inefficiencies are the reason for
the generation of waste heat. The relative proportions and method of control of the input, output, and
waste energy depend on the type of prime mover. Currently, the prime movers that are viable for CHP
systems are steam turbines, reciprocating internal combustion engines, combustion turbines,
microturbines, fuel cells, Stirling engines, and Organic Rankine cycle engines.
Steam Turbines
Steam turbines are the oldest prime mover technology for power plant and industrial applications.
(ASHRAE, 2008) Essentially, steam turbines produce mechanical energy by reducing the pressure of a
flow of steam. There are many different types of turbines, but the most important designations are
number of stages and outlet condition of the steam.
The number of stages denotes the number of steam pressure drops that occur within the device.
Generally, a turbine with fewer stages is less efficient. A steam turbine is also classified by outlet
conditions as either non-condensing or condensing. Non-condensed steam contains more energy than
condensed steam under equivalent conditions. A non-condensing turbine (also known as a
backpressure turbine) operates with an outlet steam pressure at or above atmospheric pressure. In this
high pressure, non-condensed state, steam is often used for separate heating processes or additional
power generation. In a condensing turbine, the outlet pressure is lower than atmospheric pressure to
maximize the power extracted by the turbine. (Petchers, 2002)
Differing from other prime mover technologies, steam turbines do not directly transfer fuel into
mechanical energy. Instead, useful power is the byproduct of heat production. This is a disadvantage
for steam turbines if the demand for electricity is high because the electrical efficiency is low. (Deng,
Wang, and Han, 2011) Condensing turbines have a higher electrical efficiency than backpressure
turbines, but are more expensive and complex. Steam turbines range in size from 100 kW to 250,000
kW and power-to-heat ratios of 0.05 to 0.20. (The ratio between heat use and electric generation) High
capacity and low power-to-heat ratio eliminate the application of steam turbines in residential and
commercial buildings but are very common in power plants and industrial applications. (EPA, 2008)
Steam turbines have a relatively simple design and few moving parts. When appropriately maintained
and operated, steam turbines are highly reliable and have a life span more than 50 years. (Petchers,
2002) Overhaul maintenance intervals are several years (EPA, 2008), but monthly routine maintenance
should include inspection for lubricating oil, leakage, and blade erosion.
Reciprocating Internal Combustion Engines
Reciprocating internal combustion (IC) engines are the most popular and widely used prime movers in
CHP applications. (Petchers, 2002) The most common IC engines are spark ignition engines and diesel
engines. Spark ignition engines operate with the Otto cycle. This cycle pressurizes the fuel and air, but
requires a spark to initiate combustion. Diesel engines operate with the diesel cycle. The diesel cycle
pressurizes the fuel and air until the self-ignition temperature is reached, which provides combustion

A Guide to Utilizing Combined Heat and Power in the Wood Resources Industry
16
without a secondary ignition source. Spark ignition engines are commonly quieter and lighter than
diesel engines. The lower compression ratio of the Otto cycle causes a lower electrical efficiency than
the diesel engine. However, high-quality lean-burn engines can approach the efficiency of a similarly
sized diesel engine. (EPA, 2008)
IC engines have many advantages over other prime mover technologies. IC engines are proven and
mature technologies that have been in use for more than 100 years. (United Technologies Research
Center, 2006) These engines are suitable for several types of fuels, including natural gas, propane,
landfill gas, digested gas, diesel, and heavier oils. (ASHRAE, 2008) IC engines have electrical efficiencies
ranging from 25% to 40%, based on lower heating value (LHV). (Midwest CHP Application Center and
Avalon Consulting, Inc., 2003) In addition to having high electrical efficiency at full load, IC engines
perform well at part load conditions. When operating at 50% of full load, the efficiency of an IC engine
reduces 8% to 10% from the rated efficiency. Comparatively, a combustion turbine will reduce 15% to
25% from the rated efficiency at half load. (EPA, 2008) Another characteristic of IC engines is the ability
to start-up or change prime mover output quickly, thus making it a good choice for back-up power
systems. The ability to change output quickly and maintain high efficiency under part load conditions
will make an IC engine a good prime mover for facilities with variable load profiles. Additionally, IC
engines are not as sensitive to environmental changes as other prime mover technologies. The
influence that ambient air temperature and altitude have on output is small; generally, the efficiency is
reduced by 4% per 1,000 feet of altitude above 1,000 feet and 1% for every 10 deg F. (EPA, 2008)
Despite the numerous advantages of IC engine technologies, they have distinct disadvantages as well.
The low quality of waste heat from IC engines usually limits the type of useful heat output to hot water
or low pressure (LP) steam. These outputs are favorable for facilities with predominantly space heating
or domestic hot water requirements. (Maor, 2009) Waste heat is typically recovered from the exhaust
gases, engine cooling jacket, and/or the lubrication oil system. IC engines have many moving parts,
which results in higher maintenance costs, noise, and vibration. Frequent starting and stopping of IC
engines accelerate wear. Standby and emergency service have also been known to cause heavier
erosion. (Petchers, 2002) Greenhouse gas emission from IC engines can be higher than other prime
mover technologies. However, advancements in emissions control technologies, such as catalysts and
lean burn control, have significantly reduced emissions.
Combustion Turbines and Microturbines
Combustion turbines (CT), also known as gas turbines, have been in use for nearly 100 years and are
widely used in aircraft and marine propulsion. Stationary versions of CTs have high energy content
exhaust gases and low emission rates, making them ideal candidates for many CHP applications.
The waste heat from CTs is mostly in the form of high temperature exhaust gases. This single, high-
quality source of heat allows for much flexibility in the production of useful thermal output. The
recovered waste heat can serve a variety of temperature, pressure, and load quantity requirements.
A Guide to Utilizing Combined Heat and Power in the Wood Resources Industry
17
Generally, CTs range in size from 37 to 10,000 kW. (Petchers, 2002) When the capacity of a CT is less
than 1 MW, low electrical efficiency and the resultant high cost per kilowatt of electricity will typically
limit the economic feasibility of the device. (Deng, Wang, and Han, 2011)
The microturbine (MT) was first used in 1997 and was commercialized in 2000. (EPA, 2008) As the name
suggests, MTs use the same operating principles as CTs, but in a much smaller device. MTs range in size
from 25 to 500 kW. (United Technologies Research Center, 2006) MTs have relatively low electricity
efficiency. Most designs feature an internal heat exchanger called a recuperator. (EPA, 2008) The
recuperator captures heat from the exhaust gases to heat the combustor intake air. A MT equipped
with a recuperator will have higher electrical efficiency, but will produce less useful thermal output.
Microturbines have several merits. The temperature of the exhaust gases range from 400 to 600 deg F.
Although not as high of quality compared to CT exhaust gases, MTs are capable of producing a variety of
useful thermal outputs.
CTs and MTs have high rotational speed, but realistically have only one moving part, and some do not
require lubricating oil. (Deng, Wang, and Han, 2011) This allows for less vibration during operation and
longer service life than IC engines. Additionally, these devices can use a variety of fuels, such as natural
gas, liquefied petroleum gas (LPG), alcohol, propane, kerosene, and landfill gas. Using natural gas and
low inlet air temperature, nitrogen oxide (NOx) emission rates are usually less than 10 ppm. (EPA, 2008)
The disadvantages of using CTs or MTs include high capital cost and relatively low electrical efficiency.
(United Technologies Research Center, 2006) Additionally, the performance of these devices is very
susceptible to environmental air conditions. As temperature and elevation increase, power output will
decrease.

A Guide to Utilizing Combined Heat and Power in the Wood Resources Industry
18
Fuel Cells
Fuel cell (FC) technologies have been used for power production for more than 50 years. They are not
frequently used in CHP applications, but are gaining popularity. (EPA, 2008) Unlike other prime mover
technologies, fuel cells utilize electrochemical reactions to produce an electric current. The primary
designs include proton exchange membrane, solid oxide, molten carbonate, and phosphoric acid fuel
cells. General characteristics of the different FC technologies are given in Table 1. (The California Energy
Commission, 2003)
Table 1: Characteristics of fuel cell technologies
Fuel cell technology Proton exchange
membrane Solid oxide
Molten carbonate
Phosphoric acid
Size range kW 3-250 1-10,000 250-10,000 100-200
Fuel Natural gas, hydrogen,
propane, diesel
Natural gas, hydrogen, landfill
gas, fuel oil
Natural gas, hydrogen
Natural gas, landfill gas,
digester gas, propane
Efficiency 25-40 % 45-60 % 45-55 % 36-42 %
Environmental Nearly zero emissions
Nearly zero emissions
Nearly zero emissions
Nearly zero emissions
Thermal output Hot water (80 deg C)
Hot water, low/high pressure
steam
Hot water, low/high
pressure steam Hot water
Need reformer? Yes No No Yes Current cost $/kW ~5,000 N/A N/A 4,000
Source: (The California Energy Commission, 2003)
FCs have several advantages when compared to other prime mover technologies. The electrical
efficiency for FCs is high because electrons are produced directly from chemical reactions. FCs also have
no moving parts other than secondary equipment such as pumps and blowers. The only required
maintenance for the FC itself is for membranes and reformers. (United Technologies Research Center,
2006) FCs are packaged devices which become scalable if multiple modules are used. Also, the
operating noise is negligible.
There are several reasons for the low adoption rate of FCs. First, the use of complex designs and
expensive materials result in high capital cost and material replacement expenses. Additionally, the low
adoption rate leaves the technology generally unproven in a non-laboratory setting. (EPA, 2008)
Additionally, FCs are slow to change output and therefore are not well suited for highly variable loads.

A Guide to Utilizing Combined Heat and Power in the Wood Resources Industry
19
Stirling Engines
Stirling engines have a history of more than 100 years and were widely used before 1910. Using an
external heat source and heat sink, the Stirling engine uses a cycle that expands and contracts a working
fluid to produce mechanical output. The heat source is not internal to the system and does not
necessarily have to be derived from fuel. The external nature of the heat source allows much flexibility
in the control of combustion and can result in low emission rates. (Wu and Wang, 2006) Stirling engines
have few moving parts and thus have decreased vibration and wear on components. Generally, Stirling
engines range in size from 1 kW to 25 kW. (The California Energy Commission, 2003) The current cost
for these devices is very high, and the electrical efficiency is lower than most other prime movers.
Stirling engines are generally not cost effective for CHP applications unless the site has large quantities
of low-cost waste heat or the quality of the waste heat is not feasible for other prime mover
technologies.
Organic Rankine Cycle
The Rankine cycle is a four-stage, closed loop process that uses a working fluid to convert heat to work.
The most common working fluid is water. This cycle is utilized to produce the majority of the world’s
electric power today. The four stages in the cycle are:
1. The pressure of the working fluid is increased by use of a compressor or pump.
2. The liquid working fluid is heated at a constant pressure in a boiler.
3. The pressure of the working fluid is decreased by use of a turbine. This process also produces
the power output for the system.
4. The working fluid is cooled until it condenses back into a liquid and the cycle repeats.
The Organic Rankine cycle is a variation on the Rankine cycle in which the working fluid is an organic
fluid. With the proper organic working fluid, this cycle can operate at much lower temperatures than
the standard Rankine cycle. This allows much more flexibility with heat sources and can produce useful
work in situations where other prime mover technologies cannot. The main disadvantages of Organic
Rankine cycles are low efficiency and high capital costs. Organic Rankine cycle devices are generally not
cost effective for CHP applications unless the site has large quantities of low-cost waste heat or the
quality of the waste heat is not feasible for other prime mover technologies. (Meckler & Hyman, 2010)
and (Wiser, 2000)

A Guide to Utilizing Combined Heat and Power in the Wood Resources Industry
20
Summary and Comparison of Prime Movers
Table 2: Summary of prime mover technologies
Prime Mover Steam
Turbine
Spark Ignition
Reciprocating Engine
Compression Ignition
Reciprocating Engine
Combustion Turbines
Microturbines Fuel Cells Stirling Engines
Capacity range kW
50-250,000
< 5,000 in DG applications
<4,000 500-250,000 30-250 5-2,000 1-1,500
Fuel used Any
Natural gas, biogas,
propane, landfill gas
Natural gas, biogas,
propane, landfill gas
Natural gas, biogas,
propane, oil
Natural gas, biogas,
propane, oil
Hydrogen, natural
gas, propane, methanol
Any
Electrical efficiency %
15-38 35-45 25-43 22-36 18-27 30-63 12-20
Power-to-heat ratio
0.1-0.3 0.8-2.4 0.5-0.7 0.5-2.0 0.4-0.7 1.0-2.0 1.2-1.7
Thermal output
LP-HP steam
Hot water, LP steam
Hot water, LP steam
Heat, hot water, LP-HP
steam
Heat, hot water, LP
steam
Hot water, LP-HP steam
Hot water
Noise High High High Moderate Moderate Low Moderate
NOx emissions kg/MWh
Depends on source
0.2-10 10 0.036-0.050 0.015-0.036 0.0025-0.004
0.230
Availability % Near 100 92-97 92-97 90-98 90-98 >95 90-95
Part load performance
Poor Good Good Poor Fair Good Good
Hours to overhaul
>50,000 25,000-50,000
25,000-50,000
25,000-50,000
20,000-40,000 32,000-64,000
N/A
Initial cost $/
430-1,100 340-1,000 800-1,600 450-950 2,400-3,000 5,000-6,500
1,300-2,000
O&M $/ <0.005 0.0075-0.015 0.0075-0.015 0.004-0.011 0.012-0.025 0.032-0.038
N/A
Source: (EPA, 2008) and (Wu and Wang, 2006)

A Guide to Utilizing Combined Heat and Power in the Wood Resources Industry
21
Woody Biomass Fuels The forest products industry generates potential fuel sources throughout most of the manufacturing
process. When evaluating the viability of woody biomass as a fuel, one must consider the
manufacturing process by which it was obtained. There are important differences in heating value
based on chemical composition, physical makeup, and moisture content. The latter has the greatest
impact on the availability of useful heat in the fuel.
There are four basic sources for woody biomass-based fuels including roundwood from the forests,
timber harvesting residues, mill residues from primary and secondary processers, and timber
plantations. Forest products are the raw material for many industries including paper, particle board,
and Medium Density Fiberboard (MDF) manufacturing. All of these industries can have a profound
impact on the cost of these raw materials. In the past decade, a growing amount of forest products has
gone to support the pellet fuel industry, which saw significant growth brought about by homeowners
seeking alternative heating options in response to the drastic price increase in fossil fuels.
Mill residues are a very attractive material because they are generated on-site as a byproduct of the
value added manufacturing process. Residues generated from sawmills consist of sawdust, chips from
ground slab wood, and bark. Material from sawmills and harvesting operations is considered “green.”
The term “green” identifies the material as having high moisture content. If used as a fuel, this moisture
causes the biomass to have a reduced heating content. Residues from secondary processing such as
dimension mills, furniture, and cabinetry operations that generate sawdust, shavings, and hogged
material have higher heating content due to considerably lower moisture content.
The most common method of converting wood into energy is through combustion. The first process to
occur during wood combustion is the evaporation of water. Secondly, heat drives out volatile
compounds contained in the wood at a temperature between 100 to 600 deg C. Depending on the
species, 75% to 85% of the wood is volatilized into a gas. The non-volatilized remainder, composed
primarily of carbon, burns like charcoal. The remaining non-carbon material is known as “ash” and will
not burn at typical combustion temperatures.
Table 3: Composition of various wood products
Average proximate analysis of hardwoods and softwoods
Fuel type Volatile matter [%] Fixed carbon [%] Ash [%] Softwood 85.5 14.4 0.1
Softwood bark 72.5 25.6 1.9 Hardwood 77.3 19.4 3.3
Hardwood bark 76.7 18.6 4.7 Source: (Haygreen & Bowyer, 1982)
A Guide to Utilizing Combined Heat and Power in the Wood Resources Industry
22
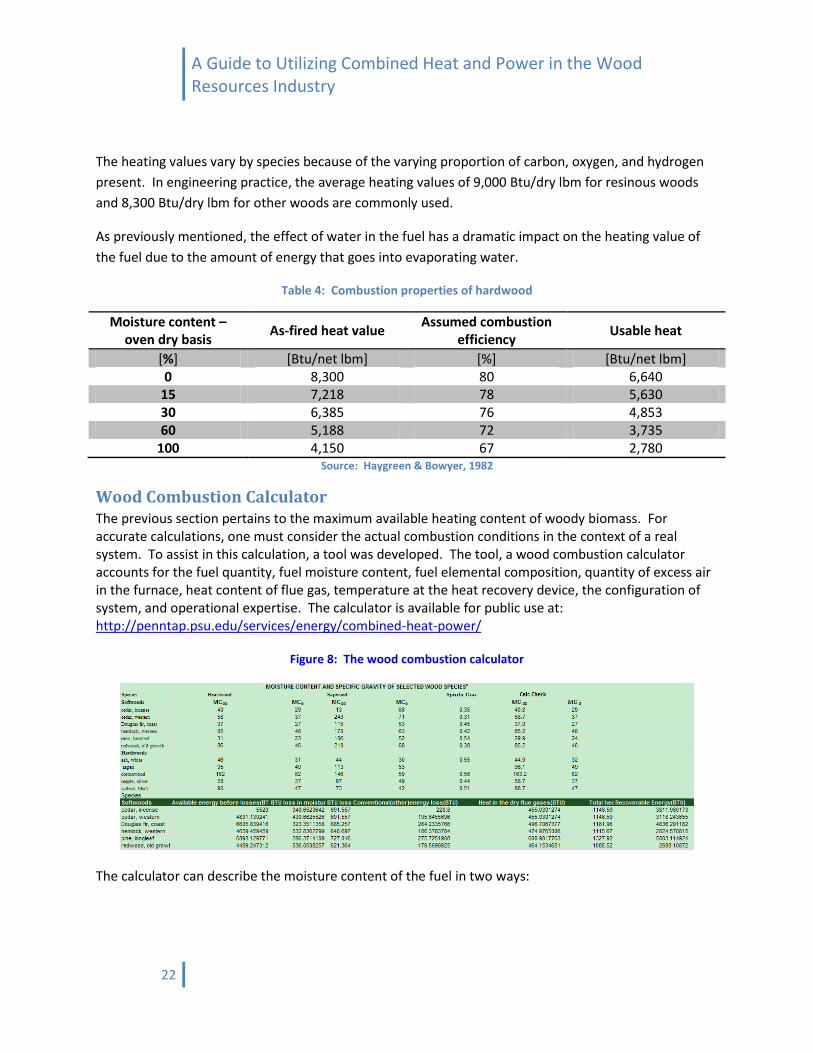
The heating values vary by species because of the varying proportion of carbon, oxygen, and hydrogen
present. In engineering practice, the average heating values of 9,000 Btu/dry lbm for resinous woods
and 8,300 Btu/dry lbm for other woods are commonly used.
As previously mentioned, the effect of water in the fuel has a dramatic impact on the heating value of
the fuel due to the amount of energy that goes into evaporating water.
Table 4: Combustion properties of hardwood
Moisture content – oven dry basis
As-fired heat value Assumed combustion
efficiency Usable heat
[%] [Btu/net lbm] [%] [Btu/net lbm] 0 8,300 80 6,640
15 7,218 78 5,630 30 6,385 76 4,853 60 5,188 72 3,735
100 4,150 67 2,780 Source: Haygreen & Bowyer, 1982
Wood Combustion Calculator The previous section pertains to the maximum available heating content of woody biomass. For accurate calculations, one must consider the actual combustion conditions in the context of a real system. To assist in this calculation, a tool was developed. The tool, a wood combustion calculator accounts for the fuel quantity, fuel moisture content, fuel elemental composition, quantity of excess air in the furnace, heat content of flue gas, temperature at the heat recovery device, the configuration of system, and operational expertise. The calculator is available for public use at: http://penntap.psu.edu/services/energy/combined-heat-power/
Figure 8: The wood combustion calculator
The calculator can describe the moisture content of the fuel in two ways:

A Guide to Utilizing Combined Heat and Power in the Wood Resources Industry
23
The calculator determines the system losses such as fuel moisture content, hydrogen fuel content, non-
combustible atmospheric gasses, excess air, and other conventional losses.
Fuel moisture content – Energy is required to evaporate the water from the fuel and to raise the
water vapor to the combustion temperature reducing what is available for use.
Hydrogen fuel content – Hydrogen content is typically around 6.0% by dry weight in woody
biomass. During combustion, the hydrogen in the wood combines with oxygen to form water.
Non-combustible atmospheric gasses – Air contains mostly non-combustible gases. The gases
are heated to the combustion temperature, but because they are not necessary for combustion,
it is considered a heat loss.
Excess air – In order to allow complete combustion, a minimum amount of oxygen must be
delivered to the furnace. Good combustion practices recommend that air should be delivered in
excess of the minimum oxygen requirements. The excess air is heated to the combustion
temperature, but because they are not necessary for combustion, it is considered a heat loss.
Other conventional losses – Inefficiencies due to non-ideal conductive, convective, and radiative
heat transfer cause heat loss. An example of such a loss is a furnace that heats its enclosure due
to poor insulation.
After identifying the system losses, the recoverable heat energy can be calculated:
Suggested input data:
The higher heating value of the fuel (Btu/dry lbm)
Fuel moisture content
Percent of excess air
Temperature at the furnace entrance
Temperature of the heat recovery device
Minimum required data:
Moisture content
Percent of excess air
Temperature at the furnace entrance
Temperature of the heat recovery device

A Guide to Utilizing Combined Heat and Power in the Wood Resources Industry
24
Examples of Successful Projects
Cox Interior Cox Interior was founded in 1983 in Campbellsville, Kentucky. (www.coxinterior .com) It is one of
Kentucky’s largest secondary wood manufacturers. The company produces interior and exterior
finishing products such as molding, doors, stairs,
and fireplace mantels. These products are
made from oak, cherry, poplar, and mahogany.
The operations at Cox Interiors produce more
than 100 tons of wood waste per day.
Increasingly strict landfill regulations and
growing disposal costs led the company to look
for new ways to manage wood waste disposal.
In 1994, Cox Interior installed a CHP plant to
burn wood waste.
In addition to the 100 tons per day of wood waste produced on-site, the CHP plant also burns about 200
tons per day of sawdust and slabs purchased from local sawmills and used pallets from local
manufacturers. Cox Interior has a fleet of 20 trucks with full-time drivers to transport this third-party
wood waste to the site. Once the wood arrives on-site, it is chipped and stored in a 20,000 ft2 fuel
storage building.
The CHP plant consists of two 61.4 MM Btu/hr boilers that produce 1,200,000 lb/hr of steam. The
steam is sent to a steam turbine that produces 5.0 MW of electricity at full capacity. The waste steam
from the turbine is used in kilns to dry lumber. The CHP plant was designed to meet all of the load
demand at Cox Interior in 2002. In 2006, the plant provided over 90% of the manufacturer’s loads. It
also produced more 14,000 MWh of electricity, 1,267 MWh of which was sold back to the local utility.
The CHP plant allows recovery of waste heat from on-site electricity generation. CHP not only reduces
Cox Interior’s fuel costs, but it also allows more flexibility in the manufacturing process. Cox Interior
purchases green lumber at lower costs and uses the recovered heat to kiln dry the lumber on-site. The
cost savings of self-drying lumber was $4.5 million in 2006. In the same year, the CHP plant saved
almost $1 million in electricity costs and sold $48,000 worth of electricity to the utility. This yields a
gross savings of $5.5 million and with an operating cost of $2.6 million, the system ultimately provided a
net savings of $2.9 million.
Rough & Ready Lumber The Rough & Ready (R & R) Lumber Company was established in 1922 in Cave Junction, Oregon.
(http://www.rrlumber.com) The company needed to make changes to its operations in order to remain
competitive and stay in business. The R & R Lumber Company processes mostly ponderosa, sugar pine,
Source: Cox Interior Website

A Guide to Utilizing Combined Heat and Power in the Wood Resources Industry
25
and Douglas fir. The air-drying of lumber caused the facility to have gaps in production due to the
different drying schedules of the tree species. In 2008, the decision was made to switch the company’s
operations to a single-schedule steam-drying operation. This new system included the installation of a
CHP plant.
The previous R & R Lumber Company facilities were operated with natural gas. The new CHP plant uses
around 50% hog fuel from on-site sawmill operations and 50% forest thinning and logging debris from
third-party sources. The third-party fuel supply is the result of the federal government placing an
increased emphasis on thinning nearby national forests in order to reduce the effects of forest fires and
insect infestations.
The CHP plant is comprised of a water-tube boiler producing 40,000 lb/hr of steam at 300 psig. This
steam is piped to a backpressure steam turbine that is coupled to a 1.5 MW electric generator. The 20
psig steam from the outlet of the turbine is used to heat 12 double-track dry kilns. R & R Lumber
Company has an average thermal load of 58.5 MM Btu/hr and an electric load of 1.28 MW.
The R & R Lumber Company is an impressive example of the versatility and profitability of CHP plants in
waste-to-energy programs. The total cost of the CHP plant was $6,000,000. The initial payback period
for the CHP plant was 15 years. When considering the numerous incentives awarded to R & R, the
actual payback period drops to only 4 years. Reliable fuel sources, consistent facility load, and favorable
project economics make the CHP plant an excellent investment.
Without proper financial assistance, a small company like R & R Lumber Company would not be able to
afford the cost of installing a CHP plant. The company took advantage of many financial incentives to
fund the initial cost and continued operation of the CHP plant. The incentives fall into several
categories:
Promotion of renewable energy systems and energy efficiency in rural areas
o $500,000 USDA Rural Development Section 9006 Grant
o $2,350,000 USDA Rural Development Section 9006 Loan Guarantee
Incentives for renewable on-site energy production
o $243,000 Woody Biomass Utilization Grant from the U.S. Forest Service
o $1,700,000 grant from the Energy Trust of Oregon toward capital costs. The grant is
paid to R & R over the course of a minimum of four years to produce renewable
electricity for the grid.
o Oregon Business Energy Tax Credit for renewable electricity generation. Subsidizes
eligible project costs and is applied at 10% per year for five years (50% tax credit in
total).
Reducing the cost of emissions control equipment for biomass systems
o Production tax credit for 35% of the cost of emissions control equipment ($210,000)
A Guide to Utilizing Combined Heat and Power in the Wood Resources Industry
26
The upgraded facility created 12 jobs and allowed R & R Lumber Company to stay competitive in the
wood products market. It also created two new revenue streams for the company: custom-drying for
other lumber producers and the sale of electricity to the grid. The CHP plant sells all generated
electricity directly to the local utility through a Power Purchase Agreement. The Purchase Power
Agreement is a five-year contract that allows R & R Lumber Company to sell around 10,000 MWh/yr of
electricity to the local utility at $65 MWh with an escalation rate of 3% per year. The utility will pay
premium prices for the generated electricity because the CHP plant provides renewable electricity, a
requirement of the utility’s Renewable Energy Portfolio Standards.
Evergreen Community Power Plant Since 1993, the United Corrstack Paper Mill has made corrugated cardboard products in Reading,
Pennsylvania. (http://www.interstateresources.com/Evergreen-Community-Power-LLC.html) The paper
mill produces 435 tons of cardboard per day. The facility was looking for ways to make their paper mill
more cost competitive. A declining domestic demand for paper products has pushed other paper mills
out of business. In addition, the price fluctuation in the natural gas market during the 2000’s created
uncertainty for many energy-intensive industries. In 2008, United Corrstack’s parent company built a
CHP plant to serve the heating and
electric loads of the paper mill. The
plant, known as the Evergreen
Community Power Plant, uses
alternative fuels in an attempt to
reduce the facility’s operating costs.
The fuel for the CHP plant is mulch that is composed of forest industry waste, shredded construction
wood waste, and demolition debris. The fuel is mostly wood-based, but there are significant amounts of
paper, plastic, and other foreign debris. It has an energy content that varies from 5,500 to 7,000 Btu/lb.
The fuel arrives on site via tractor trailer delivery, and the CHP plant typically consumes 300,000 to
350,000 tons of fuel per year.
Fundamentally, the CHP plant is composed of a boiler with a steam turbine and generator. The
circulating fluidized bed boiler produces 330,000 lb/hr of steam at 1,200 psi with a thermal efficiency of
87%. The steam from the boiler is directed to an extraction condensing steam turbine. The three
turbine extractions allow precise control of the paper mill loads. The turbine condenser maximizes the
amount of electricity produced from the excess steam. The attached generator is rated for 33 MW,
much larger than the paper mill electric loads. In situations when it is economically favorable, the CHP
plant will generate excess electricity and opportunistically sell power back to the grid.
The United Corrstack Paper Mill has an excellent technical potential for a CHP plant because of its
consistently high heating and electric loads. However, the project is less than favorable from an
economic perspective. The original cost of the CHP plant was $140,000,000 and the intended payback

A Guide to Utilizing Combined Heat and Power in the Wood Resources Industry
27
period was 12 to 15 years. To date, the CHP plant operates with an average annual deficit of around
$10,000,000. Typical annual expense and revenue streams for the Evergreen Community Power Plant
are provided in the table below.
Table 5: Expenses and revenue of the Evergreen Community Power Plant (2010)
Item Expense Revenue
Fuel transportation $2,400,000 - Ash disposal $2,450,000 -
Chemical treatment $2,000,000 - Staff and repairs $21,000,000 -
Energy to paper mill - $11,000,000 Electricity sold to grid - $6,681,840
Although the Evergreen Community Power Plant is not economically viable, it can provide prospective
CHP owners with a few “lessons learned”:
Fuel sourcing - The wood-based fuel market in Pennsylvania is underdeveloped. Moving
forward, the plant will look to other states (specifically New Jersey) that have more developed
biomass markets for their fuel supply.
Interaction with the electricity market - The Evergreen Community Power Plant has low fuel
costs compared to conventional fuels. Securing strategic power purchase agreements can
improve the profitability of the facility.
Ash disposal - A significant cost for the facility is the removal of ash. Environmental regulation
that gives priority for the use of biomass ash for beneficial reuse would lower the ash removal
costs.
Technical assistance programs - Programs that investigate the feasibility of potential CHP
projects are cost-effective solutions for improving energy efficiency.

A Guide to Utilizing Combined Heat and Power in the Wood Resources Industry
28
List of Affiliates The following list of organizations is for information purposes and does not constitute an endorsement
over similar organizations
Technical Assistance Programs in Pennsylvania
Pennsylvania Technical Assistance Program (PennTAP) 200 Innovation Blvd
156 Technology Center University Park, PA 16802
(814) 865-0427 www.penntap.psu.edu
Mid-Atlantic Clean Energy Application Center
The Navy Yard Philadelphia, PA (215) 353-3319
www.maceac.psu.edu Note: Additional services listed by category under the resources tab on the website.
Ben Franklin Technology Partners
1010 North Seventh Street, Suite 307 Harrisburg, PA 17102
(717) 948-4317 www.benfranklin.org
Equipment Suppliers
Babcock and Wilcox 13024 Ballantyne Corporate Center, Suite 700
Charlotte, NC 28277 (704) 625-4900
www.babcock.com
Capstone Turbine 21211 Nordhoff Street Chatsworth, CA 91311
(818) 734-5300 www.capstoneturbine.com

A Guide to Utilizing Combined Heat and Power in the Wood Resources Industry
29
Elliott Turbines 901 North 4th Street Jeannette, PA 15644
(724) 527-2811 www.elliott-turbo.com
Hurst Boiler
100 Boilermaker Lane Coolidge, GA 31738
(877) 994-8778 www.hurstboiler.com
AFS Energy ystems
420 Oak Street PO Box 170
Lemoyne, PA 17043 (717) 763-0286
www.afsenergy.com
Designers
AFS Energy systems 420 Oak Street
PO Box 170 Lemoyne, PA 17043
(717) 763-0286 www.afsenergy.com
Wilson Engineering 9006 Mercer Pike
Meadville, PA 16335 (814) 337-8223
www.wilsonengineeringservices.com
A Guide to Utilizing Combined Heat and Power in the Wood Resources Industry
30
Steps for Implementing Design The following procedure is a step-by-step process to assist in the design, installation, and operation of
CHP systems. The procedure was developed by the Environmental Protection Agency sponsored
Combined Heat and Power Partnership. The organization’s mission is to reduce the environmental
impact of power generation by promoting the use of CHP. The organization’s website
(http://www.epa.gov/chp/) is an excellent resource for potential or existing CHP users.
Stage 1: Qualification Goal: Determine whether CHP is worth considering at a candidate facility.
There are many types of CHP technologies and applications available for a range of facilities and market
sectors. In order to identify the costs and benefits associated with CHP at a specific site, experienced
professional engineering analysis is required. Answering some preliminary questions regarding a
candidate site before beginning an engineering analysis can save an organization time and money.
Stage 2: Level 1 Feasibility Analysis Goal: Identify project goals and potential barriers. Quantify technical and economic opportunities
while minimizing time and effort.
In addition to energy savings, additional benefits of CHP might meet an organization’s goals and provide
added value to an investment in CHP. To determine the scope of the opportunity for CHP at a facility, an
experienced engineer or CHP project developer should perform a Level 1 Feasibility Analysis. The
purpose of a Level 1 Feasibility Analysis is to provide enough information on project economics to allow
energy end users to make an informed decision about whether or not to continue exploring an
investment in CHP for that particular location.
Stage 3: Level 2 Feasibility Analysis Goal: Optimize CHP system design, including capacity, thermal application, and operation. Determine
final CHP system pricing and return on investment.
The primary purpose of a Level 2 Feasibility Analysis is to replace all of the assumptions used in a Level 1
Feasibility Analysis with verified data and to use this information to optimize the CHP system design. At
the end of this stage, all information needed to make a decision about whether to proceed with the
project should be available.
Stage 4: Procurement Goal: Build an operational CHP system according to specifications, on schedule, and within budget.
This section helps navigate the project development and implementation steps of contract negotiation,
project engineering and construction, and final commissioning. This includes contractor selection,
project financing, and site permitting.

A Guide to Utilizing Combined Heat and Power in the Wood Resources Industry
31
Stage 5: Operations and Maintenance Goal: Maintain a CHP system that provides expected energy savings and reduces emissions by running
reliably and efficiently.
This section discusses typical operational and maintenance costs associated with CHP systems and partnerships to highlight, educate, and promote combined heat and power systems. Overall, CHP projects have proven to be cost-effective, efficient, and reliable at many industrial, institutional, and large commercial facilities nationwide.

A Guide to Utilizing Combined Heat and Power in the Wood Resources Industry
32
Works Cited ASHRAE. (2008). ASHRAE Handbook: Systems and Equipment. Atlanta: American Society of Heating,
Refrigerating and Air-Conditioning Engineers.
Berg, J. E., & Monroe, M. C. (2007). Waste-to-Energy Program: Case Study. Retrieved 2011, from
Interface South: http://www.interfacesouth.org/products/wood-to-energy/biomass-
ambassador-guide/case-studies/CS_Waste_Energy.pdf
Combined Heat and Power Partnership. (n.d.). CHP Project Development Handbook. Retrieved 2011,
from US Environmental Protection Agency:
http://www.epa.gov/chp/documents/chp_handbook.pdf
Deng, J., Wang, R., and Han, G. Y. (2011). A review of thermally activated cooling technologies for
combined cooling, heating and power systems. Progress in Energy and Combustion Science,
37(2), 172-203.
EIA. (2011, 10 19). Annual Energy Review 2010. Retrieved 2012, from US Energy Information
Administration: http://www.eia.gov/totalenergy/data/annual/index.cfm
EPA. (2008, 11). Catalog of CHP Technologies. Retrieved 2011, from US Environmental Protection
Agency: http://www.epa.gov/chp/publications/index.html
Haygreen, J. G., and Bowyer, J. L. (1982). Forest Products and Wood Science. The Iowa State University.
Maor, I. (2009). Cost penalties of near-optimal scheduling control of BCHP systems: Part 1 - Selection of
case study scenarios and data generation. ASHRAE Transactions, 115(1), 271.
Meckler, M., and Hyman, L. (2010). Sustainable On-site CHP Systems: Design, Construction, and
Operations. McGraw-Hill.
Midwest CHP Application Center and Avalon Consulting, Inc. (2003). Combined Heat and Power Resource
Guide. Chicago: Midwest Clean Energy Application Center.
Petchers, N. (2002). Combined Heating, Cooling & Power Handbook: Technologies and Applications.
Lilburn: The Fairmont Press.
Southeast CHP Application Center. (n.d.). Project profile: Cox Interior. Retrieved 2011, from Midwest
Clean Energy Application Center:
http://www.midwestcleanenergy.org/profiles/ProjectProfiles/CoxInterior.pdf
The California Energy Commission. (2003). California Distributed Energy Resouce Guide. Retrieved 2011,
from http://www.energy.ca.gov/distgen/equipment/equipment.html

A Guide to Utilizing Combined Heat and Power in the Wood Resources Industry
33
United Technologies Research Center. (2006). Micro-CHP Systems for Residential Applications.
Pittsburgh: National Energy Technology Laboratory, US Department of Energy.
Washington State University Extension Energy Program. (2011). Project Profile: Rough and Ready.
Retrieved 2011, from Northwest Clean Energy Application Center:
http://www.northwestcleanenergy.org/NwChpDocs/Rough%20and%20Ready%20-
%20case%20study%20-%20pp011811.pdf
Wiser, W. (2000). Energy Resources: Occurrence, Production, Conversion, and Use. New York City:
Springer-Verlag.
Wu, D., and Wang, R. (2006). Combined cooling, heating and power: A review. Progress in Energy and
Combustion Science, 32(5-6), 459-495.