a hapmap harvest of insights into the genetics of … · the international hapmap project was...
TRANSCRIPT

Science in medicine
1590 TheJournalofClinicalInvestigation http://www.jci.org Volume 118 Number 5 May 2008
The International HapMap Project was designed to create a public, genome-wide database of patterns of common human sequence variation to guide genetic studies of human health and disease (1–3). With the publication of the draft human genome sequence in 2001 (4) and the essentially finished version in 2003 (5), the HapMap emerged as a logical next step in characterizing human genomic variation, particularly of the millions of common single–base pair differences among individuals, or SNPs (see Glossary). The HapMap was designed to determine the frequencies and pat-terns of association among roughly 3 million common SNPs in four populations, for use in genetic association studies.
The HapMap has introduced a new paradigm into genomic research, primarily in the form of genome-wide association (GWA) studies, by making possible the cost-efficient assessment of much of the common genomic variation within an individual (1, 6). It has also provided new insights into evolutionary pressures on the human genome and has facilitated functional investigation and cross-population comparisons of candidate disease genes. In addition, it has led to important methodologic advances in imputation of untyped SNPs (that is, reliable estimation of geno-types at SNPs not typed on existing genotyping platforms based on information from typed SNPs) and in assessment of popula-tion substructure in genetic association studies. Finally, the open availability of HapMap samples (both DNA and cell lines) and the consent and consultation process through which they were collected have provided a valuable resource for continued devel-opment of genomic research methods, such as association studies of gene expression and other cellular phenotypes, and for quality assessment of genotyping data.
Genetic influences on common diseasesMost common diseases are caused by the interplay of genes and envi-ronment, with adverse environmental exposures acting on a geneti-
cally susceptible individual to produce disease (7, 8). Unlike Mende-lian disorders such as sickle cell disease and cystic fibrosis, in which alterations in a single gene explain all or nearly all occurrences of disease, genes underlying common diseases are likely to be multiple, each with a relatively small effect, but act in concert or with environ-mental influences to lead to clinical disease (Figure 1) (9).
Identifying these genetic influences would be quite difficult if the risk-associated allelic variants at a particular disease-causing locus were very rare, so that for a disease to be common there would be many different causative alleles. In contrast, the HapMap was designed to identify more common disease-causing variants based upon the “common disease, common variant” hypothesis, which suggests that genetic influences on many common diseases are attributable to a limited number of allelic variants (one or a few at each major disease locus) that are present in more than 1%–5% of the population (10–12). Evidence supporting this hypothesis was modest at the outset of the HapMap Project, and reliance on the hypothesis sparked considerable controversy (13–16). Understand-ing how that controversy played out and was ultimately resolved by the remarkable success of the genetic association studies enabled by the HapMap requires an understanding of genetic variation, popu-lation genetics, and the evolution of the HapMap itself.
SNPs and linkage disequilibriumSNPs are sites in the genome sequence of 3 billion nucleotide bases where individuals differ by a single base. Roughly 10 million such sites, on average about one site per 300 bases, are estimated to exist in the human population such that both alleles have a frequency of at least 1% (3). Most SNPs are biallelic, or have only two forms, which contributes to their being relatively easy to type with auto-mated, high-throughput genotyping methods (17). In addition, their generally low rate of recurrent mutation makes them stable markers of human evolutionary history (17).
In theory, identifying common SNPs associated with disease would involve the relatively straightforward — although time-consuming and expensive — task of typing all 10 million com-mon SNPs in individuals with and without disease and looking for sites that differ in frequency between the groups. Such an
A HapMap harvest of insights into the genetics of common disease
Teri A. Manolio, Lisa D. Brooks, and Francis S. Collins
National Human Genome Research Institute, Bethesda, Maryland, USA.
TheInternationalHapMapProjectwasdesignedtocreateagenome-widedatabaseofpatternsofhumangeneticvariation,withtheexpectationthatthesepatternswouldbeusefulforgeneticassociationstudiesofcommondiseases.Thisexpectationhasbeenamplyfulfilledwithjusttheini-tialoutputofgenome-wideassociationstudies,identifyingnearly100locifornearly40commondiseasesandtraits.Theseassociationsprovidednewinsightsintopathophysiology,suggestingpreviouslyunsuspectedetiologicpathwaysforcommondiseasesthatwillbeofuseinidentifyingnewtherapeutictargetsanddevelopingtargetedinterventionsbasedongeneticallydefinedrisk.
Inaddition,HapMap-baseddiscoverieshaveshednewlightontheimpactofevolutionarypressuresonthehumangenome,suggestingmultiplelociimportantforadaptingtodisease-causingpathogensandnewenvironments.Inthisreviewweexaminetheorigin,development,andcurrentstatusoftheHapMap;itsprospectsforcontinuedevolution;anditscurrentandpotentialfutureimpactonbiomedicalscience.
Nonstandardabbreviationsused: GWA, genome-wide association; LD, linkage dis-equilibrium; OR, odds ratio.
Conflictofinterest: The authors have declared that no conflict of interest exists.
Citationforthisarticle: J. Clin. Invest. 118:1590–1605 (2008). doi:10.1172/JCI34772.

science in medicine
TheJournalofClinicalInvestigation http://www.jci.org Volume 118 Number 5 May 2008 1591
approach would be very expensive and would not capture rarer variants or structural variants (such as insertions, deletions, and inversions) that are not identified by genotyping of SNPs. How-ever, the pattern of association among SNPs in the genome sug-gests a potential shortcut, based on haplotypes and linkage dis-equilibrium (LD). A haplotype is the combined set of alleles at a number of closely spaced sites on a single chromosome. Nearby SNP alleles tend to be associated with each other, or inherited together more often than expected by chance, because most arise through mutational events that each occur once on an ancestral haplotype background and are inherited with that background, rather than arising multiple times de novo on different back-grounds (18). This is because for most SNPs the rate of muta-
tion, or novel SNP generation, is relatively low (roughly 10–8 per site per generation, or 30 new variants per haploid gamete), as are the rate of recombination occurring with each meiosis and the number of generations (roughly 104) between currently liv-ing individuals and their most recent common ancestor (3). Each new allele is initially associated with the other allelic variants present on the particular stretch of ancestral DNA on which it arose, and these associations are only slowly broken down over time by recombination between SNPs and generation of new variants (Figure 2) (3).
Two polymorphic sites are said to be in LD when their specific alleles are correlated in a population. High LD means that the SNP alleles are almost always inherited together; information about
Glossary
Allele, an alternative form of a gene or SNP, or another type of variantBiallelic, having only two possible alleles in a variant, typically a SNPConfidenceinterval, the range of values surrounding a point estimate, such as an OR, within which the true value is believed to lie with a specified degree of certainty (typically 95%)Copynumbervariant, a DNA sequence of hundreds to thousands of base pairs that is present a variable number of times across individualsHaplotype, a combination of alleles at multiple linked sites on a single chromosome, all of which are transmitted togetherHaplotypeblock, a region containing strongly associated SNPsLightsequencing, a process involving an average of 1–3 sequencing reads at any place in the genomeLinkagedisequilibrium, the nonrandom association of alleles at two or more sites on the same chromosomeMendeliandisorder, a disorder caused by a single gene defect, which tends to occur in either dominant or recessive inheritance patternsMinorallelefrequency, the proportion of chromosomes in the population carrying the less common variantOdds, the ratio of the probability of disease to 1 minus the probability of diseaseOddsratio, the ratio of the odds of an event occurring in one group to the odds of it occurring in another group; can be presented in terms of increased risk per copy of the variant (allelic OR), of a heterozygous carrier compared with a noncarrier (heterozygote OR), or of individuals with the heterozygous and homozygous variant genotypes separately compared with those homozygous for the nonrisk allele (genotypic OR)NonsynonymousSNP, a SNP for which each allele codes for a different amino acid in the protein sequencePolymorphism, a form of genetic variation in which each allele occurs in at least 1% of the populationPower, the probability of a study detecting an association, if one existsr2, LD coefficient, representing the proportion of observations in which two specific pairs of alleles occur togetherSinglenucleotidepolymorphism, a site within the genome that differs by a single nucleotide base across different individualsTagSNP, a representative SNP in a region of the genome with high LD to other variants
Figure 1Genetic and environmental contributions to monogenic and complex disorders. (A) Mono-genic disease. A variant in a single gene is the primary determinant of a monogenic disease or trait, responsible for most of the disease risk or trait variation (dark blue sector), with possible minor contributions of modifier genes (yellow sectors) or environment (light blue sector). (B) Complex disease. Many variants of small effect (yellow sectors) contribute to disease risk or trait variation, along with many environmental factors (blue sector).

science in medicine
1592 TheJournalofClinicalInvestigation http://www.jci.org Volume 118 Number 5 May 2008
the allele of one SNP in an individual is strongly predictive of the allele of the other SNP on that chromosome (Figure 3). The LD between many neighboring SNPs generally persists because meiot-ic recombination does not occur at random, but is concentrated in recombination hot spots (19). Adjacent SNPs that lack a hot spot between them are likely to be in strong LD. A commonly used mea-sure of LD, r2, can be interpreted as the proportion of variation in one SNP explained by another, or the proportion of observations in which two specific pairs of their alleles occur together. Two SNPs that are perfectly correlated have an r2 of 1.0, so that allele A of SNP1 in Figure 3, for example, is always observed with allele C of SNP2, and vice versa, while an r2 of 0 could be interpreted as an observation of allele A of SNP1 providing no information at all about which allele of SNP4 is present.
Because humans are a relatively young species, and because recombination does not occur at random, there have generally not been enough recombination events to separate a variant from the ancestral background on which it arose (20). A small number of SNPs could theoretically produce an enormous number of hap-lotypes if every SNP allele could occur in combination with every other SNP allele (n biallelic SNPs could generate 2n haplotypes), but in practice, far fewer combinations make up the bulk of the haplotypes observed in a population (Figure 3) (18, 21). Because of the strong associations among the SNPs in most chromosomal regions, only a few carefully chosen SNPs (known as tag SNPs; ref. 3) need to be typed to predict the likely variants at the rest of the SNPs in each region.
The size of regions of strong LD varies dramatically across the genome, and to a lesser extent across populations, so that SNPs selected at random or even those spaced at regular inter-vals across the genome will not efficiently capture the bulk of genomic variation (3). The mean size of regions of strongly asso-ciated SNPs, sometimes called haplotype blocks, is estimated to be 22 kb in populations of European or Asian ancestry and 11 kb in populations of recent African ancestry (18). This differ-ence among populations is expected based on population size and migration history; compared with the parent populations, populations with founder effects (a few relatively isolated indi-viduals whose descendants intermarry) have larger regions with stronger associations among SNPs. It has been estimated that most of the variation in the human genome could be captured by genotyping several hundred thousand to 1 million tag SNPs, but selection of the best tag SNPs requires precise mapping of the patterns of LD (3). This was the justification for developing the human haplotype map (1, 3, 22, 23).
Building a haplotype map of the human genomeThe International HapMap Project was a consortium among researchers in Canada, China, Japan, Nigeria, the United King-dom, and the United States, organized to consider the ethical issues, develop the scientific plan, choose the populations and SNPs to be typed, carry out the genotyping and data analysis, and release the data into the public domain (1, 3). The consortium produced a human haplotype map by genotyping 270 samples, from four populations with diverse geographic ancestry, provid-ed by people who gave consent specifically for this project and related research. These samples included 30 trios (mother, father, and adult child) from the Yoruba in Ibadan, Nigeria; 30 trios from the Centre d’Étude du Polymorphisme Humaincollection of Utah residents of Northern and Western European ancestry; 45 unrelated Han Chinese in Beijing; and 45 unrelated Japanese in Tokyo (24). The Utah samples were previously collected but were reconsented for this purpose. New samples were collected from the Yoruba, Han Chinese, and Japanese after processes of community engagement (25). The newly collected samples were permanently disconnected from individual identifiers and had no associated phenotype data. Cell lines and DNA from the sam-ples are available for research from the nonprofit Coriell Insti-tute for Medical Research (26).
Figure 2Breakdown of LD around a new SNP. A mutation generating a novel SNP (red circle) occurs on an existing chromosome (dark blue) with multiple preexisting SNP alleles (dark blue circles) occurring in an ancestral haplotype that spans the entire chromosomal segment shown. After multiple meioses over many generations (arrows), the chromosomal segments flanking this variant will tend to be reshuffled by recombination, as shown by different colors. Over time, therefore, the segment containing the new variant and its surrounding ancestral SNP alleles becomes shorter and occurs on a variety of haplotypes associated with different flanking SNP alleles.
Figure 3Tag SNPs can define common haplotypes. Variable sites (SNPs) are shown by colored bars in this simplified example (adjacent SNPs are generally separated by longer distances). Complete independence of these 6 SNPs would predict the possibility of 26 or 64 different haplo-types (because n biallelic SNPs could generate 2n haplotypes), but in reality just 4 haplotypes comprise 90% of observed chromosomes, indicating that LD is present. To be specific, SNP1, SNP2, and SNP3 are strongly correlated, and SNP4, SNP5, and SNP6 are strongly cor-related, so that any of SNP1–SNP3 (or SNP4–SNP6) could serve as tags for the other 2 SNPs in each group. Specific tags may be chosen for genotyping platforms because of stronger associations with addi-tional SNPs in the region or technical ease of genotyping.

science in medicine
TheJournalofClinicalInvestigation http://www.jci.org Volume 118 Number 5 May 2008 1593
Approximately 1 million SNPs were genotyped in phase I of the project, and a description was published in 2005 (1). This was fol-lowed by the phase II HapMap of over 3 million SNPs, published in 2007 (2). Genotyping in phase II was attempted for about 4.4 million distinct SNPs, of which roughly 1.3 million either could not be typed, were not polymorphic in any of the populations, or did not pass genotyping quality control filters. Certain regions of the genome were recognized as being challenging to study, such as centromeres, telomeres, gaps in genome sequence, and segmental duplications, and only one attempt was made to develop a geno-typing assay before such a region was declared to be not HapMap-able (1). All the genotype data are freely available from the Hap-Map Data Coordination Center (27) and dbSNP (28).
These data revealed the pattern of association among SNPs in the genome and how these patterns vary across populations. Although the four populations studied show generally similar patterns of variation, the Yoruba population has less LD overall and shorter haplotype blocks, as noted above, but the regions with higher LD are similar across the populations. The diversity of haplotypes within blocks also varies across populations, with the Yoruba hav-ing an average of 5.6 haplotypes in each block compared with 4.0 in the Japanese and Han Chinese populations (1).
Studies in additional populations have shown that the tag SNPs chosen using the HapMap are generally transferable across other populations, but there are some limitations, particularly for rarer SNPs and for populations with substantial proportions having recent African ancestry (29). Fluctuations in estimates of allele fre-quency and LD because of small sample sizes also limit the transfer-ability of HapMap-derived tag SNPs, so additional samples from the populations used to develop the HapMap as well as from seven more populations have recently been genotyped across the genome (30).
Advances in technology for high-throughput SNP genotypingAdvances in genotyping technology have vastly increased the num-ber of variants that can be typed and decreased the per-sample costs (31–34). These advances have made possible the dense geno-typing needed to capture the majority of SNP variation within an individual at a sufficiently low cost to allow the large sample sizes needed for comparison of individuals with and without disease.
When the HapMap Project began, the cost per sample per SNP was about $0.40; by 2005the cost had dropped to about $0.01, and the current cost is about one-tenth of that for platforms typing nearly 1 million SNPs at once.
Information generated by the HapMap on LD patterns among SNPs has permitted the design of efficient and comprehensive genotyping platforms by elucidating tag SNPs that serve as proxies for the largest number of SNPs and eliminating redundant SNPs or SNPs that cannot be assayed reliably (1). Currently, genome-wide scans cost less than $1,000 per sample and include about 1 million SNPs, with more SNPs in regions with low LD than in regions with high LD. As genotyping platforms are developed to allow for an increase in the number of tag SNPs typed, they capture more varia-tion in every population, so that even samples of recent African ancestry have most of the genome covered at high r2 (Table 1) (2).
Accuracy of these platforms is paramount, because genotyping errors such as incorrectly typing some heterozygotes as homozy-gotes can cause spurious results and obscure the true associations, particularly if errors are differential between cases and controls (35, 36). Genotyping errors can also affect parent-offspring trio studies that are robust to other types of bias, such as differences in ancestral origin (population structure) between individuals with and without disease (37). Efforts to improve the accuracy of geno-typing platforms and genotype calling algorithms are continuing and rely heavily on use of HapMap samples and data for quality assessment (32, 35, 38). An important step in evaluating the reli-ability of findings at present is ensuring that they are repeated on a second, independent genotyping platform (39).
Cost efficiency of genotyping platforms is a major consideration for GWA studies because of the very large sample sizes needed to detect genetic variants of modest effect. To provide the same sta-tistical power for detecting a true association between a genetic variant and a disease, assuming such an association exists, sample sizes must increase with the following: (a) greater number of geno-types and association tests performed, and thus greater probability of spurious associations (type I error); (b) greater genotyping error or phenotypic misclassification; (c) lower size of the genetic effect (risk of disease conferred by the disease-associated allele); (d) lower frequency of the risk allele; (e) lower r2 between the disease-associ-ated SNP and the tag SNP typed on the platform; and (f) hetero-geneity of the genetic association, caused by multiple genes that contribute to the disease, ancestry differences across population subsets, or gene-gene or gene-environment interactions.
The number of tests is a major factor in determining the statisti-cal power of GWA studies, in which 106 or more association tests (at least one for each SNP) are performed. Although these tests are not strictly independent because of LD, the current convention is to apply a Bonferroni correction (which assumes independence and is thus overly conservative) by dividing the conventional P value of 0.05 by the number of tests performed (40). This requires P values in the 5 × 10⁻⁷ to 5 × 10⁻⁸ range to define an association, a strin-gent level of significance. Were one to be satisfied with a P value of 0.05, detecting a variant of 10% allele frequency conferring a 1.5-fold increased risk with 80% statistical power would require only 360 cases and 360 controls, but 50,000 potentially spurious associations would be expected by chance out of 1 million SNPs tested. Lowering the P value to 5 × 10⁻⁷ vastly reduces the number of spurious associations but requires a more than 4-fold increase in the sample size, to roughly 1,590 cases and 1,590 controls, for the same statistical power (41). Risk associated with a variant is often
Table 1Estimated coverage of commercially available fixed marker genotyping platforms
HapMappopulationsamplePlatform YRI CEU CHB+JPTAffymetrix GeneChip 500K 46 68 67Affymetrix SNP Array 6.0 66 82 81Illumina HumanHap300 33 77 63Illumina HumanHap550 55 88 83Illumina HumanHap650Y 66 89 84Perlegen 600K 47 92 84
Data represent percent of SNPs tagged at r2 ≥ 0.8. Values assume all SNPs on the platform are informative and pass quality control. YRI, Yoruba in Ibadan, Nigeria; CEU, subsample of Utah residents of North-ern European ancestry selected from Centre d’Étude du Polymorphisme Humain samples; CHB, Han Chinese in Beijing, China; JPT, Japanese in Tokyo. From the International HapMap Consortium, 2007 (3).

science in medicine
1594 TheJournalofClinicalInvestigation http://www.jci.org Volume 118 Number 5 May 2008

science in medicine
TheJournalofClinicalInvestigation http://www.jci.org Volume 118 Number 5 May 2008 1595
assessed by the odds ratio (OR), the odds of disease in individuals with the variant divided by the odds of disease in those without the variant. ORs for many of the genetic variants believed to contribute to the risk of complex diseases are likely to fall in the 1.2–1.3 range or lower, considerably lower than the OR of 3.2, for example, for Alzheimer disease associated with the apolipoprotein E ε4 allele (42) or the OR of 4.1 for deep venous thrombosis associated with oral contraceptive use (43). Statistical power is known to decline steeply below an OR of 1.2 (44) and as minor allele frequency (MAF) falls (23); a study of 6,000 cases and 6,000 controls has been estimated to provide statistical power of 94%, 43%, and 3% for MAFs of 0.1, 0.05, and 0.02, respectively, conferring an OR of 1.3 at P < 10–6 (44).
Beyond SNPs: copy number variants and other structural variationCurrent generation high-throughput genotyping platforms are extraordinarily efficient at genotyping SNPs, but, as stated above, they are less effective at genotyping structural variants, such as insertions, deletions, inversions, and copy number variants. Although not as common as SNPs, these variants also occur com-monly in the human genome (45). The HapMap was not designed to capture these variants, although it can be used indirectly to do so, particularly for small deletions that are in LD with SNPs (46–48). Copy number variants, in which stretches of genomic sequence of roughly 1 kb to 3 Mb in size are deleted or are duplicated in vary-ing numbers, have gained increasing attention because of their apparent ubiquity and potential dosage effect on gene expression (47, 49, 50). A variety of diseases such as DiGeorge syndrome and α-thalassemia have been shown to be caused by large deletions, insertions, and other structural variants, and the potential for structural variants to influence phenotypes in healthy individu-
als is now recognized (51, 52). Expansion and refinement of cur-rent genotyping platforms increasingly focus on capturing copy number variants adequately, and some success has already been achieved (38, 53). Array and sequencing methods are also being used to type structural variants using the HapMap samples for development and cross-validation of the methods (54, 55).
Application of the HapMap to common disease: success storiesThe technological advances directly stimulated or indirectly facili-tated by the HapMap have had a profound impact on the study of the genetics of common diseases, exceeding even the expecta-tions of the project’s originators (4). Not only has the HapMap enabled a new generation of genetic association studies through the application of high-density, genome-wide genotyping to care-fully characterized individuals with and without disease, but it has also stimulated the development and testing of analytic methods for reducing spurious associations (56, 57), assessing claims of replication of genotype-phenotype associations (39, 58), identify-ing and adjusting for ancestry differences among individuals and groups (35, 59, 60), and imputing untyped SNPs across different genotyping platforms (61).
The short history of high-density GWA scanning (i.e., about 100,000 SNPs or more) to date has demonstrated the striking suc-cess of this approach in finding genetic variants associated with disease. Variants or regions associated with nearly 40 complex diseases or traits have been identified and replicated in diverse population samples (Figure 4). Complex conditions as dissimi-lar as macular degeneration and exfoliative glaucoma (Table 2), diabetes (Table 3), cancer (Table 4), inflammatory bowel disease (Table 5), cardiovascular disease (Table 6), neuropsychiatric con-ditions (Table 7), autoimmune and infectious diseases (Table 8), and a variety of anthropometric and laboratory traits (Table 9) have recently yielded strong, convincing, replicated associations in GWA scanning. Several of these discoveries have suggested etiolog-ic pathways not previously implicated in these diseases, such as the autophagy pathway in inflammatory bowel disease (62), the com-plement pathway in macular degeneration (63), and the HLA-C
Table 2GWA studies in eye diseases
Disease/trait Samplesize Region Gene Strongest Riskallele P ORpercopyor Platform Initial Replication SNP-risk frequency forheterozygote manufacturer allele incontrols (95%CI) andSNPsA
Age-related macular 96 cases NR 1q31 CFH rs380390-C 0.70 4 × 10⁻⁸ 4.6 Affymetrix: 103,611 degeneration (63) 50 con (HapMap CEU)B (2.0–11)
Wet age-related macular 96 cases NR 10q26.13 HTRA1 rs11200638-A NR 8 × 10–12 1.60 Affymetrix: 97,824 degeneration (95) 130 con (0.71–3.61)
Exfoliation 75 cases 254 cases 15q24.1 LOXL1 rs3825942-G 0.85 3 × 10–21 20.10 Illumina: 304,250 glaucoma (65) 14,474 con 198 con (10.80–37.41)
Only studies with at least one association significant at 9.9 × 10⁻⁷ or less are shown, regardless of number of SNPs tested. Allele frequencies, P values, and ORs derived from the largest sample size — typically a combined analysis (initial plus replication studies) — are shown; however, if this was not report-ed, statistics from the initial study sample are shown. Only SNPs significant at 9.9 × 10⁻⁷ in combined analysis and only one of close LD pair are shown unless there was evidence of independent association. Gene regions corresponding to SNPs were identified from the UCSC Genome Browser (104). Named genes refer to either the most plausible candidate gene(s) within the associated region or the gene nearest the (currently known) most associated SNP in a region, with the associated region being determined by the LD structure. Affymetrix (Santa Clara, California, USA) platforms include GeneChip Mapping 100K Set, Centurion arrays, and GeneChip 500K Mapping Array Set. Illumina Inc. (San Diego, California, USA) platforms include Sentrix Human-Hap240, HumanHap300 BeadChip, Sentrix HumanHap300, InfiniumII Human Hap550, Human Hap300-duo+, and Sentrix Human-1 Genotyping BeadChip. CI, confidence interval; con, controls; NR, not reported. ANumber that passed quality control. BSubsample of Utah residents of Northern European ancestry selected from Centre d’Étude du Polymorphisme Humain samples studied by the HapMap Project.
Figure 4SNP-trait associations detected in GWA studies. Associations signifi-cant at P < 9.9 × 10⁻⁷ are shown according to chromosomal location and involved or nearby gene, if any. Colored boxes indicate similar diseases or traits.

science in medicine
1596 TheJournalofClinicalInvestigation http://www.jci.org Volume 118 Number 5 May 2008
locus in control of viral load in HIV infection (64). Note that the estimated ORs for most of these associations are relatively mod-est, at 2.0 or less, although smaller studies of rare diseases can give quite large ORs (and very wide confidence intervals), as in the case of the 20-fold increased risk (95% confidence interval, 10.8 to 37.4) associated with rs3825942-G in exfoliation glaucoma (65).
A major strength of the genome-wide approach facilitated by HapMap-based genotyping platforms has been its freedom from reliance on prior knowledge, imperfect as it is, of genes likely to be related to the trait of interest. Instead, GWA studies survey the entire genome in a comprehensive, systematic, even agnostic manner, relaxing the dependence on strong prior hypotheses (39). Most of the associations found in these studies have not been with genes previously thought to be related to the disease under study, and some of the most reliably replicated associations, such as those of the chromosome 8q24 region and prostate cancer (66, 67), or the 5p13.1 region and Crohn disease (35, 68), have been in
genomic regions carrying no known genes at all (69). Of consider-able interest in determining pathophysiology have been variants or regions implicated in multiple diseases, such as the 8q24 region in prostate, breast, and colorectal cancer (66, 70, 71) and the PTPN2 gene in type 1 diabetes and Crohn disease (35). Notable among these are the CDKN2A/B cell-cycle variants on chromosome 9p21, which have been implicated in coronary disease (72, 73), type 2 diabetes (61, 74), and frailty (75). Prior interest in CDKN2A/B focused on the fact that germline deletions of these genes confer a risk of familial malignant melanoma (76), and it is surprising to see potentially regulatory variants of these same cell-cycle genes implicated in these additional common conditions.
In addition to its pivotal role in the design of genotyping plat-forms, the HapMap played important roles in these discover-ies, include providing better estimates of allele frequencies (64), comparing allele frequencies across the four HapMap popula-tions (72), identifying additional variants for testing, and defin-
Table 3GWA studies in diabetes
Disease/trait Samplesize Region Gene Strongest Riskallele P ORpercopyor Platform Initial Replication SNP-risk frequency forheterozygote manufacturer allele incontrols (95%CI) andSNPsA
Type 1 diabetes 1,963 cases 4,000 cases 12q24.13 C12orf30 rs17696736-G 0.42 2 × 10–16 1.22 (1.15–1.28) See ref. 35 (105) 2,938 con 5,000 con 12q13.2 ERBB3 rs2292239-A 0.34 2 × 10–20 1.28 (1.21–1.35) 2,997 trios 16p13.13 KIAA0350 rs12708716-A 0.68 3 × 10–18 1.23 (1.16–1.30) 18p11.21 PTPN2 rs2542151-C 0.16 1 × 10–14 1.30 (1.22–1.40) 18q22.2 CD226 rs763361-A 0.47 1 × 10⁻⁸ 1.16 (1.10–1.22)
Type 1 diabetes 1,963 cases See ref. 105 12q13.2 ERBB3 rs11171739-C 0.42 1 × 10–11 1.34 (1.17–1.54) Affymetrix: (35) 2,938 con 12q24.13 SH2B3/LNK rs17696736-G 0.42 2 × 10–14 1.34 (1.16–1.53) 469,557 16q13.13 TRAFD1, rs12708716-A 0.65 5 × 10⁻⁷ 1.19 (0.97–1.45) PTPN11, KIAA0350
Type 1 diabetes 563 cases 2,350 individ 16p13.13 KIAA0350 rs2903692-G 0.62 7 × 10–11 1.54 (1.32–1.79) Illumina: (106) 1,146 con in 549 families; 534,071 483 trios 390 trios
Type 2 diabetes 1,380 cases 2,617 cases 8q24.11 SLC30A8 rs13266634-C 0.30 6 × 10⁻⁸ 1.18 (NR) Illumina: (78) 1,323 con 2,894 con 392,935
Type 2 diabetes 1,161 cases 1,215 cases 3q27.2 IGF2BP2 rs4402960-T 0.30 9 × 10–16 1.14 (1.11–1.18) Illumina: (61) 1,174 con 1,258 con 6p22.3 CDKAL1 rs7754840-C 0.36 4 × 10–11 1.12 (1.08–1.16) 315,635 9p21.3 CDKN2A/B rs10811661-T 0.85 8 × 10–15 1.20 (1.14–1.25) 11p12 Intergenic rs9300039-C 0.89 4 × 10⁻⁷ 1.25 (1.15–1.37)
Type 2 diabetes 1,464 cases 5,065 cases 9p21.3 CDKN2A/B rs10811661-T 0.83 8 × 10–15 1.20 (1.14–1.25) Affymetrix: (90) 1,467 con 5,785 con 3q27.2 IGF2BP2 rs4402960-T 0.29 9 × 10–16 1.14 (1.11–1.18) 386,731 6p22.3 CDKAL1 rs7754840-C 0.31 4 × 10–11 1.12 (1.08–1.16)
Type 2 diabetes 1,399 casesB 2,437 casesB 6p22.3 CDKAL1 rs7756992-G 0.26 8 × 10⁻⁹ 1.20 (1.13–1.27) Illumina: (107) 5,275 conB 7,287 conB 313,179 SNPs; 339,846 2-SNP haplotypes
Type 2 diabetes 1,924 cases 3,757 cases 16q12.2 FTO rs8050136-A 0.60 1 × 10–12 1.17 (1.12–1.22) Affymetrix: (74) 2,938 con 5,346 con 6p22.3 CDKAL1 rs10946398-C 0.32 4 × 10–11 1.12 (1.08–1.16) 393,453 10q23.33 HHEX rs5015480-C 0.43 6 × 10⁻¹⁰ 1.13 (1.08–1.17) 9p21.3 CDKN2B rs10811661-T 0.83 8 × 10–15 1.20 (1.14–1.25) 3q27.2 IGFBP2 rs4402960-T 0.32 9 × 10–16 1.14 (1.11–1.18)
Type 2 diabetes 1,924 cases See ref. 74 6p22.3 CDKAL1 rs9465871-C 0.18 3 × 10⁻⁷ 1.18 (1.04–1.34) Affymetrix: (35) 2,938 con 16q12.2 FTO rs9939609-A 0.40 2 × 10⁻⁷ 1.34 (1.17–1.52) 469,557
Studies, statistics, and platforms are reported as described in Table 2. individ, individuals. ANumber that passed quality control. BIndividuals studied were of European ancestry.
science in medicine
TheJournalofClinicalInvestigation http://www.jci.org Volume 118 Number 5 May 2008 1597
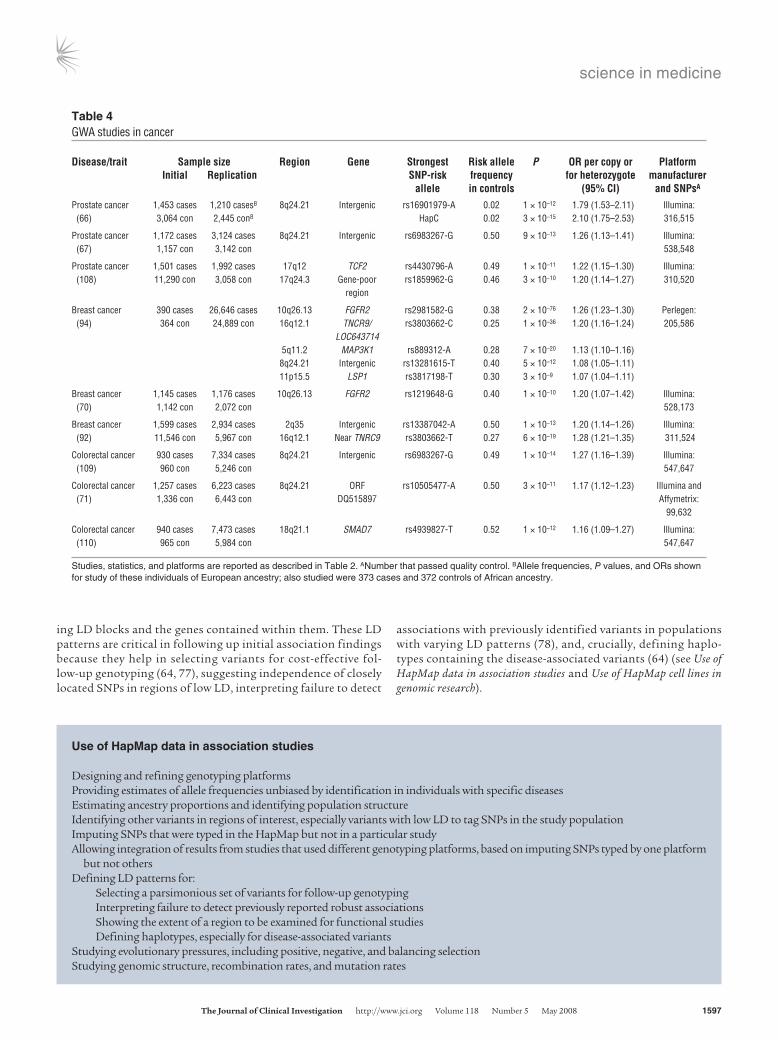
ing LD blocks and the genes contained within them. These LD patterns are critical in following up initial association findings because they help in selecting variants for cost-effective fol-low-up genotyping (64, 77), suggesting independence of closely located SNPs in regions of low LD, interpreting failure to detect
associations with previously identified variants in populations with varying LD patterns (78), and, crucially, defining haplo-types containing the disease-associated variants (64) (see Use of HapMap data in association studies and Use of HapMap cell lines in genomic research).
Table 4GWA studies in cancer
Disease/trait Samplesize Region Gene Strongest Riskallele P ORpercopyor Platform Initial Replication SNP-risk frequency forheterozygote manufacturer allele incontrols (95%CI) andSNPsA
Prostate cancer 1,453 cases 1,210 casesB 8q24.21 Intergenic rs16901979-A 0.02 1 × 10–12 1.79 (1.53–2.11) Illumina: (66) 3,064 con 2,445 conB HapC 0.02 3 × 10–15 2.10 (1.75–2.53) 316,515
Prostate cancer 1,172 cases 3,124 cases 8q24.21 Intergenic rs6983267-G 0.50 9 × 10–13 1.26 (1.13–1.41) Illumina: (67) 1,157 con 3,142 con 538,548
Prostate cancer 1,501 cases 1,992 cases 17q12 TCF2 rs4430796-A 0.49 1 × 10–11 1.22 (1.15–1.30) Illumina: (108) 11,290 con 3,058 con 17q24.3 Gene-poor rs1859962-G 0.46 3 × 10⁻¹⁰ 1.20 (1.14–1.27) 310,520 region
Breast cancer 390 cases 26,646 cases 10q26.13 FGFR2 rs2981582-G 0.38 2 × 10–76 1.26 (1.23–1.30) Perlegen: (94) 364 con 24,889 con 16q12.1 TNCR9/ rs3803662-C 0.25 1 × 10–36 1.20 (1.16–1.24) 205,586 LOC643714 5q11.2 MAP3K1 rs889312-A 0.28 7 × 10–20 1.13 (1.10–1.16) 8q24.21 Intergenic rs13281615-T 0.40 5 × 10–12 1.08 (1.05–1.11) 11p15.5 LSP1 rs3817198-T 0.30 3 × 10⁻⁹ 1.07 (1.04–1.11)
Breast cancer 1,145 cases 1,176 cases 10q26.13 FGFR2 rs1219648-G 0.40 1 × 10⁻¹⁰ 1.20 (1.07–1.42) Illumina: (70) 1,142 con 2,072 con 528,173
Breast cancer 1,599 cases 2,934 cases 2q35 Intergenic rs13387042-A 0.50 1 × 10–13 1.20 (1.14–1.26) Illumina: (92) 11,546 con 5,967 con 16q12.1 Near TNRC9 rs3803662-T 0.27 6 × 10–19 1.28 (1.21–1.35) 311,524
Colorectal cancer 930 cases 7,334 cases 8q24.21 Intergenic rs6983267-G 0.49 1 × 10–14 1.27 (1.16–1.39) Illumina: (109) 960 con 5,246 con 547,647
Colorectal cancer 1,257 cases 6,223 cases 8q24.21 ORF rs10505477-A 0.50 3 × 10–11 1.17 (1.12–1.23) Illumina and (71) 1,336 con 6,443 con DQ515897 Affymetrix: 99,632
Colorectal cancer 940 cases 7,473 cases 18q21.1 SMAD7 rs4939827-T 0.52 1 × 10–12 1.16 (1.09–1.27) Illumina: (110) 965 con 5,984 con 547,647
Studies, statistics, and platforms are reported as described in Table 2. ANumber that passed quality control. BAllele frequencies, P values, and ORs shown for study of these individuals of European ancestry; also studied were 373 cases and 372 controls of African ancestry.
Use of HapMap data in association studies
Designing and refining genotyping platformsProviding estimates of allele frequencies unbiased by identification in individuals with specific diseasesEstimating ancestry proportions and identifying population structureIdentifying other variants in regions of interest, especially variants with low LD to tag SNPs in the study populationImputing SNPs that were typed in the HapMap but not in a particular studyAllowing integration of results from studies that used different genotyping platforms, based on imputing SNPs typed by one platform but not othersDefining LD patterns for: Selecting a parsimonious set of variants for follow-up genotyping Interpreting failure to detect previously reported robust associations Showing the extent of a region to be examined for functional studies Defining haplotypes, especially for disease-associated variantsStudying evolutionary pressures, including positive, negative, and balancing selectionStudying genomic structure, recombination rates, and mutation rates

science in medicine
1598 TheJournalofClinicalInvestigation http://www.jci.org Volume 118 Number 5 May 2008
Clinical significance of HapMap success storiesAs noted above, GWA studies have provided startling new insights into pathophysiology, such as the role of the comple-ment system in macular degeneration (63) or the potential for genetic variants that reduce the efficiency of intracellular mech-anisms for disposing of unwanted cytoplasmic constituents (autophagy) to cause disease (62).
In addition to the pathophysiologic implications of genetic discoveries based on the HapMap, these findings have raised the possibility of using general population-based screening, or more targeted screening of individuals with positive family histories for these conditions, for identifying high-risk, presymptomatic sub-jects, determining the earliest manifestations of these conditions,
and facilitating early trials of preventive therapies (79). Although the increases in risk detected in these studies are typically modest, in the 1.2- to 1.5-fold range as noted above, these associations can point the way to important therapeutic avenues and, when con-sidered in combination, may identify individuals at substantially increased risk (61). This information can be particularly important, even in the absence of specific pharmaceutical agents targeted to such individuals, for more aggressive efforts to reduce known risk factors that can be modified, such as obesity in prediabetes and smoking in age-related macular degeneration (AMD) (80, 81). Even modest risk factors may be valuable in individualizing surveillance programs such as mammography, prostate-specific antigen (PSA) screening, or colonoscopy, although further research will be needed
Table 5GWA studies in gastrointestinal disorders
Disease/trait Samplesize Region Gene Strongest Riskallele P ORpercopyor Platform Initial Replication SNP-risk frequency forheterozygote manufacturer allele incontrols (95%CI) andSNPsA
IBD (96) 547 cases 401 casesB 1p31 IL23R rs11209026-A 0.93 4 × 10–11 3.84 (2.33–6.66)C Illumina: 548 con 433 conB 2.22 (1.37–3.70)D 308,332
Crohn disease 547 cases 1,266 cases 5p13.1 Intergenic rs1373692-? 0.59 2 × 10–12 1.46 (NR) Illumina: (68) 928 con 559 con 302,451 428 trios
Crohn disease 946 cases 353 cases 2q37.1 ATG16L1 rs2241880-G 0.55 1 × 10–13 1.45 (1.27–1.64) Illumina: (62) 977 con 207 con 10q21.2 Intergenic rs224136-? 0.19 1 × 10⁻¹⁰ 1.67 (NR) 304,413 530 trios
Crohn disease 1,748 cases 1,182 cases 1q24.3 Intergenic rs12035082-? 0.40 2 × 10⁻⁷ 1.14 (1.02–1.27) See ref. 35 (111) 2,938 con 2,024 con 1q31.2 Intergenic rs10801047-? 0.08 3 × 10⁻⁸ 1.47 (1.22–1.76) 3p21.31 Many genes rs9858542-? 0.29 5 × 10⁻⁸ 1.17 (1.14–1.31) 5q33.1 IRGM rs13361189-? 0.08 2 × 10⁻¹⁰ 1.38 (1.15–1.66) 10q24.2 NKX2-3 rs10883365-? 0.48 4 × 10–18 1.18 (1.05–1.32) 18p11.2 PTPN2 rs2542151-? 0.18 3 × 10⁻⁸ 1.15 (1.00–1.32) 21q22.2 Intergenic rs2836754-? 0.35 5 × 10⁻⁷ 1.15 (1.03–1.28)
Crohn disease 1,748 cases See ref. 111 3p21.31 BSN, MST1 rs9858542-A 0.28 4 × 10⁻⁸ 1.09 (0.96–1.24) Affymetrix: (35) 2,938 con 5q33.1 IRGM rs1000113-T 0.07 3 × 10⁻⁷ 1.54 (1.31–1.82) 469,557 10q24.2 NKX2-3 rs10883365-G 0.48 6 × 10⁻⁸ 1.20 (1.03–1.39) 18p11.21 PTPN2 rs2542151-G 0.16 2 × 10⁻⁷ 1.30 (1.14–1.48)
Crohn disease 382 trios 521 trios 1p31.3 IL23R 17 marker 0.23 1 × 10⁻⁸ 1.38 (1.23–1.53) Perlegen: (112) 750 cases haplotype-1 0.97 2 × 10⁻⁷ 2.56 (1.75–3.70) 164,279 828 con and -2
Celiac disease 778 cases 991 cases 4q27 KIA1109, rs6822844-G 0.82 1 × 10–14 1.59 (1.41–1.75) Illumina: (113) 1,422 con 1,489 con TENR, 310,605 IL2, IL21
Gallstones 280 cases 2,000 cases 2p24.2 ABCG8 rs11887534-C 0.10 1 × 10–14 2.20 (1.80–2.60) Affymetrix: (114) 360 con 1,202 con 382,492
Studies, statistics, and platforms are reported as described in Table 2. IBD, inflammatory bowel disease; ?, risk allele not indicated. ANumber that passed quality control. BAlso studied were 883 families and 1,119 affected offspring. CNon-Jewish. DJewish.
Use of HapMap cell lines in genomic research
Assessing data quality for genotyping studies by including HapMap samples with known genotypesMapping genetic factors that affect gene expression and other cellular phenotypes using the HapMap genotype dataValidating methods to detect and characterize variation, including structural variantsCharacterizing variation more deeply through extensive sequencing

science in medicine
TheJournalofClinicalInvestigation http://www.jci.org Volume 118 Number 5 May 2008 1599
to explore the effectiveness of such approaches. To the degree that they determine treatment response, genetic variants may also be useful in tailoring pharmacologic therapy to individuals most likely to respond — and not react adversely — to specific treatments (82).
In the long run, the greatest contribution of genetic discoveries facilitated by the HapMap may be in the identification of new ther-apeutic targets. Such treatments may well be effective in individu-
als without the specific genetic variant that led to the discovery of these targets. Perhaps the best example is the development of HMG-CoA reductase inhibitors that effectively lower cholesterol levels in nearly everyone who takes them — except, ironically, in individuals with homozygous absence of LDL-receptors who were instrumental in identifying this key metabolic pathway (83). Even variants with very modest ORs may provide clues to key drug tar-
Table 6GWA studies in cardiovascular conditions and lipid metabolism
Disease/trait Samplesize Region Gene Strongest Riskallele P ORpercopyor Platform Initial Replication SNP-risk frequency forheterozygote manufacturer allele incontrols (95%CI) andSNPsA
QT interval 100 >445 ms 200 >85th pctB 1q23.3 NOS1AP rs10494366-? 0.36 1 × 10⁻¹⁰ 4.9–7.9 (NR)C Affymetrix: prolongation 100 <386 ms 200 <15th pctB 88,500 (115)
Myocardial 1,607 cases 2,980 cases 9p21.3 CDKN2A/B rs10757278-G 0.45 1 × 10–20 1.28 (1.22–1.35) Illumina: infarction (116) 6,728 con 6,041 con 305,953
Coronary disease 1,926 cases See ref. 73 9p21.3 CDKN2A/B rs1333049-C 0.47 1 × 10–13 1.47 (1.27–1.70) Affymetrix: (35) 2,938 con 469,557
Coronary disease 1,926 cases 875 cases 9p21.3 CDKN2A/B rs1333049-C 0.47 3 × 10–19 1.36 (1.27–1.46) Affymetrix: (73) 2,938 con 1,644 con 6q25.1 MTHFD1L rs6922269-A 0.25 3 × 10⁻⁸ 1.23 (1.15–1.33) 377,857 2q36.3 Pseudogene rs2943634-C 0.65 2 × 10⁻⁷ 1.21 (1.13–1.30)
Atrial fibrillation/ 550 cases 3,363 cases 4q25 Intergenic rs2200733-T 0.11D 3 × 10–41 1.72 (1.59–1.86) Illumina: atrial flutter (77) 4,476 con 17,616 con (near PITX2) rs10033464-T 0.08E 7 × 10–11 1.39 (1.26–1.53) 316,515
LDL-cholesterol 1,955 2,033 individ 1p13.3 CELSR2, rs599839-G 0.24 1 × 10⁻⁷ 0.95 (0.93–0.97)G Affymetrix: (117) hypertensive in 519 families; PSRC1 400,496 individ 1,461 twinsF
LDL-cholesterol 2,758 18,554 1p13.3 CELSR2, PSRC1, rs646776-T 0.24 3 × 10–29 0.16 (0.14–0.18)H Affymetrix: (118) studied studied SORT1, 389,878 19p13.11 CILP2, PBX4 rs16996148-G 0.90 3 × 10⁻⁸ 0.10 (0.06–0.14)H
HDL-cholesterol 2,758 18,554 1q42.13 GALNT2 rs4846914-G 0.40 2 × 10–13 0.07 (0.05–0.09)I Affymetrix: (118) studied studied 389,878
Triglycerides 2,758 18,554 7q11.23 BCL7B, TBL2, rs17145738-T 0.87 7 × 10–22 0.14 (0.10–0.18)H Affymetrix: (118) studied studied MLXIPL 389,878 8q24.13 TRIB1 rs17321515-A 0.49 4 × 10–17 0.08 (0.06–0.10)H 1q42.13 GALNT2 rs4846914-G 0.40 7 × 10–15 0.08 (0.06–0.10)H 19p13.11 CILP2, PBX4 rs16996148-G 0.90 4 × 10⁻⁹ 0.10 (0.06–0.14)H 1p31.3 ANGPTL3, rs12130333-C 0.78 2 × 10⁻⁸ 0.11 (0.07–0.15)H DOCK7, ATG4C
Triglycerides 2,011 10,536 7q11.23 MLXIPL rs3812316-C 0.95 1 × 10⁻¹⁰ 10.5 (5.3–17.7)J Perlegen: (119) studied studied 180,410 to 216,774
HDL-cholesterol 8,656 11,399 12q24.11 MVK/MMAB rs2338104-G 0.45 3 × 10⁻⁸ 0.48 (NR)K Illumina and (120) studied studied AffymetrixL
LDL-cholesterol 8,589 7,440–10,783 1p13.3 CELSR2, PSRC1, rs599839-A 0.77 6 × 10–33 5.48 (NR)K Illumina and (120) studied studied SORT1 AffymetrixL 19p13.11 NCAN/CILP2 rs16996148-G 0.89 3 × 10⁻⁹ 3.32 (NR)K 6p21.32 B3GALT4 rs2254287-G 0.38 5 × 10⁻⁸ 1.91 (NR)K
Triglycerides 8,684 5,312–9,707 2p23.3 GCKR rs780094-T 0.39 6 × 10–32 8.59 (NR)K Illumina and (120) studied studied 8q24.13 TRIB1 rs17321515-A 0.56 7 × 10–13 6.42 (NR)K AffymetrixL 7q11.23 MLXIPL rs17145738-C 0.84 2 × 10–12 8.21 (NR)K 1p31.3 ANGPTL3 rs1748195-C 0.70 2 × 10⁻¹⁰ 7.21 (NR)K 19p13.3 NCAN/CILP2 rs16996148-G 0.92 3 × 10⁻⁹ 6.10 (NR)K
Studies, statistics, and platforms are reported as described in Table 2. individ, individuals; pct, percentile; ?, risk allele not indicated. ANumber that passed quality control. BAlso studied were 7,817 cohort members. CDifference (in ms) between homozygotes. DIn European population; allele frequency was 0.53 in Hong Kong population. EIn European population; allele frequency was 0.22 in Hong Kong population. FOne twin selected randomly. GIncrease in mmol. HIncrease in SD. IDecrease in SD. JIncrease in percentage. KIncrease in mg/dl. LAbout 2,261,000 imputed.

science in medicine
1600 TheJournalofClinicalInvestigation http://www.jci.org Volume 118 Number 5 May 2008
gets, as demonstrated by 2 diabetes-related genes. First, the PPARG Pro12Ala variant has an OR of 1.25 for diabetes, but the protein product of this gene is recognized as the receptor for the thiazoli-dinedione class of insulin sensitizers, also referred to as PPARγ agonists (80, 84). Second, variants of the KCNJ11 gene have been associated with diabetes, although with an OR of 1.2, in a variety of GWA and other studies, but KCNJ11 codes for the sulfonylurea receptor, a major target for diabetes drug therapy (82, 85).
Inferences about population genetics from the HapMapAn important use of HapMap data is to test for the presence of population structure, or allele frequency differences related to geo-graphic (and presumably ancestral) differences within and across study populations, even in relatively homogeneous groups, such as the Britons studied in the Wellcome Trust Case Control Con-sortium (WTCCC; ref. 35). Thirteen genomic regions were found to differ significantly among geographic areas of Great Britain once samples of non-European ancestry were omitted (based on estimates of the genetic distance of individual WTCCC samples from the three original HapMap analysis panels, another key use of HapMap data), but this divergence had little impact on the genetic associations identified with the seven common diseases studied by that consortium. Although some geography-based differences may be just the result of population drift or founder effects, they do provide tantalizing clues to possible selection pressures on popula-tions ancestral to those now residing in the United Kingdom (35).
In fact, HapMap data have provided critical evidence in sup-port of recent positive selection, or selection in favor of new alleles, for genes related to response to infectious agents such as malaria, dietary factors such as disaccharides and fatty acids, and pigmentation differences that confer advantages at differ-ent latitudes (86, 87). Such analyses rely on the fact that under strong positive selection, an allele may rise to high frequency so rapidly that associations extend for substantial distances along chromosomes (the long-range haplotype; ref. 88) because there has not been time for them to be broken down by recombina-tion (89). Regions of unusually low diversity suggestive of such selective sweeps have sometimes been detected in three or all four HapMap population samples, but are more commonly found in one or two populations, presumably because of local envi-ronmental selective pressures. They are also easier to detect in a single population by comparison with the other populations (88). Investigation of such loci may yield valuable insight into pathways governing responses to environmental pathogens and other functional effects as yet unsuspected.
HapMap data have also been crucial in facilitating the pooling and comparison of association data across populations, so that differences in ancestral background can now be adjusted for in a continuous fashion without loss of data through exclusion or loss of statistical power through stratification (90). Allele frequency differences in HapMap populations have been used to suggest reasons for differences in associations in individuals of varying
Table 7GWA studies in neuropsychiatric conditions
Disease/trait Samplesize Region Gene Strongest Riskallele P ORpercopyor Platform Initial Replication SNP-risk frequency forheterozygote manufacturer allele incontrols (95%CI) andSNPsA
Sporadic amyotrophic 276 cases NR 10q26.13 Intergenic rs4363506-? NR 7 × 10⁻⁷ 1.90 (1.50–2.40) Illumina: lateral sclerosis 271 con 549,062 (121)
Amyotrophic lateral 737 cases 1,030 cases 7q36.2 DPP6 rs10260404-C 0.35 5 × 10⁻⁸ 1.30 (1.18–1.43) Illumina: sclerosis (122) 721 con 1,195 con 311,946
Multiple sclerosis 931 trios 609 trios 10p15.1 IL2RA rs12722489-C 0.85 3 × 10⁻⁸ 1.25 (1.11–1.36) Affymetrix: (97) 2,431 con 2,322 cases 5p13.2 IL7RA rs6897932-C 0.75 3 × 10⁻⁷ 1.18 (1.11–1.26) 334,923 2,987 con
Restless legs 306 cases 311 cases 6p21.2 BTBD9 rs3923809-A 0.66 1 × 10–17 1.90 (1.50–2.20) Illumina: syndrome (123) 15,664 con 1,895 con 306,937
Restless legs 401 cases 1,158 cases 2p14 MEIS1 rs2300478-G 0.24 3 × 10–28 1.74 (1.57–1.92) Affymetrix: syndrome (124) 1,644 con 1,178 con 6p21.2 BTBD9 rs9296249-T 0.76 4 × 10–18 1.67 (1.49–1.89) 236,758 15q23 MAP2K5, rs12593813-G 0.67 1 × 10–15 1.50 (1.36–1.66) LBXCOR1
APOE*e4carriers 446 cases 415 cases 11q14.1 GAB2 rs2373115-G 0.72 1 × 10⁻¹⁰ 4.06 (2.81–14.69) Affymetrix: with late-onset 290 con 260 con 312,316 Alzheimer disease (125)
Schizophrenia 178 cases NR Xp22.33/Yp11.32 CSF2RA rs4129148-C NR 4 × 10⁻⁷ 3.23 (2.04–5.15)B Affymetrix: (126) 144 con 439,511
Bipolar disorder 461 cases 772 cases 13q14.11 DGKH rs1012053-A 0.83 2 × 10⁻⁸ 1.59 (1.35–1.87) Illumina: (127) 563 con 876 con 555,235C
Bipolar disorder 1,868 cases NR 16p12.1 PALB2, rs420259-A 0.72 6 × 10⁻⁸ 2.08 (1.60–2.71) Affymetrix: (35) 2,938 con NDUFAB1, DCTN5 469,557
Studies, statistics, and platforms are reported as described in Table 2. ?, risk allele not indicated. ANumber that passed quality control. BHomozygote. CPooled genotyping.

science in medicine
TheJournalofClinicalInvestigation http://www.jci.org Volume 118 Number 5 May 2008 1601
geographic origin, often manifest as an association in persons of European ancestry that fails to replicate in other groups, par-ticularly those of more recent African origin (72, 91, 92). Lower LD among SNPs in the HapMap Yoruba population, and in other individuals of recent African ancestry (91), has also been cited as a reason for cross-population differences in associations. Similar comparisons have been possible with Asian populations (72, 92) and have been effective in focusing on more likely causative SNPs affecting all populations.
Key lessons from HapMap applications to common diseaseImportant conclusions from these preliminary successes include the relatively modest effect sizes observed for genetic variants associated with common diseases and the consequent need for very large sample sizes to detect them. Sample sizes for detect-ing and confirming variants related to diabetes, obesity, and breast cancer have been in the many tens of thousands (61, 93, 94). These contrast sharply with the success of early AMD stud-ies, in which only 100–200 cases were needed, but the identified variants conferred a much greater risk of disease (63, 95). Estimates of residual heritability after accounting for the variants found in this first round of analyses suggest that numerous other variants of modest effect, undiscovered struc-tural variants, or less common variants of large effect remain to be found for most of these dis-eases (61, 90, 96). It is important to note that the most robust findings, those that survive multi-ple rounds of replication in an initial study and are subsequently replicated in other studies, are often not the most statistically significant asso-
ciations in the initial GWA scan, and may not even be in the top few hundred associations (70, 97).
Another important lesson from these studies has been that vari-ants in noncoding regions — rather than nonsynonymous cod-ing SNPs, which code for different amino acids in the resulting protein — are likely to be causative in most instances (35). That regulation of the protein products, rather than differences in the structure or function of the protein, may be most important for disease risk was suspected before the advent of the HapMap and GWA studies, but the relative importance of each to disease risk was unknown, demonstrating the value of an agnostic approach to genome-wide interrogation (39, 98).
Continued evolution of HapMap-based researchSeveral studies have shown that tag SNPs chosen on the basis of the data from the four populations included in HapMap phases I and II apply well to other populations (2, 29). Still, to allow better choice of tag SNPs and more detailed analyses for various popula-tions, additional samples were collected from the same four ini-tial HapMap populations and from seven additional populations:
Table 8GWA studies in autoimmune and infectious diseases
Disease/trait Samplesize Region Gene Strongest Riskallele P ORpercopyor Platform Initial Replication SNP-risk frequency forheterozygote manufacturer allele incontrols (95%CI) andSNPsA
Rheumatoid arthritis 1,860 cases NR 7q32.3 Intergenic rs11761231-C 0.62 4 × 10⁻⁷ 1.32 (NR) Affymetrix: (35)B 2,938 con 469,557
Rheumatoid arthritis 1,493 cases 1,053 cases 9q34 TRAF1-C5 rs3761847-G 0.41 1 × 10–14 1.32 (1.23–1.42) Illumina: (128) 1,831 con 1,858 con 297,086
Rheumatoid arthritis 397 cases 2,283 cases 6q23.3 nearTNFAIP3, rs10499194-C 0.71 1 × 10⁻⁹ 1.33 (1.15–1.52) Affymetrix: (129) 1,211 Fram 3,258 con OLIG3 79,853Systemic lupus 720 cases 1,846 cases 16p11.2 ITGAM rs9888739-T 0.13 2 × 10–23 1.62 (1.47–1.78) Illumina: erythematosus 2,337 con 1,825 con 11p15.5 KIAA1542 rs4963128-? 0.34 3 × 10⁻¹⁰ 1.28 (1.18–1.37) 317,501 in women (130) 3p14.3 PXK rs6445975-C 0.28 7 × 10⁻⁹ 1.25 (1.16–1.35) 1q25.1 Intergenic rs10798269-? 0.64 1 × 10⁻⁷ 1.22 (1.14–1.32)
Systemic lupus 279 cases 1,757 cases 4q24 BANK1 rs10516487-G 0.77 4 × 10⁻¹⁰ 1.38 (1.25–1.53) Affymetrix: erythematosus (131) 515 con 1,540 con 85,042
Childhood asthma, 994 cases 2,320 cases 17q21 Intergenic rs7216389-T 0.52 9 × 10–11 1.45 (1.17–1.81) Illumina: ORMDL3 expression 1,243 con 3,501 con 307,328 (103)
HIV-1 viral setpoint 486 patients 140 patients 6p21.33 HCP5 rs2395029-G 0.05 9 × 10–12 –1 (NR)C Illumina: (64) 6p21.33 HLA-C rs9264942-C 0.41 4 × 10⁻⁹ –0.39 (NR)C 535,101
Studies, statistics, and platforms are reported as described in Table 2. Fram, Framingham participants; ?, risk allele not indicated. ANumber that passed quality control. BP value reported is sex differentiated; OR reported for women only. CLog units per copy.
Limitations of HapMap-based GWA studies
Not optimal for assessing disease associations with rare variantsNot optimal for assessing disease associations with structural variants, such as copy number polymorphisms, insertions, deletions, and inversionsRequires very large number of samplesPatterns of genomic variation in populations other than the original HapMap samples may not be optimally described

science in medicine
1602 TheJournalofClinicalInvestigation http://www.jci.org Volume 118 Number 5 May 2008
Luhya in Webuye, Kenya; Maasai in Kinyawa, Kenya; Tuscans in Italy; Gujarati Indians in Houston, Texas; Chinese in metropoli-tan Denver, Colorado; Mexican ancestry in Los Angeles, Califor-nia; and African ancestry in the southwestern United States. These 1,301 extended HapMap samples, now available from the Coriell Institute, have been genotyped on the Affymetrix 6.0 platform and the Illumina 1 million SNP chip, and genome-wide sequencing of these samples will begin soon. As with the initial HapMap samples, these will become a standard research resource for many addition-al studies and will be particularly useful in providing additional information on rare variants.
The GWA studies described above have shown substantial early promise, and new applications of genome-wide technology to well-characterized population samples are continuing. However, impor-tant limitations of GWA studies should be kept in mind, including their lack of statistical power for identifying associations with rare sequence variants, because these are poorly represented on current genotyping platforms, and the need for very large numbers of sam-
ples (see Limitations of HapMap-based GWA studies). The benefits of collaboration across multiple GWA studies for replicating initial associations and developing common methods have been amply demonstrated by the pioneering efforts of the WTCCC study of seven complex diseases and common controls (35). Several other collaborative programs are currently in the pipeline (Table 10).
Data from many of these GWA studies are released to the sci-entific community through the Database of Genotype and Phe-notype (dbGaP) of the National Center for Biotechnology Infor-mation (99). Study descriptions, protocols, data summaries, and other group-level data are available in the open-access portion of the dbGaP website, while individual-level data are provided through a controlled-access process consistent with the informed consent provided by study participants, as described in the recently finalized policy for sharing of data obtained in NIH-supported or -conducted GWA studies (100). This commitment to rapid data release builds on the now well-established ethic in genomic com-munity research projects of maximizing data access.
Table 9GWA studies in various traits
Disease/trait Samplesize Region Gene Strongest Riskallele P ORpercopyor Platform Initial Replication SNP-risk frequency forheterozygote manufacturer allele incontrols (95%CI) andSNPsA
Body mass index 10,657 adults 19,424 adults 16q12.2 FTO rs9939609-A 0.39 2 × 10–20 0.36 (NR)B Affymetrix: (93) 10,172 children ~0.4 (NR)C 490,032
Height (132) 4,921 studied 29,098 studiedD 12q14.3 HMGA2 rs1042725-C 0.51 6 × 10–16 0.4 (NR)E Affymetrix: 364,301
Height (133) 6,669 studied 28,801 studied 20q11.22 BFZB rs6060369-C 0.44 2 × 10–16 0.44 (NR)F Illumina and AffymetrixG
Skin pigmentation 363 maxL* <56H 116 low maxL* 15q21.1 SLC24A5 rs1834640-G 0.30 1 × 10–50 12.5 (8.33–20.0) Perlegen: by reflectance 374 maxL* >63H 115 high maxL* 11q14.3 TYR rs1042602-C 0.90 4 × 10⁻¹⁰ 4.36 (2.64–7.20) 1,502,205I spectroscopy 5p13.3 SLC45A2 rs16891982-C 0.97 3 × 10–11 4.86 (2.88–8.21) (134)
Freckles (135) 2,986 studied 3,932 studied 6p25.3 between rs1540711-A 0.50 2 × 10⁻⁹ 1.40 (1.26–1.57) Illumina: SEC5L1 317,511 and IRF4
Blond vs. brown 2,986 studied 3,932 studied 12q21.33 KITLG rs12821256-C 0.15 2 × 10–14 2.32 (1.86–2.92) Illumina: hair (135) 14q32.12 SLC24A4 rs4904868-C+ 0.60 9 × 10–24 2.56 (2.12–3.09) 317,511 rs2402130-A
Blue vs. green 2,986 studied 3,932 studied 14q32.12 SLC24A4 rs4904868-C+ 0.60 2 × 10–18 2.06 (1.76–2.42) Illumina: eyes (135) rs2402130-A 317,511
F cell distribution 179 adultsJ 90 adults 2p16.1 BCL11A rs1427407-? 0.14 6 × 10–31 13.1% (NR)K Illumina: (136) 6q23.3 Intergenic rs9399137-? 0.23 3 × 10–36 15.8% (NR)K 308,015 11p15.5 XmnI-Gγ NR 0.33 2 × 10–38 10.2% (NR)K
Serum uric acid 4,305 Sardinian 1,301 Tuscan 4p16.1 GLUT9 rs6855911-A 0.74 2 × 10–16 0.32 (NR)L Affymetrix: levels (137) 362,129
Serum urate 1,955 2,033 individ 4p16.1 SLC2A9 rs7442295-A 0.79 2 × 10–15 0.024 Affymetrix: (117) hypertensive in 519 families; (0.018–0.030)N 400,496 individ 1,461 twinsM
Recombination 1,887 men 1,248 men 4p16.3 RNF212 rs3796619-T 0.33P 3 × 10–24 70.7 (84.3–57.1)Q Illumina: rate (138)O 1,702 women 1,663 women 2 × 10–12 88.2 309,241 (63.7–112.7)R
Studies, statistics, and platforms are reported as described in Table 2. individ, individuals; maxL*, maximum reflectance; ?, risk allele not indicated. ANumber that passed quality control. Bkg/m2 per copy in adults. Ckg/m2 per copy in children. DOf which 19,064 were adults. Ecm per copy in adult height. FHeight increase in cm. GAbout 2,261,000 imputed. H20% tails of distribution. IPooled genotyping. JIn upper and lower 5%. KPercent of variance explained. LIncrease in mg/dl. MOne twin selected randomly. NIncrease in mmol/l. OValues for men shown in the top row; values for women shown in the bottom row. PMen and women combined. QDecrease in cM. RIncrease in cM.

science in medicine
TheJournalofClinicalInvestigation http://www.jci.org Volume 118 Number 5 May 2008 1603
Following up on associationsResearch to pursue initial GWA discoveries will include replica-tion studies in the same phenotypes and populations to ensure the robustness of the findings and in similar but not identical phenotypes and populations to extend the findings and increase understanding of their mechanisms and importance (39). Inves-tigation of disease subtypes, such as estrogen receptor–positive versus –negative breast cancer, or young-onset or severely progres-sive forms of prostate cancer or diabetes, may be of great value in identifying the subgroups of alleles conferring the highest risk and the individuals who carry them (101). Sequencing DNA from large numbers of people for the genomic regions showing strong associations with complex traits, guided by HapMap data on LD patterns to identify limits of regions to be sequenced, will be needed to identify rare, potentially causal variants poorly tagged by existing genotyping platforms (102). The recently initi-ated 1,000 Genomes Project will produce light sequence coverage (an average of two sequencing reads at any place in the genome) of about 1,000 individuals that will greatly extend the catalog of human genetic variation and limit follow-up sequencing of specific genotype-phenotype association findings to the search for very rare variants. Fine-mapping of candidate regions with SNPs optimally chosen based on HapMap data to maximize the regional genomic variation captured while minimizing costs will refine association signals and narrow the list of possible functional variants. Functional studies of this smaller list of variants in experimental models such as knockdown and over-expression studies (102) and in examining relationship to gene expression, as recently demonstrated for asthma-associated vari-ants in ORMDL3 (103), will help to determine the mechanisms of gene function and how they are perturbed in disease, provid-ing insights into possible preventive or therapeutic strategies. Finally, translation of these strategies into improved detection or targeting of high-risk individuals (61, 102) or pharmacothera-pies derived directly from knowledge of gene function (82) will be needed if these efforts are ultimately to improve health and reduce disease. Much work remains to be done, but early suc-cesses in genetic risk factor discovery through large-scale GWA
studies appear finally to have unlocked the door to significant improvements in health and clinical care in common complex disease based on genomic knowledge.
ConclusionThe International HapMap Project has been an extensive inter-national collaborative effort in which common objectives were agreed upon and pursued in a highly focused, cooperative approach. Our understanding of haplotype patterns in Homo sapiens continues to evolve, with additional populations being added, additional variants being identified through targeted and genome-wide sequencing, and cellular phenotypes being characterized in transformed and inexhaustible lymphoblas-toid cell lines. Successful GWA studies are the most visible and exciting outcome of HapMap to date, with the large number of robust and highly replicated genetic associations with common diseases providing novel and unexpected insights into the patho-physiology of disease. The HapMap has also been invaluable in developing genotyping and analytic methods, expanding our understanding of evolutionary pressures and natural selection, defining genetic relationships across populations, and provid-ing samples for validation of variation detection methods and standardization of laboratory processes. Application of these association findings is expected to produce new advances in the prevention and treatment of common diseases.
Note added in proof. Updated information on GWA studies and SNP associations is available online (139).
AcknowledgmentsThe authors express their sincere appreciation to Mia Diggs, Lucia Hindorff, Heather Junkins, Darryl Leja, and Lisa McNeil for assis-tance in preparation of the manuscript.
Address correspondence to: Teri Manolio, National Human Genome Research Institute, 31 Center Drive, Room 4B-09, Bethesda, Maryland 20892-2154, USA. Phone: (301) 402-2915; Fax: (301) 402-0837; E-mail: [email protected].
Table 10Phenotypes under investigation in collaborative GWA studies
GAINA GEIB STAMPEEDC CGEMSD
Attention deficit hyperactivity disorder Type 2 diabetes Early-onset myocardial infarction Prostate cancerMajor depressive disorder Maternal metabolism and birth weight Asthma Breast cancerBipolar I disorder Preterm birth Platelet phenotypes Pancreatic cancerSchizophrenia Oral clefts CHD and other heart, lung and blood disorders Lung cancerType I diabetic nephropathy Dental caries Childhood respiratory outcomes Bladder cancerPsoriasis Coronary disease Hematopoietic cell transplant outcome Renal cancer Lung cancer Arteriosclerosis in hypertensives Addiction Asthma and lung function Cardiovascular risk factors Atherosclerosis pathway genes CV events Early coronary artery disease Phenotypic variability in sickle cell anemia Centenarians
CHD, coronary heart disease; CV, cardiovascular. AGenetic Association Information Network (http://www.fnih.org/GAIN2/home_new.shtml). BGenes, Environment, and Health Initiative (http://www.gei.nih.gov/). CSNP Typing for Association with Multiple Phenotypes from Existing Epidemiologic Data (http://public.nhlbi.nih.gov/GeneticsGenomics/home/stampeed.aspx). DCancer Genetic Markers of Susceptibility (http://cgems.cancer.gov/).
science in medicine
1604 TheJournalofClinicalInvestigation http://www.jci.org Volume 118 Number 5 May 2008
1. International HapMap Consortium. 2005. A haplotype map of the human genome. Nature. 437:1299–1320.
2. International HapMap Consortium. 2007. A sec-ond generation human haplotype map of over 3.1 million SNPs. Nature. 449:851–861.
3. International HapMap Consortium. 2003. The Inter-national HapMap Project. Nature. 426:789–794.
4. International Human Genome Sequencing Con-sortium. 2001. Initial sequencing and analysis of the human genome. Nature. 409:860–921.
5. International Human Genome Sequencing Con-sortium. 2004. Finishing the euchromatic sequence of the human genome. Nature. 431:931–945.
6. Hirschhorn, J.N., and Daly, M.J. 2005. Genome-wide association studies for common diseases and complex traits. Nat. Rev. Genet. 6:98–108.
7. Chakravarti, A., and Little, P. 2003. Nature, nur-ture, and human disease. Nature. 421:412–414.
8. Guttmacher, A.E., Collins, F.S., and Carmona, R.H. 2004. The family history — more important than ever. N. Engl. J. Med. 351:2333–2336.
9. Manolio, T.A., and Collins, F.S. 2007. Genes, envi-ronment, health, and disease: facing up to com-plexity. Hum. Hered. 63:63–66.
10. Reich, D.E., and Lander, E.S. 2001. On the allel-ic spectrum of human disease. Trends Genet. 17:502–510.
11. Lander, E.S. 1996. The new genomics: global views of biology. Science. 274:536–539.
12. Collins, F.S., Guyer, M.S., and Chakravarti, A. 1997. Variations on a theme: cataloging human DNA sequence variation. Science. 278:1580–1581.
13. Harris, R.F. 2002. Hapmap flap. Curr .Biol. 12:R827. 14. Pritchard, J.K., and Cox, N.J. 2002. The allelic
architecture of human disease genes: common disease-common variant...or not? Hum. Mol. Genet. 11:2417–2423.
15. van den Oord, E.J., and Neale, B.M. 2004. Will haplotype maps be useful for finding genes? Mol. Psychiatry. 9:227–236.
16. Terwilliger, J.D., and Hiekkalinna, T. 2006. An utter refutation of the “Fundamental Theorem of the HapMap.” Eur. J. Hum. Genet. 14:426–437.
17. Sachidanandam, R., et al. 2001. International SNP Map Working Group. A map of human genome sequence variation containing 1.42 million single nucleotide polymorphisms. Nature. 409:928–933.
18. Gabriel, S.B., et al. 2002. The structure of hap-lotype blocks in the human genome. Science. 296:2225–2229.
19. McVean, G.A., et al. 2004. The fine-scale structure of recombination rate variation in the human genome. Science. 304:581–584.
20. Christensen, K., and Murray, J.C. 2007. What genome-wide association studies can do for medi-cine. N. Engl. J. Med. 356:1094–1097.
21. Paabo, S. 2003. The mosaic that is our genome. Nature. 421:409–412.
22. Hinds, D.A., et al. 2005. Whole-genome patterns of common DNA variation in three human popula-tions. Science. 307:1072–1079.
23. Eberle, M.A., et al. 2007. Power to detect risk alleles using genome-wide tag SNP panels. PLoS Genet. 3:1827–1837.
24. International HapMap Consortium. 2004. Inte-grating ethics and science in the International HapMap Project. Nat. Rev. Genet. 5:467–475.
25. Rotimi, C., et al. 2007. Community engagement and informed consent in the International Hap-Map project. Community Genet. 10:186–198.
26. Coriell Institute for Medical Research, et al. Inter-national HapMap Project. http://locus.umdnj.edu/Sections/Collections/NHGRI/hapmap.aspx?PgId=266&coll=HG.
27. International HapMap Project website. http://www.hapmap.org.
28. NCBI Reference Assembly. Single nucleotide poly-
morphism. http://www.ncbi.nlm.nih.gov/projects/SNP/.
29. deBakker, P.I., et al. 2006. Transferability of tag SNPs in genetic association studies in multiple populations. Nat. Genet. 38:1298–1303.
30. The NHGRI Sample Repository for Human Genetic Research. http://ccr.coriell.org/Sections/ Collections/NHGRI/Default.aspx?SsId=11.
31. Syvänen, A.C. 2005. Toward genome-wide SNP genotyping. Nat. Genet. 37:S5–S10.
32. Steemers, F.J., et al. 2006. Whole-genome genotyp-ing with the single-base extension assay. Nat. Meth-ods. 3:31–33.
33. Matsuzaki, H., et al. 2004. Parallel genotyping of over 10,000 SNPs using a one-primer assay on a high-density oligonucleotide array. Genome Res. 14:414–425.
34. Matsuzaki, H., et al. 2004. Genotyping over 100,000 SNPs on a pair of oligonucleotide arrays. Nat. Meth-ods. 1:109–111.
35. Wellcome Trust Case Control Consortium. 2007. Genome-wide association study of 14,000 cases of seven common diseases and 3,000 shared controls. Nature. 447:661–678.
36. Moskvina, V., Craddock, N., Holmans, P., Owen, M.J., and O’Donovan, M.C. 2006. Effects of dif-ferential genotyping error rate on the type I error probability of case-control studies. Hum. Hered. 61:55–64.
37. Mitchell, A.A., Cutler, D.J., and Chakravarti, A. 2003. Undetected genotyping errors cause appar-ent overtransmission of common alleles in the transmission/disequilibrium test. Am. J. Hum. Genet. 72:598–610.
38. Manolio, T.A., et al. 2007. New models of collabo-ration in genome-wide association studies: the Genetic Association Information Network. Nat. Genet. 39:1045–1051.
39. Chanock, S.J., et al. 2007. Replicating genotype-phenotype associations. Nature. 447:655–660.
40. Yang, Q., Cui, J., Chazaro, I., Cupples, L.A., and Demissie, S. 2005. Power and type I error rate of false discovery rate approaches in genome-wide association studies. BMC Genet. 6:S134.
41. University of Michigan Center for Statistical Genetics. CaTS — power calculator for two stage association studies. http://www.sph.umich.edu/csg/abecasis/CaTS/.
42. Rubinsztein, D.C., and Easton, D.F. 1999. Apolipoprotein E genetic variation and Alzheim-er’s disease. a meta-analysis. Dement. Geriatr. Cogn. Disord. 10:199–209.
43. Sidney, S., et al. 2004. Venous thromboembolic disease in users of low-estrogen combined estro-gen-progestin oral contraceptives. Contraception. 70:3–10.
44. Wang, W.Y., Barratt, B.J., Clayton, D.G., and Todd, J.A. 2005. Genome-wide association studies: theo-retical and practical concerns. Nat. Rev. Genet. 6:109–118.
45. Tuzun, E., et al. 2005. Fine-scale structural variation of the human genome. Nat. Genet. 37:727–732.
46. Komura, D., et al. 2006. Genome-wide detection of human copy number variations using high-density DNA oligonucleotide arrays. Genome Res. 16:1575–1584.
47. Feuk, L., Marshall, C.R., Wintle, R.F., and Scherer, S.W. 2006. Structural variants: changing the land-scape of chromosomes and design of disease stud-ies. Hum. Mol. Genet. 15:R57–R66.
48. Hinds, D.A., Kloek, A.P., Jen, M., Chen, X., and Fra-zer, K.A. 2006. Common deletions and SNPs are in linkage disequilibrium in the human genome. Nat. Genet. 38:82–85.
49. Cheung, V.G., et al. 2005. Mapping determinants of human gene expression by regional and genome-wide association. Nature. 437:1365–1369.
50. Stranger, B.E., et al. 2007. Relative impact of nucle-
otide and copy number variation on gene expres-sion phenotypes. Science. 315:848–853.
51. Hinds, D.A., et al. 2005. Whole-genome patterns of common DNA variation in three human popula-tions. Science. 307:1072–1079.
52. McCarroll, S.A., and Altshuler, D.M. 2007. Copy-number variation and association studies of human disease. Nat. Genet. 39(7 Suppl.):S37–S42.
53. Steemers, F.J., and Gunderson, K.L. 2007. Whole genome genotyping technologies on the BeadAr-ray platform. Biotechnol. J. 2:41–49.
54. Redon, R., et al. 2006. Global variation in copy num-ber in the human genome. Nature. 444:444–454.
55. Estivill, X., and Armengol, L. 2007. Copy number variants and common disorders: filling the gaps and exploring complexity in genome-wide associa-tion studies. PLoS Genet. 3:1787–1799.
56. Wacholder, S., Chanock, S., Garcia-Closas, M., El Ghormli, L., and Rothman, N. 2004. Assess-ing the probability that a positive report is false: an approach for molecular epidemiology studies. J. Natl. Cancer. Inst. 96:434–442.
57. Van Steen, K., et al. 2005. Genomic screening and replication using the same data set in family-based association testing. Nat. Genet. 37:683–691.
58. Mutsuddi, M., et al. 2006. Analysis of high-resolu-tion HapMap of DTNBP1 (Dysbindin) suggests no consistency between reported common variant associations and schizophrenia. Am. J. Hum. Genet. 79:903–909.
59. Pritchard, J.K., Stephens, M., and Donnelly, P. 2000. Inference of population structure using multilocus genotype data. Genetics. 155:945–959.
60. Patterson, N., Price, A.L., and Reich, D. 2006. Popula-tion structure and eigenanalysis. PLoS Genet. 2:e190.
61. Scott, L.J., et al. 2007. A genome-wide association study of type 2 diabetes in Finns detects multiple susceptibility variants. Science. 316:1341–1345.
62. Rioux, J.D., et al. 2007. Genome-wide association study identifies new susceptibility loci for Crohn disease and implicates autophagy in disease patho-genesis. Nat. Genet. 39:596–604.
63. Klein, R.J., et al. 2005. Complement factor H poly-morphism in age-related macular degeneration. Science. 308:385–389.
64. Fellay, J., et al. 2007. A whole-genome association study of major determinants for host control of HIV-1. Science. 317:944–947.
65. Thorleifsson, G., et al. 2007. Common sequence variants in the LOXL1 gene confer susceptibility to exfoliation glaucoma. Science. 317:1397–1400.
66. Gudmundsson, J., et al. 2007. Genome-wide associ-ation study identifies a second prostate cancer sus-ceptibility variant at 8q24. Nat. Genet. 39:631–637.
67. Yeager, M., et al. 2007. Genome-wide association study of prostate cancer identifies a second risk locus at 8q24. Nat. Genet. 39:645–649.
68. Libioulle, C., et al. 2007. Novel Crohn disease locus identified by genome-wide association maps to a gene desert on 5p13.1 and modulates expression of PTGER4. PLoS Genet. 3:e58.
69. Hunter, D.J., and Kraft, P. 2007. Drinking from the fire hose — statistical issues in genomewide asso-ciation studies. N. Engl. J. Med. 357:436–439.
70. Hunter, D.J., et al. 2007. A genome-wide associa-tion study identifies alleles in FGFR2 associated with risk of sporadic postmenopausal breast can-cer. Nat. Genet. 39:870–874.
71. Zanke, B.W., et al. 2007. Genome-wide association scan identifies a colorectal cancer susceptibility locus on chromosome 8q24. Nat. Genet. 39:989–994.
72. McPherson, R., et al. 2007. A common allele on chromosome 9 associated with coronary heart dis-ease. Science. 316:1488–1491.
73. Samani, N.J., et al. 2007. Genomewide association analysis of coronary artery disease. N. Engl. J. Med. 357:443–453.
74. Zeggini, E., et al. 2007. Replication of genome-wide

science in medicine
TheJournalofClinicalInvestigation http://www.jci.org Volume 118 Number 5 May 2008 1605
association signals in UK samples reveals risk loci for type 2 diabetes. Science. 316:1336–1341.
75. Melzer, D., et al. 2007. A common variant of the p16(INK4a) genetic region is associated with physical function in older people. Mech. Ageing Dev. 128:370–377.
76. Kim, W.Y., and Sharpless, N.E. 2006. The regu-lation of INK4/ARF in cancer and aging. Cell. 127:265–275.
77. Gudbjartsson, D.F., et al. 2007. Variants conferring risk of atrial fibrillation on chromosome 4q25. Nature. 448:353–357.
78. Sladek, R., et al. 2007. A genome-wide association study identifies novel risk loci for type 2 diabetes. Nature. 445:881–885.
79. Chamberlain, M., Baird, P., Dirani, M., and Guy-mer, R. 2006. Unraveling a complex genetic disease: age-related macular degeneration. Surv. Ophthalmol. 51:576–586.
80. Florez, J.C., et al. 2007. Effects of the type 2 diabe-tes-associated PPARG P12A polymorphism on pro-gression to diabetes and response to troglitazone. J. Clin. Endocrinol. Metab. 92:1502–1509.
81. Schaumberg, D.A., Hankinson, S.E., Guo, Q., Rimm, E., and Hunter, D.J. 2007. A prospective study of 2 major age-related macular degeneration susceptibility alleles and interactions with modifi-able risk factors. Arch. Ophthalmol. 125:55–62.
82. Grant, S.F., and Hakonarson, H. 2007. Recent development in pharmacogenomics: from candi-date genes to genome-wide association studies. Expert Rev. Mol. Diagn. 7:371–393.
83. Uauy, R., Vega, G.L., Grundy, S.M., and Bilheimer, D.M. 1988. Lovastatin therapy in receptor-negative homozygous familial hypercholesterolemia: lack of effect on low-density lipoprotein concentrations or turnover. J. Pediatr. 113:387–392.
84. Colca, J.R. 2007. Future directions for insulin sen-sitizers in disease prevention. Curr. Opin. Investig. Drugs. 8:707–710.
85. McCarthy, M.I. 2004. Progress in defining the molecular basis of type 2 diabetes mellitus through susceptibility-gene identification. Hum. Mol. Genet. 1:R33–R41.
86. Voight, B.F., Kudaravalli, S., Wen, X., and Pritchard, J.K. 2006. A map of recent positive selection in the human genome. PLoS Biol. 4:e72.
87. Nielsen, R., Hellmann, I., Hubisz, M., Bustamante, C., and Clark, A.G. 2007. Recent and ongoing selection in the human genome. Nat. Rev. Genet. 8:857–868.
88. Sabeti, P.C., et al. 2002. Detecting recent positive selection in the human genome from haplotype structure. Nature. 419:832–837.
89. Sabeti, P.C., et al. 2007. Genome-wide detection and characterization of positive selection in human populations. Nature. 449:913–918.
90. Saxena, R., et al. 2007. Genome-wide association analysis identifies loci for type 2 diabetes and tri-glyceride levels. Science. 316:1331–1336.
91. Scuteri, A., et al. 2007. Genome-wide association scan shows genetic variants in the FTO gene are associated with obesity-related traits. PLoS Genet. 3:e115.
92. Stacey, S.N., et al. 2007. Common variants on chro-mosomes 2q35 and 16q12 confer susceptibility to estrogen receptor-positive breast cancer. Nat. Genet. 39:865–869.
93. Frayling, T.M., et al. 2007. A common variant in the FTO gene is associated with body mass index and predisposes to childhood and adult obesity. Science. 316:889–894.
94. Easton, D.F., et al. 2007. Genome-wide association study identifies novel breast cancer susceptibility loci. Nature. 447:1087–1093.
95. Dewan, A., et al. 2006. HTRA1 promoter polymor-phism in wet age-related macular degeneration.
Science. 314:989–992. 96. Duerr, R.H., et al. 2006. A genome-wide association
study identifies IL23R as an inflammatory bowel disease gene. Science. 314:1461–1463.
97. Hafler, D.A., et al. 2007. Risk alleles for multiple sclerosis identified by a genomewide study. N. Engl. J. Med. 357:851–862.
98. Botstein, D., and Risch, N. 2003. Discovering gen-otypes underlying human phenotypes: past suc-cesses for mendelian disease, future approaches for complex disease. Nat. Genet. 33:228–237.
99. Mailman, M.D., et al. 2007. The NCBI dbGaP database of genotypes and phenotypes. Nat. Genet. 39:1181–1186.
100. NIH. 2007. Policy for sharing of data obtained in NIH supported or conducted genome-wide asso-ciation studies (GWAS). http://grants.nih.gov/grants/guide/notice-files/NOT-OD-07-088.html.
101. Haiman, C.A., et al. 2007. Multiple regions within 8q24 independently affect risk for prostate cancer. Nat. Genet. 39:638–644.
102. Frayling, T.M., and McCarthy, M.I. 2007. Genetic studies of diabetes following the advent of the genome-wide association study: where do we go from here? Diabetologia. 50:2229–2233.
103. Moffatt, M.F., et al. 2007. Genetic variants regulat-ing ORMDL3 expression contribute to the risk of childhood asthma. Nature. 448:470–473.
104. Human (Homo sapiens) Genome Browser Gateway. http://genome.ucsc.edu/cgi-bin/hgGateway.
105. Todd, J.A., et al. 2007. Robust associations of four new chromosome regions from genome-wide anal-yses of type 1 diabetes. Nat. Genet. 39:857–864.
106. Hakonarson, H., et al. 2007. A genome-wide asso-ciation study identifies KIAA0350 as a type 1 dia-betes gene. Nature. 448:591–594.
107. Steinthorsdottir, V., et al. 2007. A variant in CDKAL1 influences insulin response and risk of type 2 diabetes. Nat. Genet. 39:770–775.
108. Gudmundsson, J., et al. 2007. Two variants on chromosome 17 confer prostate cancer risk, and the one in TCF2 protects against type 2 diabetes. Nat. Genet. 39:977–983.
109. Tomlinson, I., et al. 2007. A genome-wide asso-ciation scan of tag SNPs identifies a susceptibility variant for colorectal cancer at 8q24.21. Nat. Genet. 39:984–988.
110. Broderick, P., et al. 2007. A genome-wide associa-tion study shows that common alleles of SMAD7 influence colorectal cancer risk. Nat. Genet. 39:1315–1317.
111. Parkes, M., et al. 2007. Sequence variants in the autophagy gene IRGM and multiple other replicat-ing loci contribute to Crohn’s disease susceptibil-ity. Nat. Genet. 39:830–832.
112. Raelson, J.V., et al. 2007. Genome-wide association study for Crohn’s disease in the Quebec Founder Population identifies multiple validated disease loci. Proc. Natl. Acad. Sci. U. S. A. 104:14747–14752.
113. van Heel, D.A., et al. 2007. A genome-wide associa-tion study for celiac disease identifies risk variants in the region harboring IL2 and IL21. Nat. Genet. 39:827–829.
114. Buch, S., et al. 2007. A genome-wide association scan identifies the hepatic cholesterol transporter ABCG8 as a susceptibility factor for human gall-stone disease. Nat. Genet. 39:995–999.
115. Arking, D.E., et al. 2006. A common genetic variant in the NOS1 regulator NOS1AP modulates cardiac repolarization. Nat. Genet. 38:644–651.
116. Helgadottir, A., et al. 2007. A common variant on chromosome 9p21 affects the risk of myocardial infarction. Science. 316:1491–1493.
117. Wallace, C., et al. 2008. Genome-wide association study identifies genes for biomarkers of cardiovas-cular disease: serum urate and dyslipidemia. Am. J.
Hum. Genet. 82:139–149. 118. Kathiresan, S., et al. 2008. Six new loci associated
with blood low-density lipoprotein cholesterol, high-density lipoprotein cholesterol or triglycerides in humans. Nat. Genet. 40:189–197.
119. Kooner, J.S., et al. 2008. Genome-wide scan identi-fies variation in MLXIPL associated with plasma triglycerides. Nat. Genet. 2008. 40:149–151.
120. Willer, C.J., et al. 2008. Newly identified loci that influence lipid concentrations and risk of coronary artery disease. Nat. Genet. 40:161–169.
121. Schymick, J.C., et al. 2007. Genome-wide genotyp-ing in amyotrophic lateral sclerosis and neurologi-cally normal controls: first stage analysis and pub-lic release of data. Lancet Neurol. 6:322–328.
122. van Es, M.A., et al. 2008. Genetic variation in DPP6 is associated with susceptibility to amyotrophic lateral sclerosis. Nat. Genet. 40:29–31.
123. Stefansson, H., et al. 2007. A genetic risk factor for periodic limb movements in sleep. N. Engl. J. Med. 357:639–647.
124. Winkelmann, J., et al. 2007. Genome-wide associa-tion study of restless legs syndrome identifies com-mon variants in three genomic regions. Nat. Genet. 39:1000–1006.
125. Reiman, E.M., et al. 2007. GAB2 alleles modify Alzheimer’s risk in APOE epsilon4 carriers. Neuron. 54:713–720.
126. Lencz, T., et al. 2007. Converging evidence for a pseudoautosomal cytokine receptor gene locus in schizophrenia. Mol. Psychiatry. 12:572–580.
127. Baum, A.E., et al. 2008. A genome-wide association study implicates diacylglycerol kinase eta (DGKH) and several other genes in the etiology of bipolar disorder. Mol. Psychiatry. 13:197–207.
128. Plenge, R.M., et al. 2007. TRAF1-C5 as a risk locus for rheumatoid arthritis — a genomewide study. N. Engl. J. Med. 357:1199–1209.
129. Plenge, R.M., et al. 2007. Two independent alleles at 6q23 associated with risk of rheumatoid arthritis. Nat. Genet. 39:1477–1482.
130. International Consortium for Systemic Lupus Erythematosus Genetics (SLEGEN), et al. 2008. Genome-wide association scan in women with sys-temic lupus erythematosus identifies susceptibility variants in ITGAM, PXK, KIAA1542 and other loci. Nat. Genet. 40:204–210.
131. Kozyrev, S.V., et al. 2008. Functional variants in the B-cell gene BANK1 are associated with systemic lupus erythematosus. Nat. Genet. 40:211–216.
132. Weedon, M.N., et al. 2007. A common variant of HMGA2 is associated with adult and childhood height in the general population. Nat. Genet. 39:1245–1250.
133. Sanna, S., et al. 2008. Common variants in the GDF5-UQCC region are associated with variation in human height. Nat. Genet. 40:198–203.
134. Stokowski, R.P., et al. 2007. A genomewide associa-tion study of skin pigmentation in a South Asian population. Am. J. Hum. Genet. 81:1119–1132.
135. Sulem, P., et al. 2007. Genetic determinants of hair, eye and skin pigmentation in Europeans. Nat. Genet. 39:1443–1452.
136. Menzel, S., et al. 2007. A QTL influencing F cell production maps to a gene encoding a zinc-fin-ger protein on chromosome 2p15. Nat. Genet. 39:1197–1199.
137. Li, S., et al. 2007. The GLUT9 gene is associated with serum uric acid levels in Sardinia and Chianti cohorts. PLoS Genet. 3:e194.
138. Kong, A., et al. 2008. Sequence variants in the RNF212 gene associate with genome-wide recom-bination rate. Science. 319:1398–1401.
139. National Human Genome Research Institute. A catalog of published genome-wide association studies. http://www.genome.gov/GWAstudies/.