a heat transfer model for high titania slag blocks
TRANSCRIPT

A HEAT TRANSFER MODEL FOR HIGH TITANIA SLAG BLOCKS 17
IntroductionTitania slag—the primary product from ilmenite smelting—is tapped directly from the furnace into typically 20 tonnecast steel pots (moulds). Following several hours of coolingin these pots, the titania slag blocks are tipped out tocontinue cooling under water sprays, air or a combinationof water and air. The storage area designated for the coolingslag blocks (known as the block yard) is a notoriouslydangerous area due to as yet unexplained explosions ofblocks which still have liquid cores. Knowledge of thesolidification rate of a typical slag block, and understandingof the factors which determine solidification, can providefundamental background information when conducting aninvestigation into such explosions and formulation ofsubsequent preventative actions.
This paper gives an overview of the assumptions,material properties and boundary conditions used in theconstruction of a heat transfer model for a typical titaniaslag block. Calibration of the model was conducted byfitting the internal slag block temperatures as predicted bythe model, to actual internal temperature measurements byadjusting the thermal heat conduction value of the slag.Verification of the model is also discussed in brief. Thepaper concludes with an expression giving the thickness ofthe block shell as a function of time and a discussion of theparameters controlling the cooling rate.
Model formulationThe primary requirement from the block cooling model wasthat it should be able to calculate the temperature profile ofa slag block as a function of time for a cooling cycleconsisting of primary cooling within the slag pot (andambient air), followed by water and/or air cooling of thestandalone block. With the block mass as input parameterinto the cooling model, it was capable of accommodatingboth the approximately 1.5 tonne blocks which were cast
during the pilot plant campaigns, as well as the 18 tonneblocks typical of a large-scale ilmenite smelting operation.Additional input parameters included the tap temperature,slag chemistry (represented by the %FeO), and durationsand sequence of the various cooling environments, i.e. potcooling, air cooling and water cooling.
The following paragraphs describe the approach taken toconstruct the cooling model.
Simplifications
The pot shell is level with the upper surface of the block.This is a valid assumption when the pot is filled up tocapacity. For smaller taps the pot edge will extend abovethe block surface providing a fin for heat transfer.
The pot consists of a shell only, i.e. no provision is madein the cooling model for trunnions and feet. The additionalmass and feet of the pot adds only slightly to the heatextraction capacity of the pot.
Given that conduction through the solidified solid slagshell is rate determining, the exclusion of the above detailwill not alter the results of the slag block cooling results.
The slag density was assumed to be constant at 3.8 t/m3.Closer to the horizontal (flat) surface of the block theinternal structure typically contains gas pores, which resultsin a less dense material when compared with the bulk of theblock which has a solid appearance. This, combined withdecrepitation occurring on the upper horizontal surface ofthe block during primary cooling, notably affects theaccuracy of heat transfer predictions. However, in theabsence of a detailed model of liquid flow and solidificationshrinkage within the block during solidification, this effectwas not taken into account.
The three-dimensional block was reduced to a two-dimensional wedge-shaped slice from the slag block, asdepicted in Figure 1.
KOTZE, H. and PISTORIUS, P.C. A heat transfer model for high titania slag blocks. The 7th International Heavy Minerals Conference ‘What next’, TheSouthern African Institute of Mining and Metallurgy, 2009.
A heat transfer model for high titania slag blocks
H. KOTZE* and P.C. PISTORIUS†
*Consensi Consulting CC, Mthunzini, South Africa†Carnegie Mellon University, Pittsburgh, USA
Titania slag is used as feedstock in the production of titanium dioxide pigment. It (titania slag) isthe product of ilmenite smelting, a process whereby ilmenite is reduced at high temperatureutilization anthracite as reducing agent. Although various slag tapping configurations areemployed throughout the ilmenite smelting industry, the method of tapping the slag from thefurnace into bell shaped cast steel pots, was the subject of investigation in this study.
The paper describes the formulation of a cooling model used to calculate and subsequentlypredict the temperature profile of a slag block during its cooling within the various coolingenvironments of pot cooling, air cooling and water cooling. The model was calibrated againstactual internal slag temperature measurements and verified with information obtained from bothpilot and industrial scale blocks. The paper concludes with solidification results and their practicalimplication.

HEAVY MINERALS 200918
Energy balanceThe primary partial differential equation to solve was (allsymbols are defined at the end):
[1]
A finite element model was constructed by Dr JohanZietsman from Ex Mente* (a process modelling company)utilizing FlexPDE version 5.0.13, a fully integrated partialdifferentiation equation solver**. The full modelspecification and all the inputs (such as slag properties,calculation procedure for heat transfer coefficients and potdimensions) were provided by the authors while DrZietsman performed the actual coding of the model withinFlexPDE.
From the shape dimensional parameters provided asinput, FlexPDE generates a mesh of triangular nodes (anexample of which is given in Figure 2). With the allowableerror set at 0.1%, FlexPDE adapted the mesh subsequent toconsistency checks over the solutions of the partialdifferential equations. When required the node size and/ortime step is reduced. A separate balance was performed totest that the overall energy balance closed.
To accommodate the change in the boundary conditions(from cooling of the combined slag block and pot systeminitially, to cooling of a slag block alone once the block istipped out of the pot), two FlexPDE code files wereconstructed. The first file provided for a volume consisting
of two materials (the block and pot) each with its ownmaterial properties. In this instance heat transfer from thepot and horizontal block surface to the surroundings was bynatural air cooling. The second file was for the block on itsown. Heat transfer to the surroundings could be selected aseither natural air cooling or water cooling. Data transferfrom the first to the second file was established through theTRANSFER statement of FlexPDE. This statement enablesfull data sharing between different FlexPDE runs. Theboundary conditions for both these stages are discussedlater.
Material properties
Slag thermodynamic propertiesThe liquidus and solidus temperatures of the slag, and thechange in enthalpy of the slag with temperature, wereestimated by means of FactSage1, and approximated withsimple mathematical relationships (based on the FeOcontent of the slag as the independent variable). Theprocedure followed is outlined below.
Choice of slag compositions
A database of 112 full plant slag analyses was obtained(elemental composition determined by X-ray fluorescence,and Ti3+ by titration) as are shown in Figure 3. The masspercentages of the other components varied approximatelylinearly with FeO content, for FeO levels ranging from justabove 6% to more than 18%. These analyses were groupedtogether by FeO content, and an average analysis per FeOrange was obtained (a valid approach, given theapproximately linear variation of slag analysis with FeOcontent). These average analyses are listed in Table I. Notethat these analyses are normalized to 100%; small amountsof other impurities (K2O, V2O3, Nb2O3 and ZrO2) makingup less than 1% of the slag are hence neglected.
*See www.ex-mente.co.za**See www.pdesolutions.com
Figure 1. A two dimensional slice from the block illustrating theimportant shape notations
Figure 2. Example of the mesh configuration for the slag block (Zand R are in metres). Areas of denser node configurations are
shown where FlexPDE reduced the node size to remain within theaccuracy tolerance of 0.1%
φ
φ
θ

A HEAT TRANSFER MODEL FOR HIGH TITANIA SLAG BLOCKS 19
Thermodynamic propertiesFactSage was used to predict the changes in phasecomposition and enthalpy with temperature, for each of theeight slag compositions. The following phases (from the‘FT oxid’ database of FactSage were considered):
• Solutions: SlagA, pseudobrookite (karrooite), Ca3Ti2O7Ca3Ti2O6 and perovskite, and
• Stoichiometric solid phases: all relevant oxides, exceptthe TinO2n-1 Magnéli phases.
In addition to suppression of the Magnéli phases, ilmeniteand spinel solid solutions were also not considered. Thiswas done to ensure stability of pseudobrookite down toroom temperature (which is in line with the observedpersistence of pseudobrookite in the actual solidified slag).
Typical changes in the liquid fraction and enthalpy forone of the slags (no. 4 in Table I) are given in Figure 4. Thecontinuous curves give the temperature dependence aspredicted by FactSage. This shows a sharp decrease inliquid fraction just below the liquidus, with a tail extendingto lower temperatures. For the purpose of the model, alinear approximation of this relationship was developed,matching the calculated profile at the liquidus temperatureand at 20% solidification (indicated by T20 in the figure).The effective solidus temperature (‘Tsolidus’ in Figure 4) wasfound by extending the linear relationship to zero liquid.
A linear enthalpy relationship was similarly used asmodel input. This matched the calculated enthalpy at theliquidus temperatures, and in the fully liquid region (whereFactSage reports a constant heat capacity). In the solidregion, the linear relationship matched the calculated trend
at 298 K and at 1373 K (1373 K is just below the generallyobserved true solidus); all enthalpies were expressedrelative to that of the solid at 298 K. The estimated solidenthalpy at the extrapolated solidus temperature, ‘Tsolidus’,was found by extrapolating this 298 K—1373 K linearrelationship for the solidified slag; the enthalpy was alsoassumed to change linearly (between that of the solid slagand that of the liquid slag) over the temperature range‘Tsolidus’—Tliquidus.
The linear approximations are given in Table II, while thefitted relationships are given in the following equations (alltemperatures in °C, heat capacity in J/kg/K and enthalpy inJ/kg):
[2]
[3]
[4]
[5]
[6]
[7]
The thermal conductivity of the slag was derived usingactual slag internal temperatures as is discussed in thesection on model calibration.
No. FeO % Ti2O3 % TiO2 % MnO % Al2O3 % SiO2 % MgO % Cr2O3 % CaO %
1 6.86 38.05 49.09 2.00 1.48 1.26 0.99 0.14 0.132 8.05 34.21 51.75 2.01 1.42 1.33 0.97 0.15 0.123 8.85 33.09 52.34 1.94 1.31 1.27 0.95 0.15 0.114 9.71 31.28 53.38 1.96 1.21 1.29 0.93 0.15 0.105 10.85 30.28 53.33 1.95 1.17 1.25 0.92 0.16 0.105 12.14 28.93 53.69 1.83 1.18 1.07 0.91 0.16 0.097 13.89 24.51 56.59 1.78 1.16 0.93 0.88 0.16 0.098 17.98 18.83 58.55 1.76 1.02 0.79 0.83 0.16 0.08
Figure 3. Analyses (mass%) of industrial plant slags
Table IAverage compositions (mass percentage) of eight groups of slags from the full plant dataset; each group spans a specific range
of FeO contents
(%FeO)
Mas
s p
erce
nta
ges
Mas
s p
erce
nta
ges

HEAVY MINERALS 200920
Pot thermodynamic propertiesThe heat capacity of the cast steel pot was assumed to beconstant at 465 W/kg˚C 2, while the thermal conductivity ofthe pot was expressed as a function of temperature as isshown in Equation [8]. Both these values are representativeof a 0.5%C steel.
[8]
Boundary conditions
Contact resistances
Contact coefficient between the block and pot surfaces
A thermal contact resistance arises between the slag blockand the pot, and this may affect the solidification process bylowering the rate of heat transfer from the block to the pot.In the case of titania slag cooling in a cast steel pot, the
thermal contact resistance was found to be negligible: thisis evident from the correspondence between the modelpredictions (which neglects contact resistance) andmeasured pot surface temperatures, shown in Figure 5. Thelocations of the dual thermocouples inserted into the potshell are shown in Figure 10(b). If the contact resistanceplayed a significant role, the actual pot temperatures wouldhave been much lower than predicted; this is not the case.
Contact coefficient between the block and yard surface
During secondary cooling the horizontal surface of theblock faces the block-yard surface. With the hot downward-facing surface effectively suppressing natural convection,this boundary condition was modelled via a contactresistance as per Equation [9], with kair the thermalconductivity of air, d the average height of the air gap
No. %FeO Tliquidus ‘Tsolidus’ Cpsolid Cpliquid H298liquid
(°C) (°C) (J/kgK) (J/kgK) (MJ/kg)
1 6.86 1601.17 1470.34 903.60 1024.32 0.50142 8.05 1586.19 1451.36 903.73 1020.45 0.49893 8.85 1581.56 1463.56 902.75 1018.46 0.49574 9.71 1575.25 1459.53 901.88 1016.48 0.49165 10.85 1570.31 1453.99 900.64 1015.02 0.48676 12.14 1564.82 1450.26 898.56 1012.52 0.48197 13.89 1553.52 1440.63 896.46 1007.64 0.47458 17.98 1537.42 1427.74 891.26 1001.96 0.4510
Figure 4. Predicted effect of temperature on (a) the fraction liquid and (b) the enthalpy (relative to that of solid slag at 298 K) of slag n. 4.The broken line gives the linear approximation which was used as model input
Figure 5 Pot surface temperatures as predicted by the cooling model (lines). Symbols indicate surface measurements derived from actualtemperature measurements within the pot shell
Table IIParameters of linear approximations to thermodynamic properties, and fitted relationships
Time (hours since taphole closed)
Tap 38 - pot surface temperatures
Tem
pera
ture
(°C
)
Temperature (°C)
(a)
Fra
ctio
n liq
uid
Temperature (°C)
(b)
H-H
298
(MJ/
kg)

A HEAT TRANSFER MODEL FOR HIGH TITANIA SLAG BLOCKS 21
between the block and ground surfaces, and hrad theradiation convection coefficient calculated as per Equation[10]. While the width of the gap between the block andyard surface varies, an average gap height of 10 mm wasassumed. The model results were insensitive to the size ofthe air gap within a range of 5 mm to 50 mm.
[9]
[10]
Natural convection in airDuring primary cooling in the pot, the pot outer surface andhorizontal block surface are exposed to natural convectionin air. During this time the pot surface acts as an inclinedheated surface facing downwards. After being tipped out ofthe pot, the conical and spherical surfaces of the block actas an inclined heated surface, facing upwards. Theconvection heat transfer coefficient for the above conditionswas calculated from correlations and constants provided byHolman3 for natural convection in air. The joint effect ofradiation and convection was expressed with an effectiveheat transfer coefficient. The resulting heat transfercoefficients for the horizontal and inclined surfaces areshown in Figure 6. At higher temperatures the contributionof radiation (bottom line in Figure 6) becomes increasinglypredominant.
Forced spray water coolingFor the purposes of the block cooling model the heattransfer coefficient for spray water cooling was derivedfrom the work of Klinzing et al.4, utilizing the originalexpressions of Mudawar5. Heat transfer coefficientscalculated for varying volumetric flows, drop speeds anddrop diameters are shown in Figure 7. Within the testedparameters range, the heat transfer coefficient is sensitive tothe water volumetric flow rate, but insensitive to the dropdiameter. Increasing drop speed moves the Leidenfrosttemperature to higher values.
While the heat transfer coefficient in natural air cooling isusually around 10 W/m2˚C, it increases by two to threemagnitudes during spray water cooling.
Model calibrationDuring a pilot-plant ilmenite smelting campaignthermocouples were inserted into two slag blocks directlyafter tapping. These thermocouples were positioned asshown in Figure 8 and Figure 10. The configuration of thethree centre line thermocouples are shown in Figure 9. TheAlsint tube (alumina thermocouple sheath) was insertedinto the silicon carbide tube and both these tubes wereclosed at the bottom end. Three 0.25 mm (wire diameter)type S thermocouple and sheath combinations werepositioned within the Alsint tube at different heights asshown in Figure 10. The thermocouples marked A, B and Cdenote the thermocouples which were inserted down thecentre line of the block; while those marked 1, 2 and 3 weredouble thermocouples inserted into holes drilled into theshell of the pot. The thermocouple inserted off centre intothe block (Figure 8) failed and hence no data was obtainedfrom it. The tap information and slag composition of thetwo taps are given in Table III and Table IV.
Figure 6. Heat transfer coefficients for natural cooling in air
Figure 7. Heat transfer coefficients for cooling in water with varying (a) volumetric water flows (b) drop speeds and (c) drop diameters.Surface temperatures are in °C
Tsurface (°C)
Hea
t tr
ansf
er c
oef
fici
ent
(W/m
2 /K
)
Tsurface(c)
Drop diameter (mm)
Hea
t tra
nsfe
r co
effic
ient
(W/m
2 /°C
)
Tsurface(a)
Water volume (m3/s/m2)
Hea
t tra
nsfe
r co
effic
ient
(W/m
2 /°C
)
Tsurface(b)
Drop speed (m/s)
Hea
t tra
nsfe
r co
effic
ient
(W/m
2 /°C
)

HEAVY MINERALS 200922
***The total exceeds 100% because Ti3 is usually reported as Ti4+ (TiO2)
TiO2 % FeO % Al2O3 % CaO % Cr2O3 % MgO % MnO % SiO2 % V2O5 % Total %***
Tap 37 85.42 13.25 0.71 0.04 0.11 0.89 1.51 1.01 0.45 104.02Tap 38 84.21 13.92 0.75 0.04 0.15 1.26 1.45 0.94 0.45 102.94
Figure 8. Photograph of a slag block and pot directly after thermocouples were inserted into the block. For support the refractory tubeswere inserted into the slag through slots in a steel channel, which was placed horizontally over the pot edge
Figure 9. Photograph showing the configuration of the thermocouples which were inserted into the slag blocks
Figure 10. Thermocouple positions for blocks 37 and 38 tapped during Campaign 10. Alphabetic subscripts denote thermocouple positionsinserted into the slag, while numeric subscripts denote positions of thermocouples inserted into the pot shell
Table IIITap chemistry (mass percentage) of the campaign 10 pilot-plant blocks
Radius, r
Tap 37
(a)
Hei
ght,
z
Radius, r
Tap 38
(b)
Hei
ght,
z

A HEAT TRANSFER MODEL FOR HIGH TITANIA SLAG BLOCKS 23
The thermal conductivity of titania slag is not a wellknown number—especially not as a function oftemperature6. The model results were hence calibratedagainst the actual thermocouple measurements by adjustingthe slag thermal conductivity. The accuracy of the fit wasdetermined by calculating the sum of the errors as perEquation [11]. The RMS error proved to be smallest withthe thermal conductivity expressed as a linear function oftemperature: k = aT + b. The best fit k value for eachthermocouple is plotted in Figure 11. The uppermostthermocouple inserted into tap 37 (TA) deviatedsubstantially from the close grouping of the other fivethermocouples. From visual observations, the upper layer ofthe slag block typically has a very porous structure. Hence,with thermocouple TA being located high up in the block(Figure 10) it was likely positioned within this porous upperlayer where the thermal conductivity is apparentlydominated by the porous slag structure. The best fit k valuefor this layer seems to be constant at 0.5 W/m.˚C, muchlower than elsewhere in the block. As mentioned earlier, theeffects of the porous structure of the upper layer were notincluded in the model; the thermal conductivity everywherein the slag block was hence described by Equation [12].
[11]
[12]
The calibrated model results are compared with the actualinternal temperature of the two pilot-plant slag blocks inFigure 12. Apart from the cooling profile predicted forthermocouple TA of tap 37 (for reasons as explainedabove), the model accurately predicts the actual measuredtemperatures. The fitted values of the thermal conductivityof the solidified slag—increasing from approximately 1 to 3
W/mK, for a temperature increase from 200°C to 1500°C—is in line with what is expected for this type of material, asdiscussed elsewhere.7
Model verificationThe block cooling model was verified against the followinginformation from 18 ton (plant-scale) blocks: (i) thethickness of the crust after primary cooling (18 hours in thepot) and (ii) the surface temperatures of the block after 3days of cooling under water sprays.
Crust thicknessIn Figure 13 the thickness of the block shell after 18 hoursof cooling in the pot shows clearly after the blockdisintegrated directly after being tipped out of the pot. Inthis instance the thickness of the shell is of the order of 300mm to 320 mm. The model predicts the liquidus and soliduscontours for a similar sized block cooled for an equalduration in the pot to be 371 mm and 276 mm from theround end of the block surface respectively (Figure 14).The actual crust thickness is therefore close to halfwaybetween the liquidus and solidus contours. This fits in withobservations and literature that the titania slags have a veryhigh viscosity close to their melting point.
Block mass (kg) Tap rate (kg/min) Tap temperature (˚C)
Tap 37 1002 204.6 1669Tap 38 1365 345.7 1668
Figure 11. Best fit k values for taps 37 and 38. For modellingpurposes the k value was expressed as given by the solid black line
Figure 12. Internal slag temperatures for (a) tap 37 and (b) tap 38. Lines indicate model predictions, while symbols represent actualtemperature measurements (k = 0.00175T + 0.3)
Table IVTap details of the campaign 10 pilot-plant blocks
Temperature °C
Sla
g th
erm
al c
ondu
ctiv
ity, W
/m°C
Time (hours since taphole closed)
(a)
Tap 37 Tap 38
Tem
per
atu
re (
°C)
Time (hours since taphole closed)
(b)
Tem
per
atu
re (
°C)

Surface temperaturesThe surface temperatures of the two industrial-scale plantblocks were measured with an optical pyrometer when thespray water was stopped after 3 days. These temperaturesare shown in Figure 15 together with the model predictedsurface temperatures of the block surface. The averagesurface temperature was calculated from two to four actualtemperature measurements taken on the block surface. Alltemperatures were taken on the lower 0.5 m height band ofthe block. This band corresponds with the 0.6 m to 1.2 mmarks on the Z axis (block height) of Figure 14 and Figure 16 (note that on the scales of these graphs Z=0denotes the zt height). The model predictions correlate wellwith the actual temperature measurements.
Solidification resultsFollowing primary cooling the block is tilted out of the potby means of an overhead crane. The block is then picked upby a front end loader and transported to the block yard. Assoon as the front end loader is out of the range of the watersprays, the water is turned on. In view of this relativelycrude handling method the thickness, strength andtoughness of the crust at the end of primary cooling areimportant. Failure of the crust and subsequent trapping ofwater underneath liquid slag results in powerful hydrogenor steam explosions—an occurrence which must be avoidedto prevent serious injury and/or damage.
It is of interest to test whether this potentially unsafesituation can be eliminated by cooling the block in the pot
HEAVY MINERALS 200924
Figure 14. Temperature contours (scale in thousands of ˚C) of an 18 t block after 18 hours primary cooling (in pot)
Figure 13. Internal structure of a partially solidified block, as revealed by failure during tipping after primary cooling in the pot

A HEAT TRANSFER MODEL FOR HIGH TITANIA SLAG BLOCKS 25
Figure 15. Surface temperatures of two 18-ton blocks. Symbols represent actual measurements and lines represent model predictions
Figure 16. Surface temperatures of an 18-ton block; times are expressed relative to the time of closing the taphole (the Z axis denotes heightabove ground level with the coordinate (rt;zt) being at Z=0)
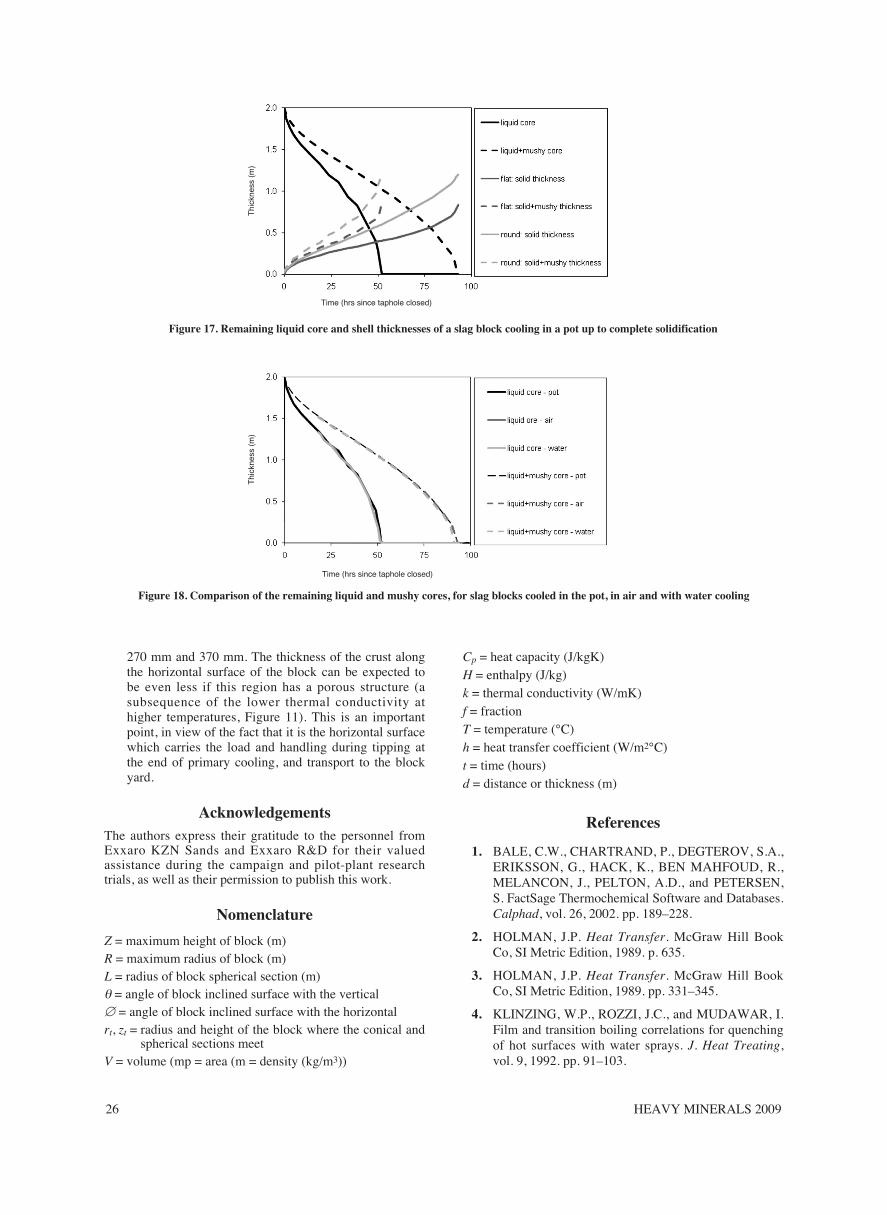
for longer periods. In Figure 17 the growth of the shellalong the vertical centre line of the block (z axis) for theflat and round ends of the block is shown. The last fullyliquid node disappears between 52 and 53 hours of cooling.At this time the mushy zones (partially solidified slag,between liquidus and solidus temperatures), which aregrowing from the top and bottom, meet. The last mushyzones disappear between 92 and 93 hours. Thesolidification rates of a pot-cooled block are compared withthose of water and air-cooled blocks in Figure 18: the watercooled block undergoes final solidification between 90 and91 hours. Other than this relatively small difference insolidification time, the blocks solidify identically.
The shrinkage of the diameter of the liquid core along theblock height (z axis) can be described by Equation [13].Similarly the diameter of the mushy zone can be describedby Equation [14]. In both instances d is in metres and t inhours, counting from the time of closing the taphole.
[13]
[14]
Discussion and conclusionIn the preceding paragraphs, the formulation of a coolingmodel for a titania slag block has been described. As part ofthis model formulation, useful material properties for titaniaslag (i.e. liquidus temperature, heat capacity numbers andenthalpy values) were described as functions of the slagchemistry as represented by the %FeO. Through calibrationof the cooling model against actual internal slagtemperature measurements, the thermal conductivity oftitania slag as a function of temperature was also derived.
From the model predicted solidification results thefollowing is concluded:
• The thermal conduction through the solid slag layer isthe rate determining parameter of the cooling process.The practical implication is that the cooling method—whether pot, air or water cooling does not significantlyalter the solidification rate of a slag block. The coolingenvironment does, however, substantially affect thesurface temperature of the block.7
• An 18-ton slag block is predicted to require just lessthan four days to solidify completely. Conservativelyassuming the duration of primary cooling to be 20hours, the shell thickness of the domed section of theblock is predicted to be between approximately
Temperature (°C)
Z (
m)
Time (hrs since taphole closed)
Tem
pera
ture
(°C
)
HEAVY MINERALS 200926
270 mm and 370 mm. The thickness of the crust alongthe horizontal surface of the block can be expected tobe even less if this region has a porous structure (asubsequence of the lower thermal conductivity athigher temperatures, Figure 11). This is an importantpoint, in view of the fact that it is the horizontal surfacewhich carries the load and handling during tipping atthe end of primary cooling, and transport to the blockyard.
AcknowledgementsThe authors express their gratitude to the personnel fromExxaro KZN Sands and Exxaro R&D for their valuedassistance during the campaign and pilot-plant researchtrials, as well as their permission to publish this work.
Nomenclature
Z = maximum height of block (m)R = maximum radius of block (m)L = radius of block spherical section (m)θ = angle of block inclined surface with the vertical∅ = angle of block inclined surface with the horizontalrt, zt = radius and height of the block where the conical and
spherical sections meet V = volume (mp = area (m = density (kg/m3))
Cp = heat capacity (J/kgK)H = enthalpy (J/kg)k = thermal conductivity (W/mK)f = fractionT = temperature (°C)h = heat transfer coefficient (W/m2°C)t = time (hours)d = distance or thickness (m)
References
1. BALE, C.W., CHARTRAND, P., DEGTEROV, S.A.,ERIKSSON, G., HACK, K., BEN MAHFOUD, R.,MELANCON, J., PELTON, A.D., and PETERSEN,S. FactSage Thermochemical Software and Databases.Calphad, vol. 26, 2002. pp. 189–228.
2. HOLMAN, J.P. Heat Transfer. McGraw Hill BookCo, SI Metric Edition, 1989. p. 635.
3. HOLMAN, J.P. Heat Transfer. McGraw Hill BookCo, SI Metric Edition, 1989. pp. 331–345.
4. KLINZING, W.P., ROZZI, J.C., and MUDAWAR, I.Film and transition boiling correlations for quenchingof hot surfaces with water sprays. J. Heat Treating,vol. 9, 1992. pp. 91–103.
Figure 17. Remaining liquid core and shell thicknesses of a slag block cooling in a pot up to complete solidification
Figure 18. Comparison of the remaining liquid and mushy cores, for slag blocks cooled in the pot, in air and with water cooling
Time (hrs since taphole closed)
Thi
ckne
ss (
m)
Time (hrs since taphole closed)
Thi
ckne
ss (
m)

A HEAT TRANSFER MODEL FOR HIGH TITANIA SLAG BLOCKS 27
5. MUDAWAR, I. and VALENTINE, W.S.Determination of the local quench curve for spraycooled metallic surfaces. J. Heat Treat, vol. 7, 1989.pp. 107–121.
6. TRAN, T., SOLNORDAL, C., and NEXHIP, C.Determination of thermal conductivity of titania slags.Unpublished CSIRO Minerals Report, DMR-2229,June 2003.
7. PISTORIUS, P.C. and KOTZE, H. The link betweensolidification of high-titania slag and subsequent
comminution. Molten 2009, Proceedings of the VIIIInternational Conference on Molten Slags, Fluxes andSalts, Santiago, Chile, January 2009; M. Sanchez, R.Parra, G. Riveros and C. Díaz (eds.). Gecamin,Santiago, Chile. 2009. pp. 51–60.
8. HANDFIELD, G. and CHARETTE, G.G. Viscosityand structure of industrial high TiO2 slags. CanadianMetallurgical Quarterly, vol. 10, no. 3, 1971. pp. 235–243.
H. KotzéConsulting Engineer, Consensi Consulting CC
Following completion of graduate studies at the University of Pretoria, Hanlie continued tocomplete her masters in metallurgical engineering, studying the melting points of varioustitanium slag compositions. During the beginning of 1997 she started working as projectengineer on the (at the time named) IHM Heavy Minerals Project. During 2001 she moved withthe project to Empangeni as was senior process engineer for the ilmenite smeltingcommissioning team. In the subsequent years she led various business improvement initiatives.During 2007 she was appointed as Manager Technical Services reporting to the GeneralManager of Exxaro KZN Sands. At present she is conducting consulting work in the fields ofheavy minerals and industrial ceramics. She has obtained her PhD in metallurgical engineeringduring 2007 with her study on the cooling behaviour of high titania slags.

HEAVY MINERALS 200928