a high-quality quantitative human plasma proteome in … · [email protected], +41 44 633...
TRANSCRIPT
Plasma proteome reference set in PeptideAtlas
1
A High-Confidence Human Plasma Proteome Reference Set with Estimated
Concentrations in PeptideAtlas
Terry Farrah1*, Eric W. Deutsch
1, Gilbert S. Omenn
1,2, David S. Campbell
1, Zhi Sun
1,
Julie A. Bletz1, Parag Mallick
3, Jonathan E. Katz
3, Johan Malmström
4, Reto Ossola
4,
Julian D. Watts1, Biaoyang Lin
5,6, Hui Zhang
7, Robert L. Moritz
1§*, Ruedi Aebersold
4§*
1 Institute for Systems Biology, Seattle, WA, U.S.A.
2 Center for Computational Medicine and Bioinformatics, University of Michigan, Ann
Arbor, MI, U.S.A.
3 Department of Medicine, University of Southern California, Los Angeles, CA, U.S.A.
4 Department of Biology, Institute of Molecular Systems Biology, ETH (Swiss Federal
Institute of Technology), Zurich, Switzerland
5 Swedish Neuroscience Institute, Swedish Medical Center, Seattle, WA, U.S.A.
6 Systems Biology Division, Zhejiang-California International Nanosystems Institute
(ZCNI), Zhejiang University, Hangzhou, Zhejiang, China.
7 Department of Pathology, Johns Hopkins University, Baltimore, MD, U.S.A.
* To whom correspondence should be sent.
[email protected], 206-732-1348 (voice), 206-732-1299 (fax)
[email protected], 206-732-1244 (voice), 206-732-1299 (fax)
Institute for Systems Biology, 401 Terry Ave N, Seattle, WA 98109
[email protected], +41 44 633 31 70 (voice) +41 44 633 10 51 (fax)
HPT E 8, Wolfgang-Pauli-Str. 16, 8093, Zurich, Switzerland
§This work was performed equally between both groups.
Running title: Plasma proteome reference set in PeptideAtlas
MCP Papers in Press. Published on June 1, 2011 as Manuscript M110.006353
Copyright 2011 by The American Society for Biochemistry and Molecular Biology, Inc.
Plasma proteome reference set in PeptideAtlas
2
Abbreviations
HUPO (Human Proteome Organization), PPP (Plasma Proteome Project), IPI
(International Protein Index), TPP (Trans-Proteomic Pipeline), FDR (false discovery
rate), PSM (peptide-spectrum match), EOS (empirical observability score), SRM
(selected reaction monitoring), SNP (single nucleotide polymorphism)
Plasma proteome reference set in PeptideAtlas
3
Summary
Human blood plasma can be obtained relatively noninvasively and contains proteins from
most, if not all, tissues of the body. Therefore, an extensive, quantitative catalog of
plasma proteins is an important starting point for the discovery of disease biomarkers. In
2005, we showed that different proteomics measurements using different sample
preparation and analysis techniques identify significantly different sets of proteins, and
that a comprehensive plasma proteome can be compiled only by combining data from
many different experiments. Applying advanced computational methods developed for
the analysis and integration of very large and diverse data sets generated by tandem MS
measurements of tryptic peptides, we have now compiled a high-confidence human
plasma proteome reference set with well over twice the identified proteins of previous
high-confidence sets. It includes a hierarchy of protein identifications at different levels
of redundancy following a clearly-defined scheme, which we propose as a standard that
can be applied to any proteomics dataset to facilitate cross-proteome analyses. Further, to
aid in development of blood-based diagnostics using techniques such as selected reaction
monitoring (SRM), we provide a rough estimate of protein concentrations using spectral
counting. We identified 20,433 distinct peptides, from which we inferred a highly non-
redundant set of 1929 protein sequences at a false discovery rate of 1%. We have made
this resource available via PeptideAtlas, a large, multi-organism, publicly accessible
compendium of peptides identified in tandem MS experiments conducted by laboratories
around the world.
Plasma proteome reference set in PeptideAtlas
4
Introduction
Blood plasma contains a combination of sub-proteomes derived from different tissues,
and thus, it potentially provides a window into an individual’s state of health. Therefore,
a detailed analysis of the plasma proteome holds promise as a source of biomarkers that
can be used for the diagnosis and staging of diseases, as well as for monitoring
progression and response to therapy.
For many years, prior to the era of proteomics, the classic multi-volume reference, The
Plasma Proteins by Frank Putnam (1975-1989) (1), provided a foundation for studies of
plasma proteins. In 2002, Anderson and Anderson (2) published a review of 289 plasma
proteins studied by a wide variety of methods, and quantified primarily with
immunoassays, providing an early plasma proteome reference set.
Subsequently, the widespread adoption of LC-MS/MS techniques resulted in a rapid
increase in plasma proteome-related datasets that needed to be similarly integrated to
form a next-generation comprehensive human plasma proteome reference set. In 2002,
the Human Proteome Organization (HUPO) launched Phase I of its Human Plasma
Proteome Project (PPP) and provided reference specimens of serum and EDTA-, citrate-,
and heparin-anticoagulated plasma to 55 laboratories. Eighteen laboratories contributed
tandem MS findings and protein identifications, which were integrated by a collaborative
process into a core dataset of 3020 proteins from the International Protein Index (IPI)
database (3) containing two or more identified peptides, plus filters for smaller, higher
confidence lists (4, 5). A stringent re-analysis of the PPP data, including adjustment for
multiple comparisons, yielded 889 proteins (6).
Plasma proteome reference set in PeptideAtlas
5
Meanwhile, in 2004, Anderson et al. (7) published a compilation of 1175 non-redundant
plasma proteins reported in the 2002 literature review and in three published
experimental datasets (8-10). Only 46 were reported in all four sources, suggesting
variability in the proteins detected by different methods, high false positive rates due to
insufficiently stringent identification criteria, and non-uniform methods for assigning
protein identifications. Shen et al. (11) reported 800 to 1682 proteins from human plasma,
depending on the proteolytic enzymes used and the criteria applied for identification;
Omenn et al. (4) re-analyzed those raw spectra with HUPO PPP-I search parameters and
matched only 213 to the PPP-I core dataset. Chan et al. reported 1444 unique proteins in
serum using a multi-dimensional peptide separation strategy (12), of which 1019 mapped
to IPI and 257 to the PPP-I core dataset. These previous efforts highlight the challenges
associated with accurately determining the number of proteins inferred from large
proteomic datasets, and with comparing the proteins identified in different datasets.
In 2005, we used a uniform method based on the Trans-Proteomic Pipeline (13) to create
the first Human Plasma PeptideAtlas (14), containing 28 LC-MS/MS datasets and over
1.9 million spectra. Using a PeptideProphet (15) probability threshold of P >= 0.90, 6929
peptides were identified at a peptide false discovery rate (FDR) of 12%, as estimated by
PeptideProphet’s data model, mapping to about 960 distinct proteins. Comparison of
protein identifiers with those from studies cited above showed quite limited overlap.
From the 2005 Human Plasma PeptideAtlas, as well as the PPP-I collaboration, we
concluded that different proteomics experiments using different samples, depletion,
fractionation, sample preparation, and analysis techniques identify significantly different
sets of proteins. We decided that a comprehensive plasma proteome could be compiled
Plasma proteome reference set in PeptideAtlas
6
only by combining data from many diverse, high-quality experiments, and strove to
collect as much such data as possible. The resulting 2007 Human Plasma PeptideAtlas
(unpublished), encompassing 53 LC-MS/MS datasets, identified 27,801 distinct
peptides—four times the number in the 2005 Atlas—and 2738 proteins.
In 2008, Schenk et al. (16) published a high-confidence set of 697 non-immunoglobulin
human plasma proteins based on measuring a single pooled sample on two high-end MS
instruments after depletion, pre-fractionation, and protease inhibition, with stringent
validation methods. This highly non-redundant set of proteins likely contains fewer false-
positives than any previous MS-derived plasma proteome reference set.
The goal of the present work was to compile a larger human plasma proteome reference
set of similar high confidence by creating a new release of the Human Plasma
PeptideAtlas incorporating more data than in 2007 and interpreting the data using more
stringent criteria. We searched raw datasets submitted to PeptideAtlas and performed
peptide validation using a uniform pipeline (Figure 1), compiled several sets of
corresponding protein identifications at different clearly-defined levels of redundancy
(Figure 2), and, using a spectral counting technique, provided a rough estimate of
concentrations for a highly non-redundant set of protein sequences in order to guide
blood-based diagnostic efforts such as doping using stable isotope-labeled synthetic
reference peptides for SRM experiments (Figure 3). The result is a plasma proteome
reference set (Figure 4; Supplementary Data Tables S3 and S6) containing 1929 highly
non-redundant protein sequences at an estimated 1% FDR.
Plasma proteome reference set in PeptideAtlas
7
Experimental Procedures
1. Searching of datasets
We collected raw spectra from 91 high-quality LC-MS/MS datasets ((4, 12, 17-21) and
several unpublished; Table S4, Supplemental Data), including 44 from Phase I PPP
experiments, 13 from PPP Phase II, the Chan dataset, and several from corporate research
laboratories. Data from both plasma and serum samples, a variety of sample preparation
techniques (depleted/not depleted, various fractionation schemata, use of protease
inhibitors, N-linked glycocapture enrichment (22)), and analysis on a variety of
instruments were included. All samples were digested with trypsin. Each dataset
consisted of between one and 38,252 LC-MS/MS runs (median 22) for a total of 48,789
LC-MS/MS runs1. For analysis, we separated the datasets into two groups, glycocapture
and non-glycocapture, and later combined the results.
The 69 datasets for the non-glycocapture samples were all selected from ion trap
experiments because we wished to search them against an ion trap spectral library. Data
were converted to mzXML (23) and searched with SpectraST version 4.0 (24) against a
spectral library consisting of the NIST 3.0 human spectral library (261,777 consensus
spectra) (25) plus one SpectraST-generated (26) decoy for each NIST spectrum. This
library contains consensus spectra derived from actual identified spectra, some of which
include missed cleavages and/or modifications. A precursor mass tolerance of 3.0 Th
(thomson) was used. See Supplemental Data for complete SpectraST parameters.
1 This total includes two extraordinarily large experiments together comprising 45,160 runs.
Plasma proteome reference set in PeptideAtlas
8
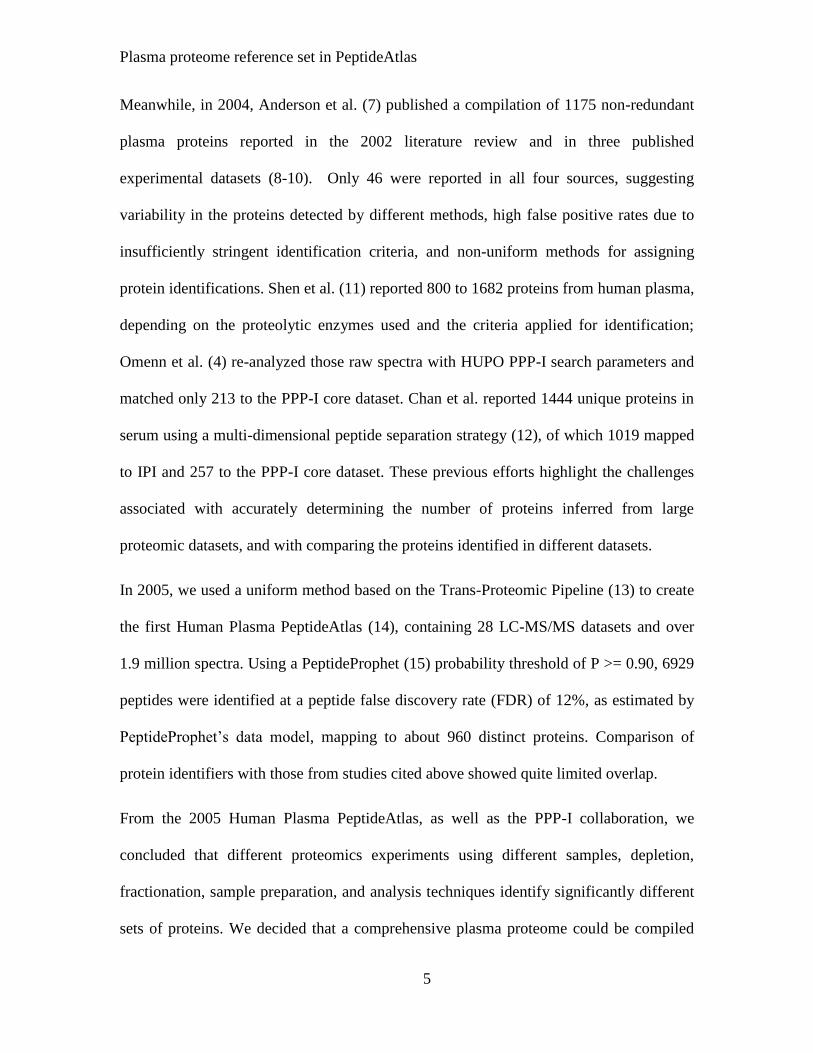
Figure 1.
Left: Search, analysis, and validation steps for each LC-MS/MS experiment.
Spectra were searched against a spectral library or sequence database. The
resulting PSMs were then processed using the TPP, including a new component,
iProphet, to improve discrimination (see text for details).
Right: The PeptideAtlas build process. ProteinProphet combines PSMs passing the
FDR threshold for all experiments to create lists of distinct peptides, protein
identifications, and protein groups. These data, along with supporting information
such as consensus spectra, genome mappings, and proteotypic peptides, comprise a
PeptideAtlas build.
2. Analysis and validation of search results
The search results for each experiment were processed using the Trans-Proteomic
Pipeline (TPP) (13), as shown in Figure 1, left (see Supplemental Data for TPP
parameters used). PeptideProphet (15) computed a probability for each peptide-spectrum
match (PSM) for peptides of length 7 or greater. iProphet (27) was applied to the
PeptideProphet results to improve discrimination by modeling five additional properties
Plasma proteome reference set in PeptideAtlas
9
of the data beyond those modeled by PeptideProphet, and adjusting peptide probabilities
accordingly. The five models are number of sibling searches (rewards or penalizes
identifications based on the output of multiple search engines, not applicable here),
number of replicate spectra (models the assumption that precursor ions with multiple
high probability identifications are more likely to be correct), number of sibling
experiments (models the assumption that precursor ions observed in multiple experiments
and matched to the same peptide sequence are more likely to be correct), number of
sibling ions (rewards peptides identified by precursors with different charges), and
number of sibling modifications (rewards peptides identified with different mass
modifications).
RefreshParser mapped each PSM to a combined protein sequence database derived from
Swiss-Prot 2010-04 including splice variants (28, 29), IPI v3.71, Ensembl v57.37 (30),
and cRAP v1.0 (31). In many cases, the exact same protein sequence is included in the
combined database multiple times because it is contained in multiple databases and/or
because the Ensembl database includes many duplicates. Each PSM was mapped to all
protein sequences containing the PSM’s peptide sequence; in many cases this resulted in
a PSM mapping to multiple protein sequences that are duplicates, splice variants, or
paralogs.
For very large datasets, the FDR at the peptide level tends to be much larger than that at
the PSM level, and, at the protein level, much larger still (32). Thus, in order to obtain a
1% decoy-estimated protein FDR for the final Human plasma PeptideAtlas, a stringent
PeptideProphet-estimated PSM FDR filter of 0.0002 (corresponding to probability cutoffs
ranging from 0.9903 to 0.9998) was applied to each experiment.
Plasma proteome reference set in PeptideAtlas
10
ProteinProphet (33) was then run on each experiment, assigning to each distinct peptide
the probability of its highest probability PSM, and further adjusting these probabilities
using a number of sibling peptides model, which rewards peptides that map to proteins
with many identified peptides.
The set of identified peptides for the HsSerum NCI Large Survey experiment (12) was
found to contain many peptides that map to yeast but not human. Suspecting yeast
contamination, we purged the peptide set for this experiment of all peptides that appear in
the yeast genome.
Next, ProteinProphet was run again, this time combining the PSMs for all experiments, to
assign probabilities to protein identifications and to group protein identifications with
overlapping peptide sets. The PSMs passing threshold for all experiments and their
corresponding distinct observed peptides and protein identifications were then compiled
(Figure 1, right) to form a Human Plasma Non-Glyco PeptideAtlas build.
3. Classification of protein identifications
It is impossible to generate a definitive list of identified proteins because such a list
depends on what is meant by “protein” and on what one considers sufficient evidence for
the existence of a specific protein. Further, when the set of identified peptides mapping to
the sequence of a protein is identical to, or a subset of, the set of peptides mapping to the
sequence of another protein, it is quite possible that both proteins have been observed, but
there is no way to determine this from the data.
Plasma proteome reference set in PeptideAtlas
11
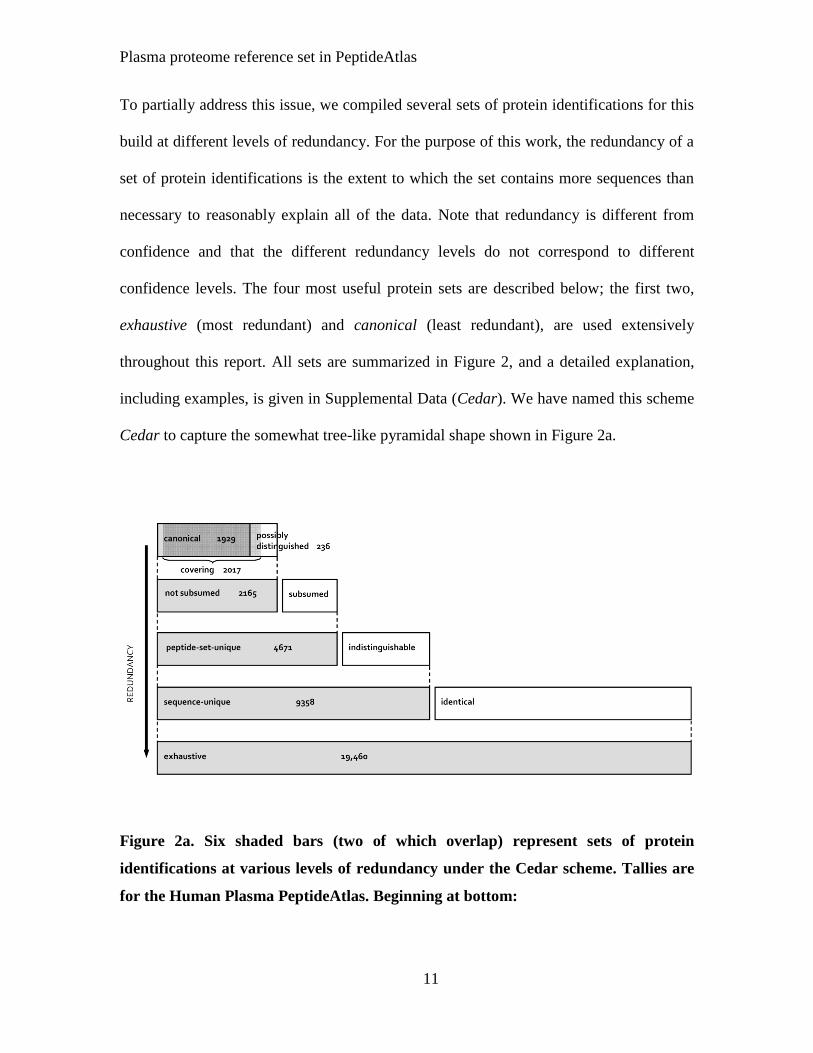
To partially address this issue, we compiled several sets of protein identifications for this
build at different levels of redundancy. For the purpose of this work, the redundancy of a
set of protein identifications is the extent to which the set contains more sequences than
necessary to reasonably explain all of the data. Note that redundancy is different from
confidence and that the different redundancy levels do not correspond to different
confidence levels. The four most useful protein sets are described below; the first two,
exhaustive (most redundant) and canonical (least redundant), are used extensively
throughout this report. All sets are summarized in Figure 2, and a detailed explanation,
including examples, is given in Supplemental Data (Cedar). We have named this scheme
Cedar to capture the somewhat tree-like pyramidal shape shown in Figure 2a.
Figure 2a. Six shaded bars (two of which overlap) represent sets of protein
identifications at various levels of redundancy under the Cedar scheme. Tallies are
for the Human Plasma PeptideAtlas. Beginning at bottom:
Plasma proteome reference set in PeptideAtlas
12
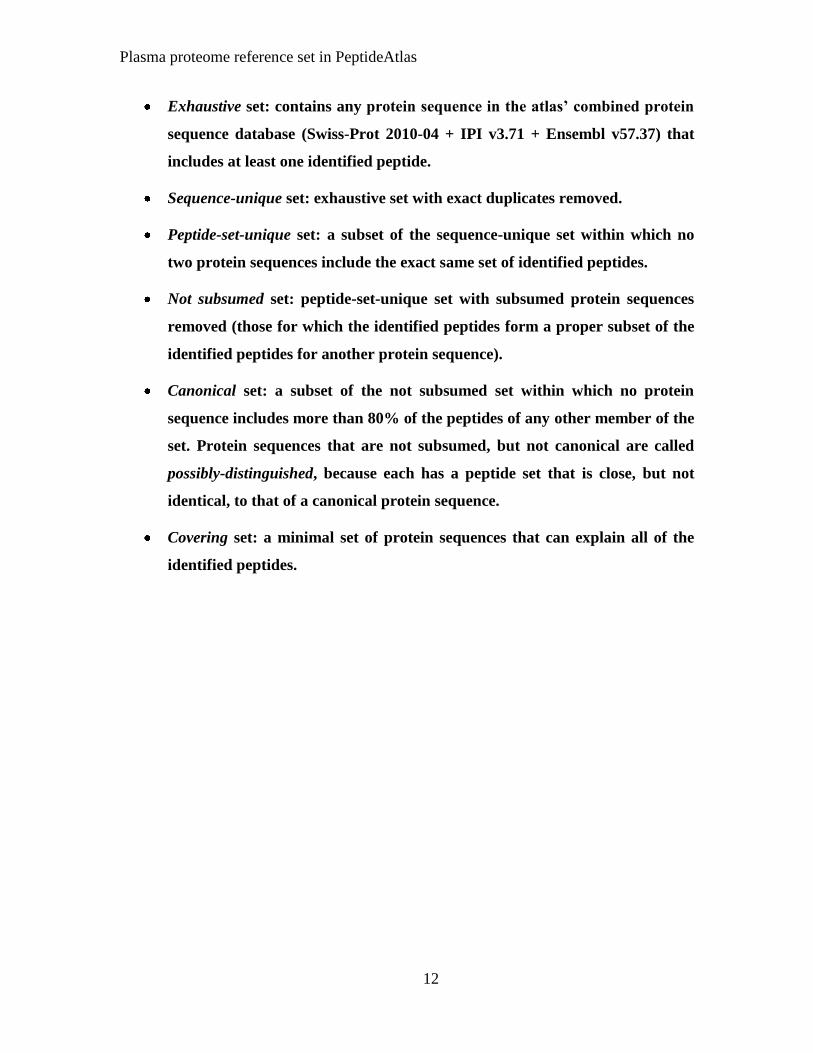
Exhaustive set: contains any protein sequence in the atlas’ combined protein
sequence database (Swiss-Prot 2010-04 + IPI v3.71 + Ensembl v57.37) that
includes at least one identified peptide.
Sequence-unique set: exhaustive set with exact duplicates removed.
Peptide-set-unique set: a subset of the sequence-unique set within which no
two protein sequences include the exact same set of identified peptides.
Not subsumed set: peptide-set-unique set with subsumed protein sequences
removed (those for which the identified peptides form a proper subset of the
identified peptides for another protein sequence).
Canonical set: a subset of the not subsumed set within which no protein
sequence includes more than 80% of the peptides of any other member of the
set. Protein sequences that are not subsumed, but not canonical are called
possibly-distinguished, because each has a peptide set that is close, but not
identical, to that of a canonical protein sequence.
Covering set: a minimal set of protein sequences that can explain all of the
identified peptides.
Plasma proteome reference set in PeptideAtlas
13
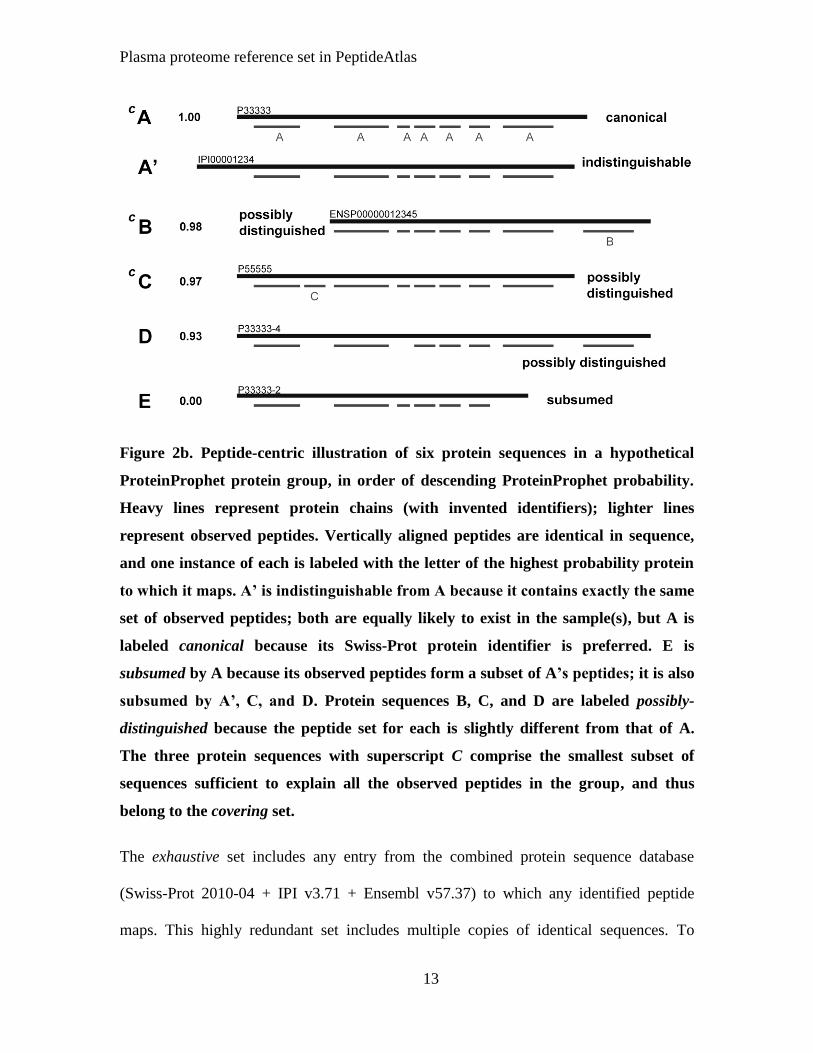
Figure 2b. Peptide-centric illustration of six protein sequences in a hypothetical
ProteinProphet protein group, in order of descending ProteinProphet probability.
Heavy lines represent protein chains (with invented identifiers); lighter lines
represent observed peptides. Vertically aligned peptides are identical in sequence,
and one instance of each is labeled with the letter of the highest probability protein
to which it maps. A’ is indistinguishable from A because it contains exactly the same
set of observed peptides; both are equally likely to exist in the sample(s), but A is
labeled canonical because its Swiss-Prot protein identifier is preferred. E is
subsumed by A because its observed peptides form a subset of A’s peptides; it is also
subsumed by A’, C, and D. Protein sequences B, C, and D are labeled possibly-
distinguished because the peptide set for each is slightly different from that of A.
The three protein sequences with superscript C comprise the smallest subset of
sequences sufficient to explain all the observed peptides in the group, and thus
belong to the covering set.
The exhaustive set includes any entry from the combined protein sequence database
(Swiss-Prot 2010-04 + IPI v3.71 + Ensembl v57.37) to which any identified peptide
maps. This highly redundant set includes multiple copies of identical sequences. To
Plasma proteome reference set in PeptideAtlas
14
determine whether a protein corresponding to a particular identifier exists in the Human
Plasma PeptideAtlas, one must check whether that identifier is in the exhaustive set.
Assuming the identifier is in Swiss-Prot 2010-04, IPI v3.71, or Ensembl v57.37, its
presence in the atlas’ exhaustive set indicates that the protein sequence includes a peptide
sequence in the atlas.
The canonical set is a highly non-redundant set of protein sequences explaining nearly all
of the identified peptides and it serves as a proteome reference set. It includes the highest
probability protein sequence from each ProteinProphet protein group, called the group
representative. Swiss-Prot protein sequences are preferred for inclusion due to Swiss-
Prot’s comprehensive sequence documentation and curation, and because Swiss-Prot, a
subset of Uniprot, is now considered to contain one entry for each currently known
human protein coding gene (34), with a total of 20,251 entries in the 2010-10 release, of
which 13,329 have evidence at the protein level [www.uniprot.org]. When a protein
group includes protein sequences for which the peptide set has less than 80% overlap
with the group representative, we label those sequences canonical as well (see
Supplemental Data, Cedar, for algorithm and justification for 80% threshold). The size of
the canonical set is a conservative estimate of the number of distinct proteins observed. It
is important to understand that the label canonical is with respect to a particular data
collection; a protein sequence that is identified in two atlas builds may be labeled
canonical in one collection and something else in another.
The possibly-distinguished set includes protein sequences that have one or more peptides
distinguishing it from all protein sequences in the canonical set, but with these peptides
Plasma proteome reference set in PeptideAtlas
15
comprising fewer than 20% of the total number of identified peptides in each protein,
making the case for independent existence less strong.
Finally, the covering set is a near-minimal set sufficient to explain all of the peptide
identifications (see Supplemental Data, Cedar, for algorithm). This set consists of almost
all of the canonical protein sequences plus some of the possibly-distinguished protein
sequences, and is usually somewhat larger than the canonical set. It is useful for assigning
a “parent” protein identification to each identified peptide, as is necessary for estimating
FDR using Mayu (32) or computing the empirical observability score described in
subsection 10 below.
See Supplemental Data (Cedar) for settings to apply when using the PeptideAtlas web
interface to obtain these protein sequence sets.
4. Analysis of N-linked glycopeptide-enriched samples
We then analyzed the 22 datasets from samples prepared using N-linked glycocapture
enrichment. Our aim in including these samples was to detect low-abundance proteins,
many of which are N-glycosylated. Sample preparation was as described in (35). Briefly,
N-linked glycoproteins were conjugated to a solid support using hydrazide chemistry,
proteins were digested with trypsin on the support, N-linked glycopeptides were
optionally labeled with stable isotopes, and formerly N-linked glycosylated peptides were
specifically released via peptide-N-glycosidase F (PNGase F) resulting in a N-linked
glycopeptide-rich fraction, but with the glycans removed. Within this fraction, all
asparagines (N) that had been glycosylated in the intact protein were now present as
Plasma proteome reference set in PeptideAtlas
16
aspartic acid (D) residues. This fraction was analyzed via LC-MS/MS. We did not search
against the NIST spectral library because it does not contain glycopeptide spectra;
instead, data were searched with X!Tandem version 2009.10.01.1 (36) using a score plug-
in implementing the COMET (k-score) function (13) against a target database consisting
of IPI 3.54 (75,428 sequences) plus one decoy per target sequence generated by a random
scrambling of each tryptic peptide in place. Peptides appearing in more than one target
sequence were scrambled identically each time. The mass tolerance for precursor ions
ranged from -2.1 to +4.1 Daltons. Modifications were allowed on cysteine (fixed, mass
depending on modification used) and methionine (variable, oxidation). A maximum of 2
missed cleavages was allowed. A standard protocol (37) was employed so that D-[not P]-
[S/T]-containing spectra could be matched against N-[not P]-[S/T]-containing database
sequences. Briefly, we substituted the letter B for N in all N-glycosite motifs in the
database (B commonly denotes “N or D” but in this context denotes “N presumed to be
glycosylated”), then searched with the mass of B fixed to the mass of D, allowing B to
behave as D during the search. Instances of B were then converted back to N in the
search results. See Supplemental Data for complete X!Tandem parameters. It is important
to note that, while this computational protocol allows identification of peptides
containing the (possibly de-amidated) N-glyco motif, it does not confirm whether the site
was indeed glycosylated in the sample.
We then constructed a Human Plasma N-Glyco PeptideAtlas using the same methods as
above, but with a PSM FDR threshold of 0.00002, yielding a protein-level FDR of
0.56%. We chose this threshold to achieve our goal of a 1% protein FDR after combining
with the 0.86% FDR Non-glyco build described above. It was not practical to use
Plasma proteome reference set in PeptideAtlas
17
identical FDRs for the component builds because even fine adjustments in the PSM FDR
for a component build sometimes resulted in coarse changes in the protein FDR for the
combined build.
5. Concentration estimation
Spectral counting was applied to roughly estimate the absolute concentration of the group
representative for each ProteinProphet protein group in each atlas. Spectral counting rests
on the observation that the PSM count for a peptide correlates linearly with its molar
concentration in the sample (38). We applied a simplification of the APEX method
described by Lu and co-workers (39). For each protein sequence, i, identified in the
Human Plasma Non-glyco PeptideAtlas, we begin with a ProteinProphet-adjusted count
SCi of all PSMs that map to that protein sequence (ProteinProphet adjusts the actual PSM
count downward according to the degeneracy of the peptide-protein mappings). SCi is
then normalized by scaling it to the total number of available tryptic peptides.
Specifically, we calculate a normalization factor, NFi, by dividing the number of tryptic
peptides of length seven or more resulting from an in silico digestion, NTPi, by 25, which
is very roughly the average number of tryptic peptides per protein sequence across the
whole proteome, and then calculate the normalized spectrum count NSCi by dividing SCi
by that factor:
25/ii NTPNF [1]
i
ii
NF
SCNSC [2]
Plasma proteome reference set in PeptideAtlas
18
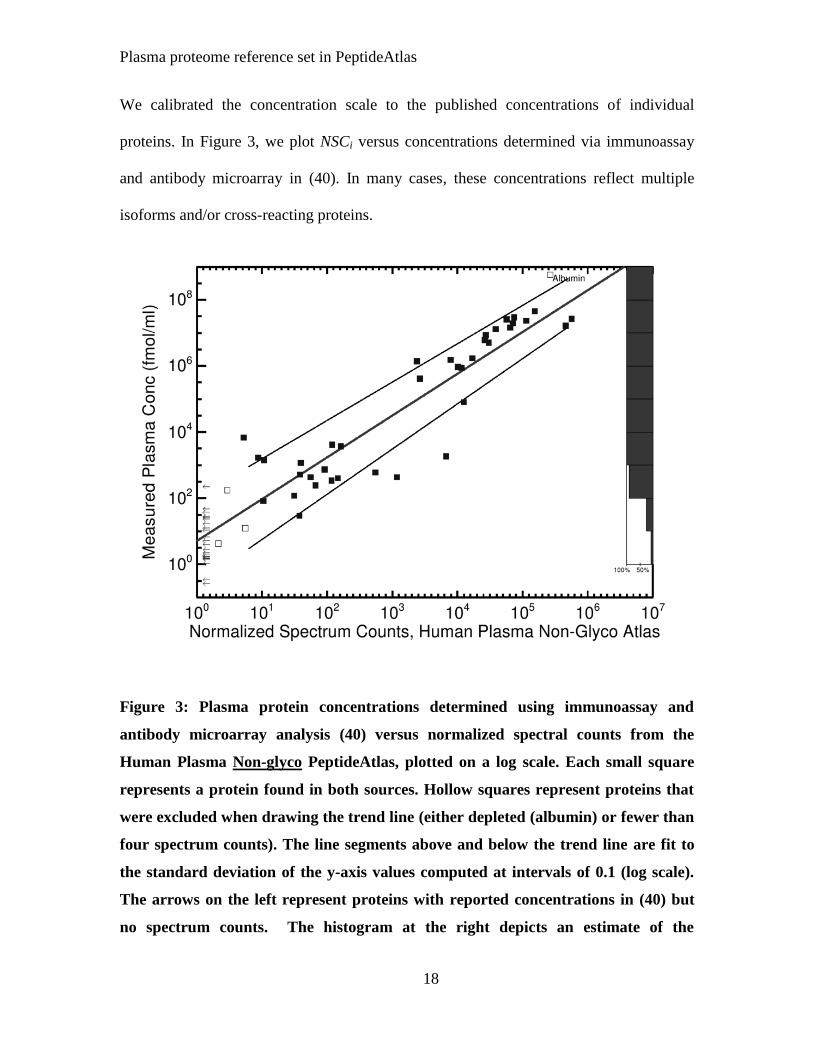
We calibrated the concentration scale to the published concentrations of individual
proteins. In Figure 3, we plot NSCi versus concentrations determined via immunoassay
and antibody microarray in (40). In many cases, these concentrations reflect multiple
isoforms and/or cross-reacting proteins.
Figure 3: Plasma protein concentrations determined using immunoassay and
antibody microarray analysis (40) versus normalized spectral counts from the
Human Plasma Non-glyco PeptideAtlas, plotted on a log scale. Each small square
represents a protein found in both sources. Hollow squares represent proteins that
were excluded when drawing the trend line (either depleted (albumin) or fewer than
four spectrum counts). The line segments above and below the trend line are fit to
the standard deviation of the y-axis values computed at intervals of 0.1 (log scale).
The arrows on the left represent proteins with reported concentrations in (40) but
no spectrum counts. The histogram at the right depicts an estimate of the
Plasma proteome reference set in PeptideAtlas
19
completeness of the Human Plasma Non-glyco PeptideAtlas as a function of
concentration, calculated as the number of points divided by the total number of
points and arrows within each decade. See Supplementary Data, Figure S2, for N-
Glyco atlas.
Using the slope S and y-intercept K from this calibration plot, we then calculated an
estimated concentration Ci for each group representative protein sequence with NSCi >= 4
(smaller counts have been found unreliable for this purpose (41)) in the Human Plasma
Non-glyco PeptideAtlas:
KSNSCC ii )( [3]
Concentrations were converted to mass units (ng/mL) for storage in PeptideAtlas using
molecular weights calculated from amino acid sequence.
The distance of the standard deviation curve from the trend line at the center of each
decade on the x-axis (between 100 and 10
1, between 10
1 and 10
2, etc.) was recorded as an
uncertainty factor for the normalized PSM counts in that decade, ranging from less than
5x at high concentrations to 13x at low concentrations. See Supplemental Data, Table S2,
for complete listing.
To estimate concentrations in the N-Glyco Plasma PeptideAtlas, we adjusted the
technique to account for the N-linked glycopeptide enrichment. About half of the distinct
peptides in this atlas contain the N-glycosite motif (N - [not P] - [S/T]), indicating a
potential N-linked glycosylation site. Thus, in calculating the normalization factor NFi,
we take into account both the total number of tryptic peptides in each protein sequence
NTPi and the number of peptides containing the N-glycosite motif, NTGPi:
Plasma proteome reference set in PeptideAtlas
20
2
25/iii
NTPNTGPNF [1’]
The calibration plot is shown in Supplemental Data (Figure S2). Also shown is a plot
correlating the estimated concentrations in the Non-glyco and N-Glyco atlases for protein
sequences appearing in both (Figure S3).
6. Construction of combined PeptideAtlas plasma build
Finally, we combined the PSMs and peptides from these two atlases to form a Human
Plasma PeptideAtlas build that includes results from all 91 plasma (or serum)
experiments, both non-glycocapture and glycocapture. We ran ProteinProphet on the
combined set of experiments and created protein identification sets as described above.
Estimated concentrations from the Non-glyco atlas were used for protein sequences with
values in both contributing atlases.
7. False discovery rate
Mayu, a software tool for estimating false discovery rates of protein identifications in
large-scale datasets (32), was applied to each component atlas and to the combined atlas
to estimate the protein-level FDR. Mayu implements a refinement of the common decoy-
counting approach, improving accuracy by taking into consideration the size of the
dataset, the number of tryptic peptides in each protein, and proteome coverage.
Plasma proteome reference set in PeptideAtlas
21
8. Manual validation of single-PSM protein identifications
Three hundred fifty-seven of the 1999 canonical protein identifications that emerged after
combining the Non-glyco and N-Glyco builds were supported by only a single PSM
(Supplemental Data, Table S5). We manually validated these, judging a PSM positively
for each of the following: identifications to b- or y-ions or neutral losses for nearly all of
the tallest peaks in the spectrum, at least one series of four or more consecutive highly
abundant fragment ions of the same type (b or y, preferably y) and charge state, highly
abundant fragments corresponding to cleavage N-terminal to proline and C-terminal to
aspartic acid (42), no missed tryptic cleavages, fragments observed above the noise level
for at least 50% of the expected ions, internal positively-charged amino acids to account
for precursor charges above +2, and N-terminal acetylation only for peptides at N-
terminus of protein. We discarded 70 PSMs that failed to fulfill these criteria to the extent
that, in our opinion, they had a greater than 10% chance of being incorrect identifications.
So the user can view these 70 discarded identifications, they were not removed from the
component (N-Glyco and Non-glyco) atlases.
9. Construction of combined PeptideAtlas plasma build at 5% protein FDR
We repeated the above atlas construction procedure to obtain a combined build with a
protein FDR of approximately 5%, as follows. We applied a PSM FDR of 0.001 to the
non-glyco data and a PSM FDR of 0.0007 to the glyco data, obtaining in each case a
build with a Mayu protein FDR of 4.8%. These were combined to yield a “Human
Plasma FDR 5% PeptideAtlas” build (actual Mayu protein FDR is 4.6%). Single-PSM
Plasma proteome reference set in PeptideAtlas
22
identifications were not manually validated, and all that passed our computational criteria
were retained in this build.
10. Empirical observability score
For all peptides in each atlas, we calculated an empirical observability score (EOS) (43),
defined as the ratio of the number of samples in which a given peptide is observed
divided by the number of samples in which the parent protein sequence is observed. For
example, if peptide X is seen in 5 different samples and its parent protein sequence is
observed in 10 samples, the EOS is 0.5.
Plasma proteome reference set in PeptideAtlas
23
Results
Size, confidence, and completeness of proteome reference set
The 2010 Human Plasma PeptideAtlas, constructed from 91 LC-MS/MS datasets,
contains 1929 canonical protein sequences with an estimated protein FDR of <0.98%
(Figure 4 and Supplemental Data, Table S3). As described in Experimental Procedures,
the set of canonical protein sequences is a highly non-redundant protein sequence set
with no protein sequence sharing more than 80% of its observed peptides with any other
member of the set. This criterion may exclude closely related protein family members.
The list of 1929 protein identifiers, along with estimated concentrations and number of
supporting PSMs and distinct peptides, is given in Supplemental Data (Table S6).
Each canonical protein sequence in the Human Plasma PeptideAtlas is supported by
between 1 and 521 distinct observed peptides (mean=11, median=3) and between 1 and
390,366 PSMs (mean=1720, median=10). Of the 1929 canonical protein sequences, 1642
are supported by more than one PSM, and 1313 are supported by more than one distinct
peptide.
High confidence identifications
The previous Human Plasma PeptideAtlas contained 27,801 peptides mapping to 2738
non-redundant proteins (protein redundancy level corresponding roughly to that of the
covering list for the 2010 atlas). The 2010 Human Plasma PeptideAtlas contains fewer
identified peptides and protein sequences, but these fulfill much more stringent criteria.
For lack of suitable methods, we could not accurately estimate the protein FDR of the
Plasma proteome reference set in PeptideAtlas
24
2007 build, but, because it was constructed using a very liberal PSM probability cutoff,
its protein FDR is no doubt much higher than the 1% of the 2010 build. The high
confidence level for the 2010 build, and the ability to estimate it, were accomplished by
the inclusion of more data plus four methodological improvements:
Spectral library searching: Non-glyco query spectra were compared against consensus
spectra derived from real spectra, rather than against theoretical spectra. This resulted in
better discrimination between true and false identifications (24), giving a higher number
of identifications at any given PSM FDR.
iProphet: A new component of the Trans-Proteomic Pipeline, iProphet (27), increased
discrimination between true and false identifications in our atlas builds by modeling five
additional properties of the data beyond those modeled by PeptideProphet (see
Experimental Procedures).
PSM FDR cutoff: For the 2007 build, we used a PSM probability cutoff of 0.9. Because
experiments vary in the quality of their results, this uniform probability cutoff admitted a
higher proportion of false PSMs for poor experiments than for high quality experiments.
Therefore, here we instead used a PSM FDR threshold, adjusted to achieve a protein FDR
of about 1% for the combined build. Corresponding probability cutoffs were one to three
orders of magnitude more stringent than those for the 2007 build, admitting many fewer
PSMs per experiment.
Decoy-estimated protein FDR: By including decoys in our target database we were able
to apply the recently-developed tool Mayu to accurately estimate the protein FDR.
Plasma proteome reference set in PeptideAtlas
25
Single-PSM protein identifications
Three hundred fifty-seven single-PSM protein identifications passed our rigorous
computational pipeline. This sub-population has a Mayu decoy-estimated protein FDR of
3.4%. Because decoy analysis may under-estimate protein FDR (44) and because single-
PSM protein identifications are especially in need of extra validation, we manually
examined all 357 and discarded 70 which we believed had a greater than 10% chance of
being false identifications (see details in Experimental Procedures). Assuming that the
FDR decreased as a result, we state that the final protein FDR is <0.98%. Building a
protein FDR 1% atlas excluding all single-PSM protein identifications would have
included more multiple-PSM identifications, but fewer total protein identifications (see
Supplemental Data, Choice of Atlas Stringency Level, for analysis).
Estimated concentrations
Although plasma protein concentration is dependent on the individual organism, its
disease state, and its physiological status at time of sample collection, concentrations of
relatively abundant proteins under relatively normal conditions generally do not vary
more than an order of magnitude (45), and it is useful to have a rough estimate of normal
protein concentration for purposes such as the spiking in of reference peptides for SRM
or other targeted MS measurements. Spectral counting has been established as a reliable
method for both relative (38, 41) and absolute (39, 46) quantification of proteins based on
LC-MS/MS data. Comparison of raw spectral counts has previously been used for
relative quantification between plasma samples (47). Here, following a simplification of
the APEX method of Lu and co-workers (39), we obtain absolute quantification by
Plasma proteome reference set in PeptideAtlas
26
normalizing spectral counts to adjust for the number of observable tryptic peptides per
protein and by calibrating to previously measured protein concentrations.
The estimated concentrations are rough estimates and should not be mistaken as accurate
quantitative values. Above 1 g/ml, they are generally accurate within 1-2 orders of
magnitude. Sixty-eight canonical proteins not used for spectral counting calibration
appear in the Hortin et al. 2008 review of abundant plasma proteins (48); the estimated
concentrations for 51% of these proteins are within a factor of 10 of the mean of the
concentration range reported by Hortin et al., and 94% are within a factor of 100. Of
course, there are considerable uncertainties about these previously published
measurements as well, due to the nature of immunoassays and antibody specificities.
Further, even a precise concentration measurement in a specific sample would not
generate a general statement about plasma protein abundances because of the variation
among individuals.
To the extent that these roughly estimated values are accurate, the very large amount of
data contributes to the accuracy. Data heterogeneity may also add to accuracy by
allowing averaging over many diverse samples. However, it may also detract because of
the variety of instruments and settings used. Dynamic exclusion settings, for example,
can be optimized to amplify the spectral counts of low abundance proteins relative to the
counts for high abundance proteins (49); the mixing of results in PeptideAtlas from
experiments with optimized and non-optimized settings could reduce accuracy.
Obviously, estimated concentrations are sensitive to the calibration values used; see
Figure S4, Supplemental Data, for illustration.
Plasma proteome reference set in PeptideAtlas
27
Concentration is estimated for the group representative for each protein group (as long as
its ProteinProphet-adjusted PSM count is at least 4). This concentration must be
considered to be shared among all protein sequences in the group, usually splice isoforms
or paralogs. Some atlas data come from analysis of depleted samples; concentrations for
depleted proteins (including those proteins that are inadvertently removed during the
depletion process, see (50)) are underestimated. Plasma concentrations for cellular
proteins can be elevated when there is non-physiological breakage of blood cells during
sample collection and preparation. The sum of the estimated concentrations for
hemoglobin-alpha and -beta, 71 g/mL, is close to the 100-200 g/mL measured in
serum in (51) , suggesting that such breakage was minimal.
The estimated concentrations based on spectral counting of the canonical protein
sequences in the Human Plasma PeptideAtlas span 6.5 orders of magnitude, ranging from
1.6 x 10⁶ ng/mL for serum albumin (P02768) down to 0.5 ng/mL for CEACAM1
(P13688, Cardinoembryonic antigen-related cell adhesion molecule 1). Serum albumin is
known to be the most abundant protein in plasma with a normal range of 3.4-5.4 x 10⁷
ng/mL (2, 52), but is underestimated in the atlas due to depletion.
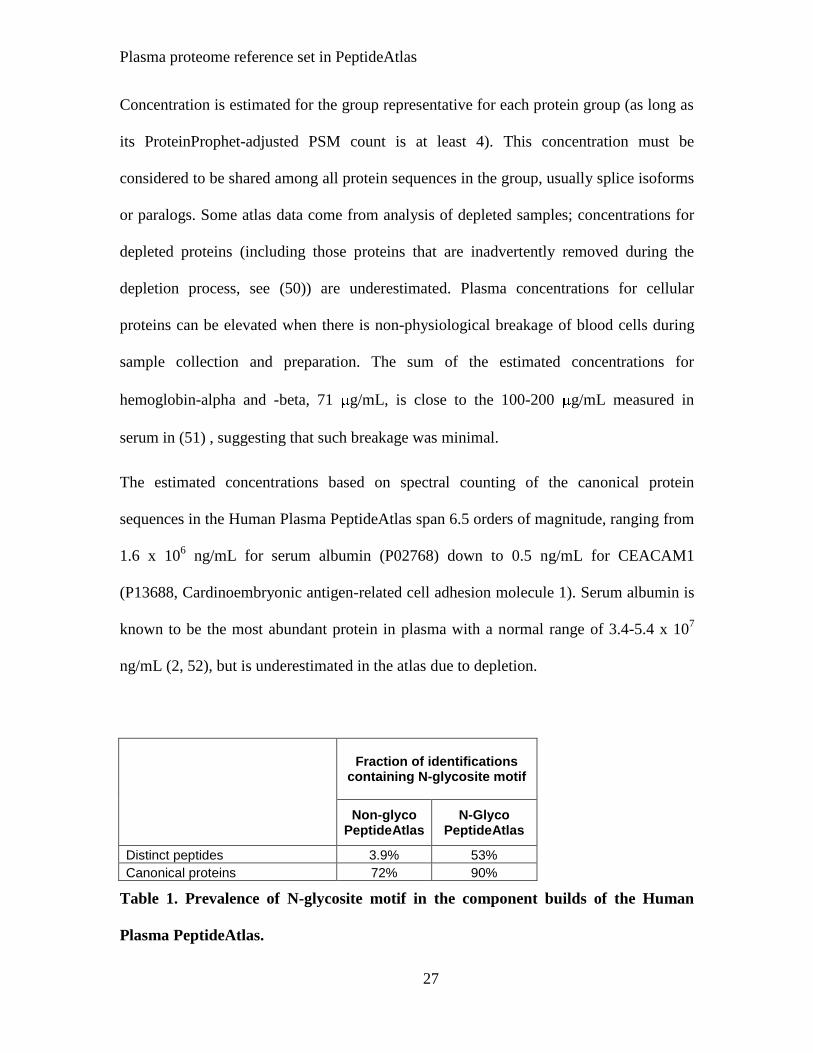
Fraction of identifications containing N-glycosite motif
Non-glyco PeptideAtlas
N-Glyco PeptideAtlas
Distinct peptides 3.9% 53%
Canonical proteins 72% 90%
Table 1. Prevalence of N-glycosite motif in the component builds of the Human
Plasma PeptideAtlas.
Plasma proteome reference set in PeptideAtlas
28
N-linked glycoproteome
Many proteins of medical interest, such as receptor extracellular portions, transport
molecules, and hormones, are N-linked glycosylated. Ninety percent of the 485 canonical
protein sequences in the Human Plasma N-Glyco PeptideAtlas contain the N-glycosite
motif (N - [not P] - [S/T]) and are thus likely N-linked glycoproteins. However, we
emphasize that our computational protocol does not confirm N-linked glycosylation for
any particular protein and the N[115] notation does not indicate a confirmed deamidation
site. See Supplemental Data, Computational pipeline for N-Glyco atlas does not confirm
glycosylation, for details. The employed glycocapture technique also purifies some non-
glycosylated peptides, presumably through non-specific binding to the base bead used
(Table 1).
Eighty-six canonical protein sequences from the Human Plasma N-Glyco PeptideAtlas,
all with estimated concentrations < 25 ng/mL, are not found in the Human Plasma Non-
glyco PeptideAtlas exhaustive set (Table S7, Supplemental Data). All but one of the 125
peptides mapping to these proteins has an N-glycosite motif. Because glycosylation
hinders LC-MS/MS identification, it is highly unlikely that these peptides would be
identified without the glycocapture protocol, which results in removal of glycan groups.
Indeed, only four are present in the NIST 3.0 spectral library we used to search the non-
glyco data.
Of the 86 proteins, 31% have no spectra in the NIST 3.0 library and thus could not have
been identified by spectral searching. However, as explained in Supplemental Data
(Completeness of spectral library searching), we expect very few additional canonical
Plasma proteome reference set in PeptideAtlas
29
proteins would be identified were we to perform database searching on the non-glyco
data. Therefore, we conclude that for nearly all of these 86 proteins, the reason they are
missing from the Non-glyco atlas is because they are of low abundance in plasma.
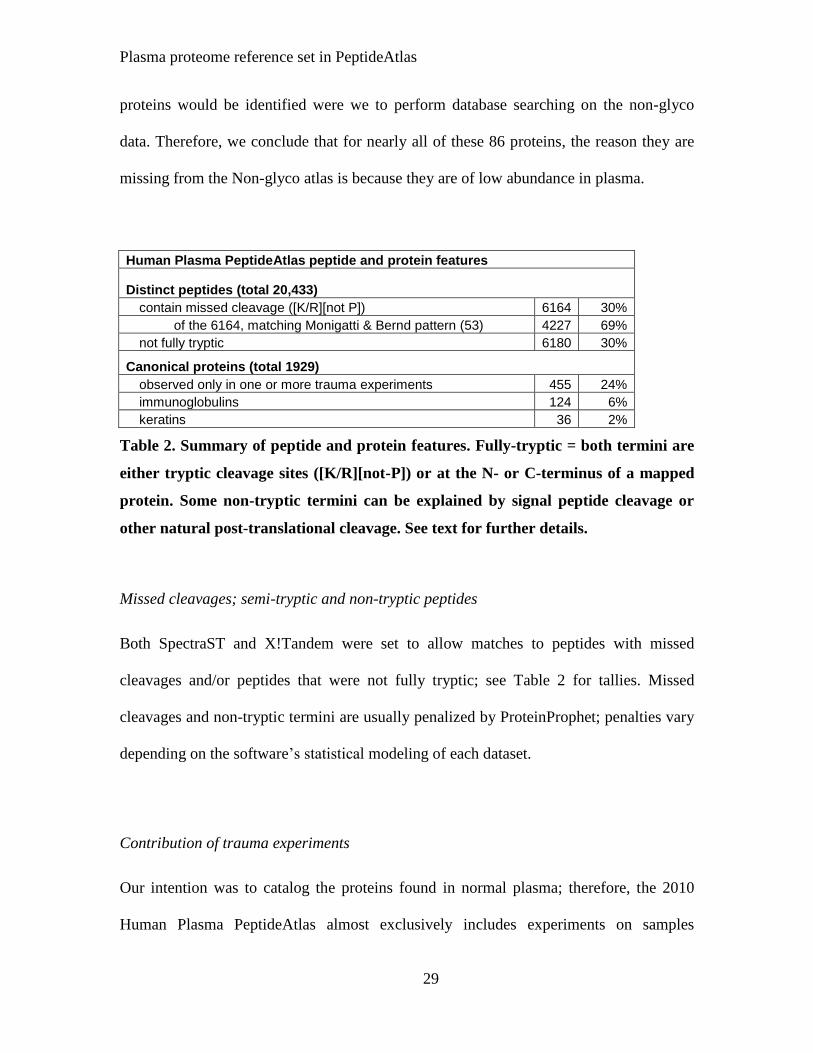
Human Plasma PeptideAtlas peptide and protein features
Distinct peptides (total 20,433)
contain missed cleavage ([K/R][not P]) 6164 30%
of the 6164, matching Monigatti & Bernd pattern (53) 4227 69%
not fully tryptic 6180 30%
Canonical proteins (total 1929)
observed only in one or more trauma experiments 455 24%
immunoglobulins 124 6%
keratins 36 2%
Table 2. Summary of peptide and protein features. Fully-tryptic = both termini are
either tryptic cleavage sites ([K/R][not-P]) or at the N- or C-terminus of a mapped
protein. Some non-tryptic termini can be explained by signal peptide cleavage or
other natural post-translational cleavage. See text for further details.
Missed cleavages; semi-tryptic and non-tryptic peptides
Both SpectraST and X!Tandem were set to allow matches to peptides with missed
cleavages and/or peptides that were not fully tryptic; see Table 2 for tallies. Missed
cleavages and non-tryptic termini are usually penalized by ProteinProphet; penalties vary
depending on the software’s statistical modeling of each dataset.
Contribution of trauma experiments
Our intention was to catalog the proteins found in normal plasma; therefore, the 2010
Human Plasma PeptideAtlas almost exclusively includes experiments on samples
Plasma proteome reference set in PeptideAtlas
30
originating from individuals with no known disease state or other unusual condition. Six
included experiments, however, were performed on a pool of six severe trauma patients
plus one healthy subject (20), and we found that 455, or 24%, of the canonical protein
sequences in the Atlas were observed only in one or more of these experiments and not in
any of the other 85, raising the question of whether these proteins are trauma-specific.
The 455 are all low abundance with at most 145 PSMs per protein; we believe that most
of these are difficult-to-detect proteins present in normal plasma, rather than trauma-
specific proteins, because of the advanced technology employed in the experiments
(depletion of the twelve most abundant plasma proteins; fractionation into cysteinyl and
non-cysteinyl peptides, glyco- and non-glycopeptide; separation of each fraction into 30
sub-fractions using strong cation exchange, analysis on a Thermo LTQ instrument),
which yielded nearly twice the peptide identifications per experiment when compared to
earlier experiments from the same lab (depletion of only six most abundant plasma
proteins and, in some cases, a less advanced instrument (Thermo LCQ) employed) (54).
Keratins and immunoglobulins
Some keratins are common contaminants in proteomic sample processing, and the
immunoglobulins are a very large class of plasma proteins consisting of similar
interchangeable subunits, so one may wish to omit these classes of protein sequences
from a plasma proteome reference set. We estimated the number of canonical protein
sequences that belong to these classes (Table 2) by counting those identified as
immunoglobulins or keratins in their descriptions, plus all those in the same protein group
as such a sequence. We counted all keratins, even those that are internal cytokeratins and
Plasma proteome reference set in PeptideAtlas
31
not skin contaminants. We did not count sequences annotated as immunoglobulin-like or
immunoglobulin-related. Omitting these immunoglobulins and keratins leaves 1769
canonical protein sequences not belonging to these classes.
Evidence for multiple splice isoforms and single nucleotide polymorphisms (SNPs)
The human section of Swiss-Prot is curated to contain one entry per protein-coding gene,
each with descriptions for known splice isoforms. There is only one Swiss-Prot entry for
which two splice isoforms exist in the canonical set, and it is only this protein, mannan-
binding lectin serine protease 1, which we confidently claim is present in more than one
splice isoform in human plasma. Twelve additional Swiss-Prot alternative splice isoforms
are noted as possibly-distinguished; we are less confident that these are present as
distinct isoforms because possibly-distinguished protein sequences have only a small
amount of peptide evidence distinguishing them from their canonical counterparts.
Further, 131 canonical protein sequences come from the IPI or Ensembl databases,
indicating that each includes at least one observed peptide that is not mappable to any
Swiss-Prot entry. These might represent SNPs or sequence errors (see IPI00887739 in
Complement C3 group in Supplementary Materials Figure S1 for an example), or
protein-coding genes or splice variants not described in Swiss-Prot.
Discussion
Composition and completeness of proteome reference set
Plasma proteome reference set in PeptideAtlas
32
Our set of 1929 canonical protein sequences, by far the largest published so far at this
confidence level, includes the highest concentration proteins as well as nearly complete
coverage of the phosphoproteome described in (55) (details in Table 3). Still, we believe
it is far from a complete catalog of the human plasma proteome. First, our reference set
and the MS-derived lists in Table 3 are all biased toward proteins that are readily
detectable by MS techniques; proteins missing from one list are likely to be missing in
the others, so coverage of the lists in Table 3 is not indicative of complete proteome
coverage.
Other evidence suggests we are not close to full coverage of even the LC-MS/MS-
observable proteome. Mayu analysis of the 5% protein FDR plasma atlas (see
Experimental Procedures) shows that at least 410 correct identifications are excluded
from the 1% protein FDR Human Plasma PeptideAtlas by its stringent FDR threshold.
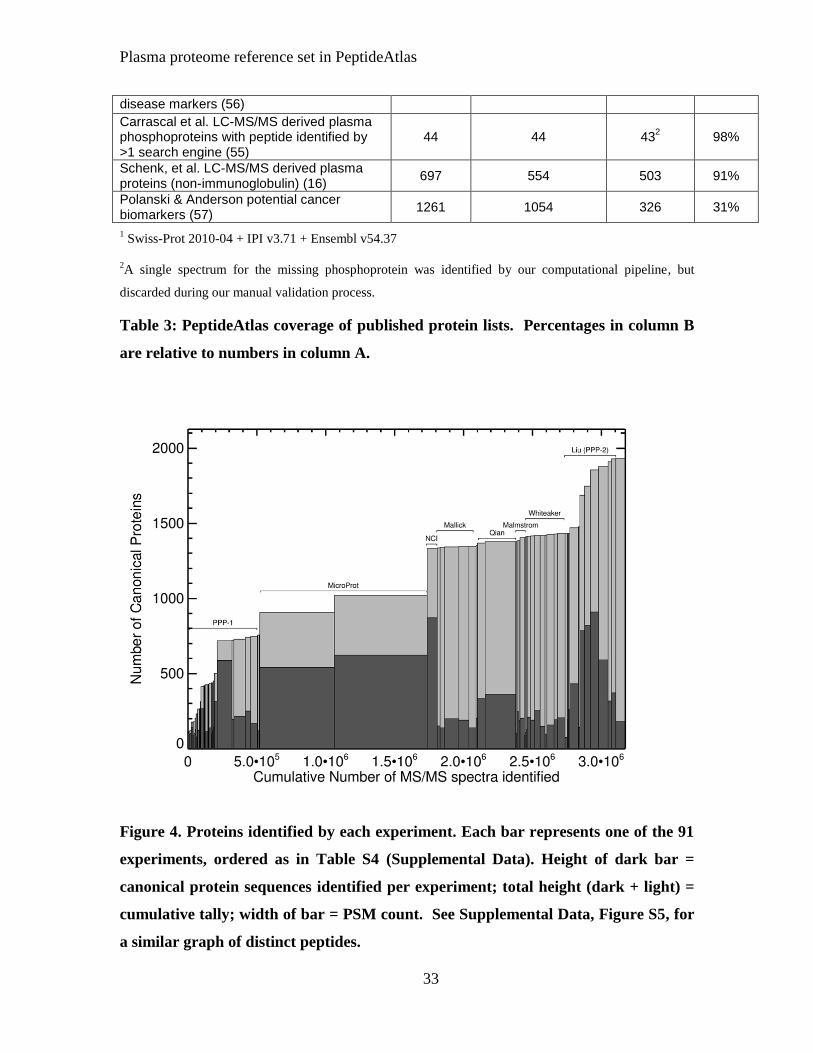
Figure 4, showing the accumulation of canonical proteins as additional identified MS/MS
spectra that were added to the Human Plasma PeptideAtlas, also suggests that we are not
near complete coverage. The PPP-I data contributed about 38% of the total canonical
proteins. Growth after PPP-1 was shallow, then jumped with the addition of experiments
employing extensive depletion and fractionation and high mass accuracy instruments (19,
20). The curve will asymptotically approach the total number of proteins detectable with
the techniques used, but is not yet nearing that limit.
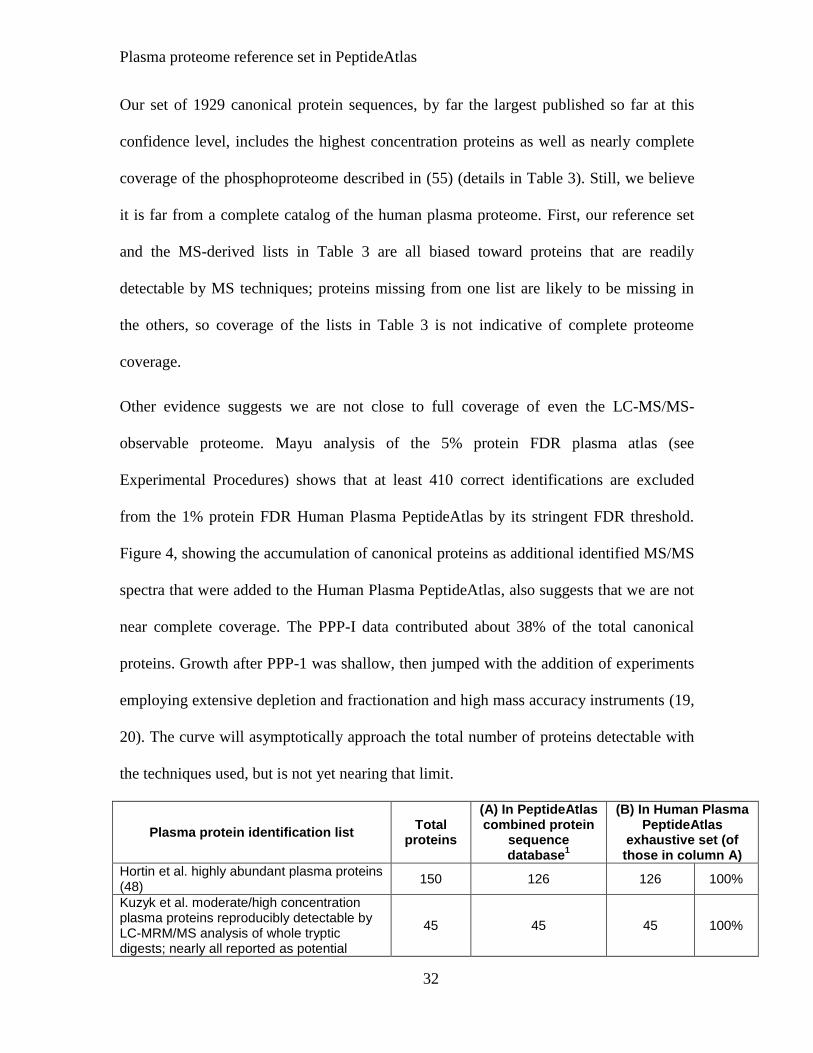
Plasma protein identification list Total
proteins
(A) In PeptideAtlas combined protein
sequence database
1
(B) In Human Plasma PeptideAtlas
exhaustive set (of those in column A)
Hortin et al. highly abundant plasma proteins (48)
150 126 126 100%
Kuzyk et al. moderate/high concentration plasma proteins reproducibly detectable by LC-MRM/MS analysis of whole tryptic digests; nearly all reported as potential
45 45 45 100%
Plasma proteome reference set in PeptideAtlas
33
disease markers (56)
Carrascal et al. LC-MS/MS derived plasma phosphoproteins with peptide identified by >1 search engine (55)
44 44 432 98%
Schenk, et al. LC-MS/MS derived plasma proteins (non-immunoglobulin) (16)
697 554 503 91%
Polanski & Anderson potential cancer biomarkers (57)
1261 1054 326 31%
1 Swiss-Prot 2010-04 + IPI v3.71 + Ensembl v54.37
2A single spectrum for the missing phosphoprotein was identified by our computational pipeline, but
discarded during our manual validation process.
Table 3: PeptideAtlas coverage of published protein lists. Percentages in column B
are relative to numbers in column A.
Figure 4. Proteins identified by each experiment. Each bar represents one of the 91
experiments, ordered as in Table S4 (Supplemental Data). Height of dark bar =
canonical protein sequences identified per experiment; total height (dark + light) =
cumulative tally; width of bar = PSM count. See Supplemental Data, Figure S5, for
a similar graph of distinct peptides.
Plasma proteome reference set in PeptideAtlas
34
In 2008, Schenk et al. published a plasma proteome reference set (16) of comparable
confidence to ours (see Supplemental Data, Comparison of confidence level with Schenk,
et al., for details). Of the 697 non-redundant, non-immunoglobulin protein identifiers in
(16), 51 are in our combined protein sequence database, but not in the Human Plasma
PeptideAtlas exhaustive set, meaning that we identified no peptides for them (see Table
S8, Supplemental Data). If the Schenk et al. data were added to the Human Plasma
PeptideAtlas, most or all of these would appear in the resulting canonical list. This
supports our conclusion that more data, preferably from different laboratories using
different sample sources, depletion techniques, and preparation techniques, will continue
to add significant numbers of high confidence protein sequences to the human plasma
proteome.
Because we searched the non-glycocapture data against a spectral library and not against
a sequence database, we only identified peptides that had been previously seen in LC-
MS/MS experiments and included in the NIST spectral library. However, the NIST
library is extremely comprehensive, including most of the human data in the PeptideAtlas
(from plasma and many other sources), so nearly all human-derived spectra identifiable
with a sequence search engine with standard parameters will be identified with our
spectral library search. Very few, if any, canonical proteins would be added to the Atlas
were we to incorporate sequence database search results (see Supplemental Data,
Completeness of spectra library searching, for analysis).
Multi-tiered protein identifications: Alternatives for comparison of datasets
Plasma proteome reference set in PeptideAtlas
35
As described under Experimental Procedures, we created our exhaustive identification set
by mapping all identified peptides to a combined protein sequence database containing
many sequences repeated identically or with only slight variations. Removing
redundancy from such a set is always a problem in interpreting proteomics data, and no
standard methods have been agreed upon.
In considering this issue, it is critical to understand that virtually no protein identification
list for a given dataset can be considered definitive. Once one eliminates exact duplicates,
the process of removing redundancy necessarily involves choices that are somewhat
arbitrary, as described in (58), and is at odds with the preservation of identifications
consistent with the data. In most cases, a highly non-redundant list is necessarily a model
or example list, each entry of which may represent several proteins that are as likely, or
almost as likely, to exist in the sample. In particular, we emphasize that we do not claim
to have definitive evidence for any of the specific isoforms in our canonical set; rather,
we claim that, for each protein sequence in the set, there exists either that protein or a
closely related one in at least one of the samples.
For some purposes, such as estimating the number of distinct proteins revealed by the
data, a highly non-redundant protein identification set is desired. For other purposes, such
as comparison with a non-redundant list for another proteome, filtering by molecular
weight or pI, or selection of peptides for SRM experiment design, redundancy is
desirable. As described in Experimental Procedures, we created several different protein
sequence sets that could be used, alone or in combination, for different purposes.
Multi-tiered schemes are not novel and have been implemented in many proteomics
studies. For example, the core dataset for PPP-I contained 3020 protein sequences, but
Plasma proteome reference set in PeptideAtlas
36
alternative threshold criteria were used to generate several other sets including a set of
889 protein sequences using very restrictive criteria with an adjustment for multiple
hypothesis testing (6), roughly analogous to our canonical set, and an unintegrated set of
15,710 protein sequences based on only a single peptide, roughly analogous to the
exhaustive set defined here.
With the current work, we make two contributions in this area. First, we present Cedar, a
protein identification classification scheme based on the freely-available ProteinProphet
and applicable to any search results that can be converted to mzML (59) or mzXML (23).
Protein identifications generated for different datasets using Cedar can be easily and
meaningfully compared against each other. Although software is not yet available to
automate Cedar, all steps except for the manual validation of single-PSM identifications
are clearly defined and reproducible, and we propose Cedar as a standard for the
community, including the HUPO Human Proteome Project.
Second, we assert that when evaluating the overlap between the protein identifications for
two proteomics datasets, it is essential to map to the same sequence databases and to
compare the highly non-redundant (Cedar’s canonical) set for one against the maximally
redundant (Cedar’s exhaustive) set for the other. Otherwise, the overlap will be under-
reported. For example, Schenk et al. reported that 242 of their 697 high confidence
identifications were found on the HUPO high-confidence list. We compared their
identifications against the exhaustive set for an atlas we built from most of the HUPO
PPP-I data (see Results, Single-PSM Protein Identifications) and found an overlap of 362
identifications, which is 50% more.
Plasma proteome reference set in PeptideAtlas
37
Spectral Counting
Spectral counting has allowed us to provide rough estimates for protein concentrations in
the Human Plasma PeptideAtlas down to 0.54 ng/mL, but even lower estimated
concentrations are achievable. By including about 100 times as many PSMs as currently
included, we could reach 7 x 10⁻³
ng/mL, the lowest concentration measured by antibody-
based methods in (40). See Supplemental Data, Completeness of spectral counting, for
analysis.
Estimated concentrations in ng/mL, along with uncertainty factors, are now available in
PeptideAtlas. Again, these are rough estimates and should not be mistaken as accurate
quantitative values. Experimentally measured concentrations from (40), (57), and (60) are
provided as well. We plan to apply this same spectral counting method to atlas builds for
other subproteomes such as human urine, mouse plasma, and various organ or cell type
datasets that we acquire. Our goal is to develop a quantitative PeptideAtlas reflecting
protein expression in multiple organs, cell types, and biofluids in health and disease.
Uses of the Human Plasma PeptideAtlas
Biomarker Discovery
Polanski and Anderson in 2006 (57) published a review of candidate cancer biomarkers
listing 1261 proteins believed to be differentially expressed in patients with various
cancers. Literature search revealed only 274 to be reported in plasma, but 326 appear in
the Human Plasma PeptideAtlas exhaustive set (Table 3), skewed toward lower
Plasma proteome reference set in PeptideAtlas
38
concentrations. Those identified in (46) as “high priority” for biomarker development
(about one-third of the 326) are listed in Supplemental Data, Table S9.
Experiment design for targeted proteomics
When a protein is observed in a sample that is analyzed with LC MS/MS techniques,
some of the protein’s peptides are observed many times, while others are not observed at
all, despite being in the observable mass range and otherwise having attributes consistent
with MS analysis (61, 62). Several algorithms that attempt to predict observability based
on sequence attributes have been put forward (39, 61, 63); these are heavily influenced by
the data with which they are trained. As noted in Experimental Procedures, for all
peptides in the Human Plasma PeptideAtlas, we calculated an empirical observability
score (EOS) that does not rely on prediction algorithms; however, it is highly dependent
on MS data collection parameters, including dynamic exclusion settings, as in (49).
Since shotgun-style experiments of complex samples will always miss many proteins,
especially low concentration proteins, a targeted approach in which the mass
spectrometer selects only peptides contained within specific proteins of interest should be
more successful, reproducible, and time efficient. Using the PeptideAtlas web interface,
one can select peptides based on the EOS and other attributes, such as number of
observations, number of protein mappings, missed cleavages, semi-tryptic, or multiple
genome locations, and present these as an inclusion list for the mass spectrometer.
PeptideAtlas includes several other features to support SRM experiment design. For
peptides belonging to proteins not yet observed in PeptideAtlas, observability scores
based on sequence attributes are calculated. When multiple spectra exist for the same
precursor ion, they are combined to generate a consensus spectrum that can be visualized
Plasma proteome reference set in PeptideAtlas
39
by the user. Transition lists can be generated automatically from these consensus spectra
according to user-specified rules. For absolute protein abundance measurements, the
estimated protein concentrations described above allow one to spike in synthetic
reference peptides at concentrations similar to those expected in the sample. These
features and others are described in (43). Finally, we and others are in the process of
systematically generating reference fragment ion spectra from synthetic peptide libraries
using the triple quadrupole instruments used for SRM measurements and we will make
these publicly accessible as verified transition sets (64), (65).
Conclusion
PeptideAtlas is an integral part of the ProteomeXchange infrastructure for HUPO
initiatives and other worldwide data submissions (figure published in (66)), together with
the ProteomeCommons.org Tranche distributed file-sharing system (67) and the EBI
PRIDE (68) database. PRIDE contains the investigators’ original datasets; PeptideAtlas
consolidates the raw data of individual studies into re-analyzed proteome reference sets.
A significant aspect of PPP-II is the establishment of a standard method for the
submission of data to the ProteomeXchange consortium. It is the policy of PPP-II that all
published plasma data be submitted to Tranche or PRIDE, from which it will be stored in
Tranche and incorporated into the PeptideAtlas.
The PeptideAtlas approach described here provides a framework for the continued
analysis of human and other complex proteomes. Soon, MS/MS data interpretation based
on translated genomes will be replaced by rich spectral libraries derived from both
natural and synthetic peptide information, which outperform current database searching
Plasma proteome reference set in PeptideAtlas
40
strategies. Already, there is a complete spectral database for the entire yeast proteome
(65) and mouse and human are being completed (Deutsch et al., in preparation;
Kusebauch, et al., in preparation).
The 2010 Human Plasma PeptideAtlas, a comprehensive collection of high-confidence
peptide and protein identifications, contains well over twice as many protein sequences as
any previous collection at a similar confidence level. With estimated concentrations and a
multi-tiered protein identification scheme, it is a useful resource for biomarker discovery
and SRM experiment design. Peptide identifications, protein identifications, estimated
concentrations, and raw data in mzXML (23) format are all offered freely to the public at
www.PeptideAtlas.org.
Acknowledgements
Many thanks to all those who contributed raw proteomics data to the Human Plasma
PeptideAtlas, including Phillip A. Wilmarth and Larry L. David of Oregon Health &
Science University; Wei-Jun Qian, Tao Liu and Richard Smith of Pacific Northwest
National Laboratory; Jeffrey R. Whiteaker of the Fred Hutchinson Cancer Research
Center, Manuel C. Peitsch of the University of Basel (formerly of Novartis), King C.
Chan, David A. Lucas, and Thomas P. Conrads of the National Cancer Institute, and all
participants in the PPP Phase I project (see (4)). Thanks to Rich Johnson for manual
spectrum evaluation, to Leigh Anderson for concentration data, and to Leigh Anderson
and Laura Beretta for critical review of the manuscript. This work has been funded in part
by the National Heart, Lung, and Blood Institute, National Institutes of Health, under
contract No. N01-HV-28179 and grants R44HG004537, PM50 GMO7U547/Center for

Plasma proteome reference set in PeptideAtlas
41
Systems Biology, NIH-NHGRI ARRA 1RC2HG005805-01, NIH U54 DA021519, NIH
1R01GM087221-01A2, grant 31003A_130530 from the Swiss National Science
Foundation, European Research Council (grant #ERC-2008-AdG 233226), and the
Systems Biology Initiative of the Grand Duchy of Luxembourg.
Plasma proteome reference set in PeptideAtlas
42
References
1. Putnam, F. W., ed. (1975-1989) The Plasma Proteins, 2nd Ed., Academic Press, New
York.
2. Anderson, N. L., and Anderson, N. G. (2002) The human plasma proteome: history,
character, and diagnostic prospects. Mol Cell Proteomics 1, 845-867.
3. Kersey, P. J., Duarte, J., Williams, A., Karavidopoulou, Y., Birney, E., and Apweiler,
R. (2004) The International Protein Index: an integrated database for proteomics
experiments. Proteomics 4, 1985-1988.
4. Omenn, G. S., States, D. J., Adamski, M., Blackwell, T. W., Menon, R., Hermjakob,
H., Apweiler, R., Haab, B. B., Simpson, R. J., Eddes, J. S., Kapp, E. A., Moritz,
R. L., Chan, D. W., Rai, A. J., Admon, A., Aebersold, R., Eng, J., Hancock, W.
S., Hefta, S. A., Meyer, H., Paik, Y. K., Yoo, J. S., Ping, P., Pounds, J., Adkins,
J., Qian, X., Wang, R., Wasinger, V., Wu, C. Y., Zhao, X., Zeng, R., Archakov,
A., Tsugita, A., Beer, I., Pandey, A., Pisano, M., Andrews, P., Tammen, H.,
Speicher, D. W., and Hanash, S. M. (2005) Overview of the HUPO Plasma
Proteome Project: results from the pilot phase with 35 collaborating laboratories
and multiple analytical groups, generating a core dataset of 3020 proteins and a
publicly-available database. Proteomics 5, 3226-3245.
5. Omenn, G., Editor (2006) Exploring the Human Plasma Proteome, Wiley-VCH, New
York, NY.
6. States, D. J., Omenn, G. S., Blackwell, T. W., Fermin, D., Eng, J., Speicher, D. W.,
and Hanash, S. M. (2006) Challenges in deriving high-confidence protein
identifications from data gathered by a HUPO plasma proteome collaborative
study. Nat Biotechnol 24, 333-338.
7. Anderson, N. L., Polanski, M., Pieper, R., Gatlin, T., Tirumalai, R. S., Conrads, T. P.,
Veenstra, T. D., Adkins, J. N., Pounds, J. G., Fagan, R., and Lobley, A. (2004)
The human plasma proteome: a nonredundant list developed by combination of
four separate sources. Mol Cell Proteomics 3, 311-326.
8. Pieper, R., Gatlin, C. L., Makusky, A. J., Russo, P. S., Schatz, C. R., Miller, S. S., Su,
Q., McGrath, A. M., Estock, M. A., Parmar, P. P., Zhao, M., Huang, S. T., Zhou,
J., Wang, F., Esquer-Blasco, R., Anderson, N. L., Taylor, J., and Steiner, S.
(2003) The human serum proteome: display of nearly 3700 chromatographically
separated protein spots on two-dimensional electrophoresis gels and identification
of 325 distinct proteins. Proteomics 3, 1345-1364.
9. Adkins, J. N., Varnum, S. M., Auberry, K. J., Moore, R. J., Angell, N. H., Smith, R.
D., Springer, D. L., and Pounds, J. G. (2002) Toward a human blood serum
proteome: analysis by multidimensional separation coupled with mass
spectrometry. Mol Cell Proteomics 1, 947-955.
10. Tirumalai, R. S., Chan, K. C., Prieto, D. A., Issaq, H. J., Conrads, T. P., and
Veenstra, T. D. (2003) Characterization of the low molecular weight human
serum proteome. Mol Cell Proteomics 2, 1096-1103.
11. Shen, Y., Jacobs, J. M., Camp, D. G., 2nd, Fang, R., Moore, R. J., Smith, R. D.,
Xiao, W., Davis, R. W., and Tompkins, R. G. (2004) Ultra-high-efficiency strong
cation exchange LC/RPLC/MS/MS for high dynamic range characterization of
the human plasma proteome. Anal Chem 76, 1134-1144.
Plasma proteome reference set in PeptideAtlas
43
12. Chan, K. C., Lucas, D. A., Hise, D., and al., e. (2004) Serum/Plasma Proteome.
Clinical Proteomics 1, 101-225.
13. Keller, A., Eng, J., Zhang, N., Li, X. J., and Aebersold, R. (2005) A uniform
proteomics MS/MS analysis platform utilizing open XML file formats. Mol Syst
Biol 1, 2005 0017.
14. Deutsch, E. W., Eng, J. K., Zhang, H., King, N. L., Nesvizhskii, A. I., Lin, B., Lee,
H., Yi, E. C., Ossola, R., and Aebersold, R. (2005) Human Plasma PeptideAtlas.
Proteomics 5, 3497-3500.
15. Keller, A., Nesvizhskii, A. I., Kolker, E., and Aebersold, R. (2002) Empirical
statistical model to estimate the accuracy of peptide identifications made by
MS/MS and database search. Anal Chem 74, 5383-5392.
16. Schenk, S., Schoenhals, G. J., de Souza, G., and Mann, M. (2008) A high confidence,
manually validated human blood plasma protein reference set. BMC Med
Genomics 1, 41.
17. Qian, W. J., Monroe, M. E., Liu, T., Jacobs, J. M., Anderson, G. A., Shen, Y.,
Moore, R. J., Anderson, D. J., Zhang, R., Calvano, S. E., Lowry, S. F., Xiao, W.,
Moldawer, L. L., Davis, R. W., Tompkins, R. G., Camp, D. G., 2nd, and Smith,
R. D. (2005) Quantitative proteome analysis of human plasma following in vivo
lipopolysaccharide administration using 16O/18O labeling and the accurate mass
and time tag approach. Mol Cell Proteomics 4, 700-709.
18. Whiteaker, J. R., Zhang, H., Eng, J. K., Fang, R., Piening, B. D., Feng, L. C.,
Lorentzen, T. D., Schoenherr, R. M., Keane, J. F., Holzman, T., Fitzgibbon, M.,
Lin, C., Zhang, H., Cooke, K., Liu, T., Camp, D. G., 2nd, Anderson, L., Watts, J.,
Smith, R. D., McIntosh, M. W., and Paulovich, A. G. (2007) Head-to-head
comparison of serum fractionation techniques. J Proteome Res 6, 828-836.
19. Liu, T., Qian, W. J., Gritsenko, M. A., Camp, D. G., 2nd, Monroe, M. E., Moore, R.
J., and Smith, R. D. (2005) Human plasma N-glycoproteome analysis by
immunoaffinity subtraction, hydrazide chemistry, and mass spectrometry. J
Proteome Res 4, 2070-2080.
20. Liu, T., Qian, W. J., Gritsenko, M. A., Xiao, W., Moldawer, L. L., Kaushal, A.,
Monroe, M. E., Varnum, S. M., Moore, R. J., Purvine, S. O., Maier, R. V., Davis,
R. W., Tompkins, R. G., Camp, D. G., 2nd, and Smith, R. D. (2006) High
dynamic range characterization of the trauma patient plasma proteome. Mol Cell
Proteomics 5, 1899-1913.
21. Armandola, E. A. (2003) Proteome profiling in body fluids and in cancer cell
signaling. MedGenMed 5, 18.
22. Zhang, H., Yi, E. C., Li, X.-j., Mallick, P., Kelly-Spratt, K. S., Masselon, C. D., D.
G. Camp, I., Smith, R. D., Kemp, C. J., and Aebersold, R. (2005) High
Throughput Quantitative Analysis of Serum Proteins Using Glycopeptide Capture
and Liquid Chromatography Mass Spectrometry. Mol. Cell. Proteomics 4, 144-
155.
23. Pedrioli, P. G., Eng, J. K., Hubley, R., Vogelzang, M., Deutsch, E. W., Raught, B.,
Pratt, B., Nilsson, E., Angeletti, R. H., Apweiler, R., Cheung, K., Costello, C. E.,
Hermjakob, H., Huang, S., Julian, R. K., Kapp, E., McComb, M. E., Oliver, S. G.,
Omenn, G., Paton, N. W., Simpson, R., Smith, R., Taylor, C. F., Zhu, W., and
Plasma proteome reference set in PeptideAtlas
44
Aebersold, R. (2004) A common open representation of mass spectrometry data
and its application to proteomics research. Nat Biotechnol 22, 1459-1466.
24. Lam, H., Deutsch, E. W., Eddes, J. S., Eng, J. K., King, N., Stein, S. E., and
Aebersold, R. (2007) Development and validation of a spectral library searching
method for peptide identification from MS/MS. Proteomics 7, 655-667.
25. NIST Peptide Mass Spectral Libraries, http://peptide.nist.gov. National Institute of
Standards and Technology.
26. Lam, H., Deutsch, E. W., and Aebersold, R. (2010) Artificial decoy spectral libraries
for false discovery rate estimation in spectral library searching in proteomics. J
Proteome Res 9, 605-610.
27. Shteynberg, D., Deutsch, E., Lam, H., Eng, J., Sun, Z., Tasman, N., Mendoza, L.,
Moritz, R. L., Aebersold, R., and Nesvizhskii, A. I. (submitted) iProphet:
Improved statistical validation of peptide identifications in shotgun proteomics.
Mol Cell Proteomics.
28. Boutet, E., Lieberherr, D., Tognolli, M., Schneider, M., and Bairoch, A. (2007)
UniProtKB/Swiss-Prot. Methods Mol Biol 406, 89-112.
29. Boeckmann, B., Bairoch, A., Apweiler, R., Blatter, M. C., Estreicher, A., Gasteiger,
E., Martin, M. J., Michoud, K., O'Donovan, C., Phan, I., Pilbout, S., and
Schneider, M. (2003) The SWISS-PROT protein knowledgebase and its
supplement TrEMBL in 2003. Nucleic Acids Res 31, 365-370.
30. Hubbard, T. J., Aken, B. L., Ayling, S., Ballester, B., Beal, K., Bragin, E., Brent, S.,
Chen, Y., Clapham, P., Clarke, L., Coates, G., Fairley, S., Fitzgerald, S.,
Fernandez-Banet, J., Gordon, L., Graf, S., Haider, S., Hammond, M., Holland, R.,
Howe, K., Jenkinson, A., Johnson, N., Kahari, A., Keefe, D., Keenan, S.,
Kinsella, R., Kokocinski, F., Kulesha, E., Lawson, D., Longden, I., Megy, K.,
Meidl, P., Overduin, B., Parker, A., Pritchard, B., Rios, D., Schuster, M., Slater,
G., Smedley, D., Spooner, W., Spudich, G., Trevanion, S., Vilella, A., Vogel, J.,
White, S., Wilder, S., Zadissa, A., Birney, E., Cunningham, F., Curwen, V.,
Durbin, R., Fernandez-Suarez, X. M., Herrero, J., Kasprzyk, A., Proctor, G.,
Smith, J., Searle, S., and Flicek, P. (2009) Ensembl 2009. Nucleic Acids Res 37,
D690-697.
31. cRAP, Common Repository of Adventitious Proteins; http://www.thegpm.org/cRAP.
32. Reiter, L., Claassen, M., Schrimpf, S. P., Jovanovic, M., Schmidt, A., Buhmann, J.
M., Hengartner, M. O., and Aebersold, R. (2009) Protein identification false
discovery rates for very large proteomics data sets generated by tandem mass
spectrometry. Mol Cell Proteomics 8, 2405-2417.
33. Nesvizhskii, A. I., Keller, A., Kolker, E., and Aebersold, R. (2003) A statistical
model for identifying proteins by tandem mass spectrometry. Anal Chem 75,
4646-4658.
34. The Uniprot Consortium (2009) The Universal Protein Resource (UniProt) 2009.
Nucleic Acids Res 37, D169-174.
35. Zhang, H., Li, X. J., Martin, D. B., and Aebersold, R. (2003) Identification and
quantification of N-linked glycoproteins using hydrazide chemistry, stable isotope
labeling and mass spectrometry. Nat Biotechnol 21, 660-666.
36. Craig, R., and Beavis, R. C. (2004) TANDEM: matching proteins with tandem mass
spectra. Bioinformatics 20, 1466-1467.
Plasma proteome reference set in PeptideAtlas
45
37. Atwood, J. A., 3rd, Sahoo, S. S., Alvarez-Manilla, G., Weatherly, D. B., Kolli, K.,
Orlando, R., and York, W. S. (2005) Simple modification of a protein database
for mass spectral identification of N-linked glycopeptides. Rapid Commun Mass
Spectrom 19, 3002-3006.
38. Liu, H., Sadygov, R. G., and Yates, J. R., 3rd (2004) A model for random sampling
and estimation of relative protein abundance in shotgun proteomics. Anal Chem
76, 4193-4201.
39. Lu, P., Vogel, C., Wang, R., Yao, X., and Marcotte, E. M. (2007) Absolute protein
expression profiling estimates the relative contributions of transcriptional and
translational regulation. Nat Biotechnol 25, 117-124.
40. Haab, B. B., Geierstanger, B. H., Michailidis, G., Vitzthum, F., Forrester, S., Okon,
R., Saviranta, P., Brinker, A., Sorette, M., Perlee, L., Suresh, S., Drwal, G.,
Adkins, J. N., and Omenn, G. S. (2005) Immunoassay and antibody microarray
analysis of the HUPO Plasma Proteome Project reference specimens: systematic
variation between sample types and calibration of mass spectrometry data.
Proteomics 5, 3278-3291.
41. Old, W. M., Meyer-Arendt, K., Aveline-Wolf, L., Pierce, K. G., Mendoza, A.,
Sevinsky, J. R., Resing, K. A., and Ahn, N. G. (2005) Comparison of label-free
methods for quantifying human proteins by shotgun proteomics. Mol Cell
Proteomics 4, 1487-1502.
42. Kapp, E. A., Schutz, F., Reid, G. E., Eddes, J. S., Moritz, R. L., O'Hair, R. A., Speed,
T. P., and Simpson, R. J. (2003) Mining a tandem mass spectrometry database to
determine the trends and global factors influencing peptide fragmentation. Anal
Chem 75, 6251-6264.
43. Deutsch, E. W., Lam, H., and Aebersold, R. (2008) PeptideAtlas: a resource for
target selection for emerging targeted proteomics workflows. EMBO Rep 9, 429-
434.
44. Shen, Y., Tolic, N., Hixson, K. K., Purvine, S. O., Pasa-Tolic, L., Qian, W. J.,
Adkins, J. N., Moore, R. J., and Smith, R. D. (2008) Proteome-wide identification
of proteins and their modifications with decreased ambiguities and improved false
discovery rates using unique sequence tags. Anal Chem 80, 1871-1882.
45. Craig, W. Y., Ledue, T.B., Ritchie, R.F. (2001) Plasma Proteins: Clinical Utility and
Interpretation, Foundation for Blood Research, Scarborough, ME.
46. Ishihama, Y., Oda, Y., Tabata, T., Sato, T., Nagasu, T., Rappsilber, J., and Mann, M.
(2005) Exponentially modified protein abundance index (emPAI) for estimation
of absolute protein amount in proteomics by the number of sequenced peptides
per protein. Mol Cell Proteomics 4, 1265-1272.
47. Shen, Z., Want, E. J., Chen, W., Keating, W., Nussbaumer, W., Moore, R., Gentle, T.
M., and Siuzdak, G. (2006) Sepsis plasma protein profiling with
immunodepletion, three-dimensional liquid chromatography tandem mass
spectrometry, and spectrum counting. J Proteome Res 5, 3154-3160.
48. Hortin, G. L., Sviridov, D., and Anderson, N. L. (2008) High-abundance
polypeptides of the human plasma proteome comprising the top 4 logs of
polypeptide abundance. Clin Chem 54, 1608-1616.
Plasma proteome reference set in PeptideAtlas
46
49. Zhang, Y., Wen, Z., Washburn, M. P., and Florens, L. (2009) Effect of dynamic
exclusion duration on spectral count based quantitative proteomics. Anal Chem
81, 6317-6326.
50. Gundry, R. L., Fu, Q., Jelinek, C. A., Van Eyk, J. E., and Cotter, R. J. (2007)
Investigation of an albumin-enriched fraction of human serum and its
albuminome. Proteomics Clin Appl 1, 73-88.
51. Na, N., Ouyang, J., Taes, Y. E., and Delanghe, J. R. (2005) Serum free hemoglobin
concentrations in healthy individuals are related to haptoglobin type. Clin Chem
51, 1754-1755.
52. (2006) The Merck Manual of Diagnosis and Therapy, 18th Ed., Merck Research
Laboratories, Whitehouse Station, NJ.
53. Monigatti, F., and Berndt, P. (2005) Algorithm for accurate similarity measurements
of peptide mass fingerprints and its application. J Am Soc Mass Spectrom 16, 13-
21.
54. Liu, T., Qian, W. J., Strittmatter, E. F., Camp, D. G., 2nd, Anderson, G. A., Thrall,
B. D., and Smith, R. D. (2004) High-throughput comparative proteome analysis
using a quantitative cysteinyl-peptide enrichment technology. Anal Chem 76,
5345-5353.
55. Carrascal, M., Gay, M., Ovelleiro, D., Casas, V., Gelpi, E., and Abian, J.
Characterization of the human plasma phosphoproteome using linear ion trap
mass spectrometry and multiple search engines. J Proteome Res 9, 876-884.
56. Kuzyk, M. A., Smith, D., Yang, J., Cross, T. J., Jackson, A. M., Hardie, D. B.,
Anderson, N. L., and Borchers, C. H. (2009) Multiple reaction monitoring-based,
multiplexed, absolute quantitation of 45 proteins in human plasma. Mol Cell
Proteomics 8, 1860-1877.
57. Polanski, M., and Anderson, N. L. (2006) A List of Candidate Cancer Biomarkers for
Targeted Proteomics. Biomarker Insights 1, 1-48.
58. Adamski, M., Blackwell, T., Menon, R., Martens, L., Hermjakob, H., Taylor, C.,
Omenn, G. S., and States, D. J. (2005) Data management and preliminary data
analysis in the pilot phase of the HUPO Plasma Proteome Project. Proteomics 5,
3246-3261.
59. Deutsch, E. (2008) mzML: a single, unifying data format for mass spectrometer
output. Proteomics 8, 2776-2777.
60. Anderson, N. L. (2007) private communication.
61. Mallick, P., Schirle, M., Chen, S. S., Flory, M. R., Lee, H., Martin, D., Ranish, J.,
Raught, B., Schmitt, R., Werner, T., Kuster, B., and Aebersold, R. (2007)
Computational prediction of proteotypic peptides for quantitative proteomics. Nat
Biotechnol 25, 125-131.
62. Kuster, B., Schirle, M., Mallick, P., and Aebersold, R. (2005) Scoring proteomes
with proteotypic peptide probes. Nat Rev Mol Cell Biol 6, 577-583.
63. Tang, H., Arnold, R. J., Alves, P., Xun, Z., Clemmer, D. E., Novotny, M. V., Reilly,
J. P., and Radivojac, P. (2006) A computational approach toward label-free
protein quantification using predicted peptide detectability. Bioinformatics 22,
e481-488.
Plasma proteome reference set in PeptideAtlas
47
64. Picotti, P., Rinner, O., Stallmach, R., Dautel, F., Farrah, T., Domon, B., Wenschuh,
H., and Aebersold, R. High-throughput generation of selected reaction-monitoring
assays for proteins and proteomes. Nat Methods 7, 43-46.
65. Picotti, P., Lam, H., Campbell, D., Deutsch, E., Roest, H., Sun, Z., Rinner, O.,
Schmidt, A., Shen, Q., Frei, A., Wollscheid, B., and Aebersold, R. (submitted) A
complete mass spectrometric reference map for the analysis of the yeast
proteome. Nature.
66. Omenn, G. S., Aebersold, R., and Paik, Y. K. (2009) 7(th) HUPO World Congress of
Proteomics: launching the second phase of the HUPOPlasma Proteome Project
(PPP-2) 16-20 August 2008, Amsterdam, The Netherlands. Proteomics 9, 4-6.
67. Falkner, J. A., and Andrews, P. C. (2007) Tranche: Secure Decentralized Data
Storage for the Proteomics Community. Journal of Biomolecular Techniques 18,
3.
68. Vizcaino, J. A., Cote, R., Reisinger, F., Foster, J. M., Mueller, M., Rameseder, J.,
Hermjakob, H., and Martens, L. (2009) A guide to the Proteomics Identifications
Database proteomics data repository. Proteomics 9, 4276-4283.
69. Hamilton, J. A., and Benson, M. D. (2001) Transthyretin: a review from a structural
perspective. Cell Mol Life Sci 58, 1491-1521.
70. Sato, T., Susuki, S., Suico, M. A., Miyata, M., Ando, Y., Mizuguchi, M., Takeuchi,
M., Dobashi, M., Shuto, T., and Kai, H. (2007) Endoplasmic reticulum quality
control regulates the fate of transthyretin variants in the cell. EMBO J 26, 2501-
2512.