a high-quality reference panel reveals the complexity … · a high-quality reference panel reveals...
TRANSCRIPT

A high-quality reference panel reveals the complexity and
distribution of structural genome changes in a human population
Jayne Y. Hehir-Kwa1,*, Tobias Marschall2,3,*, Wigard P. Kloosterman4,*, Laurent C.
Francioli4,5,6, Jasmijn A. Baaijens7, Louis J. Dijkstra7, Abdel Abdellaoui8, Vyacheslav Koval9,
Djie Tjwan Thung1, René Wardenaar10,11, Ivo Renkens4, Bradley P. Coe12, Patrick Deelen13,
Joep de Ligt4, Eric-Wubbo Lameijer14, Freerk van Dijk13,15, Fereydoun Hormozdiari12, The
Genome of the Netherlands Consortium16, André G. Uitterlinden9,17, Evan E. Eichler12, Paul
I.W. de Bakker4,18, Morris A. Swertz15, Cisca Wijmenga13, Gert-Jan B. van Ommen14, P. Eline
Slagboom19, Dorret I. Boomsma8, Alexander Schönhuth7,#, Kai Ye20,#, Victor Guryev10,#
1 Department of Human Genetics, Donders Institute, Radboud University Medical Center,
Nijmegen, 6525GA, The Netherlands.
2 Center for Bioinformatics, Saarland University, Saarbrücken, 66123, Germany
3 Max-Planck-Institute for Informatics, Saarbrücken, 66123, Germany
4 Center for Molecular Medicine, Division Biomedical Genetics, University Medical Center
Utrecht, Utrecht, 3584 CG, The Netherlands
5 Analytic and Translational Genetics Unit, Massachusetts General Hospital, Boston,
MA02114, USA; The Broad Institute, Cambridge, MA02142, USA
6 Program in Medical and Population Genetics, Broad Institute of Harvard and
Massachusetts Institute of Technology, Cambridge, MA02142, USA
7 Life Sciences Group, Centrum Wiskunde & Informatica, Amsterdam, 1098XG, The
Netherlands
8 Department of Biological Psychology, Vrije Universiteit Amsterdam, Amsterdam, 1081BT,
The Netherlands
9 Department of Internal Medicine, Erasmus Medical Center, Rotterdam, 3000CA, The
Netherlands
10 European Research Institute for the Biology of Ageing, University of Groningen,
University Medical Center Groningen, Groningen, 9713AD, The Netherlands
.CC-BY-ND 4.0 International licenseIt is made available under a (which was not peer-reviewed) is the author/funder, who has granted bioRxiv a license to display the preprint in perpetuity.
The copyright holder for this preprint. http://dx.doi.org/10.1101/036897doi: bioRxiv preprint first posted online Jan. 18, 2016;
11 Groningen Bioinformatics Centre, University of Groningen, Groningen, 9747AG, The
Netherlands
12 Department of Genome Sciences and Howard Hughes Medical Institute, University of
Washington, Seattle, 98105, USA
13 University of Groningen, University Medical Center Groningen, Department of Genetics,
Groningen, 9700RB, The Netherlands
14 Department of Human Genetics, Leiden University Medical Center, Leiden, 2300RC,
The Netherlands
15 Genomics Coordination Center, University of Groningen, University Medical Center
Groningen, Groningen, 9700RB, The Netherlands
16 A complete list of consortium authors appears at the end of this article
17 Department of Epidemiology, Erasmus Medical Center, Rotterdam, 3000CA, The
Netherlands
18 Department of Epidemiology, Julius Center for Health Sciences and Primary Care,
University Medical Center Utrecht, Utrecht, 3584CG, The Netherlands
19 Department of Medical Statistics and Bioinformatics, Leiden University Medical Center,
Leiden, 2300RC, The Netherlands
20 The Genome Institute, Washington University, St. Louis, MO 63108, USA
* These authors contributed equally
# Corresponding Authors:
Alexander Schönhuth, Centrum Wiskunde. & Informatica, Amsterdam, 1098XG, The
Netherlands. E-mail: [email protected]
Kai Ye, The Genome Institute, Washington University, St. Louis, MO 63108, USA. Present
address: The school of Electronic and Information Engineering, The First Affiliated Hospital of
Xi'an Jiaotong University, 710049, P.R.China. E-mail: [email protected]
Victor Guryev, European Research Institute for the Biology of Ageing, University of
Groningen, University Medical Center Groningen, Groningen, 9713AD, The Netherlands. E-
mail: [email protected]
.CC-BY-ND 4.0 International licenseIt is made available under a (which was not peer-reviewed) is the author/funder, who has granted bioRxiv a license to display the preprint in perpetuity.
The copyright holder for this preprint. http://dx.doi.org/10.1101/036897doi: bioRxiv preprint first posted online Jan. 18, 2016;
Abstract
Structural variation (SV) represents a major source of differences between individual
human genomes and has been linked to disease phenotypes. However, the majority of
studies provide neither a global view of the full spectrum of these variants nor integrate them
into reference panels of genetic variation.
Here, we analyse whole genome sequencing data of 769 individuals from 250 Dutch
families, and provide a haplotype-resolved map of 1.9 million genome variants across 9
different variant classes, including novel forms of complex indels, and retrotransposition-
mediated insertions of mobile elements and processed RNAs. A large proportion are
previously under reported variants sized between 21 and 100bp. We detect 4 megabases of
novel sequence, encoding 11 new transcripts. Finally, we show 191 known, trait-associated
SNPs to be in strong linkage disequilibrium with SVs and demonstrate that our panel
facilitates accurate imputation of SVs in unrelated individuals. Our findings are essential for
genome-wide association studies.
.CC-BY-ND 4.0 International licenseIt is made available under a (which was not peer-reviewed) is the author/funder, who has granted bioRxiv a license to display the preprint in perpetuity.
The copyright holder for this preprint. http://dx.doi.org/10.1101/036897doi: bioRxiv preprint first posted online Jan. 18, 2016;
Introduction
Comprehensive catalogs of genetic variation are fundamental building blocks in studies of
population and demographic history, variant formation and genotype-phenotype association.
To obtain insights in ancestry and linkage disequilibrium of polymorphic sites it is imperative
that such catalogs are haplotype-resolved (phased). Crucial improvements in accuracy and
power can be achieved through population-specific panels1,2. However, current reference
panels contain single nucleotide polymorphisms (SNPs), insertions and deletions of up to
20bp in length (indels) but only a very limited number of structural variants (SVs) larger than
50bp in size3,4. There is ample evidence that SV's play a major role in evolution and disease5–
9. Therefore, despite posing substantial technical and methodological challenges with respect
to discovery, genotyping and phasing of such SV variants, the integration of SVs into
reference panels is crucial for a broad spectrum of studies10,11.
Recently several population-scale sequencing projects have been undertaken aimed at
capturing global genetic diversity12–15. In addition, a number of projects have focused on
single populations attempting to capture the genetic variability of sociologically and/or
historically coherent groups of people for specific variant types15–18. For example the UK10K
project, which aims at capturing rare variants, comprising SNPs, indels and large deletions
used ~7x whole-genome and ~80x whole-exome sequencing of nearly 10,000 individuals17. A
similar subset of variant types were included in the Malay and the Danish genome
sequencing projects which both used high coverage (30-50x), focusing on rare variants that
characterize the population18, de novo variants and the assembly of novel sequence16.
One of the primary goals of the Genome of the Netherlands (GoNL) project1,19 was to
characterize whole-genome variation in the Dutch population. Our initial reports focused on a
whole-genome catalog of SNVs, small insertions/deletions, and unphased SV deletion
events20,21. Here, we focus on discovery, genotyping and phasing the full spectrum of
structural variants to generate a high-quality SV-integrated, haplotype-resolved reference
panel by exploiting two key features of the GoNL project design. First, sufficient coverage
(14.5x median base coverage, 38.4x median physical coverage) allows for enhanced
.CC-BY-ND 4.0 International licenseIt is made available under a (which was not peer-reviewed) is the author/funder, who has granted bioRxiv a license to display the preprint in perpetuity.
The copyright holder for this preprint. http://dx.doi.org/10.1101/036897doi: bioRxiv preprint first posted online Jan. 18, 2016;
genotyping including SVs, as was recently described18,22,23. Second, the 769 GoNL individuals
originate from parent-offspring families (231 trios and 19 families in which twin pairs are
included in the offspring generation), yielding family-based high quality haplotypes across
substantially longer ranges in comparison to statistically phased unrelated individuals24,25. In
addition to creating a haplotype resolved panel, we report several currently underreported
variant types, such as deletions 21 – 100bp in size, complex indels, inversions, mobile
element insertions (MEIs), large replacements and insertions of new genomic sequence26.
.CC-BY-ND 4.0 International licenseIt is made available under a (which was not peer-reviewed) is the author/funder, who has granted bioRxiv a license to display the preprint in perpetuity.
The copyright holder for this preprint. http://dx.doi.org/10.1101/036897doi: bioRxiv preprint first posted online Jan. 18, 2016;
Results
Detection of structural variation. We analyzed Illumina whole genome sequencing data
derived from 250 parent-offspring families (769 individuals) from the Dutch population to
detect structural variants and indels (non-SNVs) using 12 different variant detection tools
representing 5 algorithmic approaches (gapped alignment and split-read mapping, discordant
read pair, read depth and de novo genome assembly), Figure 1A, Supplementary Table 1.
The results from the different detection tools were combined into a consensus set containing
9 different forms of SVs and indels (simple indels, complex indels, deletions, duplications,
inversions, MEIs, interchromosomal breakpoints, novel segments and large replacements).
Compared to multiple public data resources1,14,26–28, 13.6% of all (simple and complex) indels
and 38% of SVs we report are novel (Table 1). To show the specificity of our structural variant
predictions, we selected a representative set of candidates across all 9 variant types and
performed an independent experimental validation using PCR-amplification across the variant
breakpoints followed by Sanger or Illumina MiSeq sequencing (Supplementary Table 2).
This yielded a confirmation rate for each variant class of between 80% to 98.6% with the
exception of inversions (64.5%), which failed to produce a PCR product in 35.5% of the cases
(Table 1). The high rate of PCR failures for inversions might either be a result of false
positives, or stem from poor performance of PCR assays, given the frequent occurrence of
repetitive and complex sequences at inversion breakpoints.
Deletions and insertions. We first focused our analysis on deletions and insertions of
DNA sequence relative to the reference assembly. This revealed 646,011 short insertions (1-
20bp), 1,093,289 short deletions (1-20bp), 24,167 mid-sized deletions (21-100bp) and 19,840
larger deletions (101bp – 1,467kb) of which the majority (99,8%) could be genotyped (Table1,
Figure 1B). We observed an increased number of deletions with size ranges corresponding
to SINE and LINE retrotransposition events (Figure 2, Supplementary Fig. 1). A substantial
fraction of the simple indels (11.5%), mid-sized deletions (21.6%) and 41.9% of larger
deletions were novel. Of the previously known mid-sized deletions, 79.2% were present solely
in our previous GoNL release and in no other call set, emphasizing that this size class has
been previously under-investigated.
.CC-BY-ND 4.0 International licenseIt is made available under a (which was not peer-reviewed) is the author/funder, who has granted bioRxiv a license to display the preprint in perpetuity.
The copyright holder for this preprint. http://dx.doi.org/10.1101/036897doi: bioRxiv preprint first posted online Jan. 18, 2016;
The consensus set of deletion events were found to be significantly depleted in exonic
regions (p<10-4) and UTRs (p<10-4) as well as known disease terms from Online Mendelian
Inheritance in Man (OMIM) database and deletions predicted to result in a loss of function
when compared to 10,000 random sets of size matched variants (p<10-4). Further analyses
showed that 11 deletions were in transmission disequilibrium (Supplementary Table 3).
Duplications. We identified 1,738 tandem duplications, 34.6% of which could be
successfully genotyped. This low percentage is likely due to the limitations of current
computational methods. The majority of the events were novel (84%, n=1,458) and contained
repeat elements such as simple repeats (n=914) or segmental duplication (n=194). A minority
of the duplication events (n=88) overlapped a RefSeq gene of which 71 affected at least one
exon within a gene and 41 events overlapped at least one exon of a gene with an OMIM
disease entry (including susceptibility loci and recessive disease genes) (Table1,
Supplementary Fig. 2).
Complex structural variation. A significant proportion of structural variants cannot be
described as simple events. Our data show that a sizeable fraction of indels (3%, n=52,913)
represent cases where one multibase segment of DNA (2-10bp) is replaced by another
sequence of different length (1-11bp), of which only a minority (17.2%) has previously been
described. Furthermore, by combining calls from discordant pair analysis with de novo
genome assembly we were able to detect 84 inversions and 60 interchromosomal events of
which 69 and 46 could be successfully genotyped. Interestingly, most of these variants were
common with average allele frequencies of 22.8% and 32.2%, respectively. Manual curation
of interchromosomal events showed that the majority possessed a polyA stretch at the
interchromosomal breakpoints and therefore was likely to originate from retrotransposition
events. This observation was supported by our orthogonal validations, which showed that 11
of the interchromosomal events contained processed parts of known transcripts and were
further characterized as gene retrocopy insertion polymorphisms29 (GRiP) (Supplementary
Table 4).
.CC-BY-ND 4.0 International licenseIt is made available under a (which was not peer-reviewed) is the author/funder, who has granted bioRxiv a license to display the preprint in perpetuity.
The copyright holder for this preprint. http://dx.doi.org/10.1101/036897doi: bioRxiv preprint first posted online Jan. 18, 2016;
Mobile element insertions. (MEIs) are a common type of retrotransposition-mediated
insertions. In total we identified 13,469 MEIs, making it a frequent form of structural variation
(23% of SVs larger than 20bp). The majority of MEIs could be genotyped (99.7%, n=13,430)
and were novel (56%) in comparison to those previously reported (Table 1). Non-reference
insertions of Alu (n=8,670) were the most common form of event followed by L1 (n=4,011),
SVA (n=781) and HERV (n=7) insertions. The majority of MEI elements (n=8,136) were
located in intergenic regions (Supplementary Fig. 2), however 49 events were predicted to
occur within exonic regions, including validated AluYa4/5 insertions into coding sequences of
OPRM1, METTL4 and ARHGAP28 as well as a heterozygous AluYk12 insertion into the last
exon of the EYS gene, a gene which is involved in autosomal recessive retinitis pigmentosa30
(Supplementary Fig. 3). The insertion in ARHGAP28 was observed in three families, while
each of the other three coding MEIs were family-specific events. This suggests that these
MEIs in the coding part of the genome are relatively recent and/or deleterious.
Novel segments. We performed joint de novo genome assembly by pooling unmapped
and discordantly mapped sequence reads from each family to search genomic segments
absent in the genome reference31 (GRCh37). Mapping of the resulting contigs to the
reference genome allowed us to confirm breakpoints of simple structural variants discovered
by alternative approaches. Some of these alignments are consistent with more complex
variation types, such as large segmental replacements (Figure 3, Supplementary Table 5).
Contigs that did not match the genome reference partially or completely were analyzed
separately. The size of unmatched sequences ranges from 150bp to 133kb (N50=5.6kb)
spanning 22.2Mb of assembled sequence. A large proportion of these sequences (14.4Mb)
showed discordance between libraries derived from the same individual. Homology searches
against a non-redundant NCBI sequence database showed that these segments most likely
represent genomic contaminations (Supplementary Table 6). The remaining 7.8Mb of
sequence (11,350 segments) contained sequence not represented in genome reference
GRCh37. Whilst the improved GRCh38 assembly places many segments onto the genome
map, 4.3Mb of assembled sequence is still unaccounted for (Supplementary Table 6). These
segments represented in part difficult to assemble repetitive sequence but also segments
.CC-BY-ND 4.0 International licenseIt is made available under a (which was not peer-reviewed) is the author/funder, who has granted bioRxiv a license to display the preprint in perpetuity.
The copyright holder for this preprint. http://dx.doi.org/10.1101/036897doi: bioRxiv preprint first posted online Jan. 18, 2016;
thus far uniquely observed in the Dutch population. Interestingly, while not matching GRCh38,
eleven segments match UniGene sequences, and include examples of expressed and
potentially functional genes. For example, we identified a novel zinc-finger (ZNF) gene,
harbored within an insertion on chromosome 19 (Figure 4). Although this novel ZNF gene is
absent in the human reference (both versions GRCh37 and GRCh38), it has close homology
to DNA segments of recently assembled genomes of non-human primates. Mapping of RNA-
seq reads from public expression data to a modified human reference genome containing the
novel segment showed that the inserted segment codes for a novel spliced ZNF transcript
(Figure 4).
Load and distribution of structural variants. Cluster analysis was performed to identify
genomic hotspots of structural variants. We confirmed 46 of the 50 deletion hotspots
previously reported32. Furthermore, when additionally considering duplications, mobile
element insertions and inversions 13 variant hotspots were identified, of which 4 have
previously not been described32. Overall each haplotype within the cohort had on average
758kb of sequence affected by simple and complex indels and 4.0Mb by structural variants,
amounting to an average of 4.8Mb of sequence affected by non-SNP variants. On average,
every individual carried 436kb of homozygous simple and complex indels and by 2.4Mb of
homozygous structural variants (Table 1, Supplementary Fig. 4).
Rare variants. The majority of small deletions were rare (with minor allele frequency, MAF
<1%, 50.4% of deletions up to 20bp). Small insertions and mid-sized deletions larger than
20bp displayed a higher allele frequency (MAF < 1%, 39.7% of insertions up to 20bp, and
33.5% of deletions longer than 20bp) (Figure 2, Supplementary Fig. 5). We stratified each
deletion, MEI, short deletion, short insertion and complex indel based on allele frequencies
into quartiles. Significantly more exonic events were observed in the first quartile for all variant
types tested (Supplementary Table 7). We observed a significant difference in the
distribution of indel events occurring within an OMIM gene. More specifically, exonic events
affecting OMIM disease genes were more often observed in the first quartile (MAF<0.325%),
as were exonic events involved in a pathway annotated in Kyoto Encyclopedia of Genes and
.CC-BY-ND 4.0 International licenseIt is made available under a (which was not peer-reviewed) is the author/funder, who has granted bioRxiv a license to display the preprint in perpetuity.
The copyright holder for this preprint. http://dx.doi.org/10.1101/036897doi: bioRxiv preprint first posted online Jan. 18, 2016;
Genomes (KEGG) database, and those in genes when knocked out in mouse resulting in a
phenotype. We observed that rare variants exhibit an excess in deletions larger than 1kb in
size and AluY insertions. In contrast, deletions that have large overlap with a SINE/LINE
repeat occur more frequently in the common events quartile (MAF>42.5%). This could also be
due to rare mobile element insertions where the inserted allele has been incorporated in the
reference genome assembly (Supplementary Table 8). These observations may indicate
recent alteration in mutational processes, as well as differences due to negative selection
against large deleterious variants.
Effect of structural variants on gene expression. We obtained gene expression data
(based on RNA sequencing data generated from a subset of 115 individuals from the cohort)
and tested the effect of structural variants on gene expression. The effects of indels, deletions
and duplications on gene expression have been previously described33. We explored effects
of inversions and mobile element insertions on gene expression. Out of 10 inversions and 139
MEIs that overlap exons or core promoters we found two MEIs with a significant effect on
gene expression (Figure 5). An AluYa5 insertion was identified in the promoter of the
LCLAT1 gene (Figure 5A). Samples, which are homozygous for the AluYa5 insertion display
a significantly reduced expression of the LCLAT1 gene (p = 6.87x10⁻⁹) (Figure 5B). We also
identified an AluYb8 element in the last exon of the ZNF880 gene. This was associated with
differential expression of the last two exons of ZNF880, resulting from alternative splicing
possibly due to effects of the Alu element on RNA secondary structure (Figure 5C). These
findings show that some of the less studied types of SV, such as MEIs, can impact gene
expression both quantitatively and qualitatively.
Phasing. We phased all successfully genotyped simple and complex indels (n=
1,792,213) and SVs (n=54,650, excluding interchromosomal events) (Table 1) with
MVNCall25 using the Affymetrix 6.0 SNP chip based haplotype scaffolds employed for
construction of the reference panel described previously1.
.CC-BY-ND 4.0 International licenseIt is made available under a (which was not peer-reviewed) is the author/funder, who has granted bioRxiv a license to display the preprint in perpetuity.
The copyright holder for this preprint. http://dx.doi.org/10.1101/036897doi: bioRxiv preprint first posted online Jan. 18, 2016;

Linkage disequilibrium between tag SNPs and deletions. To analyze the extent to
which deletions are in linkage disequilibrium (LD; non-random association between alleles)
with SNPs reported in the NHGRI Catalogue of genome-wide association studies34 (GWAS) ,
we tested all pairs of GWAS SNPs and deletions with a distance of at most 1Mb (n=55,250)
for being in LD. Of these pairs, 14,003 (25.3%) showed statistically significant LD (based on
Fisher's exact test, and controlling false discovery rate at 5% using with Benjamini-
Hochberg's procedure, Supplementary Fig. 6). To assess whether this relatively high
percentage of significant associations among the GWAS-SNP pairs is related to the GWAS
status of the SNPs, we performed the same experiment on similar SNPs (applying a sampling
technique previously described35) that were not associated through GWAS. We observed a
significantly greater number GWAS SNP-deletion pairs (25.3%) in LD than of non-GWAS
SNP-deletion pairs (19.1%, SD=0.2), revealing that deletions deserve attention in studies of
common genetic disorders and might be underlying some of the current GWAS SNP hits
(Supplementary Fig. 7 and 8). To test this hypothesis further, we filtered all GWAS SNP-
deletion pairs for those in high LD (r2 ≥ 0.8), resulting in 115 pairs (Supplementary Table 9).
Among these pairs, an exonic in-frame deletion (rs148114931) of 9 codons in APOBR
appears twice, linking it to SNP rs151181 which has been associated to Crohn's disease36
and SNP rs26528 associated to inflammatory bowel disease37. Another deletion affected the
UTR of ITGA11, which had been linked to major depressive disorder38. In addition, 61 intronic
deletions were found to be in LD with SNPs previously associated to disease. In particular,
due to the rigorous FDR correction applied, our catalog of 115 significant GWAS SNP-
deletion pairs provides strong initial evidence for further studies (Supplementary Table 9).
Tag SNPs for SVs. We considered SNPs represented on Affymetrix 6.0 array as well as
known GWAS tagSNPs and compiled a list of SNP-SV pairs exhibiting a high degree of
linkage disequilibrium (r2 ≥ 0.8 when considering 8,854 common, MAF>4%, deletions, 3,826
MEIs and 1,024 novel genomic segments). Beyond 115 deletions described above, other
types of structural variants might be responsible for various human traits. Thus a total of 76
GWAS SNPs showed high LD (r2≥0.8) with at least one of 30 polymorphic MEIs or 43 new
.CC-BY-ND 4.0 International licenseIt is made available under a (which was not peer-reviewed) is the author/funder, who has granted bioRxiv a license to display the preprint in perpetuity.
The copyright holder for this preprint. http://dx.doi.org/10.1101/036897doi: bioRxiv preprint first posted online Jan. 18, 2016;

genomic segments (Supplementary Table 10). We expect that a significant part of these
SVs might contribute to traits studied by GWAS studies.
Imputing structural variants. Genotype imputation, the prediction of missing genotypes
based on a reference panel, has been very successful in boosting the power of GWAS,
enabling meta-analyses across individual GWAS studies, and improving the chances of
identifying causal variants by fine-mapping39. The value of the GoNL panel to robustly impute
SNPs and indels has previously been shown2. We extend this concept and demonstrate that
our SV-integrated panel allows for accurate imputation of SVs by imputing structural variants
in an independent group of individuals based solely on their SNP genotype status (see Figure
6 for a schematic overview). We genotyped all complex indels, deletions, duplications,
inversions, and MEIs we found (Figure 6, Step 1) in two independently sequenced Dutch
genomes. We extracted all SVs that could be genotyped with a confidence of 0.999 (Step 2)
in these individuals to create a set of gold standard genotypes. Gold standard genotype
counts for each SV class are shown in Figure 7A. SNP genotypes were filtered to only
include those SNPs present on an Affymetrix 6.0 chip (Step 3), to simulate an array-based
assay. Based on the SNP genotypes obtained and the GoNL reference panel we used
IMPUTE2 to impute SV genotypes (Step 4) to compare with the gold standard call. After
imputation, SVs can optionally be filtered based on the genotype likelihoods (GLs). Here we
document the performance for six different cutoffs (0.33, 0.75, 0.9, 0.95, 0.99, and 0.999).
Step 5 thus only retains genotype calls that meet the respective threshold being tested. The
quality of the remaining imputed genotypes was determined by the fraction of imputed
genotypes matching with the gold standard genotypes (concordance = squared correlation;
see Supplementary Information, Section 3.6 for a formal definition). We refer to its inverse
(i.e. one minus concordance) as discordance. The GL threshold influences the tradeoff
between discordance and the fraction of genotypes missing due to this filter (Figure 7B). We
find that more stringent filtering leads to an increase in concordance, demonstrating that the
genotype likelihoods are meaningful. Specifically, employing the most stringent GL filter
tested (at a level of 0.999) leads to only a moderate loss of 8.6% to 21.6% of genotypes
imputed, depending on the variant type, while the discordance drops by 83% (from 2.9% to
.CC-BY-ND 4.0 International licenseIt is made available under a (which was not peer-reviewed) is the author/funder, who has granted bioRxiv a license to display the preprint in perpetuity.
The copyright holder for this preprint. http://dx.doi.org/10.1101/036897doi: bioRxiv preprint first posted online Jan. 18, 2016;
0.5%) for duplications, by 71% (from 4.2% to 1.2%) for deletions, by 67% (from 6.9% to 2.3%)
for MEIs, by 42% (from 14.2% to 8.2%) for inversions, and by 38% (from 10.5% to 6.5%) for
complex indels. Based on Figure 7B, we consider a threshold of 0.95 (red circle) a good
tradeoff and report these results henceforth. With this setting, only 7.5% of all SVs are
omitted, while the concordance is excellent; 88% for inversions, 92.4% for complex indels,
and 96.5% for MEIs, 98% for deletions and 99.1% for duplications. For the more common SV
classes with more than 1,000 genotype calls (Figure 7A), namely complex indels, deletions,
and MEIs, we further stratified performance based on genotypes (Supplementary Fig. 9) and
on allele frequency. We observed that a higher MAF leads towards a higher discordance in
genotypes across all three SV classes (Figure 7C). This is driven by the fact that the vast
majority of the rare variants in the GoNL reference panel are not found in these samples and
is thus easy to impute correctly as homozygous reference. To investigate how well the rare
allele could be imputed, we repeated the analysis restricted to only gold standard genotypes
that contain one copy of the rare allele (that is, genotypes homozygous for the major allele
are discarded), see Figure 7D and Supplementary Fig. 10. Only the imputation of rare SV
(or reference) alleles with panel frequencies below 5% leads to considerable losses in
imputation quality, while imputation performance is excellent for higher MAFs
(Supplementary Fig. 11). Finally, we compared the results of SV imputation using GoNL and
1000 Genome Project14 reference panels and a set of nearly 10 thousand of structural
variants detected in both projects. These results showed that SV imputation in two Dutch
individuals using the GoNL panel is more sensitive and specific, particularly when imputing
less frequent alleles (Supplementary Tables 11 and 12). The percentage of discordant calls
was decreased when imputing with the GoNL panel from 2.7% to 1.2% for deletions called
with a confidence of 0.95 and from 12.9% to 5.5% for minor allele deletions.
.CC-BY-ND 4.0 International licenseIt is made available under a (which was not peer-reviewed) is the author/funder, who has granted bioRxiv a license to display the preprint in perpetuity.
The copyright holder for this preprint. http://dx.doi.org/10.1101/036897doi: bioRxiv preprint first posted online Jan. 18, 2016;
Discussion
The past few years have seen a remarkable progress in human genome sequencing
studies, which has greatly improved our understanding of human genome variation1,3,13,14,16–
18,32. These projects differ, often substantially, in terms of sample selection and sequence
coverage. For example, to capture global diversity, the 1000 Genomes Project selected 2,504
unrelated individuals from 26 populations and largely relied on the discoveries from low
coverage whole genome data13,14. As a result a large proportion of common variants with
population frequency greater than 1% have been discovered across multiple populations. In
contrast, the UK10K project combined low coverage whole-genome with high coverage
exome sequencing approaches to identify rare variants associated with various genetic
traits17.
We exploit two features of the GoNL study design to create an SV-integrated reference
panel. First, an elevated coverage allows for enhanced genotyping of SVs18,22,23. Second, the
family-based design aids in establishing haplotypes across significantly longer ranges than
achievable based on unrelated individuals18,19. Combining these two features yields a wealth
of high quality SV-integrated haplotypes, which we have corroborated by imputation
experiments. In addition, the family design has facilitated analysis of variant transmission
within a single generation. We have also been able to compile a list of SVs that are in high LD
with disease associated SNPs which are highly unlikely to be false discoveries based on
additional statistical analysis.
Our reference panel spans a wide range of variant classes, many of which have previously
not been extensively reported, such as complex indels and medium-size SVs (affecting
between 21 and 100 nucleotides). In particular medium-sized SVs are sometimes considered
a blind spot in short read based variant discovery. This required method development for both
discovery and genotyping, as well as clean sequencing library protocols. Furthermore we
report a large collection of new genomic segments, representing several million bases
missing from the genome reference.
.CC-BY-ND 4.0 International licenseIt is made available under a (which was not peer-reviewed) is the author/funder, who has granted bioRxiv a license to display the preprint in perpetuity.
The copyright holder for this preprint. http://dx.doi.org/10.1101/036897doi: bioRxiv preprint first posted online Jan. 18, 2016;
Downstream analysis of the variants provided insights into the mutational dynamics as
well as the consequences of selection processes affecting structural variants. We show that
the distribution and predicted functional impact of variants differs significantly between rare
and common variants. Whilst previous studies have demonstrated the effects of polymorphic
deletions on gene expression40, we here identified the effects on gene expression of
additional forms of structural variation such as MEIs.
The evolution of high-throughput sequencing technologies, coupled with advances in data
analysis, has leveraged substantial progress in variant detection in next-generation short-read
data. Every new study has fostered our understanding about the human genome.
Nonetheless, there is still considerable room for improvement26. Difficulties remain in
capturing large and complex structural variants, especially those in repetitive regions.
Evolving third-generation single molecule and long read sequencing, and further
methodological advances such as global genome map technology, may further improve the
discovery, genotyping and phasing of structural variants. Given present-generation
technology, our approaches and the resulting reference panel provide both an advanced
toolkit and a powerful resource, with great potential to decisively enhance genome-wide
association and personalized genomics studies.
.CC-BY-ND 4.0 International licenseIt is made available under a (which was not peer-reviewed) is the author/funder, who has granted bioRxiv a license to display the preprint in perpetuity.
The copyright holder for this preprint. http://dx.doi.org/10.1101/036897doi: bioRxiv preprint first posted online Jan. 18, 2016;
Methods Sample collection and data generation. Samples were collected as outlined in
Boomsma et al., 201319 All participants provided written informed consent, and each biobank
(LifeLines Cohort Study, Leiden Longevity Study, Netherlands Twin Registry, Rotterdam
Study, Rucphen Study). Study protocol was approved by their respective institutional review
board (IRB). The whole genome sequencing using the Illumina HiSeq 2000 platform using
90bp paired-end reads1. Data was mapped to the UCSC human reference genome build 37
using BWA 0.5.9-r16 and quality control was performed as described earlier1.
Structural variation discovery. We used 12 different algorithms for the discovery of
structural variants, which use four different general approaches: split-read mapping (SR),
(discordant) read pairs (DP), read depth (RD), de novo assembly (AS), and combinations
thereof, as shown in Figure 1A. Details about how the individual methods were run are
provided in the Supplementary Information.
Generation of consensus call set. After creation of the algorithm specific calls sets a
consensus set of indels and SVs were made for each to the SV types (indels, deletions,
insertions, duplications, inversions, interchromosomal events, and mobile element insertions).
Events were merged per variant type using an algorithm-aware merging strategy
(Supplementary Table 1). A consensus region was defined when overlapping regions were
identified by 2 different detection strategies (for example split read and discordant read pair,
see Supplementary Fig. 5 for the contributions of individual strategies for deletion detection,
stratified by AF and event length), and the boundaries of the event were determined by the
algorithm with the highest breakpoint accuracy (as determined by the calling strategy) in
combination with a 50% reciprocal overlap. For variants 20bp and smaller in size an exact
overlap was used, with support from at least two different methods.
Validation experiments. Validation was performed using PCR amplification of breakpoint
junctions, and subsequent sequencing of the PCR products via Sanger or MiSeq sequencing.
The validation set consisted of at least 96 candidates for indels, mid-size deletions, large
deletions, MEIs, large replacements, and novel segments, as well as 48 duplications, 76
inversions, 42 interchromosomal breakpoints and 10 complex indels (see Supplementary
Table 2).
.CC-BY-ND 4.0 International licenseIt is made available under a (which was not peer-reviewed) is the author/funder, who has granted bioRxiv a license to display the preprint in perpetuity.
The copyright holder for this preprint. http://dx.doi.org/10.1101/036897doi: bioRxiv preprint first posted online Jan. 18, 2016;

Genotyping and phasing. To genotype SVs, we used GATK’s HaplotypeCaller for
complex indels, MATE-CLEVER for deletions, Mobster for MEIs, and Delly for inversions,
duplications, and translocations. Details on how each tool was run are collected in the
Supplementary Information. For phasing, we used the haplotype scaffolds described
earlier1 to phase SVs onto the already phased sets of SNPs and indels. The scaffold contains
sites present on Omni2.5M chips. Refer to the supplement of our previous study1, Section 12,
for details on how it was created. Phasing was done using MVNcall version 1.125. We used
the genotype likelihoods (GLs) reported by the genotyping tools described above. Before
phasing, the GLs were regularized so as to avoid too low probabilities as detailed in the
Supplementary Information.
GWAS SNP permutation test. For every GWAS SNP-deletion pair, we randomly selected
a non-GWAS SNP-deletion pair that was similar in terms of potentially confounding variables,
see Supplementary Information for those variables. We then applied Fisher's exact test and
the Benjamini-Hochberg FDR control procedure on the matched non-GWAS SNP-deletion set
and recorded the percentage of statistically significant pairs. This sampling procedure was
repeated 1000 times. The samples were found to have a mean of 19.1% and a standard
deviation of 0.20, against the percentage of 25.3% for the GWAS SNPs (Supplementary Fig.
8), see Supplementary Information, Section 3.4, for further details.
Imputation of structural variants. SV genotyping of two independent Dutch individuals
was done using the same pipeline as for genotyping SVs in the GoNL panel (see
Supplementary Information), that is, GATK/HaplotypeCaller was used for complex indels,
MATE-CLEVER for deletions, DELLY for duplications and inversions, and Mobster for MEIs.
Genotype likelihoods (GLs) provided by these tools were used to determine the gold standard
set, requiring a probability of 0.999 of the genotype being correct for all call types except for
MEIs, where we used 0.85 account for differently calibrated GLs. For imputation of SV
genotypes based on SNP genotypes and the GoNL panel, we used IMPUTE241. Therefore,
we first used SHAPEIT242 for first phasing all SVs with the SNPs using the GoNL panel. Refer
to the for Supplementary Information, Section 3.6 details such as command line
arguments. Note that phasing genetic variants using SHAPEIT2 before imputing genotypes
with IMPUTE2 follows best-practice recommendations (see IMPUTE2
.CC-BY-ND 4.0 International licenseIt is made available under a (which was not peer-reviewed) is the author/funder, who has granted bioRxiv a license to display the preprint in perpetuity.
The copyright holder for this preprint. http://dx.doi.org/10.1101/036897doi: bioRxiv preprint first posted online Jan. 18, 2016;

https://mathgen.stats.ox.ac.uk/impute/impute_v2.html). The expected discordance between
true and imputed genotype is based on comparing the probability distribution over the three
different genotypes provided by IMPUTE2 for the imputed genotypes on the one hand, and
the probability distribution provided by the read-based genotyping tools on the other hand,
see the Supplementary Information, Section 3.6 for details and definitions. We refer to the
expected value of the discordance just as “discordance” in the main text and we refer to 1-
discordance as concordance.
Availability of computer code. The references to depositories of software packages and
parameters used in each analysis are given within corresponding sections of Supplementary
Information.
.CC-BY-ND 4.0 International licenseIt is made available under a (which was not peer-reviewed) is the author/funder, who has granted bioRxiv a license to display the preprint in perpetuity.
The copyright holder for this preprint. http://dx.doi.org/10.1101/036897doi: bioRxiv preprint first posted online Jan. 18, 2016;
References
1. Genome of the Netherlands Consortium. Whole-genome sequence variation, population structure and demographic history of the Dutch population. Nat. Genet. 46, 818–25 (2014).
2. Deelen, P. et al. Improved imputation quality of low-frequency and rare variants in European samples using the ‘Genome of The Netherlands’. Eur. J. Hum. Genet. 22, 1321–6 (2014).
3. International HapMap Consortium. The International HapMap Project. Nature 426, 789–96 (2003).
4. International HapMap 3 Consortium et al. Integrating common and rare genetic variation in diverse human populations. Nature 467, 52–8 (2010).
5. Conrad, D. F. et al. Origins and functional impact of copy number variation in the human genome. Nature 464, 704–12 (2010).
6. de Cid, R. et al. Deletion of the late cornified envelope LCE3B and LCE3C genes as a susceptibility factor for psoriasis. Nat. Genet. 41, 211–5 (2009).
7. Fanciulli, M. et al. FCGR3B copy number variation is associated with susceptibility to systemic, but not organ-specific, autoimmunity. Nat. Genet. 39, 721–3 (2007).
8. Girirajan, S. et al. Relative burden of large CNVs on a range of neurodevelopmental phenotypes. PLoS Genet. 7, e1002334 (2011).
9. Koolen, D. A. et al. Genomic microarrays in mental retardation: a practical workflow for diagnostic applications. Hum. Mutat. 30, 283–92 (2009).
10. Hurles, M. E., Dermitzakis, E. T. & Tyler-Smith, C. The functional impact of structural variation in humans. Trends Genet. 24, 238–45 (2008).
11. Feuk, L., Carson, A. R. & Scherer, S. W. Structural variation in the human genome. Nat. Rev. Genet. 7, 85–97 (2006).
12. 1000 Genomes Project Consortium et al. A global reference for human genetic variation. Nature 526, 68–74 (2015).
13. Sudmant, P. H. et al. Global diversity, population stratification, and selection of human copy-number variation. Science 349, aab3761 (2015).
14. Sudmant, P. H. et al. An integrated map of structural variation in 2,504 human genomes. Nature 526, 75–81 (2015).
15. Sidore, C. et al. Genome sequencing elucidates Sardinian genetic architecture and augments association analyses for lipid and blood inflammatory markers. Nat. Genet. 47, 1272–81 (2015).
16. Besenbacher, S. et al. Novel variation and de novo mutation rates in population-wide de novo assembled Danish trios. Nat. Commun. 6, 5969 (2015).
17. UK10K Consortium et al. The UK10K project identifies rare variants in health and disease. Nature 526, 82–90 (2015).
18. Wong, L.-P. et al. Deep whole-genome sequencing of 100 southeast Asian Malays. Am. J. Hum. Genet. 92, 52–66 (2013).
19. Boomsma, D. I. et al. The Genome of the Netherlands: design, and project goals. Eur. J. Hum. Genet. 22, 221–227 (2013).
20. Francioli, L. C. et al. Genome-wide patterns and properties of de novo mutations in humans. Nat. Genet. 47, 822–826 (2015).
21. Kloosterman, W. P. et al. Characteristics of de novo structural changes in the human genome. Genome Res. 25, 792–801 (2015).
22. Chu, C., Zhang, J. & Wu, Y. GINDEL: accurate genotype calling of insertions and deletions from low coverage population sequence reads. PLoS One 9, e113324 (2014).
23. Marschall, T., Hajirasouliha, I. & Schönhuth, A. MATE-CLEVER: Mendelian-inheritance-aware discovery and genotyping of midsize and long indels. Bioinformatics 29, 3143–50 (2013).
24. Marchini, J. et al. A comparison of phasing algorithms for trios and unrelated individuals. Am. J. Hum. Genet. 78, 437–50 (2006).
25. Menelaou, A. & Marchini, J. Genotype calling and phasing using next-generation sequencing reads and a haplotype scaffold. Bioinformatics 29, 84–91 (2013).
26. Chaisson, M. J. P. et al. Resolving the complexity of the human genome using single-molecule sequencing. Nature 517, 608–11 (2015).
27. Sherry, S. T. et al. dbSNP: the NCBI database of genetic variation. Nucleic Acids Res. 29, 308–11 (2001).
28. MacDonald, J. R., Ziman, R., Yuen, R. K. C., Feuk, L. & Scherer, S. W. The Database of Genomic Variants: a curated collection of structural variation in the human genome. Nucleic
.CC-BY-ND 4.0 International licenseIt is made available under a (which was not peer-reviewed) is the author/funder, who has granted bioRxiv a license to display the preprint in perpetuity.
The copyright holder for this preprint. http://dx.doi.org/10.1101/036897doi: bioRxiv preprint first posted online Jan. 18, 2016;

Acids Res. 42, D986–92 (2014). 29. Schrider, D. R. et al. Gene copy-number polymorphism caused by retrotransposition in
humans. PLoS Genet. 9, e1003242 (2013). 30. Collin, R. W. J. et al. Identification of a 2 Mb human ortholog of Drosophila eyes
shut/spacemaker that is mutated in patients with retinitis pigmentosa. Am. J. Hum. Genet. 83, 594–603 (2008).
31. Luo, R. et al. SOAPdenovo2: an empirically improved memory-efficient short-read de novo assembler. Gigascience 1, 18 (2012).
32. 1000 Genomes Project Consortium et al. An integrated map of genetic variation from 1,092 human genomes. Nature 491, 56–65 (2012).
33. Huang, J. et al. eQTL mapping identifies insertion- and deletion-specific eQTLs in multiple tissues. Nat. Commun. 6, 6821 (2015).
34. Welter, D. et al. The NHGRI GWAS Catalog, a curated resource of SNP-trait associations. Nucleic Acids Res. 42, D1001–6 (2014).
35. Maurano, M. T. et al. Systematic localization of common disease-associated variation in regulatory DNA. Science 337, 1190–5 (2012).
36. Franke, A. et al. Genome-wide meta-analysis increases to 71 the number of confirmed Crohn’s disease susceptibility loci. Nat. Genet. 42, 1118–25 (2010).
37. Jostins, L. et al. Host-microbe interactions have shaped the genetic architecture of inflammatory bowel disease. Nature 491, 119–24 (2012).
38. GENDEP Investigators, MARS Investigators & STAR*D Investigators. Common genetic variation and antidepressant efficacy in major depressive disorder: a meta-analysis of three genome-wide pharmacogenetic studies. Am. J. Psychiatry 170, 207–17 (2013).
39. Marchini, J. & Howie, B. Genotype imputation for genome-wide association studies. Nat. Rev. Genet. 11, 499–511 (2010).
40. Stranger, B. E. et al. Relative impact of nucleotide and copy number variation on gene expression phenotypes. Science 315, 848–53 (2007).
41. van Leeuwen, E. M. et al. Population-specific genotype imputations using minimac or IMPUTE2. Nat. Protoc. 10, 1285–96 (2015).
42. Delaneau, O., Marchini, J. & Zagury, J.-F. A linear complexity phasing method for thousands of genomes. Nat. Methods 9, 179–81 (2012).
End Notes
Acknowledgements The GoNL Project is funded by the Biobanking and Biomolecular Research Infrastructure
(BBMRI-NL), which is financed by the Netherlands Organization for Scientific Research
(NWO project 184.021.007). BBMRI-NL funded K.Y. for validation experiments, CP2011-36.
The Netherlands Organization for Scientific Research (NWO) has funded J.Y.H, through Veni
grant 016.166.015 and A.S. through Vidi grant 639.072.309. This work was supported, in part,
by a U.S. National Institutes of Health (NIH) grant R01HG002385 and NIH U41HG007497 to
E.E.E.
Author Contributions
A.S., K.Y., and V.G. planned and directed the study. C.W., P.I.W.dB., M.A.S., G-J.B.vO.,
P.E.S., and D.I.B, supervised GoNL data integration. J.Y.H, T.M., W.P.K., L.C.F., J.A.B.,
.CC-BY-ND 4.0 International licenseIt is made available under a (which was not peer-reviewed) is the author/funder, who has granted bioRxiv a license to display the preprint in perpetuity.
The copyright holder for this preprint. http://dx.doi.org/10.1101/036897doi: bioRxiv preprint first posted online Jan. 18, 2016;
L.J.D., A.A., V.K., D.T.T., R.W., B.P.C., P.D., J.dB, E-W.L., F.vD., F.H., A.S., K.Y., and V.G
performed data analysis. A.G.U., D.I.B., C.W., and P.E.S provided samples for validation
experiments. I.R., W.P.K, and V.G. performed the validation experiments and analysis.
J.Y.H., T.M., W.P.K., A.S., K.Y., and V.G. wrote the manuscript. E.E.E., C.W., P.I.W.dB.,
M.A.S., G-J.B.vO., P.E.S., D.I.B. commented on the manuscript.
Additional information
Supplementary information accompanies this paper.
Competing financial Interests: The authors declare no competing financial interests.
Accession numbers. Sequence data have been deposited at the European Genome-
phenome Archive (EGA), which is hosted by the European Bioinformatics Institute (EBI),
under accession number EGAS00001000644.
.CC-BY-ND 4.0 International licenseIt is made available under a (which was not peer-reviewed) is the author/funder, who has granted bioRxiv a license to display the preprint in perpetuity.
The copyright holder for this preprint. http://dx.doi.org/10.1101/036897doi: bioRxiv preprint first posted online Jan. 18, 2016;
Figure legends Figure 1. Overviews of discovery approach and variant set. (a) Overview of methods
used for SV detection, genotyping and phasing within the GoNL project. (b) Structural
variation consensus set, consisting of large duplications (outer ring), deletions larger than
100bp (light red), chromosomes, insertions (triangles), mid-sized deletions (21-100bp), small
deletions (less than 20bp) (dark red) and complex indels (purple). Heatmaps display the
insertions of Alu, L1 and SVA elements. Inversions are indicated by black arcs in the centre of
the plot, and interchromosomal break points (colored based on the source chromosome).
Figure 2. Number of simple and complex indels, mobile element insertions (MEIs)
and deletions (stratified by length). Grey bars correspond to total counts, whereas colored
(blue to violet) bars give counts stratified into four bins by allele frequency quartiles (Q1 to
Q3).
Figure 3. Example of a large replacement within the KRBOX4 gene. The plot depicts
the coverage profile of whole genome sequencing reads from a GoNL sample with a
homozygous replacement. The lack of coverage in the last exon of KRBOX4 is coinciding with
the position of the replacement. The breakpoint junctions of the replacement are indicated in
the panel underneath the coverage plot.
Figure 4. Identification and expression of a novel ZNF gene. (a) A Geuvadis RNA-
sequencing dataset (ERR188316) was mapped to the human reference genome, which was
extended with a new genomic segment inserted in chr 19 (bp 21,252,967). The plot shows
RNA expression and split-read mappings across the novel ZNF gene present on this new
genomic segment. (b) Protein domain structure of the novel ZNF gene as determined using
NCBI Conserved Domain Search. (c) Neighbor-joining tree built from alignment of protein
sequences homologous to the novel ZNF gene. Values at the nodes indicate bootstrap
support of each group. Distances indicate protein sequence divergence on amino acid level.
Figure 5. Effects of MEIs on gene expression. (a) Schematic picture indicating an
AluYa5 insertion in the promoter region of LCLAT1. (b) LCLAT1 gene expression (fragments
per million, FPM) in blood from GoNL individuals who are heterozygous (het) or homozygous
(hom) for the AluYa5 insertion. (c) RNA expression effects of an AluYb8 insertion in the last
exon of ZNF880. The presence of the AluYb8 element results spliced transcripts, which
.CC-BY-ND 4.0 International licenseIt is made available under a (which was not peer-reviewed) is the author/funder, who has granted bioRxiv a license to display the preprint in perpetuity.
The copyright holder for this preprint. http://dx.doi.org/10.1101/036897doi: bioRxiv preprint first posted online Jan. 18, 2016;
preferentially contain the last exon, while the before last exon is skipped (upper panel). The
reverse effect is seen in the absence of the AluYb8 insertion (lower panel).
Figure 6. Schematic overview of the imputation experiment. Haplotypes are
represented by thin grey bars, whereas diploid chromosomes with genotype calls are
indicated by thick grey bars. Processing steps are shown in blue, with numbers (in black
circles) for being referenced in the main text.
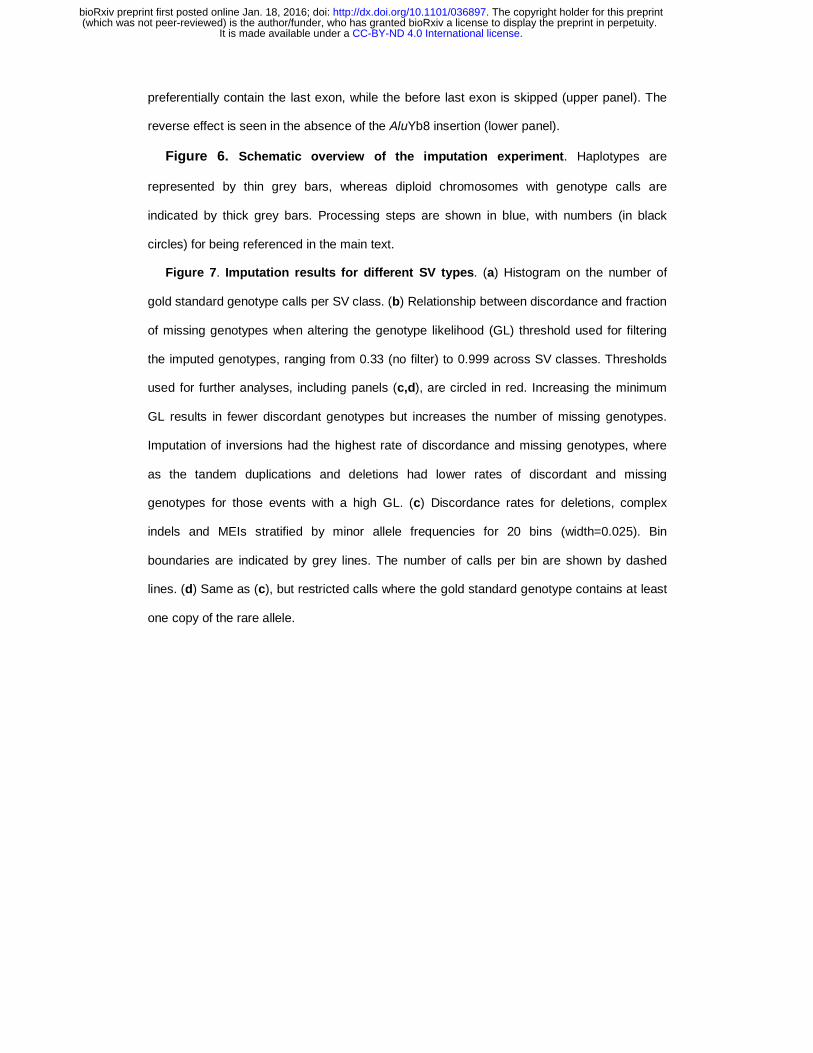
Figure 7. Imputation results for different SV types. (a) Histogram on the number of
gold standard genotype calls per SV class. (b) Relationship between discordance and fraction
of missing genotypes when altering the genotype likelihood (GL) threshold used for filtering
the imputed genotypes, ranging from 0.33 (no filter) to 0.999 across SV classes. Thresholds
used for further analyses, including panels (c,d), are circled in red. Increasing the minimum
GL results in fewer discordant genotypes but increases the number of missing genotypes.
Imputation of inversions had the highest rate of discordance and missing genotypes, where
as the tandem duplications and deletions had lower rates of discordant and missing
genotypes for those events with a high GL. (c) Discordance rates for deletions, complex
indels and MEIs stratified by minor allele frequencies for 20 bins (width=0.025). Bin
boundaries are indicated by grey lines. The number of calls per bin are shown by dashed
lines. (d) Same as (c), but restricted calls where the gold standard genotype contains at least
one copy of the rare allele.
.CC-BY-ND 4.0 International licenseIt is made available under a (which was not peer-reviewed) is the author/funder, who has granted bioRxiv a license to display the preprint in perpetuity.
The copyright holder for this preprint. http://dx.doi.org/10.1101/036897doi: bioRxiv preprint first posted online Jan. 18, 2016;

Supplementary figures
Supplementary figure 1. Repeat content of deletions identified in the GoNL dataset.
Supplementary figure 2. The gene components affected by structural variations in the
consensus set.
Supplementary figure 3. Example of MEI in coding sequence of EYS.
Supplementary figure 4. Histograms showing the distribution of the number of affected
base pairs per haplotype.
Supplementary figure 5. Barplots showing deletion frequencies versus deletion size.
Supplementary figure 6. The percentage of SNP-deletion pairs deemed statistically
significant.
Supplementary figure 7. The percentage of SNP-deletion pairs deemed statistically
significant when varying the allele frequency and distance thresholds.
Supplementary figure 8. Distribution of imputed genotypes per gold standard genotype
and per SV type.
Supplementary figure 9. Expected discordance rate stratified by minor allele frequency
for different calling thresholds.
Supplementary figure 10. Expected discordance rate stratified by minor allele frequency
for different calling thresholds.
Supplementary figure 11: Distribution of imputed genotypes per gold standard genotype
and per SV type based on rare alleles.
Supplementary tables
Supplementary table 1: Merging strategy for different detection algorithms to create the
consensus set of structural variants.
Supplementary table 2: Validations performed for structural genomic variants
Supplementary table 3: Deletions in transmission disequilibrium.
Supplementary table 4: Overview of all interchromosomal structural variants.
Supplementary table 5: Large replacements identified via de novo assembly.
Supplementary table 6: Overview of classes of novel genomic segments identified in the
GoNL dataset.
Supplementary table 7: Allele frequency and functional impact of structural variants.
Supplementary table 8: Allele frequency distribution (quantile-based) of MEI
deletions and insertions.
Supplementary table 9: List of 115 GWAS hitSNPs significantly in LD with GoNL
deletions.
Supplementary table 10: List of SNPs in high linkage disequilibrium with GoNL SVs.
Supplementary table 11: Overview of the imputation results using the GoNL panel
Supplementary table 12: Overview of the imputation results using the 1000 Genomes
panel
.CC-BY-ND 4.0 International licenseIt is made available under a (which was not peer-reviewed) is the author/funder, who has granted bioRxiv a license to display the preprint in perpetuity.
The copyright holder for this preprint. http://dx.doi.org/10.1101/036897doi: bioRxiv preprint first posted online Jan. 18, 2016;

Figure 1A
.CC-BY-ND 4.0 International licenseIt is made available under a (which was not peer-reviewed) is the author/funder, who has granted bioRxiv a license to display the preprint in perpetuity.
The copyright holder for this preprint. http://dx.doi.org/10.1101/036897doi: bioRxiv preprint first posted online Jan. 18, 2016;

Figure 1B
.CC-BY-ND 4.0 International licenseIt is made available under a (which was not peer-reviewed) is the author/funder, who has granted bioRxiv a license to display the preprint in perpetuity.
The copyright holder for this preprint. http://dx.doi.org/10.1101/036897doi: bioRxiv preprint first posted online Jan. 18, 2016;

Figure 2
Figure 3
.CC-BY-ND 4.0 International licenseIt is made available under a (which was not peer-reviewed) is the author/funder, who has granted bioRxiv a license to display the preprint in perpetuity.
The copyright holder for this preprint. http://dx.doi.org/10.1101/036897doi: bioRxiv preprint first posted online Jan. 18, 2016;
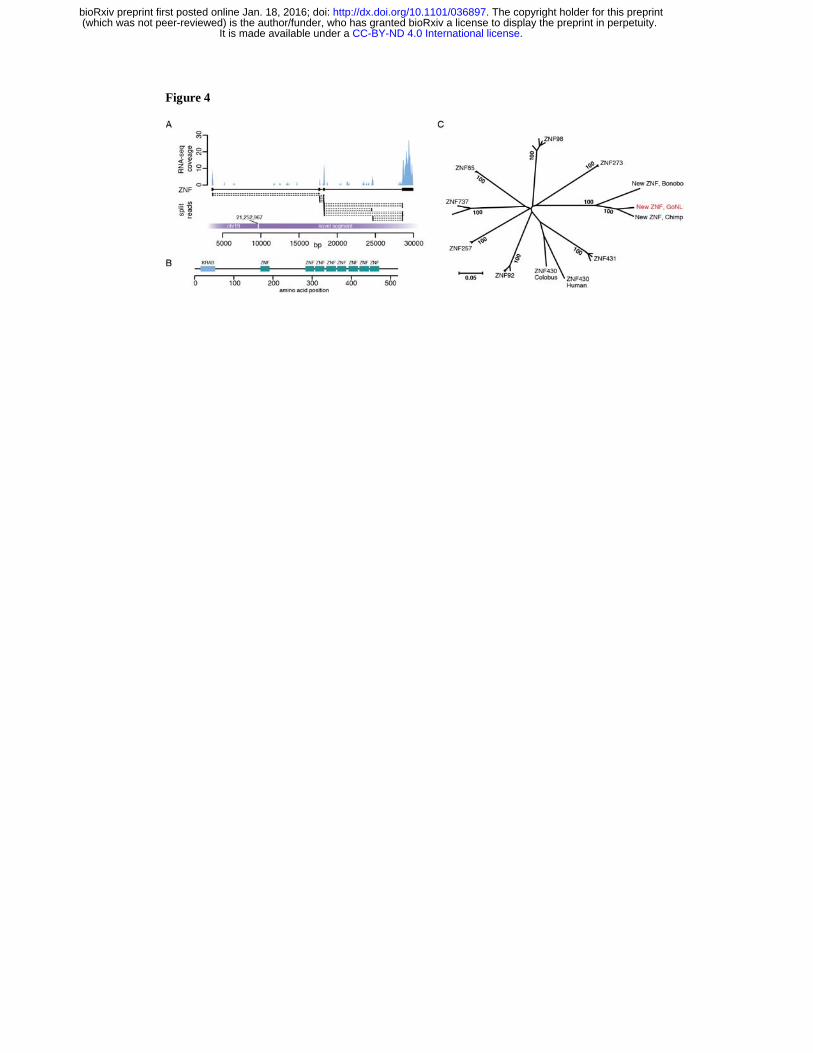
Figure 4
.CC-BY-ND 4.0 International licenseIt is made available under a (which was not peer-reviewed) is the author/funder, who has granted bioRxiv a license to display the preprint in perpetuity.
The copyright holder for this preprint. http://dx.doi.org/10.1101/036897doi: bioRxiv preprint first posted online Jan. 18, 2016;
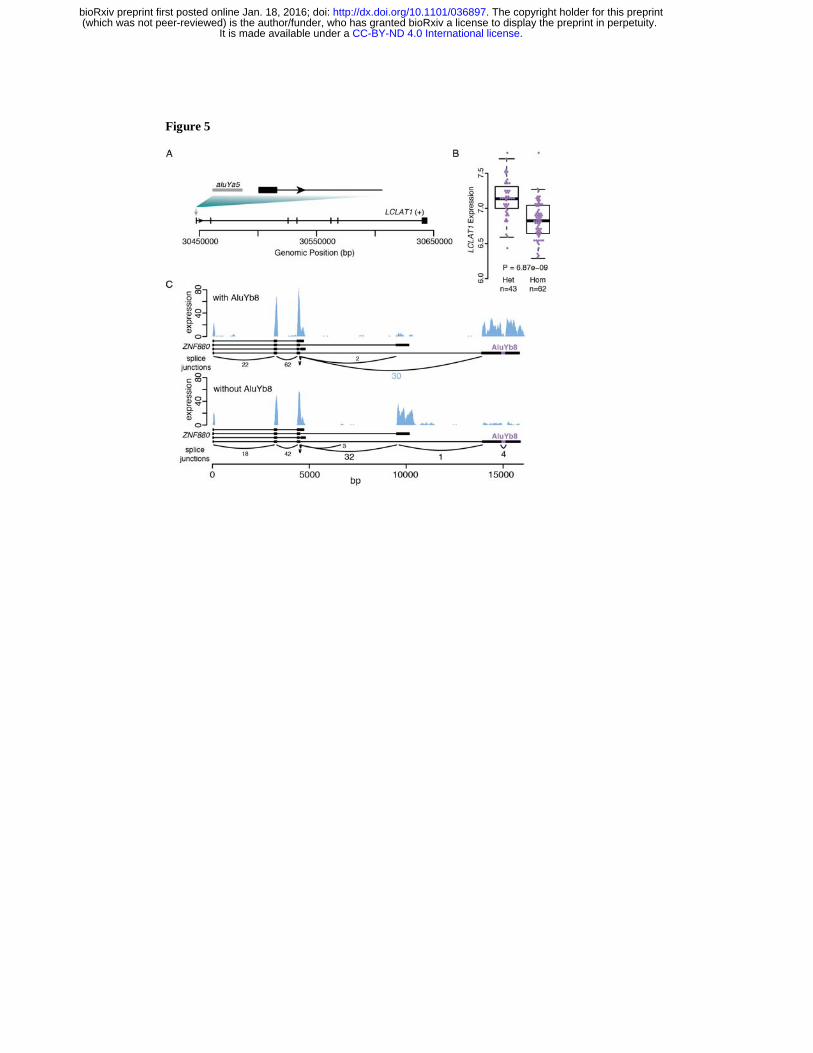
Figure 5
.CC-BY-ND 4.0 International licenseIt is made available under a (which was not peer-reviewed) is the author/funder, who has granted bioRxiv a license to display the preprint in perpetuity.
The copyright holder for this preprint. http://dx.doi.org/10.1101/036897doi: bioRxiv preprint first posted online Jan. 18, 2016;
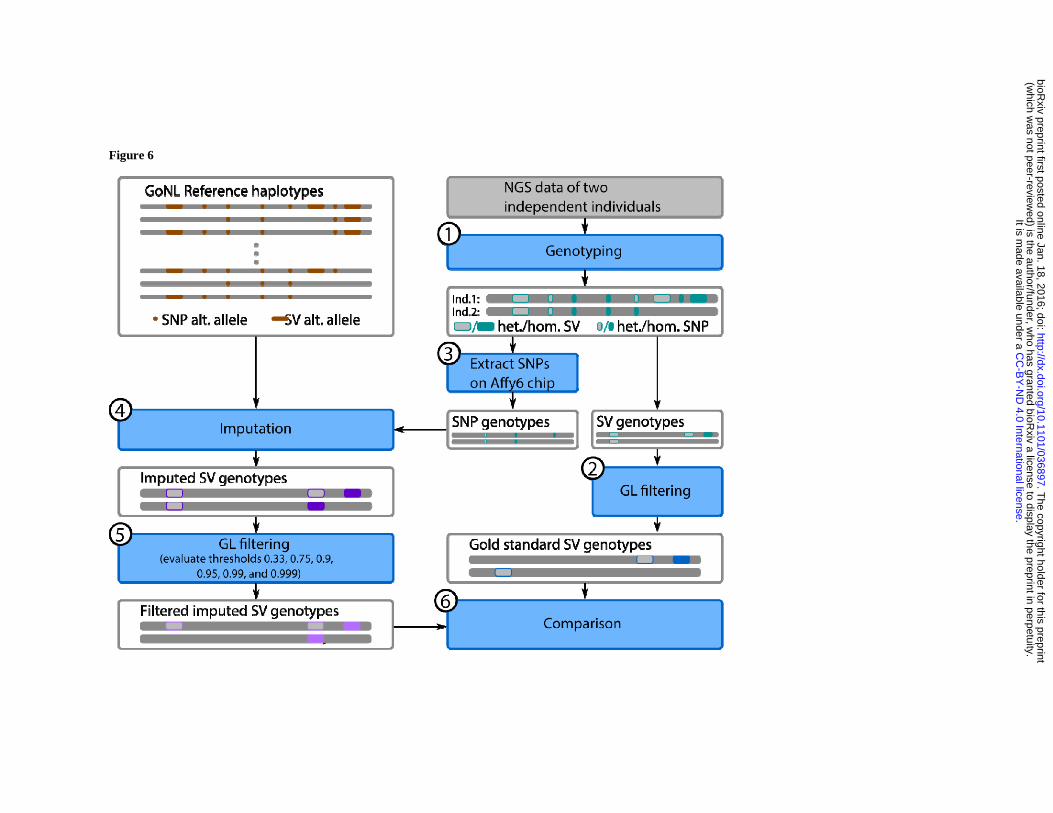
Figure 6
.C
C-B
Y-N
D 4.0 International license
It is made available under a
(which w
as not peer-reviewed) is the author/funder, w
ho has granted bioRxiv a license to display the preprint in perpetuity.
The copyright holder for this preprint
. http://dx.doi.org/10.1101/036897
doi: bioR
xiv preprint first posted online Jan. 18, 2016;

Figure 7
.C
C-B
Y-N
D 4.0 International license
It is made available under a
(which w
as not peer-reviewed) is the author/funder, w
ho has granted bioRxiv a license to display the preprint in perpetuity.
The copyright holder for this preprint
. http://dx.doi.org/10.1101/036897
doi: bioR
xiv preprint first posted online Jan. 18, 2016;

Table 1: Characteristics of the consensus indel and structural variants set. Type Number Genotype
d Valida
tion rate (%)
Novel (%)
Rare (MAF<1%)
Low freq (1<=MAF<5%)
Common (MAF >=
5%)
Mean Length
Length Stdev.
Load (avg. bp/haplotype)
Load (avg. homozygous/
genome) Indel 1,739,300 1,739,300 98 11.5 46.5% 15.5% 38.1% 2.5 2.8 633765.5 363862.0
Complex Indel 52,913 52,913 80 82.8 25.7% 17.5% 56.8% 9.6 9.0 123765.9 72082.9
Deletion 21-100bp
24,167 22,914 99 21.6 21.5% 14.6% 63.9% 35.9 17.4 230838.6 160802.6
Deletion >100bp
19,840 17,636 93 41.9 49.2% 13.3% 37.5% 3908.2 21507.3 3099740.4 1928806.6
Mobile Element Insertion
13,469 13,430 96 55.9 54.9% 13.6% 31.6% n/a n/a n/a n/a
Duplication 1,738 601 85 83.9 82.5% 8.2% 9.3% 61322.2
947459.0 482059.4 169250.2
Inversion 84 69 65 29.8 21.7% 15.9% 62.3% 3047390
23882994.1 154510.4 101262.7
Interchromosomal events
60 46 83 n/a 39.1% 10.9% 50.0% n/a n/a n/a n/a
Novel Segments
7,718 n/a 90 n/a n/a n/a n/a 561.3 2000.8 n/a n/a
Large Replacements: Replaced segments
281 n/a 98 n/a n/a n/a n/a 6053.5 27970.3 n/a n/a
Large Replacements: Replacing segments
281 n/a 98 n/a n/a n/a n/a 1272.4 2018.9 n/a n/a
.C
C-B
Y-N
D 4.0 International license
It is made available under a
(which w
as not peer-reviewed) is the author/funder, w
ho has granted bioRxiv a license to display the preprint in perpetuity.
The copyright holder for this preprint
. http://dx.doi.org/10.1101/036897
doi: bioR
xiv preprint first posted online Jan. 18, 2016;