a highly sensitive in vivo footprinting technique for condition
TRANSCRIPT

A highly sensitive in vivo footprinting technique forcondition-dependent identification of cis elementsRita Gorsche1 Birgit Jovanovic1 Loreta Gudynaite-Savitch2 Robert L Mach1 and
Astrid R Mach-Aigner1
1Research Division Biotechnology and Microbiology Institute of Chemical Engineering Vienna University ofTechnology Gumpendorfer Str 1 a A-1060 Vienna Austria and 2Department of Biology University of OttawaGendron Hall 30 Marie Curie Ottawa ON K1N6N5 Canada
Received May 16 2012 Revised August 29 2013 Accepted September 9 2013
ABSTRACT
Knowing which regions of a gene are targeted bytranscription factors during induction or repressionis essential for understanding the mechanisms re-sponsible for regulation Therefore we re-designedthe traditional in vivo footprinting method to obtaina highly sensitive technique which allows identifica-tion of the cis elements involved in condition-dependent gene regulation Data obtained throughDMS methylation HCl DNA cleavage and optimizedligation-mediated PCR using fluorescent labellingfollowed by capillary gel electrophoresis areanalysed by ivFAST In this work we have developedthis command line-based program which isdesigned to ensure automated and fast data pro-cessing and visualization The new method facili-tates a quantitative high-throughput approachbecause it enables the comparison of any numberof in vivo footprinting results from different condi-tions (eg inducing repressing de-repressing) toone another by employing an internal standard Forvalidation of the method the well-studied upstreamregulatory region of the Trichoderma reesei xyn1(endoxylanase 1) gene was used Applying the newmethod we could identify the motives involvedin condition-dependent regulation of the cbh2(cellobiohydrolase 2) and xyn2 (endoxylanase 2)genes
INTRODUCTION
The sequence-specific binding of transcription factors tothe DNA is a key element of transcriptional regulation(1ndash3) Therefore the knowledge of which areas of anupstream regulatory region (URR) are specifically
targeted by proteins is essential for the further under-standing of regulatory mechanisms For this purposein vivo and in vitro footprinting methods employing nucle-ases such as DNaseI (4ndash7) or alkylating agents such asdimethylsulfate (DMS) (89) are routinely used to detectproteinndashDNA interactions DMS treatment of DNA leadsto methylation of guanine and adenine residues with eachguanine or adenine residue of purified DNA having thesame probability of being methylated When used forin vivo footprinting DMS readily penetrates living cellsThere proteinndashDNA interactions cause either a decreasedaccessibility of certain G or A residues to DMS (protec-tion) or an increased reactivity (hypersensitivity) (10)The URRs of eukaryotic DNA are complex and
include a number of different recognition sites that canbe targeted by multiple transcription factors at a time(2) Furthermore the important regulatory elements areoften hundreds of bases away from the transcription start(1) necessitating the coverage of large regions in the foot-printing reactions Additionally various genes and tran-scription factors are grouped together in regulonsElucidating the binding characteristics of transcriptionfactors as well as the transcriptional regulation andinterdependencies in regulons requires the analysis of foot-printing patterns of the URRs of a number of differentgenes under various different conditions Therefore astandardized high-throughput approach to traditionalin vivo footprinting allowing parallel investigation of anumber of conditions andor isolates is necessaryThe original protocol for DMS in vivo footprinting was
already established in 1985 (89) and has been improvedupon since then by adding ligation-mediated PCR (LM-PCR) (11) LM-PCR quantitatively maps single-strandDNA breaks having phosphorylated 50-ends withinsingle-copy DNA sequences Briefly it involves blunt-end ligation of an asymmetric double-stranded linkeronto the 50-end of each before cleaved blunt-endedDNA molecule This linker adds a common and known
To whom correspondence should be addressed Tel +43 664 60588 7253 Fax +43 1 5880117299 Email astridmach-aignertuwienacat
The authors wish it to be known that in their opinion the first two authors should be regarded as Joint First Authors
Published online 3 October 2013 Nucleic Acids Research 2014 Vol 42 No 1 e1doi101093nargkt883
The Author(s) 2013 Published by Oxford University PressThis is an Open Access article distributed under the terms of the Creative Commons Attribution License (httpcreativecommonsorglicensesby30) whichpermits unrestricted reuse distribution and reproduction in any medium provided the original work is properly cited
Dow
nloaded from httpsacadem
icoupcomnararticle421e12437564 by guest on 30 D
ecember 2021
sequence to all 50-ends allowing exponential PCR amplifi-cation of an adjacent unknown genomic sequence (12)Furthermore optimizing the polymerase and cycling con-ditions (13) and adapting the method to different kinds ofcells from cell lines (8111415) and yeast (9) to filament-ous fungi (16) was achieved Nevertheless due to the useof polyacrylamide gels and radioactive labelling of theDNA fragments the resulting protocol was laboriousused hazardous substances yielded results of stronglyvarying quality and consequently was not yet suitablefor high-throughput projectsThe use of fluorescent labels and separation of DNA
fragments by capillary sequencer has meanwhile beenintroduced to a number of similar techniques such asRFLP (17) AFLP (18) in vitro DNaseI footprinting(19) or chromatin analysis (2021) In 2000 an approachapplying automated LM-PCR with infrared fluoro-chrome-labelled primers and a LI-COR DNA sequencerfor detection was used to compare in vivo to in vitroUV-treated DNA (22) In this study we employed[6-FAM]-labelling of the DNA fragments in DMSin vivo footprinting and analysis via capillary sequenceremploying an internal size standard Moreover we madeuse of analysis by a certified sequencing service whichguarantees stable and controlled analysis conditionsThis resulted in a fast and sensitive way to analysefragment size as well as peak intensities in a largenumber of samples providing an excellent tool for com-parison of URRs in a number of different isolates anddifferent conditions The final step to an automatedhigh-throughput in vivo footprinting technique is themanner in which the acquired data is processedTraditional in vivo footprinting employs visual compari-son to align sequences with band patterns and densitomet-ric measurements to determine band intensities [eg(1123ndash25)] For standardized comparison of multiplesamples from different experiments a computational pro-cessing of the analysis data is paramount Therefore wedeveloped a data analysis tool (termed ivFAST) that plotsnormalized peak area ratios against sequence data andautomatically determines which bases are protected fromor hypersensitive to methylation by DMSTo test the new method we examined part of the Xyr1
Cre1 regulon of Trichoderma reesei (teleomorph Hypocreajecorina) Trichoderma reesei is a filamentous ascomyceteof great industrial importance because of its high potencyin secretion of hydrolases Xyr1 is recognized as the essen-tial activator for most hydrolytic-enzyme encoding genesin T reesei eg cbh1 cbh2 (Cellobiohydrolases I and II-encoding) and egl1 (Enoglucanase I-encoding) as wellas xyn1 and xyn2 (Xylanases I and II-encoding) (2627)Previous footprinting experiments identified a 50-GGC(TA)3-3
0-motif as the Xyr1-binding site in the URRs ofcbh2 xyn1 xyn2 and xyn3 (28ndash31) Cre1 on the otherhand is characterized as a repressor responsible formediating carbon catabolite repression of hydrolytic-enzyme encoding genes (32) such as cbh1 and xyn1(3334) 50-SYGGRG-30 was found to be the consensussequence for Cre1-binding (35)In this study the URR of the above-mentioned xyn1
gene was used to validate the method By using
traditional gel-based in vivo footprinting next to thenew software-based method we found that the newmethod allows not only a comparison of in vivomethylated samples to naked DNA (ie in vitromethylated genomic DNA used as a reference) but issensitive enough for a comparison of in vivo methylatedsamples with each other This we demonstrate by applyingthe new method to the URRs of the cbh2 and xyn2 geneThese URRs are of similar architecture bearing the so-called cellulase-activating element [CAE 50-ATTGGGTAATA-30 (31)] or xylanase-activating element [XAE50-GGGTAAATTGG-30 (30)] respectively of whichboth were previously identified as essential for gene regu-lation By employing the new method we have detected thefollowing motifs (i) the CAE and the XAE (ii) other gen-erally known but in these URRs so far unrecognizedmotifs (such as Xyr1- or Cre1-binding sites) and (iii) sofar unknown motifs
MATERIALS AND METHODS
Strains and growth conditions
The ascomycete H jecorina (T reesei) QM9414 [ATCC26921 a cellulase hyper-producing mutant derived fromwild-type strain QM6a (36)] and an according xyr1deletion strain (23) were used in this study and were main-tained on malt agar For replacement experiments myceliawere pre-cultured in 1-l-Erlenmeyer flasks on a rotaryshaker (180 rpm) at 30C for 18 h in 250ml of Mandels-Andreotti (MA) medium (37) supplemented with 1(wv) glycerol as sole carbon source An amount of 109
conidia per litre (final concentration) were used asinoculum Pre-grown mycelia were washed and equalamounts were re-suspended in 20ml of MA media con-taining 1 (wv) glucose 05mM D-xylose 15mMsophorose as sole carbon source or no carbon source re-spectively and incubated for 3 h (growth conditions) or5 h (resting cell conditions) For in vitro DNA methylationmycelium grown on rich medium (3 malt extract 1glucose 1 peptone) was used
In vivo methylation of genomic DNA
Methylation of DNA in vivo was performed according toWolschek et al (16) An amount of 40 ml of DMS in 2mlMES (200mM pH 55) were added to 20ml of fungalculture and incubated at 30C and 180 rpm for 2minMethylation was stopped with 100ml of ice-cold TLEbbuffer [10mM Tris pH 8 1mM EDTA 300mM LiCl2 (vv) b-mercaptoethanol] Mycelia were harvestedwashed with TLEb buffer and distilled water and frozenin liquid nitrogen DNA extraction was performed accord-ing to standard protocol (38) The DNA was cleaved atmethylated purines by incubating 100 ml of DNA solution(100 mg) with 63ml HCl (05M) on ice for 15 h (39) TheDNA was precipitated with 25 ml sodium acetate (3MpH 5) and 500 ml ethanol dissolved in 250 ml bi-distilledwater and incubated at 90C for 30min with 10 ml NaOH(1M) After addition of 25 ml Tris (1M pH 75) and ad-justment of the pH to 75 the DNA fragments were againprecipitated with sodium acetate and ethanol dissolved in
e1 Nucleic Acids Research 2014 Vol 42 No 1 PAGE 2 OF 12
Dow
nloaded from httpsacadem
icoupcomnararticle421e12437564 by guest on 30 D
ecember 2021
100 ml Tris (10mM pH 75) and purified using theQIAquick Nucleotide Removal Kit (Qiagen HildenGermany)
In vitro methylation of genomic DNA
For in vitro methylation genomic DNA extracted frommycelium grown on full medium was methylated accord-ing to Mueller et al (14) An amount of 100 ml of DNAsolution (100 mg) was incubated with 400 ml of DMSreaction buffer (005M sodium cacodylate 0001MEDTA pH 8) and 2 ml of DMS (120 dilution inbi-distilled water) at room temperature for 5min Thereaction was stopped by adding 50 ml of stop solution(15M sodium acetate 1M b-mercaptoethanol) TheDNA was precipitated twice with sodium acetate andethanol and dissolved in 100 ml Tris (10mM pH 75)Cleavage of the DNA was performed as describedabove This DNA was used as one reference and werefer to it using the term lsquonaked DNArsquo throughout themanuscript
Traditional gel-based analysis of DNA fragments viaLM-PCR
LM-PCR was performed using Vent Polymerase [NewEngland Biolabs (NEB) Ipswich MA] as described byGarrity and Wold (13) End-labelling of RG72-2 usingg-32P-ATP was done according to Mueller and Wold(11) and resulting DNA fragments were extracted withphenolchloroformisoamylalcohol (25241 volvol) andprecipitated with ethanol The DNA pellet was re-sus-pended in 10 ml of loading dye (005 bromophenolblue 005 xylene cyanol 20mM EDTA) heated at95C for 5min and loaded on a 6 polyacrylamidesequencing gel
Generation of DNA fragments via modified LM-PCR
LM-PCR was modified from the original protocol ofMueller and Wold (11) and the adaptation of Wolscheket al (16) First-strand synthesis was performed in a 30 mlreaction mixture containing 1 buffer (NEB) 001mMoligo 1 02mM dNTPs 1U Vent polymerase (NEB)and 300ndash400 ng DNA template The following PCRprogram was performed denaturation at 95C for 5minannealing at 555C for 30min and elongation at 75C for10min For the annealing of the linker oligonucleotides21 mmol each of oligo-long and oligo-short in 400 ml ofTris (025M pH 77) were heated at 95 C for 5min andslowly cooled to 30C (001Cs) For ligation of the linkerthe sample was put on ice and 4 ml of T4 ligase buffer[10 Promega Corporation (PC) Madison WI USA]4 ml of linker and 15U of T4 DNA ligase (Promega)were added After incubation at 17C overnight theDNA fragments were precipitated with sodium acetateethanol and 10 mg of tRNA and dissolved in 10 ml ofTris (10mM pH 75)
Amplification of the DNA fragments was performed ina 25 ml reaction mixture containing 10 ml sample DNA 1buffer (NEB) 02mM dNTPs 02 mM oligo 2 02mMoligo-long and 1U Vent polymerase (NEB) The PCRprogram was the following initial denaturation at 95C
for 25min followed by 17 cycles of 1min at 95C 2min at605C and 3min at 75CFor the labelling reaction 1U of Vent polymerase
(NEB) and oligo 3 (50-[6-FAM]-labelled 02mM final con-centration) were added and the following PCR programwas performed initial denaturation at 95C for 25minfollowed by five cycles of 1min at 95C 2min at 635Cand 3min at 75CAll LM-PCR reactions were performed in triplicates
Separation of 6-FAM-labelled DNA fragments
Separation of the fluorescently labelled DNA-fragmentsvia capillary gel electrophoresis (CGE) was performed byMicrosynthAG (Balgach Switzerland) on anABI 3730XLGenetic Analyser (Life Technologies CorporationCarlsbad CA USA) using GeneScanTM 600-LIZ asinternal size standard (Life Technologies) Data fromDNA fragment analysis ie peak area values and DNAfragment length was determined using Peak ScannerTM
Software v10 (Life Technologies)
Analysis of peak data
To improve sample throughput the analysis of CGE datawere automated using ivFAST (in vivo footprintinganalysis software tool) This software tool was developedand used for the first time during this work It is acommand line-based program written in Java 6 For theheatmap creation the JHeatChart library (httpwwwjavaheatmapcom) was used This is a Java library forgenerating heatmap charts for output as image fileswhich is open source under an LGPL license (httpwwwgnuorglicenseslgpl-30enhtml) ivFAST reads inplain text files containing the CGE results from a specifiedfolder as well as a DNA sequence file in FASTA formatGiven a start point in the DNA sequence and a directionthe program maps the measured peaks to the givensequence and removes background peaks not matchingan A or G in the sequence (according to the defaultsetting) The peak area of valid peaks is normalizedagainst total peak area and the share of standard peaksin total peak area to account for variance in the CGEanalysis In addition normalization against the ratio ofunincorporated primers to total peak area is used toaccount for differences in PCR efficiency From samplereplicates (at least duplicates) the mean peak area andthe sample variance (based on a Studentrsquos distribution)is calculated for each peak To determine whether peaksdiffer significantly from sample to sample their 95 con-fidence intervals (two-sided) for the mean of the samplereplicates are checked to be non-overlapping (pairwisecomparison of samples) If this criterion is fulfilled thequotient of the mean peak areas of sample to referencesample is calculated From the result of this calculation atext file as well as a heatmap is created where protectedbases with quotients lt1 are printed in three shades of redand hypersensitive bases with quotients gt1 are printed inthree shades of blue The ivFAST manual which explainshow the software works and how to use it is included inthe software package From there the step-by-step
PAGE 3 OF 12 Nucleic Acids Research 2014 Vol 42 No 1 e1
Dow
nloaded from httpsacadem
icoupcomnararticle421e12437564 by guest on 30 D
ecember 2021
conversion of the data the according algorithms and thenormalization of data can be inferred in all detailsA minimum of two replicates needs to be available to
run the software The authors recommend using (at least)three replicates which was done throughout this study
RNA-extraction and reverse transcription
Harvested mycelia were homogenized in 1ml ofpeqGOLD TriFast DNARNAprotein purificationsystem reagent (PEQLAB Biotechnologie ErlangenGermany) using a FastPrep FP120 BIO101ThermoSavant cell disrupter (Qbiogene CarlsbadUSA) RNA was isolated according to the manufacturerrsquosinstructions and the concentration was measured usingthe NanoDrop 1000 (Thermo Scientific Waltham USA)After treatment with DNase I (Fermentas part of
Thermo Fisher Scientific St Leon-Rot Germany) syn-thesis of cDNA from 045 mg mRNA was carried out usingthe RevertAidTM H Minus First Strand cDNA SynthesisKit (Fermentas) all reactions were performed accordingto the manufacturerrsquos instructions
Quantitative PCR analysis
All quantitative PCRs (qPCRs) were performed in aRotor-Gene Q cycler (QIAGEN) All reactions were per-formed in triplicate The amplification mixture (finalvolume 15 ml) contained 75 ml 2 ABsoluteTM QPCRSYBR Green Mix (ABgene part of Thermo FisherScientific Cambridge UK) 100 nM forward and reverseprimer and 20ml cDNA (diluted 1100) Primer sequencesare provided in Table 1 Each run included a template-freecontrol and an amplification-inhibited control (0015SDS added to the reaction mixture) The cycling condi-tions were comprised of a 15min initial polymerase acti-vation at 95C followed by 40 cycles of 15 s at 95C 15 sat 60C (xyn2 xyr1 and act) and 15 s at 72C for sar1following the initial activationdenaturation we ran 40cycles of 15 s at 95C and 120 s at 64C All PCRefficiencies were gt90 Data analysis using sar1 andact as reference genes and calculations using REST2009 were performed as published previously (40)
RESULTS AND DISCUSSION
Development of an improved software-based in vivofootprinting technique
Motivation for method designImproving the original in vivo footprinting protocol wasnecessary for a number of reasons Besides the fact thatswitching from radioactive to fluorescent labelling is pref-erable for safety reasons detection of labelled DNA frag-ments by CGE instead of densitometric analysis of asequence gel is significantly faster more accurate andmore sensitive especially since the use of a commercialsequencing service ensures stability and reproducibilityof the fragment length analysis A further goal of themethod improvement was to permit the analysis of alarge sample set simultaneously as well as to enable com-parisons of samples based on varying reference samples
Finally an increase in sensitivity compared with theoriginal protocol was anticipated
Method description and optimizationThe main steps of the procedure are depicted in Figure 1First fungal mycelia were incubated under different culti-vation conditions of interest (inducing repressing de-re-pressing) The in vivo methylation of fungal mycelia wasperformed as described before using DMS (16) DNaseIcannot enter the fungal cell and therefore was not usedfor in vivo footprinting in this study DNA extraction ofgenomic DNA was followed by DNA cleavage using HClwhich led to DNA breaks at methylated guanine andadenine residues Next LM-PCR was applied because itis a sensitive and specific technique for visualization ofin vivo footprints To determine the optimal number ofcycles for the amplification and labelling reaction in theLM-PCR reactions with 17 and 20 cycles for the amplifi-cation step and 5 10 15 and 20 cycles for the labellingreaction were conducted Samples obtained by in vivomethylation and subsequent extraction and cleavage ofgenomic DNA from fungal mycelia (in vivo methylatedsamples) as well as in vitro methylated fungal genomicDNA (naked DNA) as a reference were used as templatesFor the amplification step 20 cycles turned out to be toomany because even though differences in peak area valuesbetween naked DNA and in vivo methylated samplescould be detected in vivo methylated samples from differ-ent cultivation conditions did not show any significantdifferences (data not shown) This suggested that thereaction had already reached the end of the exponentialphase and the concentrations of DNA fragments hadstarted to level When stopping the reaction after 17cycles clear differences between samples from differentcultivation conditions can be detected (data not shown)consequently it was chosen As for the labelling reactionsamples with five and 10 cycles showed an increase in peakarea values while the peak area values did not increase for15 and 20 cycles (data not shown) indicating that fewercycles are sufficient to produce clear fluorescence signalsA comparison of reactions with five and 10 cycles againshowed that an increase in cycles resulted in a decrease indistinction of different cultivation conditions (data notshown) Consequently five cycles were chosen asoptimal for the labelling reaction
Development of ivFASTPerforming footprinting reactions of large sample setssimultaneously requires a software-based data analysisTherefore in this work we developed a software tool tofacilitate data analysis First the peak area values andDNA fragment lengths are extracted from the fsa-filesreceived from the custom service after CGE (egSupplementary Figure S1) to plain text files The essentialsteps of the data analysis are incorporated into acommand line-based program ie plotting against theDNA sequence normalization of peak area values andfiltering statistically significantly different bases (protectedor hypersensitive) according to a chosen referencesample (compare flowchart in Figure 1) This softwaretool is easy to use and permits analysis of a dataset and
e1 Nucleic Acids Research 2014 Vol 42 No 1 PAGE 4 OF 12
Dow
nloaded from httpsacadem
icoupcomnararticle421e12437564 by guest on 30 D
ecember 2021
visualization of the results in a very short time ie dataanalysis starting from obtained CGE results can be donein 10min per sample (given that three replicates are used)ivFAST is freely available at httpwwwvttuwienacatbiotechnology_and_microbiologygene_technologymach_aigner_labEN From there both the software and adetailed manual can be downloaded The manualexplains how to use the software and how it worksincluding the step-by-step conversion of the data the ac-cording algorithms and the normalization of data On theone hand ivFAST actually determines the precise inten-sity of protection or hypersensitivity and yields as outputthe exact number given in a text file On the other handivFAST also displays results in a gradual mode of visual-ization (three shades for each protection and hypersensi-tivity of which the range is manually adjustable) andyields as output a heatmap as png-file for graphicdisplay of results
Validation of the newly developed in vivo footprintingtechnique
Comparison of the new technique to traditional in vivofootprintingAs a first attempt the newly developed software-basedtechnique was compared with the traditional gel-basedin vivo footprinting approach Because the URR of xyn1is well-studied and the cis elements involved and the con-tacting trans factors are widely known it was chosen for acomparative investigation of both techniques side-by-side
As Xyr1 is the main transactivator of the xyn1 gene expres-sion an URR part covering two Xyr1-binding sites [previ-ously proven functional by deletion analysis (3441)] wasanalysed Using traditional in vivo footprinting the protec-tion of some bases could only be detected when comparedwith naked DNA whereas no condition-specific differences(regardless if repressing or inducing) were found (Figure 2)In contrast the new technique generally yielded more pro-tectionhypersensitivity signals compared with the gel ifsamples from in vivo footprinting were compared withnaked DNA (Figure 2 GND XOND) Most strikinglythe new technique also displays signals if in vivo footprint-ing results from inducing conditions (D-xylose) werecompared with those from repressing conditions (glucose)(Figure 2 XOG) Summarizing the traditional gel-basedmethod and the comparison to naked DNA applying thenew method revealed a similar in vivo footprinting patternunder repressing and inducing conditions However onlythe new method detects clear induction-specific differenceswhich are in good accordance with xyn1 transcript data(Supplementary Figure S2a)
Reproducibility of the new techniqueIn order to test the reproducibility of the method in vivofootprinting of samples from two different conditions (re-pressing and inducing) and from two biological replicatesof each was performed The original trace data of thesesamples andmdashas a referencemdashof naked DNA (performedalso in duplicates) is pictured in Figure 3a Comparing theelectropherograms of the replicates it becomes clear that
Table 1 Oligonucleotides used in this study
Name Sequence 50ndash 30 Usage
RG53 GAATTCAGATC iv-FP oligo-shortRG54 GCGGTGACCCGGGAGATCTGAATTC iv-FP oligo-longRG67 AAGTCATTGCACTCCAAGGC iv-FP xyn1 oligo 1 fwRG68 CCTCTTCACATCATGATTTGAGC iv-FP xyn1 oligo 1 revRG69 ATTCTGCAGCAAATGGCCTCAAGCAAC iv-FP xyn1 oligo 2 fwRG70 CAAGTGAGGTTGAAAGCGGCTCGTA iv-FP xyn1 oligo 2 revRG71 [6-FAM]CTGCAGCAAATGGCCTCAAGCAACTACG iv-FP xyn1 oligo 3 fwRG72 [6-FAM]GAGGTTGAAAGCGGCTCGTACAGTATCC iv-FP xyn1 oligo 3 revRG72-2 GAGGTTGAAAGCGGCTCGTACAGTATCC iv-FP xyn1 oligo 3 revRG97 AAGCGCTAATGTGGACAGGATT iv-FP cbh2 oligo 1 fwRG98 CAATACACAGAGGGTGATCTTAC iv-FP cbh2 oligo 1 revRG99 CATTAGCCTCAAGTAGAGCCTATTTCCTC iv-FP cbh2 oligo 2 fwRG100 GCCTCTTCAGGTGAGCTGCTG iv-FP cbh2 oligo 2 revRG101 [6-FAM]GCCTCAAGTAGAGCCTATTTCCTCGCC iv-FP cbh2 oligo 3 fwRG102 [6-FAM]CTTCAGGTGAGCTGCTGTGAGACCATG iv-FP cbh2 oligo 3 revRG127 GTTCCGATATATGAGATTGCCAAG iv-FP xyn2 oligo 1 fwRG128 GTTGATGTCTTCTTGCTTCAGC iv-FP xyn2 oligo 1 revRG129 AGCCGTTATTCAGACAATGTATGTGCCG iv-FP xyn2 oligo 2 fwRG130 GGAGTTGTTGTGTCTTTTGGGCTTGG iv-FP xyn2 oligo 2 revRG131 [6-FAM]CCGTTATTCAGACAATGTATGTGCCGGGC iv-FP xyn2 oligo 3 fwRG132 [6-FAM]GTTGTTGTGTCTTTTGGGCTTGGAGGGG iv-FP xyn2 oligo 3 revact fw TGAGAGCGGTGGTATCCACG act qPCRact rev GGTACCACCAGACATGACAATGTTG act qPCRsar1 fw TGGATCGTCAACTGGTTCTACGA sar1 qPCRsar1 rev GCATGTGTAGCAACGTGGTCTTT sar1 qPCRcbh2 fw CTATGCCGGACAGTTTGTGGTG cbh2 qPCRcbh2 rev GTCAGGCTCAATAACCAGGAGG cbh2 qPCRxyn1 fw CAGCTATTCGCCTTCCAACAC xyn1 qPCRxyn1 rev CAAAGTTGATGGGAGCAGAAG xyn1 qPCRxyn2 fw GGTCCAACTCGGGCAACTTT xyn2 qPCRxyn2 rev CCGAGAAGTTGATGACCTTGTTC xyn2 qPCR
PAGE 5 OF 12 Nucleic Acids Research 2014 Vol 42 No 1 e1
Dow
nloaded from httpsacadem
icoupcomnararticle421e12437564 by guest on 30 D
ecember 2021
their peak pattern is the same The peak pattern of thenaked DNA strongly differs from both types of in vivofootprinting samples (repressinginducing condition) Ifthe in vivo footprinting sample from repressing conditions(glucose) is compared with the one from inducing
conditions (D-xylose) slight differences in certain peakratios can be observed These findings support theabove-mentioned conclusion that strong differences canbe detected comparing in vivo footprinting samples withnaked DNA but also detection of condition-dependent
Figure 1 Schematic presentation of the workflow and generation of final data The main steps of the software-based high-throughput in vivofootprinting method comprise growingincubating the microorganism under conditions to be investigated (eg inducing conditions) in vivo DNAmethylation using eg DMS DNA extraction DNA cleavage by eg HCl followed by LM-PCR and CGE A subset of CGE analyses results to becompared (raw data) are submitted to electronic data analysis using the ivFAST software for generation of the results displayed as final heatmap(processed data output) The steps of processing the data by the ivFAST software can be inferred from the flowchart (for more details see theivFAST manual) Heatmap x-axis gives the analysed DNA sequence y-axis shows which samples are referred to each other (eg GND meanslsquoglucose repressing conditions referred to naked DNArsquo) only signals that are statistically different are considered protected bases are highlighted inred shades and hypersensitive bases are highlighted in blue shades 11- to 13-fold difference between compared conditions is shown in light shadedcolour 13- to 15-fold difference between compared conditions is shown in middle shaded colour and gt15-fold difference between comparedconditions is shown in dark shaded colour
e1 Nucleic Acids Research 2014 Vol 42 No 1 PAGE 6 OF 12
Dow
nloaded from httpsacadem
icoupcomnararticle421e12437564 by guest on 30 D
ecember 2021
differences (comparing in vivo footprinting results from acertain condition to another) are now possible Usingthese raw data for analysis applying ivFAST a heatmapfor each replicate is obtained (Figure 3b) They yield asimilar signal pattern regardless if the in vivo footprintingsamples are referred to naked DNA (Figure 3b compareG1ND1 and XO1ND1 with G2ND2 and XO2ND2) orto each other (Figure 3b compare G1XO1 with G2XO2) Most importantly the heatmap that results fromreferring the same type of replicate (glucose D-xylosenaked DNA) to each other is given (Figure 3c) Asexpected hardly any signal is yielded in this case support-ing a sufficient reproducibility of the method
Verification of signals yielded by the new techniqueIn order to test the reliability of the signal yielded by thenew technique we used the wild-type and an isogenic xyr1
deletion strain for in vivo footprinting analyses Xyr1 is themain transactivator of xyn1 gene expression (26)Consequently a region of the xyn1 URR covering a func-tional binding site for Xyr1 was chosen for investigationThe consensus sequence for Xyr1 DNA binding[50-GGC(AT)3-3
0] was previously investigated byEMSA and in vitro footprinting (28) As a control theinvestigated region also includes a functional bindingsite for another transcription factor involved in xyn1gene regulation namely Cre1 (34) which is still intact(Figure 4a) The consensus sequence for Cre1 DNAbinding (50-SYGGRG-30) was previously investigated byEMSA and in vitro footprinting (35) As before the strainswere cultivated on glucose (repressing condition) orD-xylose (inducing condition) As mentioned aboveagain reference to naked DNA generally highlights ahigh number of bases as protected or hypersensitive butdoes not provide a condition-specific pattern (Figure 4b)A direct comparison of in vivo footprinting results (re-pressing conditions referred to inducing conditions) ofthe wild-type (Figure 4b GXO) with those of the xyr1deletion strain (Figure 4b xyr1-Gxyr1-XO) revealedthat while the hypersensitivity at the Xyr1-binding sitedisappears the protection at the Cre1-binding site isincreased in the deletion strain This observation is notunexpected as the activator Xyr1 is not contacting thisregulatory region in the deletion strain and Cre1 whichwas shown to be involved in chromatin packaging (42)can now deploy its repressor function unrestrainedly
Applying the new in vivo footprinting technique topreviously identified URRs
In vivo footprinting of the URR of the cbh2 geneIn 1998 the CAE in T reesei was reported to be crucial forregulation of cbh2 gene expression encoding a major cel-lulase (31) Meanwhile Xyr1 was identified as the majortransactivator of most hydrolase-encoding genes includingcbh2 (262843) Allowing one mismatch in the Xyr1-binding motif reveals that the CAE consists of aputative Xyr1-binding site and an overlapping CCAAT-box which is a common cis element in URRs of eukary-otes Therefore we analysed an URR including the CAEas well as two additional in silico identified Xyr1-bindingsites (allowing one mismatch) and a putative Cre1-bindingsite (Figure 5a) We performed in vivo footprinting ofmycelia from repressing conditions (glucose) inducingconditions (sophorose) and used the sample gainedfrom incubation without carbon source as the referenceconditionThe CCAAT-box within the CAE and an adjacent
A-stretch reacts strongly glucose-dependent (Figure 5cGNC SOG) while the Xyr1-binding site within theCAE does not yield condition-specific differences(Figure 5b) These two observations might suggest that acarbon source-specific response is mediated via the CCAAT-box while Xyr1 binds permanently The latter assump-tion is in good accordance with the finding that no de novosynthesis of Xyr1 is necessary for an initial induction oftarget genes suggesting that Xyr1 is always available in thecell at a low level (44) However the new method
Figure 2 Comparison of the traditional in vivo footprinting to the newlydeveloped method In vivo footprinting analysis of the coding strand of axyn1 URR (433- to 394-bp upstream from ATG) covering two Xyr1-binding sites which are indicated by red lines (solid site is located on thecoding strand dashed site is located on the non-coding strand) wasperformed Trichoderma reesei cultivated on glucose (G) or D-xylose(XO) followed by DMS-induced in vivo methylation and naked DNAas a reference (ND) were analysed Left side shows a gel obtained by thetraditional method Asterisks indicate protected bases Right side shows aheatmap yielded by the newly developed method
PAGE 7 OF 12 Nucleic Acids Research 2014 Vol 42 No 1 e1
Dow
nloaded from httpsacadem
icoupcomnararticle421e12437564 by guest on 30 D
ecember 2021
demonstrates that the two additional in silico identifiedXyr1-binding sites are active but seem to be contacted ina condition-dependent way (Figure 5b and c) This coin-cides with findings that cbh2 induction by sophorose goesalong with increased xyr1 transcript formation (45)
Finally the condition-dependent comparison reveals anot yet verified single Cre1-binding site as active regula-tory element giving glucose-dependent signals (Figure 5b)Transcript analysis of cbh2 is complementary toin vivo footprinting data eg the induction-dependent
Figure 3 Comparison of two biological replicates analysed by the newly developed in vivo footprinting method In vivo footprinting analysis of thenon-coding strand of a xyn1 URR (388- to 417-bp upstream from ATG) covering a Cre1-binding site (underlined in blue) and a Xyr1-binding site(underlined in red) was performed Trichoderma reesei cultivated on glucose (G) or D-xylose (XO) followed by DMS-induced in vivo methylation andnaked DNA as a reference (ND) were analysed (a) Original data of two biological replicates (Replicates 1 and 2) obtained after CGE displayed aselectropherograms next to each other Peaks in the electropherograms of the glucose replicates are marked by the corresponding DNA bases foreasier orientation (b) Analysed data of two biological replicates (indicated by the numbers 1 and 2) using ivFAST displayed as heatmaps under eachother (c) Analysed data of two biological replicates (indicated by the numbers 1 and 2) using ivFAST if one replicate refers to the other displayedas a heatmap
e1 Nucleic Acids Research 2014 Vol 42 No 1 PAGE 8 OF 12
Dow
nloaded from httpsacadem
icoupcomnararticle421e12437564 by guest on 30 D
ecember 2021
(sophorose) protection of the activatorrsquos (Xyr1)-bindingsites or the repression-dependent (glucose) protectionof the repressorrsquos (Cre1)-binding site (SupplementaryFigure S2b)
In vivo footprinting of the URR of the xyn2 geneThe URR of the xyn2 gene whose product is the mainendo-xylanase of T reesei has a similar architecture as theone of cbh2 In 2003 the XAE comprising a CCAAT-boxadjacent to a Xyr1-binding site was reported to be essen-tial for xyn2 expression (30) The XAE is located close to asecond Xyr1-binding site (bearing two mismatches)(Figure 6a IV and V) Both Xyr1-binding sites need to
be intact for binding Xyr1 in vitro and in vivo (46)Upstream of the XAE an AGAA-box has before beendescribed as a cis element mediating repression (4647)(Figure 6a III) We performed in vivo footprinting ofmycelia from repressing conditions (glucose) inducingconditions (D-xylose) and the reference condition(without carbon source) On the one hand we confirmedthe above-mentioned previously identified cis elementsand additionally revealed condition-dependent contactingby their trans factors (Figure 6b and c)Interestingly the new in vivo footprinting method
identified a second AGAA-box which is located 4-bpupstream of the first one and arranged as inverted repeat
Figure 5 In vivo footprinting analysis of the T reesei cbh2 URR (a) A cbh2 URR covering the cellulase activating element (CAE) comprising aCCAAT-box (yellow) and a Xyr1-binding site (red) two additional Xyr1-binding sites and a Cre1-binding site (blue) was investigated (258- to198-bp upstream from ATG) The coding strand (b) and the non-coding strand (c) were analysed after incubation of T reesei on sophorose (SO)glucose (G) or without carbon source (NC) followed by DMS-induced in vivo methylation
Figure 4 Comparison of in vivo footprinting results of a deletion and a parental strain (a) In vivo footprinting analysis of a xyn1 URR (388- to417-bp upstream from ATG) covering a Cre1-binding site (underlined in blue) and a Xyr1-binding site (underlined in red) was performed (b) Thenon-coding strand was analysed after incubation of the T reesei parental and a xyr1 deletion strain (xyr1) on glucose (G) or D-xylose (XO)followed by DMS-induced in vivo methylation Naked DNA was used as a reference (ND)
PAGE 9 OF 12 Nucleic Acids Research 2014 Vol 42 No 1 e1
Dow
nloaded from httpsacadem
icoupcomnararticle421e12437564 by guest on 30 D
ecember 2021
(Figure 6b II) The occurrence of the AGAA-motif as apalindrome is in accordance to an earlier report that thiscis element is contacted by a basic helixndashloopndashhelix tran-scription factor which canonically binds as dimer (47)Also a yet not recognized single Cre1-binding sitecould be identified (Figure 6b VI) exhibiting a glucose-dependent protection (Figure 6b GXO 6 c GNC)Additionally a palindromic Xyr1-binding site spaced by1 bp was revealed of which both sites yield condition-specific differences (Figure 6b c VIII)However in vivo footprinting of this region highlighted
two more regions which are contacted in a condition-dependent way The first one 50-ATTGATG-30 (251 to245 bp) yields signals on both investigated strands(Figure 6b c I) and bears an unusual TCAAT-box(Figure 6c I) The second one 50-GCAAGCTTG-30
(177 to 169 bp) also yields signals on both investigatedstrands and contains an octameric palindrom (CAAGCTTG) overlapping with an Ace1-binding site [50-AGGCA-30 (48)] (Figure 6b c VII) Ace1 is a narrow domain
transcription factor functioning as repressor of cellulaseand xylanase expression (48) A sound interpretation oftranscript analysis (Supplementary Figure S2c) comparedwith in vivo footprinting data in this case is difficult to pro-vide because too many new motifs of which the regula-tory function is unknown were identified Howeverinduction- or repression-dependent protectionhypersensi-tivity was observed indicating regulatory functionality
Comparison of regulatory and non-regulatory regionsIn order to validate the false positive signal rate of themethod we performed footprinting analyses of longerupstream sequences of the above-described genes iexyn1 xyn2 and cbh2 The analysed fragments coverregions previously reported to be regulatory and non-regulatory each (29ndash31344149) The heatmaps obtainedby referring in vivo footprinting results from repressingand inducing conditions to each other are provided inSupplementary Figures S3ndashS5 respectively To get add-itional indication on proteinndashDNA interaction the refer-ence of in vivo footprinting samples to naked DNA is also
Figure 6 In vivo footprinting analysis of the T reesei xyn2 URR (a) A xyn2 URR showing a high number of cis elements [AGAA-box (green)CCAAT-box (yellow) Xyr1-binding site (red) and Cre1-binding site (blue)] was investigated (252- to 138-bp upstream from ATG) Thecoding strand (b) and the non-coding strand (c) were analysed after incubation of T reesei on glucose (G) D-xylose (XO) or without carbonsource (NC) followed by DMS-induced in vivo methylation Newly identified motifs are given in frame motifs with DNA sequence not reportedbefore are given in purple
e1 Nucleic Acids Research 2014 Vol 42 No 1 PAGE 10 OF 12
Dow
nloaded from httpsacadem
icoupcomnararticle421e12437564 by guest on 30 D
ecember 2021
included It is noteworthy that previously identified motifs(Figures 4ndash6) also show protectionhypersensitivity whenin vivo footprinting samples were compared with nakedDNA (Supplementary Figures S3ndashS5) Most of the add-itionally detected signals can be assigned to known motifs(details are described in the respective legends toSupplementary Figures S3ndashS5) whereas long sequencestretches without any known motif hardly yieldedsignals In case of xyn2 the two newly identified beforeunknown motifs (compare Figure 6 I VII) are also dis-played by the comparison to naked DNA (SupplementaryFigure S5)
Potential of the in vivo footprinting method
As already outlined the software-based in vivo footprint-ing method presented in this study provides the possibilityto identify cis elements in a fast and sensitive way We areconvinced that this method is a very useful tool for abroad range of investigations concerning regulatoryelements not only in filamentous fungi but in all organ-isms It is important to note that in this study footprintingwas performed with DMS followed by HCl DNA cleavagebecause this a good practice in case of filamentous fungiHowever the proposed approach in particular DNAfragment analysis and data analysis by ivFAST is notlimited to a certain footprinting or DNA cleavagereagent The ivFAST manual explains how to adjust par-ameters in order to analyse data obtained from other foot-printing techniques Compared with the traditional in vivofootprinting approach our method employs an internalstandard This allows a comparison of the URR of agene from any number of conditions or strains cell linesor tissues without necessity for generating all data at thesame time Because of this and the fact that the methodis highly robust (biological and technical replicates donot show relevant differences) it is possible to establishan open-end database for each URR of interestFurthermore generated datasets provide a quantitativeinsight into trans factorcis element interaction depictedby a gradual display of results (heatmap) The new foot-printing method allows the identification of new variantsof already known cis elements and of completely newmotifs This is achieved by shuffling the respective pair-wise comparisons of conditions or cells of interestIncluding data from trans factor deletion strainscells insuch a database makes the assignment of the according ciselement possible It is noteworthy that some improve-ments of the described technique are also useful forin vitro footprinting of purified proteins
SUPPLEMENTARY DATA
Supplementary Data are available at NAR Onlineincluding [5051]
ACKNOWLEDGEMENTS
The authors thank John Tomashek for a critical discus-sion on the present study
FUNDING
Austrian Science Fund FWF [P20192 to RLM V232-B20 to ARM-A] Vienna University of Technology[AB-Tec doctoral program] Iogen Corp (to RLM)Funding for open access charge Austrian Science FundFWF
Conflict of interest statement None declared
REFERENCES
1 NarlikarL and OvcharenkoI (2009) Identifying regulatoryelements in eukaryotic genomes Brief Funct Genomic Proteomic8 215ndash230
2 DynanWS and TjianR (1985) Control of eukaryotic messengerRNA synthesis by sequence-specific DNA-binding proteinsNature 316 774ndash778
3 ManiatisT GoodbournS and FischerJA (1987) Regulation ofinducible and tissue-specific gene expression Science 2361237ndash1245
4 JacksonPD and FelsenfeldG (1985) A method for mappingintranuclear protein-DNA interactions and its application to anuclease hypersensitive site Proc Natl Acad Sci USA 822296ndash2300
5 JacksonPD and FelsenfeldG (1987) In vivo footprinting ofspecific protein-DNA interactions Methods Enzymol 152735ndash755
6 KemperB JacksonPD and FelsenfeldG (1987) Protein-bindingsites within the 50 DNase I-hypersensitive region of the chickenalpha D-globin gene Mol Cell Biol 7 2059ndash2069
7 ZinnK and ManiatisT (1986) Detection of factors that interactwith the human beta-interferon regulatory region in vivo byDNAase I footprinting Cell 45 611ndash618
8 EphrussiA ChurchGM TonegawaS and GilbertW (1985) Blineagendashspecific interactions of an immunoglobulin enhancer withcellular factors in vivo Science 227 134ndash140
9 GinigerE VarnumSM and PtashneM (1985) Specific DNAbinding of GAL4 a positive regulatory protein of yeast Cell 40767ndash774
10 ShawPE and StewartAF (2001) Identification of protein-DNAcontacts with dimethyl sulfate Methylation protection andmethylation interference Methods Mol Biol 148 221ndash227
11 MuellerPR and WoldB (1989) In vivo footprinting of a musclespecific enhancer by ligation mediated PCR Science 246780ndash786
12 DrouinR TherrienJP AngersM and OuelletS (2001) In vivoDNA analysis Methods Mol Biol 148 175ndash219
13 GarrityPA and WoldBJ (1992) Effects of different DNApolymerases in ligation-mediated PCR enhanced genomicsequencing and in vivo footprinting Proc Natl Acad Sci USA89 1021ndash1025
14 MuellerPR SalserSJ and WoldB (1988) Constitutive andmetal-inducible proteinDNA interactions at the mousemetallothionein I promoter examined by in vivo and in vitrofootprinting Genes Dev 2 412ndash427
15 GilmourDS and FanR (2009) Detecting transcriptionallyengaged RNA polymerase in eukaryotic cells with permanganategenomic footprinting Methods 48 368ndash374
16 WolschekMF NarendjaF KarlsederJ KubicekCPScazzocchioC and StraussJ (1998) In situ detection of protein-DNA interactions in filamentous fungi by in vivo footprintingNucleic Acids Res 26 3862ndash3864
17 TrothaR ReichlU ThiesFL SperlingD KonigW andKonigB (2002) Adaption of a fragment analysis technique to anautomated high-throughput multicapillary electrophoresis devicefor the precise qualitative and quantitative characterization ofmicrobial communities Electrophoresis 23 1070ndash1079
18 HartlL and SeefelderS (1998) Diversity of selected hop cultivarsdetected by fluorescent AFLPs Theor Appl Genet 96 112ndash116
19 ZianniM TessanneK MerighiM LagunaR and TabitaFR(2006) Identification of the DNA bases of a DNase I footprint by
PAGE 11 OF 12 Nucleic Acids Research 2014 Vol 42 No 1 e1
Dow
nloaded from httpsacadem
icoupcomnararticle421e12437564 by guest on 30 D
ecember 2021
the use of dye primer sequencing on an automated capillaryDNA analysis instrument J Biomol Tech 17 103ndash113
20 IngramR GaoC LebonJ LiuQ MayoralRJ SommerSSHoogenkampM RiggsAD and BoniferC (2008) PAP-LMPCRfor improved allele-specific footprinting and automatedchromatin fine structure analysis Nucleic Acids Res 36 e19
21 IngramR TagohH RiggsAD and BoniferC (2005) Rapidsolid-phase based automated analysis of chromatin structure andtranscription factor occupancy in living eukaryotic cells NucleicAcids Res 33 e1
22 DaiSM ChenHH ChangC RiggsAD and FlanaganSD(2000) Ligation-mediated PCR for quantitative in vivofootprinting Nat Biotechnol 18 1108ndash1111
23 BrewerAC MarshPJ and PatientRK (1990) A simplifiedmethod for in vivo footprinting using DMS Nucleic Acids Res18 5574
24 DimitrovaD GiaccaM and FalaschiA (1994) A modifiedprotocol for in vivo footprinting by ligation-mediated polymerasechain reaction Nucleic Acids Res 22 532ndash533
25 GrangerSW and FanH (1998) In vivo footprinting of theenhancer sequences in the upstream long terminal repeat ofMoloney murine leukemia virus differential binding of nuclearfactors in different cell types J Virol 72 8961ndash8970
26 StrickerAR Grosstessner-HainK WurleitnerE and MachRL(2006) Xyr1 (xylanase regulator 1) regulates both the hydrolyticenzyme system and D-xylose metabolism in Hypocrea jecorinaEukaryot Cell 5 2128ndash2137
27 StrickerAR MachRL and de GraaffLH (2008) Regulationof transcription of cellulases- and hemicellulases-encoding genes inAspergillus niger and Hypocrea jecorina (Trichoderma reesei)Appl Microbiol Biotechnol 78 211ndash220
28 FurukawaT ShidaY KitagamiN MoriK KatoMKobayashiT OkadaH OgasawaraW and MorikawaY (2009)Identification of specific binding sites for XYR1 a transcriptionalactivator of cellulolytic and xylanolytic genes in Trichodermareesei Fungal Genet Biol 46 564ndash574
29 RauscherR WurleitnerE WacenovskyC AroNStrickerAR ZeilingerS KubicekCP PenttilaM andMachRL (2006) Transcriptional regulation of xyn1 encodingxylanase I in Hypocrea jecorina Eukaryot Cell 5 447ndash456
30 WurleitnerE PeraL WacenovskyC CziferszkyA ZeilingerSKubicekCP and MachRL (2003) Transcriptional regulation ofxyn2 in Hypocrea jecorina Eukaryot Cell 2 150ndash158
31 ZeilingerS MachRL and KubicekCP (1998) Two adjacentprotein binding motifs in the cbh2 (cellobiohydrolase II-encoding)promoter of the fungus Hypocrea jecorina (Trichoderma reesei)cooperate in the induction by cellulose J Biol Chem 27334463ndash34471
32 IlmenM ThraneC and PenttilaM (1996) The glucose repressorgene cre1 of Trichoderma isolation and expression of a full-lengthand a truncated mutant form Mol Gen Genet 251 451ndash460
33 IlmenM OnnelaML KlemsdalS KeranenS and PenttilaM(1996) Functional analysis of the cellobiohydrolase I promoter ofthe filamentous fungus Trichoderma reesei Mol Gen Genet 253303ndash314
34 MachRL StraussJ ZeilingerS SchindlerM andKubicekCP (1996) Carbon catabolite repression of xylanaseI (xyn1) gene expression in Trichoderma reesei Mol Microbiol21 1273ndash1281
35 StraussJ MachRL ZeilingerS HartlerG StofflerGWolschekM and KubicekCP (1995) Cre1 the carbon cataboliterepressor protein from Trichoderma reesei FEBS Lett 376103ndash107
36 MantylaAL RossiKH VanhanenSA PenttilaMESuominenPL and NevalainenKM (1992) Electrophoretickaryotyping of wild-type and mutant Trichoderma longibrachiatum(reesei) strains Curr Genet 21 471ndash477
37 MandelsM (1985) Applications of cellulases Biochem SocTrans 13 414ndash416
38 GruberF VisserJ KubicekCP and de GraaffLH (1990)The development of a heterologous transformation system forthe cellulolytic fungus Trichoderma reesei based on a pyrG-negative mutant strain Curr Genet 18 71ndash76
39 MaxamAM and GilbertW (1980) Sequencing end-labeled DNAwith base-specific chemical cleavages Methods Enzymol 65499ndash560
40 SteigerMG MachRL and Mach-AignerAR (2010)An accurate normalization strategy for RT-qPCRin Hypocrea jecorina (Trichoderma reesei) J Biotechnol 14530ndash37
41 ZeilingerS MachRL SchindlerM HerzogP andKubicekCP (1996) Different inducibility of expression ofthe two xylanase genes xyn1 and xyn2 in Trichoderma reeseiJ Biol Chem 271 25624ndash25629
42 ZeilingerS SchmollM PailM MachRL and KubicekCP(2003) Nucleosome transactions on the Hypocreajecorina (Trichoderma reesei) cellulase promoter cbh2associated with cellulase induction Mol Genet Genomics 27046ndash55
43 StrickerAR SteigerMG and MachRL (2007) Xyr1 receivesthe lactose induction signal and regulates lactose metabolism inHypocrea jecorina FEBS Lett 581 3915ndash3920
44 Mach-AignerAR PucherME SteigerMG BauerGEPreisSJ and MachRL (2008) Transcriptional regulation ofxyr1 encoding the main regulator of the xylanolytic andcellulolytic enzyme system in Hypocrea jecorina Appl EnvironMicrobiol 74 6554ndash6562
45 DerntlC Gudynaite-SavitchL CalixteS WhiteT MachRLand Mach-AignerAR (2013) Mutation of the Xylanase regulator1 causes a glucose blind hydrolase expressing phenotype inindustrially used Trichoderma strains Biotechnol Biofuels 6 62
46 StrickerAR TrefflingerP AroN PenttilaM and MachRL(2008) Role of Ace2 (Activator of Cellulases 2) within the xyn2transcriptosome of Hypocrea jecorina Fungal Genet Biol 45436ndash445
47 Mach-AignerAR Grosstessner-HainK Pocas-FonsecaMJMechtlerK and MachRL (2010) From an electrophoreticmobility shift assay to isolated transcription factors a fastgenomic-proteomic approach BMC Genomics 11 644
48 AroN IlmenM SaloheimoA and PenttilaM (2003) ACEI ofTrichoderma reesei is a repressor of cellulase and xylanaseexpression Appl Environ Microbiol 69 56ndash65
49 StanglH GruberF and KubicekCP (1993) Characterizationof the Trichoderma reesei cbh2 promoter Curr Genet 23115ndash122
50 AndrianopoulosA and TimberlakeWE (1994) The Aspergillusnidulans abaA gene encodes a transcriptional activator that actsas a genetic switch to control development Mol Cell Biol 142503ndash2515
51 MetzB Seidl-SeibothV HaarmannT KopchinskiyALorenzP SeibothB and KubicekCP (2011) Expressionof biomass-degrading enzymes is a major event duringconidium development in Trichoderma reesei Eukaryot Cell 101527ndash1535
e1 Nucleic Acids Research 2014 Vol 42 No 1 PAGE 12 OF 12
Dow
nloaded from httpsacadem
icoupcomnararticle421e12437564 by guest on 30 D
ecember 2021
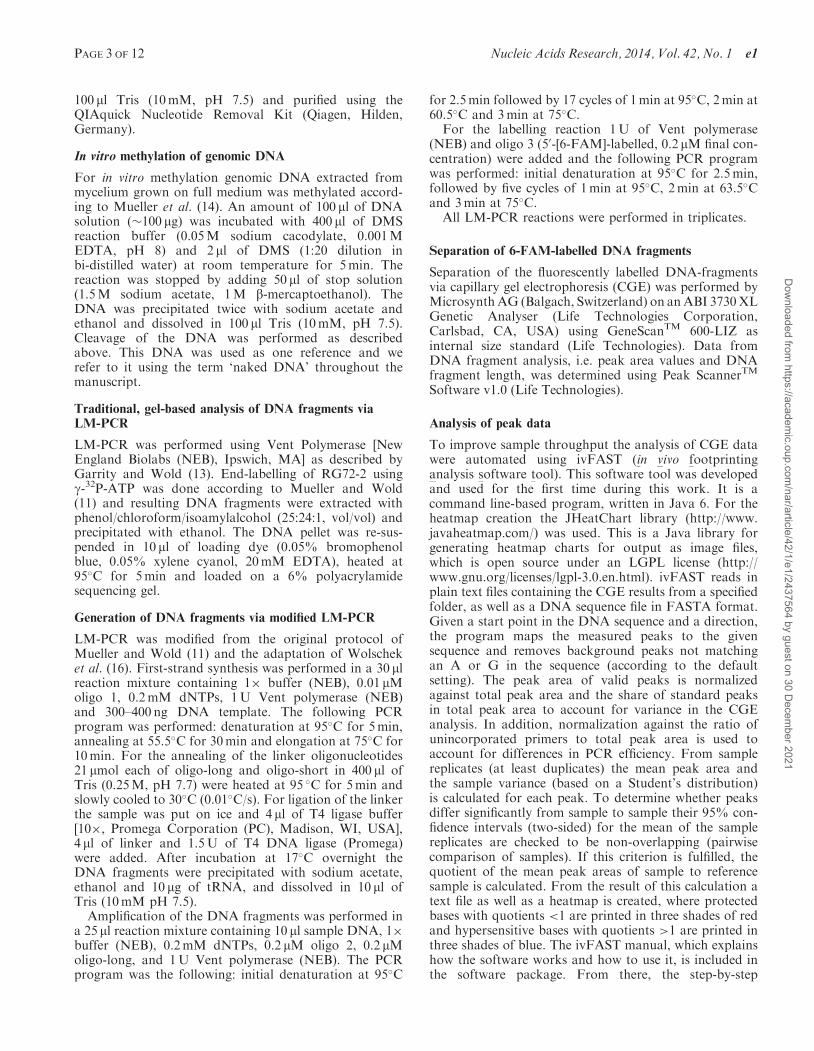
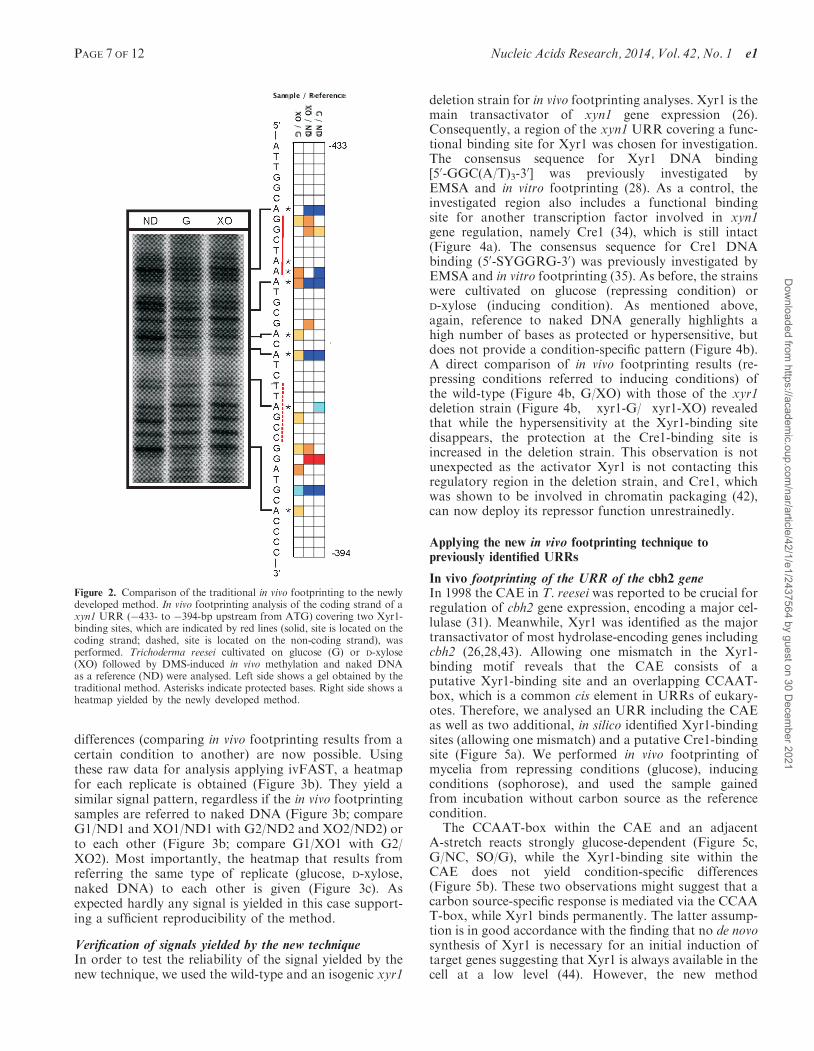
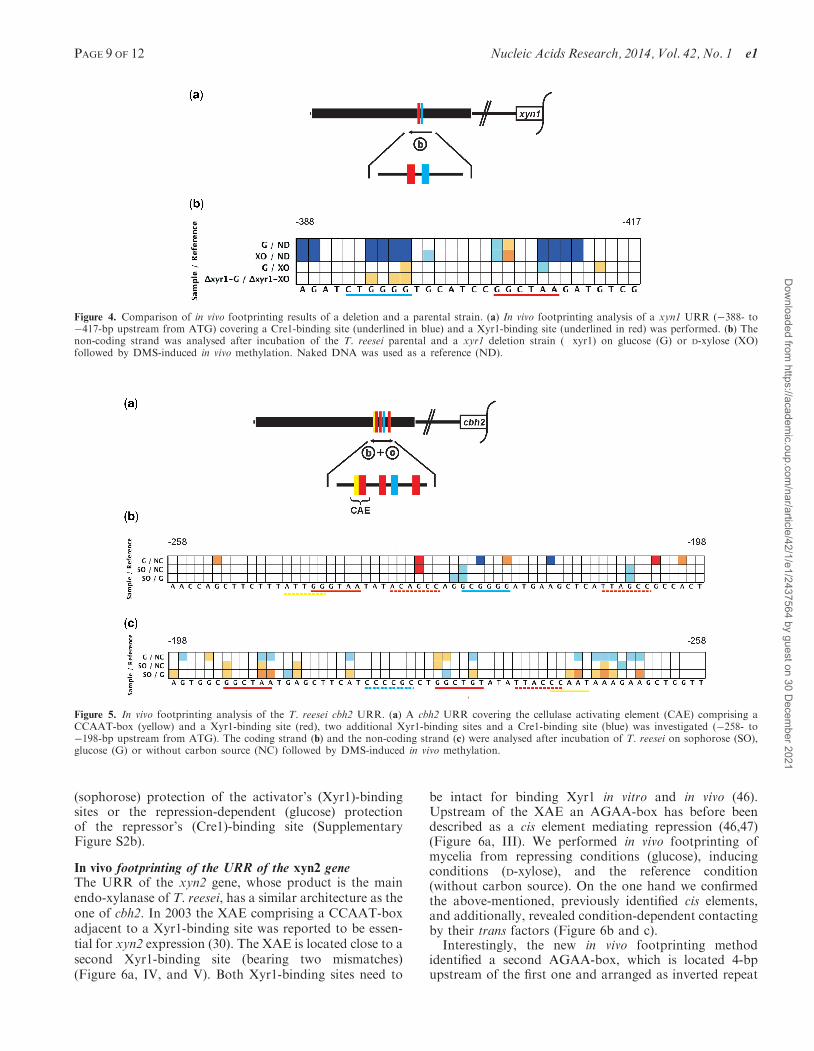