a historical-institutional study of the welfare systems in
TRANSCRIPT

Bucknell UniversityBucknell Digital Commons
Honors Theses Student Theses
2014
A Historical-Institutional Study of the WelfareSystems in the United States and Sweden: NetSocial Wage ApproachSarah Elliott BlankBucknell University, [email protected]
Follow this and additional works at: https://digitalcommons.bucknell.edu/honors_theses
This Honors Thesis is brought to you for free and open access by the Student Theses at Bucknell Digital Commons. It has been accepted for inclusion inHonors Theses by an authorized administrator of Bucknell Digital Commons. For more information, please contact [email protected].
Recommended CitationBlank, Sarah Elliott, "A Historical-Institutional Study of the Welfare Systems in the United States and Sweden: Net Social WageApproach" (2014). Honors Theses. 257.https://digitalcommons.bucknell.edu/honors_theses/257

Chapter 1: Introduction…………………………………………………….……..page 4 1.1 Welfare and Its Common Critiques……………………………………..page 4 1.2 Path Dependency of a Welfare State…………………………….…...….page 7
Chapter 2: Historical Context……………………………………………………..page 9 2.1 Foundational Period………………….................................................….page 9 2.2 The American Welfare System Plays Catches Up………………….….page 12 2.3 The Golden Age and The Great Society Years………………...…...….page 16 2.4 International Attack on the Welfare State…………………...………....page 20 Chapter 3: Net Social Wage……………………………………………….……..page 25 3.1 Literature Review…………………………………………………...….page 25 3.2 Methodology……………………………………………………...……page 28 Chapter 4: Results……………………………………………………….………..page 34 4.1 The Case of an Increasing Net Social Wage: United States………...….page 34 4.2 The Case of a Decreasing Net Social Wage: Sweden…………...……..page 37 4.3 Comparison of Expenditures and Taxes…………………...…………...page 39 Chapter 5: Conclusion……………………………………………..……………..page 42 References……………………………………………………..…………………..page 44 Data Appendix……………………………………………………………...……..page 46
2

List of Figures: Figure 1: Growth Rate of GDP per Capita vs. Public Social Expenditures as a Percentage of GDP (average for 1980 to 2012) Source: OECD Figure 2: Public Social Expenditures as a Percentage of GDP Source: OECD Figure 3: Percent of Americans Living Below the Poverty Line (after taxes) Source: OECD Figure 4: Taxes in the United States (billions of U.S. dollars) Source: BEA, NIPA Figure 5: Taxes in Sweden (billions of Swedish kronor) Source: OECD Figure 6: Net Social Wage in the United States (billions of U.S. dollars) Source: BEA, NIPA Figure 7: Benefits and Taxes in the United States (billions of U.S. dollars) Source: BEA, NIPA Figure 8: Net Social Wage as a Percentage of GDP in the United States Source: BEA, NIPA Figure 9: Net Social Wage in Sweden (billions of Swedish kronor) Source: Statistics Sweden and OECD Figure 10: Benefits and Taxes in Sweden (billions of Swedish kronor) Source: Statistics Sweden and OECD Figure 11: Net Social Wage as a Percentage of GDP in Sweden Source: Statistics Sweden and OECD Figure 12: Net Social Wage in the United States and Sweden Source: See data appendix Figure 13: Share in Total Expenditures in the United States Source: BEA, NIPA Figure 14: Share in Total Expenditures in Sweden Source: OECD Figure 15: Share in Total Taxes in the United States Source: BEA, NIPA Figure 16: Share in Total Taxes in Sweden Source: OECD List of Tables: Table 1: Annual Growth in GDP per Capita (%) Source: Madisson, 2007, table B-19, p. 262 Table 2: Government Employment: Sweden, 1870-1994 (% of total employment) Source: Steinmo, 2002, table B-19, p. 20 Table 3: Net Social Wage for the United States, year 2000 (billions of U.S. dollars) Source: See data appendix Table 4: Net Social Wage for Sweden, year 2000 (billions of Swedish kronor) Source: See data appendix
3

Chapter 1: Introduction
1.1 Welfare and Its Common Critiques
Before we begin a comparison between welfare systems by calculating the net
social wage, it is vital to first define what a welfare system is. Michael Katz (2010, p.
510) explains that a welfare system is a collection of institutionalized programs that are
designed to protect “against the risks inherent in human life—unemployment, poverty,
sickness and old age – that in one way or another confront everyone.” Donatella Gatti and
Andrew Glyn (2006) further add that the three main objectives of a welfare system are to:
protect workers, provide insurance for life events that affect us all and reduce inequality.
Today in the United States when policy makers and the mainstream media attack
the welfare system it is usually in reference to government handouts to the “undeserving
poor.” However narrowly defining welfare as government handouts to the “undeserving”
excludes the majority of welfare expenditures that in reality go to programs such as
education, social security, medical coverage for the elderly and insurance for the
disabled. Yet it is no accident that these forms of welfare are ignored in the discussion
today. By ignoring these forms of “deserving” assistance and in turn only focusing on the
“undeserving,” the attack on the welfare system seems justified (Moudud and Zacharias,
1999; Katz, 2010). Further this group of “undeserving” recipients has over time become
concentrated on unmarried women of color so that today the welfare system in the United
States has “acquired the combined stigmas of race [and] gender” (Katz, 2010, p. 509).
Although this attack on welfare has certainly intensified in the past thirty years,
the distinction between “social security” and “welfare” within the United States can be
traced back to the foundation of the original Social Security Act of 1935. While it is true
4

that some politicians fought for a more inclusive policy, what in the end was enacted in
the original Social Security Act outlined very minimal and temporary public assistance
programs, directed only for the sick and elderly. This very clearly separated public
assistance, what we consider welfare today, from social insurance, and additionally
excluded health care from the act all together (Moudud and Zacharias, 1999).
On top of the sociological attacks, mainstream economists also critique the
welfare system. The most common neoclassical economic criticism has always been
based on the belief that the welfare system conflicts with the process of capital
accumulation, which is deemed to be the driver of economic growth. The defenders of
this view assert that the welfare system introduces labor market distortions, reduces the
efficiency of the private sector by crowding out private investment and increases budget
deficits and public debt (Moudud and Zacharias, 1999).
These conservative critiques of the welfare system rely on three major
assumptions that are based on economic theory, but are unrealistic in practice. The first
assumption is that market forces determine wages so that wages rise and fall in line with
the supply of and the demand for labor. In other words, full employment is possible as
long as wages are flexible enough to achieve the labor market equilibrium. However, in
reality wages are determined by institutional and historical factors, making zero or very
low unemployment practically impossible. Thus, the conservative critique that welfare
systems introduce labor market distortions is unwarranted. In fact, increased government
spending on social programs such as unemployment insurance and labor training should
decrease unemployment by increasing the demand for labor and serve as a protection for
the unemployed (Moudud & Zacharias, 2000).
5

The second major assumption made by supply-side economists is that household
savings decisions drive long-run growth. However as Jamee Moudad and Ajit Zacharias
(1999) point out, household saving rates do not determine interest rates, but are instead
the result of them. In line with the Keynesian economics view, Moudud and Zacharias
(2000, p.3) argue that “what is important for capital accumulation is not aggregate
savings but the investable surplus, which is that portion of private (business and
household) savings that is available for investment in the business sector after the rest of
savings in the private sector has been set aside as money and bonds.”
The final assumption neoclassical economists make to rationalize their attack on
the welfare system is that welfare systems increase government deficit and public debt.
The argument follows that the costs of welfare programs outweigh their benefits. To
justify their position, neoclassical economists commonly cite the vast amount of
individuals who abuse these programs such as the earlier described depiction of
unmarried welfare mothers or individuals who receive unemployment benefits without
looking for a job (Freeman, Swedenborg and Topel, 2005). Although evidence showing
the relationships between economic growth rates and the size of the welfare system are
somewhat mixed, as Figure 1 demonstrates we do know that in terms of measured GDP
per capita, welfare spending and aggregate economic performance are not negatively
correlated (Atkinson, 1999).
6

Figure 1: Growth Rate of GDP per Capita vs. Public Social Expenditures of GDP (average for 1980 to 2012)
Source: OECD Data Set (see data appendix for details)
Through measuring net social wage, the difference between the social expenditure
and taxes for the working class, for the United States and for Sweden, this paper will
dispute these three mainstream assumptions. The net social wage in both Sweden and the
United States over the past 50 years has been virtually zero1. This proves, in part, that
despite the differences in the welfare systems in the two countries, as a whole, social
expenditures on the working population does not cause an economic drain.
1.2 Path Dependency of a Welfare State
We can now turn to look at how and why the U.S. and Sweden have developed
such distinct welfare systems. To get an idea of the variance in the size of the welfare
systems, I refer to the percentage of Gross Domestic Product that both Sweden and the
United States have spent on social programs over the past 30 years. As one can see from
figure 2, for the past 30 years Sweden has spent an average of just under 29% of their
GDP on social spending while the United States has spent an average of 17%.
1 See figure 12
Finland
France
Germany Japan
Netherlands
Norway Sweden
U.S. UK
Canada Denmark
7
0.0
0.5
1.0
1.5
2.0
2.5
0 5 10 15 20 25 30 35
Grow
th R
ate
of G
DP
per
Capi
ta
Public Social Expenditures as a Percentage of GDP
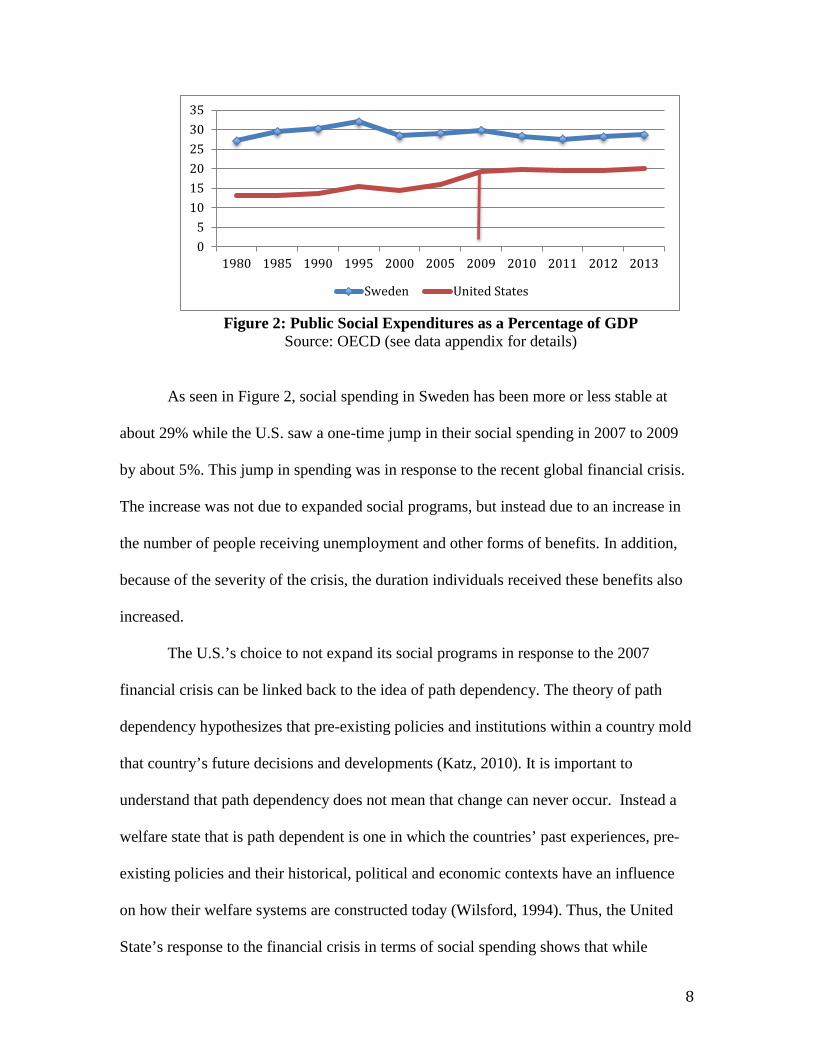
Figure 2: Public Social Expenditures as a Percentage of GDP
Source: OECD (see data appendix for details)
As seen in Figure 2, social spending in Sweden has been more or less stable at
about 29% while the U.S. saw a one-time jump in their social spending in 2007 to 2009
by about 5%. This jump in spending was in response to the recent global financial crisis.
The increase was not due to expanded social programs, but instead due to an increase in
the number of people receiving unemployment and other forms of benefits. In addition,
because of the severity of the crisis, the duration individuals received these benefits also
increased.
The U.S.’s choice to not expand its social programs in response to the 2007
financial crisis can be linked back to the idea of path dependency. The theory of path
dependency hypothesizes that pre-existing policies and institutions within a country mold
that country’s future decisions and developments (Katz, 2010). It is important to
understand that path dependency does not mean that change can never occur. Instead a
welfare state that is path dependent is one in which the countries’ past experiences, pre-
existing policies and their historical, political and economic contexts have an influence
on how their welfare systems are constructed today (Wilsford, 1994). Thus, the United
State’s response to the financial crisis in terms of social spending shows that while
05
101520253035
1980 1985 1990 1995 2000 2005 2009 2010 2011 2012 2013
Sweden United States
8

change can occur in response to a major event like an economic downturn, the type and
scope of the changes are highly dependent on the country’s history.
Thus, to understand both the American and the Swedish welfare systems today it
is essential to look at the historical trajectories of the two countries’ welfare systems.
Only then can we understand how path dependency and seemingly minute decisions
made over a hundred years ago, still affect Sweden and the United States’ welfare
systems today. As Gatti and Glyn (2006, p. 311) point out “it is their evolution, not some
remorseless economic logic, that will determine the future of the welfare state.”
Chapter 2: Historical Context
2.1 Foundational Period
United States
In the seventeenth century, the colonists brought with them to the United States
the Elizabethan Poor Laws. Created in England in the late-sixteenth and early-
seventeenth century, these laws established the principle of local responsibility for the
needy through local churches. This meant that the burden of supervision and monetary
responsibility fell on the members of the local community. This burden of responsibility
combined with high taxes to pay for those who needed assistance made newly
independent Americans dislike these laws from the start. Even though these laws were at
times suspended, the new states begrudgingly recognized the need for some sort of
support for the poor and needy, leading to the long-lasting existence of these laws
(Trattner, 1999).
9
Although imperfect, the Elizabethan Poor Laws remained virtually unchanged
until the Civil War. Beginning in 1862, states began to appropriate funds for the care of
veterans and their families. Within the year, the national government followed suit. At
the same time, many organizations such as the Sanitary Commission (1861) and the New
York State Charities Aid Association (1872) were founded to aid war veterans and their
families through private funds (Trattner, 1999). Even though welfare awareness and
support generally increased during the time of the Civil War, federal government support
was only temporary. Once the Civil War ended, the federal government no longer took
responsibility for the organization and funding of welfare programs, leaving all
responsibility to the states and private charities. With the states free to design their own
welfare laws, different forms of social spending proliferated. In the South, where racist
views were prevalent, blacks were often altogether barred from receiving any sort of aid.
The federal government did not interfere with any of the states’ choices (Trattner, 1999).
After the Civil War, as the economy boomed and the wounds of the recent war
began to fade, the idea of Scientific Charity began to grow. Scientific Charity was built
on the notion of self-reliance and limited government and fit extremely well with the
recently popular concept of Social Darwinism. Together these two ideas led charities to
shape social support around “fixing” individuals through discipline and religious
education. Although not all Americans believed in these ideas, the general popularity of
these concepts altered the public opinion of Americans so that unemployment and
poverty became seen as issues of the individual and not of the system. This new attitude,
decreased citizens support for any government welfare spending (Trattner, 1999).
Although private agencies continued to provide relief to the poor, their work tried to
10

“fix” the individual and never addressed the systematic issues of unemployment, poverty,
or the income gap directly. Additionally, left over from relief practices enacted during the
Civil War, any form of support that individuals received was always temporary. At the
end of the 19th century, lacking any form of formalized governmental welfare system,
private charities grew to dominate welfare spending in the United States. For example, in
1878 in Philadelphia alone, there were more then 800 private charitable groups (Trattner,
1999).
Sweden
Historically Sweden had been an agricultural society, but in the mid-nineteenth
century the country went through a period of industrialization, transforming the country’s
economy into an export-oriented manufacturing society. In response to these economic
changes, the Swedish government intentionally intervened on a national level by
initiating liberal trade reforms within Europe, altering the education system, and
assuming the responsibility for the development of country-wide infrastructure (Sjögren,
2008). The reason this was so successful was because the government worked in
conjunction with the private industries.
Experiencing the success of the national government’s role in the country’s
industrialization, Swedes approved of government intervention in the private sector. This
attitude helped lead the way for the acceptance of future compromises between various
parties, classes, and interest groups, on both a local and national level. This type of
governmental process, known as consensual governance, was most common in the
triangular relationships among the government, trade unions and employers’ associations.
11
To help strengthen the power of the unions within this triangular relationship, in 1898
workers founded the Swedish Confederation of Trade Unions. The Swedish Employers’
Confederation was founded only four years later in 1902 (Sjögren, 2008). In addition to
their long history, these relationships were made even easier as Sweden has always been
a relatively small state (with a population of less then 10 million) and has always had
very little ethnic or religious diversity (Alestalo, Hort, Kuhnle, 2009). To further
represent the workers in the political arena, the Swedish Social Democratic Party (SAP)
was founded in 1889. From the early-twentieth century until today, the Social Democratic
Party has dominated the political system in Sweden.
With all these changes going on, Sweden was “politically and intellectually
prepared or ripe for state social action” (Alestalo, Hort, Kuhnle, 2009, p. 12). At this
time, Sweden’s neighbor, Germany, had the most developed social insurance program in
the world. In 1884 the Swedish government appointed a committee to study the programs
of the German social insurance system. Based on the findings of the committee, Sweden
initiated its first welfare program in the form of limited sickness insurance in 1892. Over
the next 60 years, Sweden introduced universal and compulsory social security schemes
such as industrial accident insurance in 1901, national pensions in 1913, child allowances
in 1948 and national sickness insurance in 1955 (Alestalo, Hort, Kuhnle, 2009).
2.2 The American Welfare System Plays Catch Up
In 1929, after years of economic growth, the Great Depression hit the United
States causing the worst economic downturn in American history and making many
Americans aware for the first time, of the inadequacy of their country’s welfare system.
12

From 1929 to 1933, unemployment rose from 3.2% to 25%. Over the same time period,
real Gross National Product declined to 71% of what it had been in 1929 (Himmelberg,
2001). During the same time period, excluding farm families, 34 million Americans were
without any income and malnutrition rose to affect 20% of all Americans (Rothbard,
1963). With no federal welfare system in place, the repercussions of the Great Depression
on American people in all corners of the country were immense.
In the absence of federal insurance programs, support for the unemployed fell to
private agencies. However, with only limited funding and an historical focus on fixing
individual weaknesses, the services of the private agencies were nowhere near adequate
to feed, clothe or house the millions of Americans who needed assistance. Severely
strained and lacking any formalized funding, the majority of these private agencies were
forced to close down (Trattner, 1999).
Faced with a collapsed economy, rising unemployment, and an increasingly large
starving and homeless population, America’s newly elected President Franklin D.
Roosevelt was faced with the daunting task of somehow reversing the country’s
depressed economy and supporting its struggling population. What made Roosevelt
different from previous American presidents was his philosophical determination to
transform the government’s perception of welfare recipients and redefine the market.
The appropriation of national funds and the organization of social benefits reflected this
recognition that the unemployed, sick, elderly, or those who could not support themselves
were not to blame for their situation. And for the first time, with the passage of the Social
Security Act, the American government recognized that the invisible hand is not a perfect
13
economic regulator and, in certain situations, government intervention and protection is
necessary (Trattner, 1999).
Therefore to accomplish this, between 1933 and 1938, President Roosevelt
enacted the New Deal. Most importantly for the creation of the welfare system was the
Social Security Act of 1935.2 This act was the first universal national welfare program in
the United States, but was based on pre-existing state-level social insurance programs,
such as the Wicks Act, which was an unemployment program enacted in 1931 when
Roosevelt was the governor of the state of New York (Trattner, 1999). The Social
Security Act appropriated funds for old-age assistance (by far the largest public
assistance program), unemployment insurance, public assistance to dependent children in
single-parent families, public assistance to the crippled and to the blind, and limited
public health services.
Although a very important first step for the American welfare system, the Social
Security Act appropriated national funds to the states to distribute at their own discretion.
Thus, although the Social Security Act was universal in its language, because the funding
was at the states’ discretion and they could set criteria for who could receive benefits, the
act was not necessarily universal in its application (Social Security Act of 1935). For
2 Of course there are many other important programs in addition to the Social Security Act that made up the New Deal including the Civilian Conservation Corps (which provided work relief for young men), the Federal Emergency Relief Administration (which provided states with funding for unemployment relief), the Civil Works Administration (which created direct federal relief work for the unemployed), the Works Progress Administration (which provided mostly blue-collar jobs for the unemployed to carry out public work projects), The Wagner Act (which guaranteed rights of workers to organize in unions and engage in collective bargaining). Over the period of the New Deal, the economy recovered drastically. In 1939 after all of the New Deal policies were enacted, GNP surpassed 1929 levels by 7% and unemployment fell to 17% (Himmelberg, 2001).
14

example, in segregated states, minorities, especially blacks, did not receive adequate
support. Additionally, by being universal, benefits were not means tested. This meant
that cash benefits were not based on need, but were instead based on the past earnings of
the individual or family (Katz, 2010).
In addition to the benefits outlined in the Social Security Act of 1935, the act also
laid out new taxes for the American people. These taxes took two forms: an income tax
on the employee and an excise tax on the employer. In practice, however, the employee
felt the greatest impact. In response to the costs of the excise tax, employers could
increase their prices, but employees did not have the option of increasing their wages to
cover the cost of the income tax. As a result, employees faced both the costs of their own
income tax plus the cost of the employer’s excise tax in the form of increased prices
(Social Security Act of 1935). Since the impact of these taxes fell disproportionately on
the employees, the income gap grew.
Although Roosevelt’s initial goal was to protect his population and reverse the
recent economic downturn through the development of a federal welfare system, he was
forced to compromise within his own government. As a result, the outcome was quite
different from the newly developing European systems. In contrast to the Swedish system
for example, the U.S. welfare programs developed inequalities inherent in the
organization of the system.
15
2.3 The Golden Age and The Great Society Years
Sweden
Although the Great Depression was felt most dramatically in the United States, its
effects spread worldwide. In response to this economic crisis, the Swedish government,
which historically leaned towards Keynesian policy measures, moved to adopt state
intervention as an integral part of its economic policy. Although the Swedish Social
Democratic Party had been established at the end of the 19th century, the party’s
philosophy of a mixed economy truly gained dominance during the period of the 1930s to
1970s (Sjögren, 2008).
Thus, Keynesian economic ideas, which relied on interventionist social measures
for economic stability and growth, went hand in hand with the Social Democrat’s “stable
party government operating with a bias towards consensus” (Sjögren, 2008, p. 45). As a
result, the Social Democrats were able to form “The Middle Way” where the government
sets macroeconomic goals and regulates the market. The core goals of this model are: full
employment (unemployment levels of 1.5-2.5%), low inflation (under 3%), high degrees
of cyclical stability, zero or positive balance of payments, growth of the public economic
sector, no visible structural imbalances between economic sectors, annual growth rates at
about 4% and a solidarity-based wage policy3 (Sjögren, 2008). As a result of this “Middle
Way” from 1930 to 1950, Sweden experienced the highest economic growth rate among
industrialized countries. Because of these high levels of growth this period became
3 The solidarity-based wage policy does three unique things for the Swedish economy. First, it aims to eliminate the gender wage gap by introducing equal pay for equal work. Secondly, it closes the gap between high and low wage earners by increasing wages for low wage earners. Lastly, it allows workers to benefit from productivity growth by tying wage increases to increases in productivity so that wage growth is 0.5% less of the economy wide average productivity growth.
16

known as the Golden Age (see Table 1). This period was marked with an incredible
increase in the standard of living for the working class, a decrease in the difference of
income between classes and allowed the government to enact egalitarian policies such as
almost full income compensation for social services such as unemployment, sickness and
child care (Sjöberg, n.d.)
Table 1: Annual Growth in GDP per Capita (%) Years Sweden United States
1500-1820 0.17 0.36
1820-1870 0.66 1.34
1870-1913 1.46 1.82
1913-1950 2.12 1.61
1950-1973 3.07 2.45
1973-1998 1.31 1.99
Source: Madisson, 2007, table B-19, p. 262
In addition to the country’s high levels of growth during the Golden Age,
Sweden’s public sector workforce also expanded dramatically, growing from 4.7% of
total employment in 1937 to 30.3% in 1980 (see Table 2). Because of the increasing
growth rate and in turn the decreasing unemployment rate, the growth of the public sector
came from those who were previously voluntarily unemployed, most notably, women
who had previously worked in the household. This meant that now these women were
economically valued so that they were now receiving salaries and more importantly,
being taxed (Steinmo, 2002). It is important to note that these women were able to leave
the home because of Sweden’s extensive benefits including guaranteed childcare and
17

education, paid maternity leave and vacation. Expanding the public sector to increase the
country’s working population was just one of the many ways Sweden used these years of
economic success and stability to ensure egalitarian policies that would benefit the entire
population for years to come.
Table 2: Government Employment: Sweden, 1870-1994 (% of total employment) Years Government Employment
~1870 2.2%
1913 3.5%
1937 4.7%
1960 12.8%
1980 30.3%
1994 32.0%
Source: Steinmo, 2002, p. 20
The United States
From the 1930s through the early 1970s, the United States also experienced a
period of economic growth even though it was not as impressive as the growth rate in
Sweden (see Table 1). In the 1960s, President Lyndon Johnson introduced the social
reforms under the Great Society programs, headlined by the fight for civil rights and a
public war on poverty. With Democrats in the majority, the government passed the
Economic Opportunity Act and initiated the Peace Corps and Head Start programs.4 But
4 The Economic Opportunity Act provided funding for Community Action Agencies, which set up programs for low-income individuals including student work-study and adult education classes. The Peace Corps is a program that sends U.S. citizens abroad to initiate poverty reducing programs including setting up schools and hospitals. Head Start provides government subsidized pre-school programs for low-income children.
18

the real impact, both positive and negative, on welfare programs came with two
amendments to the Social Security Act. Stepping in for the first time to guarantee
medical care for some Americans, Congress passed The Social Security Amendments of
1965 creating Medicare to provide health insurance for the elderly and Medicaid to
support health insurance for poor families. However moving in the opposite direction,
the Social Security Amendments of 1965 also removed Aid to Dependent Children from
the Social Security Act and created instead Aid to Families with Dependent Children
(AFDC). AFDC is what most people in the United States refer to today simply as
“welfare.” Separating family aid from social security was a major change that cemented
the distinction between social security and public assistance (what most people call
welfare). As discussed later in the paper, this distinction would allow the government to
change family aid regulations and appropriations without impacting social security (Katz,
2010).
President Johnson used this period of economic growth to expand the welfare
system by his war on poverty and inequality. However, without cooperation in the
government like that seen in Sweden, enacting these policies came at a price. Going
against Johnson, conservative policy makers used this period of economic stability and
growth to retract earlier welfare policies believing that they were no longer necessary and
only a source for abuse. Most notably was the creation and immediate separation of
AFDC from Social Security, which in turn with reduced taxes and expenditures, left the
U.S. safety net non-existent and made the welfare system extremely vulnerable to the
future.
19

2.4 International Attack on the Welfare State
Although welfare systems in both the United States and Sweden expanded the
scope of benefits to their citizens and addressed social issues such as poverty and
unemployment, for the past 40 years welfare in both countries has been under attack.
Reviewing history, this attack on the welfare system is likely a result of multiple factors
including two worldwide recessions caused by oil price hikes in the 1970s, globalization,
increasing popularity of neo-liberalism and Reaganomics and the declining power of the
working class.
The worldwide recessions caused by oil price hikes led to a decrease in economic
output throughout the world. Sweden and the United States were no exception. However
with the newly popular conservative economic ideals, both countries ignored the oil crisis
and instead blamed their economic downturns on their welfare systems. In turn
politicians in both Sweden and the U.S. reduced social benefits over the next twenty-year
period, believing that this would return their economic output to the previously high
levels.
United States
Ronald Reagan, president from 1981 to 1989, believed in supply-side economics.
Reaganomics featured a combination of reduced government spending on social
programs, increased military spending, termination of government regulations and tax
cuts, especially for the wealthy. Reagan believed strongly in self-sufficiency and
encouraged this norm throughout his policies. Over this period, President Reagan
claimed that lowering taxes and cutting social spending would not only help spur
20
economic growth, but would also decrease unemployment and poverty. Under this neo-
liberal approach, Reagan believed that self-sufficiency and the power of the invisible
economic hand would fix the problems that he believed social spending was exacerbating
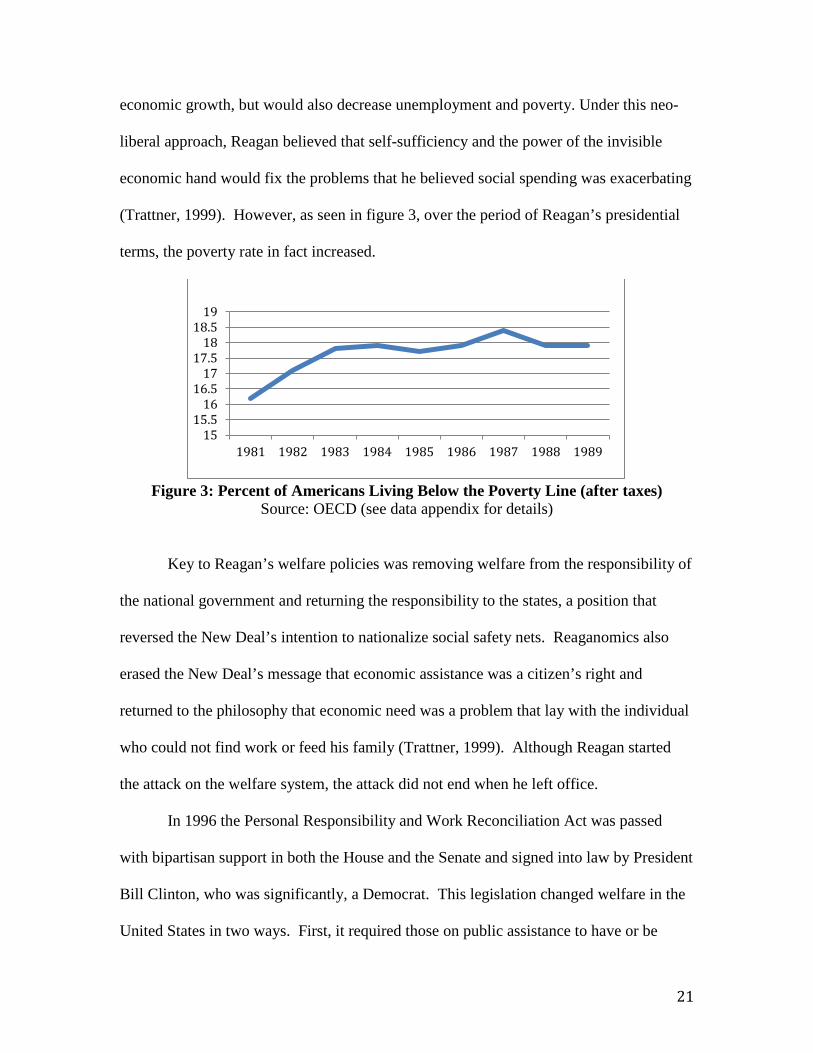
(Trattner, 1999). However, as seen in figure 3, over the period of Reagan’s presidential
terms, the poverty rate in fact increased.
Figure 3: Percent of Americans Living Below the Poverty Line (after taxes)
Source: OECD (see data appendix for details)
Key to Reagan’s welfare policies was removing welfare from the responsibility of
the national government and returning the responsibility to the states, a position that
reversed the New Deal’s intention to nationalize social safety nets. Reaganomics also
erased the New Deal’s message that economic assistance was a citizen’s right and
returned to the philosophy that economic need was a problem that lay with the individual
who could not find work or feed his family (Trattner, 1999). Although Reagan started
the attack on the welfare system, the attack did not end when he left office.
In 1996 the Personal Responsibility and Work Reconciliation Act was passed
with bipartisan support in both the House and the Senate and signed into law by President
Bill Clinton, who was significantly, a Democrat. This legislation changed welfare in the
United States in two ways. First, it required those on public assistance to have or be
1515.5
1616.5
1717.5
1818.5
19
1981 1982 1983 1984 1985 1986 1987 1988 1989
21
actively looking for a job. Secondly, it replaced AFDC with a program called Temporary
Assistance for Needy Families (TANF) which further limited the scope of welfare
provisions by setting a lifetime limit for benefits of five years and making legal
immigrants who had lived in the U.S. for less than five years ineligible for any benefits.
This legislation reflected the growing public hostility towards public assistance and a loss
of the belief that a social safety net was a citizen’s right (Katz, 2010). In addition, while
only thirty years earlier, Democrats such as Roosevelt and Johnson fought for the
expansion the welfare system, now the attack on the welfare system was bipartisan. This
demonstrated that the conservative mentality highlighting the negativity of welfare was
so engrained in the American mindset that even the Democratic “middle way” was a
retrenchment of the already limited system.
Over the next ten years, as the number of welfare recipients in the United States
decreased by 50%, supply siders credited the success of the Clinton legislation in moving
people from welfare to work. Based on these results, President George Bush signed into
law in 2005 the Deficit Reduction Act, which imposed even tougher requirements to
receive public assistance. However, no evidence supports a direct correlation between
these stricter welfare requirements and a decline in the welfare rolls. In fact, data shows
that the decline was more likely the result of job growth in a strong economy and
individuals who were discouraged from even applying for welfare because of the strict
requirements. As Katz (2010 p. 512) explains “some researchers estimated that at most
10 percent to 20 percent of former welfare recipients earned enough to leave poverty
permanently.”
22
Sweden
Sweden was also forced to respond to the impact of global economic forces.
During the 1970s and 1980s the world economy was undergoing major changes so that
Sweden’s export manufacturing industries (mining, steel, shipbuilding and automobile)
were all hit by growing competition from developing Asian countries. Because of the
economy’s dependence on its manufacturing sector and increased competition from
abroad, the country’s economy faced structural problems. To better diversify its
economy and deal with the pressure of the period’s decline in economic growth, the
Swedish government borrowed excessively. However instead of helping the situation the
interest rates of these loans only furthered the country’s budget deficit (Sjögren, 2008). In
addition to hurting the Swedish economy this economic downturn also hurt the Swedish
population. With increased competition from abroad, unemployment in the country
increased, which led to increasing demands for government support. To meet these
demands, Sweden increased their taxes so that by 1990 taxes were more then 60% of the
country’s GDP (Steinmo, 2002).
With the economic situation not improving, the Swedish government attempted a
new approach to cure the economic situation. Following the popular supply side
economics in 1991 the Swedish government passed the Tax Reform of the Century,
which substantially reduced both income and corporate tax rates for all taxpayers.
However instead of helping the situation, this too only made it worse. When an economic
crisis caused by the collapse of the property market hit the country in 1993 to 1994, the
tax reform exacerbated the crisis. With the lower taxes, the government did not have the
resources to pay for the increase demand for government benefits. As a result, the crisis
23
was more of a drain on the economy then it would have ever been with the higher tax
levels. Consequently the country’s deficit grew to 13% of its GDP (Steinmo, 2002).
Based on the government decisions over the past thirty years many claim today
that Swedish policy makers have been deviating from the ideal of equality that used to be
held so highly. Interestingly though, although the policy makers may be diverging from
the Swedish ideal, “survey after survey has shown that while Swedes (like virtually all
citizens in modern welfare states) agree that taxes are too high, only a minority of citizens
support tax cuts if they are forced to chose them in exchange for reductions in public
spending” (Steinmo, 2002, p. 15).
Starting with the “Middle Way”, the international attack on the welfare system
based on neoliberal economics has caused Swedish policy makers to deviate from these
egalitarian policies. However, high taxes (as compared to the U.S. and other
industrialized countries) and a general mindset of the importance of equality, common in
the Swedish population demonstrate that the welfare system is still stronger in Sweden
than many other advanced industrialized countries. In comparison, the United States
never focused on the importance of equality, but instead highlighted the importance of
hard work and independence. This led the U.S. to only attempt to nationalize welfare
when it was forced to such as in response to the Civil War and the Great Depression. Yet
compared to other industrialized countries these attempts at a nationalized welfare system
were just drops in the bucket. This half-hearted creation of the welfare state has left the
system inadequate and unable to form as a safety net and has instigated a very negative
connotation of the system among most American people and policy makers.
24

Chapter 3: Net Social Wage
3.1 Literature Review
After understanding the historical context of the welfare system in the United
States and Sweden, we now turn to develop a measurement to accurately compare the
two country’s clearly distinct welfare systems. The mainstream economics methodology
on the social impact of state taxation and spending is limited in its presence and flawed in
its application. The first reason this methodology is flawed is because it groups
individuals by income and not by social class. This combines people who derive their
income from labor with people who derive their income from property ownership, which
is problematic as it obscures the distinction between workers and capitalists. The second
problem with the mainstream methodology is that it treats all government spending as
having equal benefits for the working class. This is an issue as not all government
spending benefits all Americans equally. For example military spending, which directly
or indirectly benefits many of these capitalists does not positively benefit the working
class in the same way that other forms of spending such as spending on education or
health care does (Szamuely, 1990; Brady, 2005).
In response to this limited conservative methodology, political economists
developed new ways to measure the growth of the welfare state and its impact on the
working class. Unlike mainstream economists, political economists split individuals into
groups by social class, thus separating workers from property owners. In addition, they
focus only on the government spending that benefits workers directly, therefore
excluding expenditures such as military spending (Bowles & Gintis, 1982; Fazeli &
25

Fazeli, 2012; Maniatis, 2013; 1993; Miller, 1989; Shaikh, 2003; Shaikh & Tonak, 2000;
1987; Therborn, 1984).
There are two distinct methodologies of the new measurement of the social
impact of a welfare state. The first methodology looks at the benefits worker’s receive,
but ignores the taxes that they pay. These measurements are known as the “citizen wage”
or “social wage” (Therborn, 1984). Although this methodology moves in the right
direction as it separates workers from property owners and only counts social spending
that directly benefits workers, it overestimates the benefit worker’s receive from the state
because it does not account for the taxes that they pay.
The second methodology provides a more complete picture by accounting for
both social expenditures on workers and taxes paid by workers. This more inclusive
method provides us with the difference between spending on workers and taxes paid by
workers and so is called the “net social wage.” Anwar Shaikh and Ahmet Tonak (2000;
1987) are the pioneers of the net social wage methodology. In a series of studies they
found the net social wage to be negative in the United States for most of the postwar
period, excluding a few years of economic crisis when the net social wage became
positive. This means that according to their calculations the workers paid more in taxes
than they received from the state in benefits (Shaikh, 2003; Shaikh & Tonak, 2000;
1987).
In an earlier study, Sam Bowles and Herbert Gintis (1982) employ a variant of the
net social wage measurement to examine who pays for the welfare system in United
States in the postwar period. However contrary to Shaikh and Tonak’s findings, Bowles
and Gintis found a high and growing net social wage over the postwar period. This meant
26
that workers received more in benefits than they paid in taxes. Although these findings
seem to contradict one another, work by John Miller (1989) and Thanasis Maniatis
(2013) show that Bowles and Gintis’s methodology has errors that explain their inverse
results.
First, as Miller (1989) explains Bowles and Gintis underestimate the number of
working individuals within each U.S. household, assuming each household has one
worker with three dependents. However, in reality in 1977, when this study was
conducted, the average household had 1.2 workers per household. This miscalculation
underestimates the taxes paid and overestimates the social welfare received. In addition,
as Maniatis (1993) points out, Bowles and Gintis exclude all state and local taxes in their
study, only accounting for federal taxes. This further underestimates the amount of taxes
workers pay.
Once these errors are accounted for, the agreement among the net social wage
literature is that in the postwar period from 1952 to 2000, the net social wage in the
United States has been negative. That is, the workers have been paying more in taxes
than they have been receiving in benefits (Maniatis, 2013; 1993; Miller, 1989; Shaikh,
2003; Shaikh & Tonak, 2000; 1987).
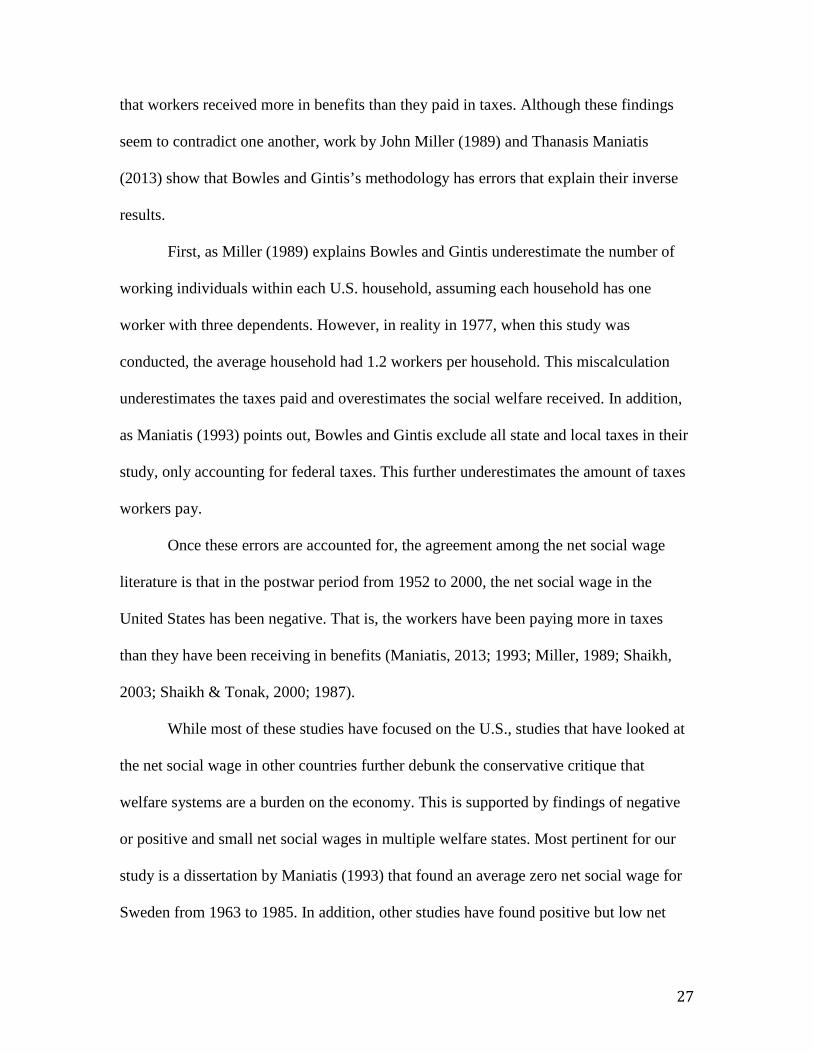
While most of these studies have focused on the U.S., studies that have looked at
the net social wage in other countries further debunk the conservative critique that
welfare systems are a burden on the economy. This is supported by findings of negative
or positive and small net social wages in multiple welfare states. Most pertinent for our
study is a dissertation by Maniatis (1993) that found an average zero net social wage for
Sweden from 1963 to 1985. In addition, other studies have found positive but low net
27

social wages in Australia, Canada, Germany and Sweden (1952 to 1987) (Fazeli &
Fazeli, 2012; Shaikh, 2003) and a negative net social wage in the U.K and New Zealand
over the same time period (Maniatis, 2013).
3.2 Methodology
In this thesis, I apply the net social wage methodology developed by Shaikh and
Tonak to the United States and Sweden from 1962 to 20125. Conducting an up to date net
social wage for both the U.S. and Sweden is important since the last year the majority of
these studies were conducted was 1987 (Maniatis, 1993; 2013; Shaikh, 2003) with the
most up to date study going only to 2006 (Fazeli & Fazeli, 2012). In the U.S. this
expansion is especially important because of the recent financial crisis felt in the country,
which could have severely affected the welfare system.
In addition, I will be adding indirect business taxes to the net social wage
measurement. An indirect tax is any tax on a good or service that is collected by an
intermediary, such as a retail store, from the individual who bears the burden of the tax,
which is most typically the consumer. Although Shaikh and Tonak (1987; 2000) claim
that indirect taxes should be excluded from the net social wage calculation because they
do not flow directly from labor, most other economists calculating the net social wage
include indirect taxes (Akram-Lodhi, 1996; Maniatis, 2013; Sephri & Chernomas, 1992).
They justify the inclusion of indirect taxes based on the definition of the tax itself. Under
the definition, because the consumer bears the burden of the tax, even though the tax is
not imposed on labor income directly, it is never the less felt by the consumer.
5 Calculations for Sweden begin in 1965 because that is the first year of published tax information for Sweden.
28

As figure 4 and figure 5 demonstrate the difference between the amount of taxes
paid by workers when indirect taxes are and are not included is somewhat substantial.
However as can be seen in figure 4 and figure 5, the trend of taxes paid by workers in
both countries is similar in both situations except for an upward shift. Overall, I include
indirect taxes because by definition they are felt by the consumer and so are included in
other important studies of net social wage (Akram-Lodhi, 1996; Sephri & Chernomas,
1992). Additionally, since they do not dramatically alter the tax trend, other than a slight
shift upwards, their inclusion is justified. So for the remainder of the thesis whenever
taxes are discussed indirect taxes should be assumed to be included.
Figure 4: Taxes in the United States (billions of U.S. dollars)
Source: BEA, NIPA (see data appendix for details)
Figure 5: Taxes in Sweden (billions of Swedish kronor)
Source: OECD (see data appendix for details)
0500
10001500200025003000
1962
1964
1966
1968
1970
1972
1974
1976
1978
1980
1982
1984
1986
1988
1990
1992
1994
1996
1998
2000
2002
2004
2006
2008
2010
2012
Taxes (with out indirect taxes) Taxes
0200400600800
100012001400
1965
1967
1969
1971
1973
1975
1977
1979
1981
1983
1985
1987
1989
1991
1993
1995
1997
1999
2001
2003
2005
2007
2009
2011
Taxes (with out indirect taxes) Taxes
29
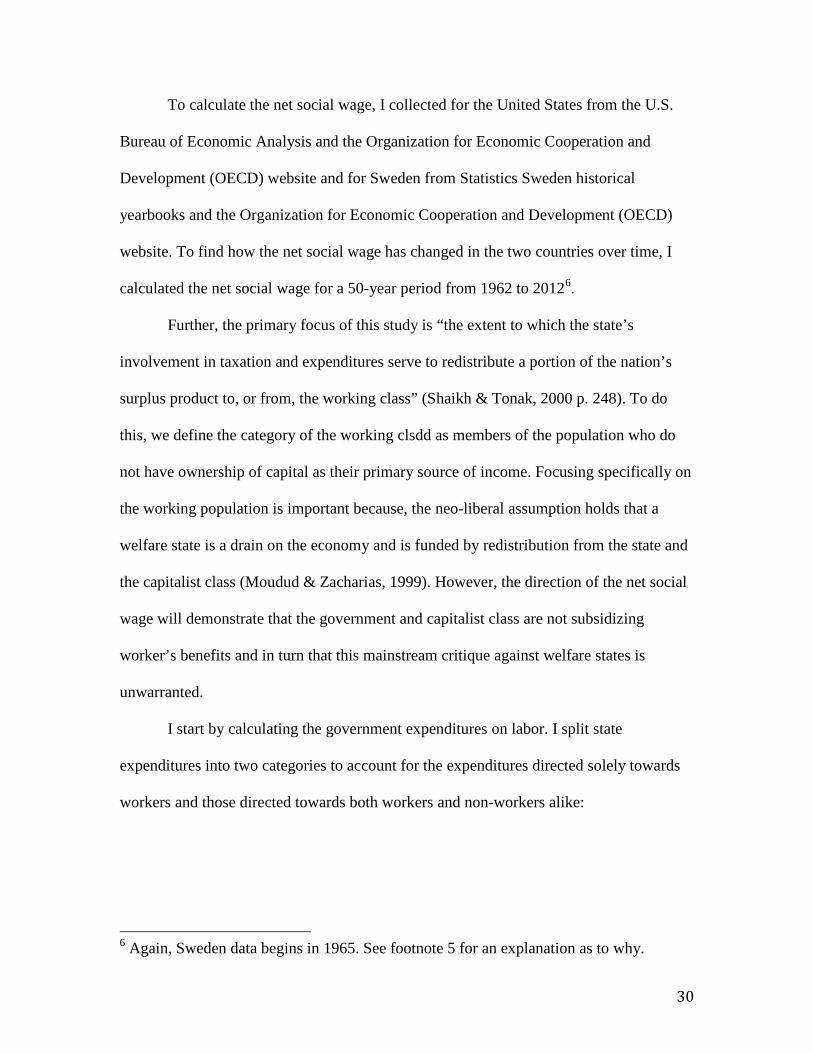
To calculate the net social wage, I collected for the United States from the U.S.
Bureau of Economic Analysis and the Organization for Economic Cooperation and
Development (OECD) website and for Sweden from Statistics Sweden historical
yearbooks and the Organization for Economic Cooperation and Development (OECD)
website. To find how the net social wage has changed in the two countries over time, I
calculated the net social wage for a 50-year period from 1962 to 20126.
Further, the primary focus of this study is “the extent to which the state’s
involvement in taxation and expenditures serve to redistribute a portion of the nation’s
surplus product to, or from, the working class” (Shaikh & Tonak, 2000 p. 248). To do
this, we define the category of the working clsdd as members of the population who do
not have ownership of capital as their primary source of income. Focusing specifically on
the working population is important because, the neo-liberal assumption holds that a
welfare state is a drain on the economy and is funded by redistribution from the state and
the capitalist class (Moudud & Zacharias, 1999). However, the direction of the net social
wage will demonstrate that the government and capitalist class are not subsidizing
worker’s benefits and in turn that this mainstream critique against welfare states is
unwarranted.
I start by calculating the government expenditures on labor. I split state
expenditures into two categories to account for the expenditures directed solely towards
workers and those directed towards both workers and non-workers alike:
6 Again, Sweden data begins in 1965. See footnote 5 for an explanation as to why.
30

1. Worker Benefits (E1) includes income support, social security and welfare,
housing and community services, labor training and services. These benefits
are assumed to be received entirely by the workers.
2. Conventional Benefits (E2) includes education, health and hospitals,
recreational and cultural activities, energy, natural resources, postal service
and transportation. These benefits are assumed to be received by both the
workers and non-workers, so the amount of benefits going to workers is
calculated by multiplying the group total by the labor share (LS) in personal
income.7
To calculate expenditures totally allocated to labor I will then add E1 to E2 times labor
share or E1+E2*LS.
I then calculate the contribution of the workers to taxes. For the tax side of the
equation I will split the tax revenues into three categories:
1. Social Security Taxes (T1) includes contributions for social insurance
plus payroll taxes. These taxes are only applied to workers.
2. Personal Taxes (T2) includes personal income (both federal and state),
motor vehicle and licenses, property, and other taxes. These taxes fall on
both workers and non-workers, so the amount of taxes paid to workers is
calculated by multiplying total personal taxes by the labor share (LS).
7 I’m multiplying by labor share (LS) because there is no division of benefits between workers and non-workers. Thus, I’m estimating the workers’ share of expenditures by multiplying all expenditures times the country’s labor share. As I explain below, there is also no measurement of the workers’ share of taxes paid so to find the share of taxes paid by workers I will also multiply total taxes by labor share.
31
1. Indirect Taxes (T3) includes value-added and sales taxes. These taxes fall on
both workers and non-workers and so the amount paid by workers is
calculated by multiplying total indirect taxes by the labor share (LS).
To calculate taxes totally allocated to labor, I then add T1 to T2 times labor share plus T3
times labor share or T1+(T2*LS)+(T3*LS).
After having collected all of the data on worker’s expenditures and taxes as
explained above I calculate the net social wage by subtracting total taxes on labor from
total expenditures on labor. In other words, net social wage can be found as follows:
NSW=(E1+(E2*LS))-(T1+(T2*LS)+(T3*LS))
Where NSW is net social wage and other variables are described before.
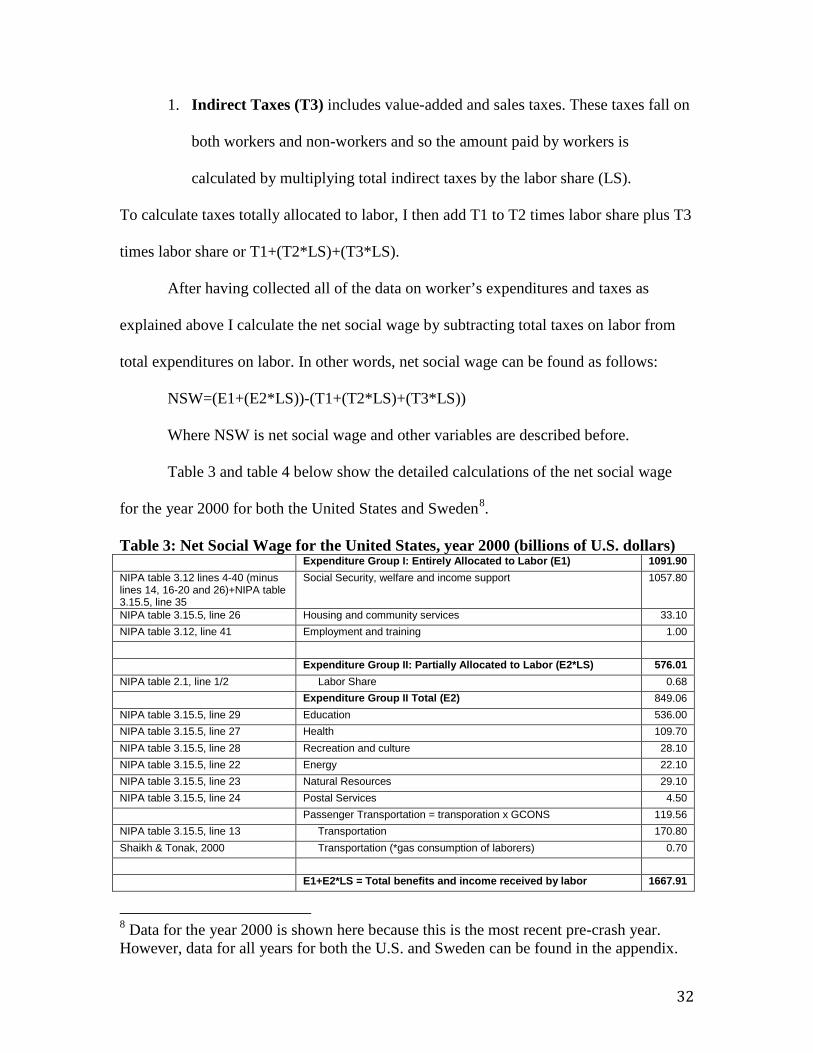
Table 3 and table 4 below show the detailed calculations of the net social wage
for the year 2000 for both the United States and Sweden8.
Table 3: Net Social Wage for the United States, year 2000 (billions of U.S. dollars) Expenditure Group I: Entirely Allocated to Labor (E1) 1091.90 NIPA table 3.12 lines 4-40 (minus lines 14, 16-20 and 26)+NIPA table 3.15.5, line 35
Social Security, welfare and income support 1057.80
NIPA table 3.15.5, line 26 Housing and community services 33.10 NIPA table 3.12, line 41 Employment and training 1.00 Expenditure Group II: Partially Allocated to Labor (E2*LS) 576.01 NIPA table 2.1, line 1/2 Labor Share 0.68 Expenditure Group II Total (E2) 849.06 NIPA table 3.15.5, line 29 Education 536.00 NIPA table 3.15.5, line 27 Health 109.70 NIPA table 3.15.5, line 28 Recreation and culture 28.10 NIPA table 3.15.5, line 22 Energy 22.10 NIPA table 3.15.5, line 23 Natural Resources 29.10 NIPA table 3.15.5, line 24 Postal Services 4.50 Passenger Transportation = transporation x GCONS 119.56 NIPA table 3.15.5, line 13 Transportation 170.80 Shaikh & Tonak, 2000 Transportation (*gas consumption of laborers) 0.70 E1+E2*LS = Total benefits and income received by labor 1667.91
8 Data for the year 2000 is shown here because this is the most recent pre-crash year. However, data for all years for both the U.S. and Sweden can be found in the appendix.
32

Source Taxes 2000 Tax Group I: Paid Entirely by Labor (T1) 669.80
NIPA table 3.6 lines 2-31 (minus lines 14, 16, 26 and 30)
Contributions for social insurance 669.80
Tax Group II: Partially Allocated to Labor (T2*LS) 836.01 NIPA table 2.1, line 1/2 Labor Share 0.68 Tax Group II Total (T2) 1232.30 Total income taxes = federal + state and local income taxes 1213.00 NIPA table 3.4, line 2 Federal income taxes 995.60 NIPA table 3.4, line 9 States & local income taxes 217.40 NIPA table 3.4, line 12 Other Taxes 3.10 NIPA table 3.4, line 10 Motor Vehicle and licenses 11.40 NIPA table 3.4, line 11 Personal Property Taxes 4.80 Tax Group III: Partially Allocated to Labor (T3*LS) 480.72 NIPA table 2.1, line 1/2 Labor Share 0.68 Tax Group III Total (T3) 708.60 NIPA Table 1.10, line 7 Indirect Taxes 708.60 T1+T2*LS+T3*LS = Total taxes paid by labor 1986.53 Net Social Wage = Total benefits and income received by labor -
Total taxes paid by labor (E1+E2*LS) - (T1+T2*LS+T3*LS) -318.62
Source: See data appendix for details
Table 4: Net Social Wage for Sweden, year 2000 (billions of Swedish kronor) Expenditure Group I: Entirely Allocated to Labor
(E1) 315.85
SCB, State expentidute (current budget) by purpose table, "sociålvard och socialförsäkring"/"socialförsäkring och social välfärd"/"social trygghet"
Social Security, welfare and income support 239.80
SCB, State expentidute (current budget) by purpose table, "bostadspolitik och samhällsplanering"/"bostadspolitik samhällsplanering och lokaliseringpolitik"
Housing and community services 7.54
SCB, State expentidute (current budget) by purpose table, "andra samhälleliga och sociala tjänster"+" "ekonomiska tjänster"/"näringslivsfrågor"
Other economic services 68.51
Expenditure Group II: Partially Allocated to Labor
(E2*LS) 47.96
OECD, Labor Share Labor Share 0.67 Expenditure Group II Total (E2) 71.199 SCB, State expentidute (current budget) by purpose table, "undervisning"/"utbildning"
Education 44.83
SCB, State expentidute (current budget) by purpose table, "hälsovård"/"hälso och sjukvård"
Health 18.79
SCB, State expentidute (current budget) by purpose table, "kultur rekreation"
Recreation and culture 5.41
SCB, State expentidute (current budget) by purpose table, "energi"
Energy ---
SCB, State expentidute (current budget) by purpose table, "Miljöskydd"
Environment 2.17
SCB, Post office: revenue and expenditure table, expenditure
Postal Services ---
SCB, State railways: revenue, expenditure and financial results
Railways ---
33

E1+E2*LS = Total benefits and income received
by labor 363.81
Source Taxes 2000 Tax Group I: Paid Entirely by Labor (T1) 357.24 OECD, Tax Statistics Sweden, 2000 Social security contributions
Contributions for social insurance 307.10
OECD, Tax Statistics Sweden, 3000 Taxes on payroll and workforce
Payroll Taxes 50.15
Tax Group II: Partially Allocated to Labor (T2*LS) 281.28 OECD, Labor Share Labor Share 0.67 Tax Group II Total (T2) 417.59 Total income taxes = federal + state and local
income taxes 368.79
OECD, Tax Statistics Sweden, 1110 National income tax individual
Federal income taxes 32.49
OECD, Tax Statistics Sweden,1110 Local income tax individual
States & local income taxes 336.30
OECD, Tax Statistics Sweden, 5113 Other Other Taxes 1.48 OECD, Tax Statistics Sweden, 5211 Paid by households: motor vehicles
Motor Vehicle and licenses 7.43
OECD, Tax Statistics Sweden, 4000 Taxes on property
Personal Property Taxes 39.89
Tax Group III Labor Total: Partially Allocated to
Labor (T3*LS) 188.23
OECD, Labor Share Labor Share 0.67 Tax Group III Total (T3) 279.45 OECD, Tax Statistics Sweden, 5100 Taxes on production, sale, transfer, etc.
Indirect Taxes 279.45
T1+T2*LS+T3*LS = Total taxes paid by labor 826.76 Net Social Wage = Total benefits and income
received by labor - Total taxes paid by labor (E1+E2*LS) - (T1+T2*LS+T3*LS)
-462.95
Source: See data appendix for details9
Chapter 4: Results
4.1 The Case of an Increasing Net Social Wage: The United States
In United States the results show a negative net social wage from 1962 to 2001
(See Figure 6). These results are in line with empirical studies that have found the net
social wage in the United States from the 1950s to 2000 to be negative (Bowles & Gintis,
1982; Miller, 1989; Shaikh, 2003; Shaikh & Tonak, 2000; 1987). However, this updated
9 All NIPA, BEA taxes were compared to OECD taxes for the United States. Because tax rates were extremely similar, only NIPA, BEA data was used and and is shown here.
34

data shows a fundamental change since 2002, when many of these studies ended. In fact
from 2002 to 2012, the net social wage for the U.S. has been positive and in fact quite
large (see figure 6). This occurred because although both the taxes and benefits rose over
this time period, the former rose quicker than the latter (see figure 7).
Figure 7 also helps to explain the spike in net social wage after 2001. In response
to the international financial crisis beginning in 2001, the number of individuals who
required government assistance and the amount of benefits each individual needed
increased. In addition, Bush tax cuts in 2001 and 2003 led to a decrease in taxes or the
same time period. The combination of an increase in social expenditures due to the
recession and a decrease in taxes due to the Bush tax cuts, led to this dramatic spike in
net social wage.
Another way of looking at net social wage is by comparing it to its share of GDP.
As seen in figure 8, up until 2001, the net social wage was a negative share of GDP.
However after the recession of 2001, the cost of redistribution seemed to contribute to the
toll on the economy because of the positive net social wage. What is important to point
out however is that the recession occurred before the net social wage became positive.
Thus a positive net social wage was a consequence of the economic downturn and not, as
many mainstream economists claim, the cause of it (Fazeli & Fazeli, 2012).
The recent positive and growing net social wage validates the incapability of a
welfare system that is based on the ideals of independence and self-sufficiency. By using
economic success as a pretense to cut both benefits and taxes, the United States is almost
always left with a non-existent safety net. At the same time, the country’s goal of self-
sufficiency causes policy makers to repeatedly call for limited expenditures on social
35
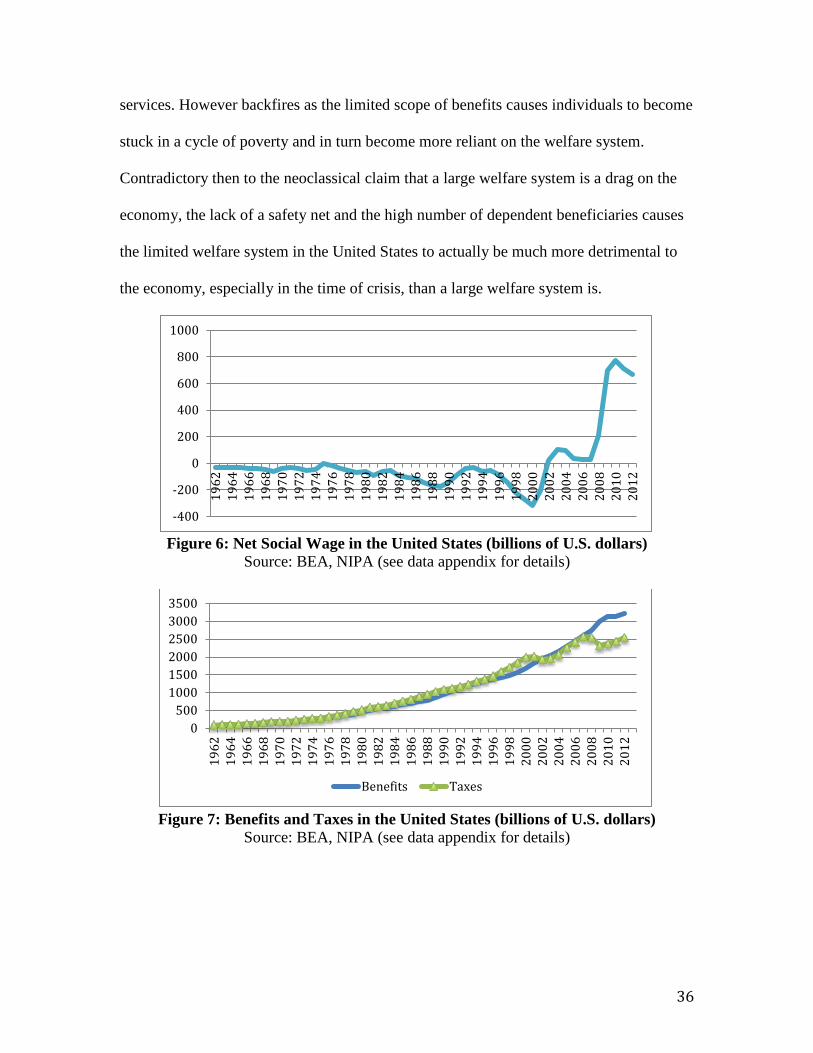
services. However backfires as the limited scope of benefits causes individuals to become
stuck in a cycle of poverty and in turn become more reliant on the welfare system.
Contradictory then to the neoclassical claim that a large welfare system is a drag on the
economy, the lack of a safety net and the high number of dependent beneficiaries causes
the limited welfare system in the United States to actually be much more detrimental to
the economy, especially in the time of crisis, than a large welfare system is.
Figure 6: Net Social Wage in the United States (billions of U.S. dollars)
Source: BEA, NIPA (see data appendix for details)
Figure 7: Benefits and Taxes in the United States (billions of U.S. dollars)
Source: BEA, NIPA (see data appendix for details)
-400
-200
0
200
400
600
800
1000
1962
1964
1966
1968
1970
1972
1974
1976
1978
1980
1982
1984
1986
1988
1990
1992
1994
1996
1998
2000
2002
2004
2006
2008
2010
2012
0500
100015002000250030003500
1962
1964
1966
1968
1970
1972
1974
1976
1978
1980
1982
1984
1986
1988
1990
1992
1994
1996
1998
2000
2002
2004
2006
2008
2010
2012
Benefits Taxes
36

Figure 8: Net Social Wage as a Percentage of GDP in the United States
Source: BEA, NIPA (see data appendix for details)
4.2 The Case of a Decreasing Net Social Wage: Sweden
In Sweden, instead of an increasing net social wage like we see in the United
States, the net social wage has actually been decreasing over the same time period (see
figure 9). In the immediate postwar period, both the United States and Sweden
experienced negative net social wages because both countries’ taxes increased faster than
their expenditures. However, unlike in the U.S., in recent years, Sweden’s net social
wage has actually been decreasing further. This is because in recent years, even during
times of economic success Sweden kept their tax levels high, leading to a further
divergence between taxes and expenditures (see figure 10).
As with the United States, comparing Sweden’s net social wage to its share of
GDP provides us with a strong comparison of the welfare system in relation to the
country’s economy. As seen in figure 11, the net social wage has been a negative
percentage of GDP in Sweden over the entire time period since 1965. This demonstrates,
that instead of being a drag on the economy, workers have in fact been contributing to it.
Although net social wage as a percentage of GDP was negative over this entire time
-8%
-6%
-4%
-2%
0%
2%
4%
6%
1962
1964
1966
1968
1970
1972
1974
1976
1978
1980
1982
1984
1986
1988
1990
1992
1994
1996
1998
2000
2002
2004
2006
2008
2010
2012
37

period, beginning in the 1980s, the net social wage as a percentage of GDP decreased
even further. This occurred because due to the international attack on the welfare state
Sweden begun to reverse their redistributive policies in order to appease the world
community. However, unable to fully let go of their egalitarian ideals, the tax levels
remained high. Thus, the decreasing expenditures combined with high tax rates led to a
negative and decreasing net social wage, which has continued to be a negative percentage
of GDP.
Thus, contrary to conservative critiques, Sweden’s negative and further
decreasing net social wage demonstrates the strength of a large welfare system. By using
periods of economic growth and stability to increase taxes, the Swedish system has
guaranteed a cushion of protection. In addition, the country’s large scope and equal
access to welfare allows all Swedish citizens equal opportunities to provide for
themselves and escape a cycle of poverty. Thus, the country’s history of egalitarian
policies bolstered by the egalitarian beliefs held by the country’s population has
constructed a welfare system that is protective of all of its citizens, especially in the time
of crisis.
Figure 9: Net Social Wage in Sweden (Billions of Swedish Kronor) Source: Statistics Sweden and OECD (see data appendix for details)
-900-800-700-600-500-400-300-200-100
0100
1965
1967
1969
1971
1973
1975
1977
1979
1981
1983
1985
1987
1989
1991
1993
1995
1997
1999
2001
2003
2005
2007
2009
2011
38
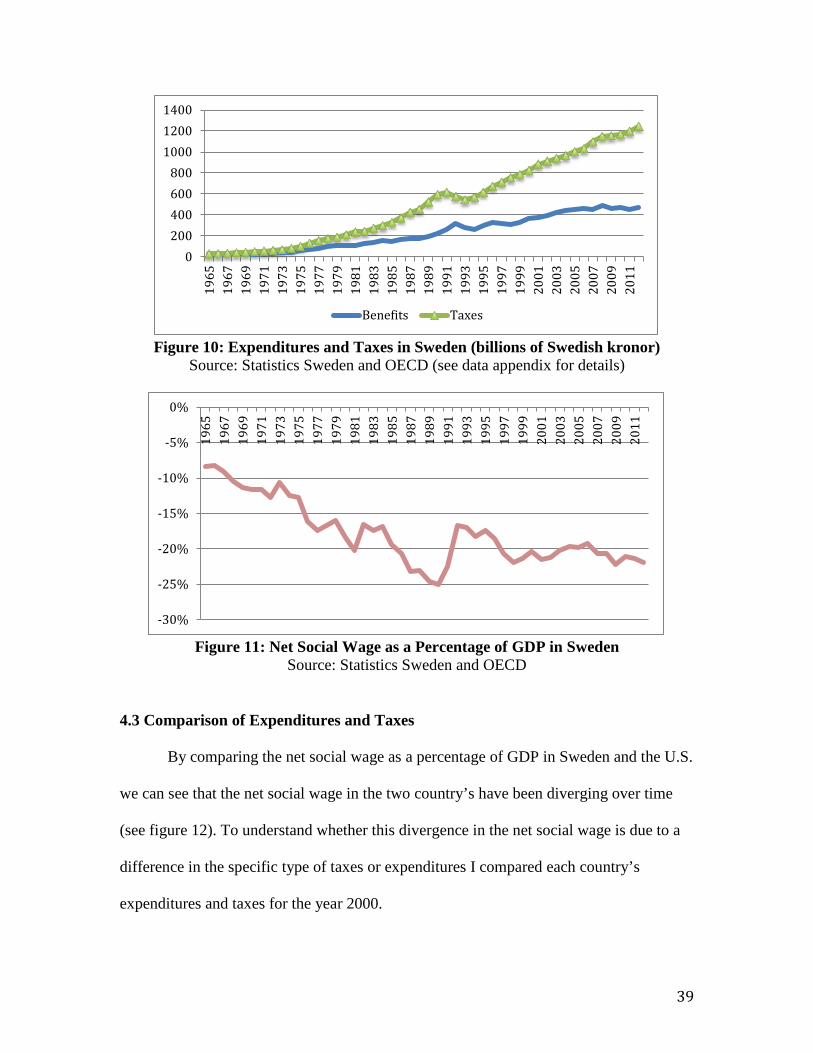
Figure 10: Expenditures and Taxes in Sweden (billions of Swedish kronor)
Source: Statistics Sweden and OECD (see data appendix for details)
Figure 11: Net Social Wage as a Percentage of GDP in Sweden
Source: Statistics Sweden and OECD
4.3 Comparison of Expenditures and Taxes
By comparing the net social wage as a percentage of GDP in Sweden and the U.S.
we can see that the net social wage in the two country’s have been diverging over time
(see figure 12). To understand whether this divergence in the net social wage is due to a
difference in the specific type of taxes or expenditures I compared each country’s
expenditures and taxes for the year 2000.
0200400600800
100012001400
1965
1967
1969
1971
1973
1975
1977
1979
1981
1983
1985
1987
1989
1991
1993
1995
1997
1999
2001
2003
2005
2007
2009
2011
Benefits Taxes
-30%
-25%
-20%
-15%
-10%
-5%
0%
1965
1967
1969
1971
1973
1975
1977
1979
1981
1983
1985
1987
1989
1991
1993
1995
1997
1999
2001
2003
2005
2007
2009
2011
39

Figure 12: Net Social Wage as a Percentage of GDP in U.S. and Sweden
Source: See data appendix for details
Figure 13: Share in Total
Expenditures in the United States Source: BEA, NIPA (see data appendix
for details)
Figure 14: Share in Total Expenditures in Sweden
Source: Statistics Sweden (see data appendix for details)
-20.0%
-15.0%
-10.0%
-5.0%
0.0%
5.0%
10.0%
1965
1967
1969
1971
1973
1975
1977
1979
1981
1983
1985
1987
1989
1991
1993
1995
1997
1999
2001
2003
2005
2007
2009
2011
U.S. Sweden
Social Security, welfare and
income support
63%
Housing and community
services 2%
Employment and
training 0%
Education 22%
Health 5%
Recreation and culture
1%
Energy 1%
Natural Resources
1%
Postal Services 0%
Passenger Transportatio
n 5%
Social Security,
welfare and income support
66%
Housing and community
services 2%
Other economic services
19%
Education 8%
Health 4%
Recreation and culture
1%
Environment
0%
40

Figure 15: Share in Total Taxes in the United States
Source: BEA, NIPA (see data appendix for details)
Figure 16: Share in Total Taxes in Sweden
Source: OECD, (see data appendix for details)
As figure 12 and figure 13 show the expenditures distribution between the two
countries are quite similar. Both countries spend the majority of expenditures (between
63% to 66%) on social security, welfare and income support. The main distinction, quite
surprisingly, is that the United States spends 22% of social expenditures on education10,
while Sweden spends only 8%. Another small, but significant distinction in expenditures
is that Sweden spends 19% on other economic services (which includes labor training)
while the breakdown of spending in the U.S. has no such category. By finding no
significant difference in expenditure distribution between the United States and Sweden I
demonstrate that the divergence in net social wage between the two countries is not due
to a difference in the type or distribution of welfare spending.
10 Although the share the U.S. spends on education is surprisingly high, this is beyond the scope of my study. See Hanushek (2003) for a possible explanation.
Contributions for social insurance
37%
Federal income taxes
37%
State & local income taxes
8%
Other Taxes
0%
Motor Vehicle
and licenses
0%
Personal Property
Taxes 0%
Indirect Taxes 18% Contributions
for social insurance
37%
Payroll Taxes
6%
Federal income taxes
3%
States & local income taxes
27%
Other Taxes 0%
Motor Vehicle
and licenses
1%
Personal Property
Taxes 3%
Indirect Taxes 23%
41

In terms of the tax distribution in 2000, both countries brought in 37% of taxes
from contributions to social insurance, which formed the largest sources of taxes from
workers in both countries (tied with federal income taxes in the U.S.). A very important
distinction between the two country’s sources of taxes lies in the type of income taxes
each country received. In the United States, the majority of income taxes derived from
the federal level, accounting for 37% of total taxes and 85% of income taxes. While in
Sweden the majority of income taxes derived from the state and local level, accounting
for 27% of total taxes and 90% of all income taxes. What is interesting about this
distinction is the fact that the United States is notorious for providing welfare on a local
level with reluctance to ever nationalize programs unless it is absolutely necessary. The
fact that 37% of the taxes workers pay goes to the federal government is likely a sign that
these taxes are going to national projects that have little or no benefits for the workers.
Chapter 5: Conclusion
My historical-institutional analysis of the welfare system in Sweden and the
United States has yielded three important conclusions. First, since the rise of
neoliberalism in the 1970s and 1980s, welfare systems throughout the world have been
under attack. The driving force of this attack is the belief that welfare systems are a drag
on the economy since they redistribute resources from productive to unproductive uses in
the form of welfare expenditures. In order to test this hypothesis I use the net social wage
methodology developed by Shaikh and Tonak (2000; 1987). Net social wage is calculated
by subtracting the benefits received by workers from the taxes paid by them. A negative
net social wage shows that a welfare system is self-financed by the workers and thus one
42

would argue, not a drag on the economy. My findings demonstrate that the net social
wage has been negative in the U.S. from 1962 to the early 2000s and in Sweden from
1965 to 2012.
Second, workers in the United States comparatively pay a large portion of their
taxes through federal income taxes than their Swedish counterparts. In fact, in Sweden, a
country with a developed nationalized welfare system; workers pay only 3% of total
taxes through federal income taxes, while the U.S., a country with a limited nationalized
welfare system, receives 37% of total taxes from workers through federal income taxes
(see figure 15 and figure 16). The fact that workers in the U.S. pay significantly more in
federal income taxes than workers do in Sweden likely demonstrates that these taxes in
the U.S. are going to expenditures other than just workers’ benefits such as military
expenditure and other government spendings that have little or no benefits for the
workers. This further demonstrates that in the U.S., workers are contributing to the
country’s economy instead of being a burden on it.
The third conclusion is that over the years, Sweden’s net social wage has been
secularly declining while the United States’ net social wage has shown much cyclicality.
This is especially relevant if we look at how these two countries responded to the recent
financial crises of the last decade. As the data shows, because of high taxes, expanding
benefits during the time of crises did not cause an extensive strain on Sweden’s economy.
However, in the U.S., with no universal safety net, the need to expand benefits during the
times of crises was extremely urgent. As Fazeli and Fazeli (2012) argued, this shows that
contrary to many mainstream economists’ claim that the welfare system was a
contributing factor to the sluggish economic growth and the financial crisis, the positive
43

net social wage was in reality a consequence of the economic downturn and a weak
welfare system.
My study has thus shown that the mainstream critique that welfare states are
giving to the “undeserving” poor and/or are a drag on the economy does not have strong
support.
References
Akram-Lodhi, H. (1996). The Public Financies of the United Kingdom: A re-interpretation. International Review of Applied Economics 10(2): 173-193. Alestalo, M., Hort, S., & Kuhnle, S. (2009). The Nordic Model: Conditions, Origin, Outcomes, Lessons.” Hertie School of Governance – Working Papers, 41, 1-57.
Atkinson, A.B. (1999). The Economic Consequence of Rolling Back the Welfare State Cambridge, MA: The MIT Press. Bowles, S. & Gintis, H. (1982). The Crisis of Liberal Democratic Capitalism: The Case of the United States. Politics & Society 11(1), 51-93. Brady, D. (2005). The Welfare State and Relative Poverty in Rich Western Democracies, 1967-1997. Social Forces 83(4), 1329-1364. Fazeli, R & Fazeli, R. (2012). The Welfare State and the Market Economy: The American and German Experiences of Social Policy. Economic Research – Ekonomska Istravianja 25(1) 163-189. Freeman, R., Swedenborg, B. & Topel, R. (2001). Reforming the Welfare State: Recovery and Beyond in Sweden. Chicago, IL: The University of Chicago Press. Gatti, D. & Glyn, A. (2006). Welfare States in Hard Times. Oxford Review of Economic Policy, 22(3), 301-312. Hanushek, E. (2003). The Failure of Input Based Schooling Policies. The Economic Review, 113(485), F64-F98. Himmelberg, R. (2001). The Great Depression and the New Deal. Westport, CT: Greenwood Press.
44

Katz, M. (2010). The American Welfare State and Social Contract in Hard Times. Journal of Policy History, 22(4), 508-529. Madisson, A. (2007). The World Economy: Development Centre Studies. Organization for Economic Cooperation and Development. Maniatis, T. (2013). Does the State Benefit Labor? A Cross-Country Comparison of the Net Social Wage. Review of Radical Political Economics, 1-19. Maniatis, T. (1993). State Revenues and Expenditures and Income Redistribution in Sweden and Norway. (Doctoral dissertation). Retrieved from UMI Dissertation Express (order number 9420276). Miller, J. (1989). A Negative Social Wage and the Reproduction Crisis of the 1980s. Review of Radical Political Economics, 21(3), 82-90. Moudud, J.K. & Zacharias, A. (1999). The Social Wage, Welfare Policy, and the Phases of Capital Accumulation. (Jerome Levy Economics Institute Working Paper No. 291). Moudud, J.K. & Zacharias, A. (2000). Whither the Welfare State? (Jerome Levy Economics Institute, Public Policy Brief 61(A)). Hudson: New York. Rothbard, M. (1963). America's Great Depression. Princeton, NJ: Van Nostrand. Sepheri, A. & Chernomas, R. (1992). Who Paid for the Canadian Welfare State between 1955-1988? Review of Radical Political Economists 24(1): 71-88. Shaikh, A. (2003). Who Pays for the "Welfare" in the Welfare State? A Multicounty Study. Social Research: An International Quarterly, 70(2), 531-550. Shaikh, A., & Tonak A. (1987). The Welfare State and the Myth of the Social Wage. The Imperiled Economy, URPE, New York. Shaikh, A. & Tonak A. (2000). The Rise and Fall of the US Welfare State. Political Economy and Contemporary Capitalism: Radical Perspectives on Economic Theory and Policy, 247-265. Sjögren, H. (2008). Welfare Capitalism: The Swedish Economy, 1850-2005. In S. Fellman, M. Iversen, H. Sjögren & L. Thue (Eds.), Creating Nordic Capitalism: The Business History of a Competitive Periphery. (20-74). New York, NY: Palgrave Macmillan. Sjöberg, S. (n.d.). The Swedish Experience: the Decline of the “People’s Home”. In L. Brangsch & C. Hildebrant (Eds.) The Prospect of the European Welfare State – Review and Problems Challenge for the Left. Rose Luxemburg Foundation.
45

Social Security Act of 1935. H.R. 7260, 74th Congress. (1935). Steinmo, S. (2002). Globalization and Taxation: Challenges to the Swedish Welfare State. Comparative Political Studies, 35(7), 839-862. Szamuely, L. (1990). The Expansion of the Welfare State: An International Comparison. Acta Oeconomica, 42(3/4), 183-195. Therborn, Göran. (1984). The Prospects of Labour and the Transformation of Advanced Capitalism. New Left Review 145, 5-38. Trattner, W. (1999). From Poor Law to Welfare State: A History of Social Welfare in America. New York: Simon & Schuster. Wilsford, D. (1994). Path Dependency or Why History Makes It Difficult but Not Impossible to Reform Health Care Systems in a Big Way. Journal of Public Policy, 14(3), 251-281. Data Appendix Main Data Sources: Bureau of Economic Analysis (BEA), National Income Product Accounts (NIPA): http://www.bea.gov/iTable/iTable.cfm?ReqID=9&step=1#reqid=9&step=1&isuri=1 Statistics Sweden Historical Yearbooks: http://www.scb.se/en_/Finding-statistics/Historical-statistics/Statistical-Yearbook-of-Sweden/ Organization for Economic Cooperation and Development (OECD): http://www.oecd.org A1: Data Sources for the United States: Social Security and welfare BEA, NIPA table 3.12 lines 4-40 (minus
lines 14, 16-20 and 26) Income support BEA, NIPA table 3.15.5, line 35 Housing and community services BEA, NIPA table 3.15.5, line 26 Employment and training BEA, NIPA table 3.12, line 41 Education BEA, NIPA 3.15.5, line 29 Health BEA, NIPA table 3.15.5, line 27 Recreation and culture BEA, NIPA table 3.15.5, line 28 Energy BEA, NIPA table 3.15.5, line 22 Natural resources BEA, NIPA table 3.15.5, line 23 Postal services BEA, NIPA table 3.15.5, line 24 Transportation BEA, NIPA table 3.15.5, line 13 Gas consumption of laborers Shaikh & Tonak, 2000 Labor share BEA, NIPA table 2.1, line 1/2
Contributions for social insurance BEA, NIPA table 3.6, lines 2-31 (minus lines 14, 16, 16 and 30)
46

Federal income taxes BEA, NIPA table 3.4, line 2 State and local income taxes BEA, NIPA table 3.4, line 9 Other taxes BEA, NIPA table 3.4, line 12 Motor vehicle and license taxes BEA, NIPA table 3.4, line 10 Personal property taxes BEA, NIPA table 3.4, line 11 Indirect taxes BEA, NIPA table 1.10, line 7 A2: Data Sources for Sweden: Social Security, welfare and income support
Statistics Sweden, State expenditure (current budget) by purpose table, "sociålvard och socialförsäkring"/"socialförsäkring och social välfärd"/"social trygghet"
Housing and community services
Statistics Sweden, State expenditure (current budget) by purpose table, "bostadspolitik och samhällsplanering"/"bostadspolitik samhällsplanering och lokaliseringpolitik"
Employment and training
Statistics Sweden, State expenditure (current budget) by purpose table, "andra samhälleliga och sociala tjänster" plus " "ekonomiska tjänster"/"näringslivsfrågor"
Education
Statistics Sweden, State expenditure (current budget) by purpose table, "undervisning"/"utbildning"
Health
Statistics Sweden, State expenditure (current budget) by purpose table, "hälsovård"/"hälso och sjukvård"
Recreation and culture
Statistics Sweden, State expenditure (current budget) by purpose table, "kultur rekreation"
Energy Statistics Sweden, State expenditure (current budget) by purpose table, "energi"
Environment
Statistics Sweden, State expenditure (current budget) by purpose table, "Miljöskydd"
Postal services Statistics Sweden, Post office: revenue and expenditure table, expenditure
Railways Statistics Sweden, State railways: revenue, expenditure and financial results
Labor share OECD, Labor Share
Contributions for social insurance OECD, Tax Statistics Sweden, 2000 Social security contributions
Payroll taxes OECD, Tax Statistics Sweden, 2000 Social security contributions
Federal income taxes OECD, Tax Statistics Sweden, 1110
47

National income tax individual
State and local income taxes OECD, Tax Statistics Sweden, 1110 Local income tax individual
Other taxes OECD, Tax Statistics Sweden, 5113 Other
Motor vehicle and license taxes OECD, Tax Statistics Sweden, 5211 Paid by households: motor vehicles
Personal property taxes OECD, Tax Statistics Sweden, 4000 Taxes on property
Indirect taxes OECD, Tax Statistics Sweden, 5100 Taxes on production, sale, transfer, etc.
48

A3: Net Social Wage for U.S. (Billions of U.S. Dollars)Expenditures 1962 1963 1964
Expenditure Group I: Entirely Allocated to Labor (E1) 29.80 31.10 32.40Social Security, welfare and income support 26.20 27.70 28.50Housing and community services 3.60 3.40 3.90Employment and training -‐-‐-‐ -‐-‐-‐ -‐-‐-‐Expenditure Group II: Partially Allocated to Labor (E2*LS) 30.49 33.34 36.13 Labor Share 0.71 0.71 0.71Expenditure Group II Total (E2) 42.97 46.78 50.66Education 22.50 24.80 27.40Health 5.50 5.90 6.40Recreation and culture 1.20 1.30 1.30Energy 1.80 1.80 2.10Natural Resources 1.90 1.90 2.00Postal Services 0.20 0.30 0.40Passenger Transportation = transporation x GCONS 9.87 10.78 11.06 Transportation 14.10 15.40 15.80 Transportation (*gas consumption of laborers) 0.70 0.70 0.70E1+E2*LS = Total benefits received by labor 60.29 64.44 68.53
Taxes 1962 1963 1964Tax Group I: Paid Entirely by Labor (T1) 17.70 20.30 20.90Contributions for social insurance 17.70 20.30 20.90Tax Group II: Partially Allocated to Labor (T2*LS) 36.55 38.91 37.15 Labor Share 0.71 0.71 0.71Tax Group II Total (T2) 51.50 54.60 52.10Total income taxes = federal + state and local income taxes 49.70 52.50 50.00 Federal income taxes 46.50 49.10 46.00 States & local income taxes 3.20 3.40 4.00Other Taxes 0.20 0.30 0.30Motor Vehicle and licenses 1.00 1.10 1.10Personal Property Taxes 0.60 0.70 0.70Tax Group III: Partially Allocated to Labor (T3*LS) 35.77 38.06 40.86 Labor Share 0.71 0.71 0.71Tax Group III Total (T3) 50.40 53.40 57.30Indirect Taxes 50.40 53.40 57.30T1+T2*LS+T3*LS = Total taxes paid by labor 90.01 97.27 98.91(E1+E2*LS) - (T1+T2*LS+T3*LS) = Net Social Wage -29.72 -32.83 -30.39
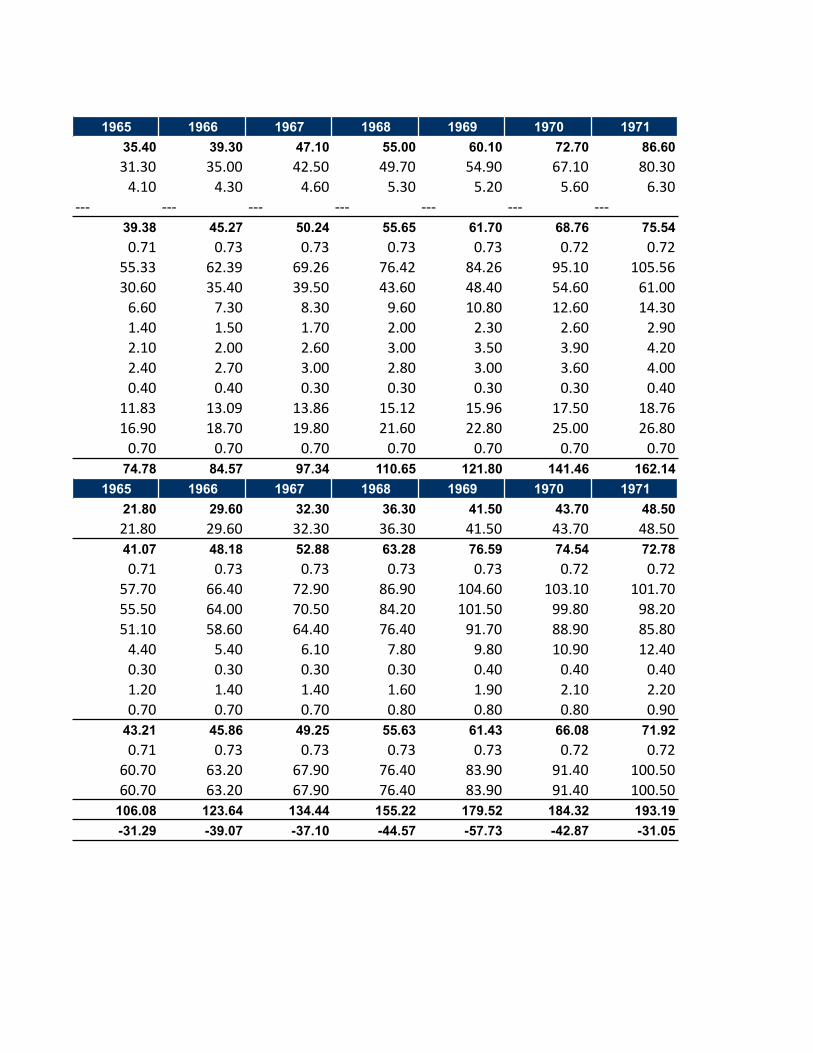
1965 1966 1967 1968 1969 1970 197135.40 39.30 47.10 55.00 60.10 72.70 86.6031.30 35.00 42.50 49.70 54.90 67.10 80.304.10 4.30 4.60 5.30 5.20 5.60 6.30
-‐-‐-‐ -‐-‐-‐ -‐-‐-‐ -‐-‐-‐ -‐-‐-‐ -‐-‐-‐ -‐-‐-‐39.38 45.27 50.24 55.65 61.70 68.76 75.540.71 0.73 0.73 0.73 0.73 0.72 0.72
55.33 62.39 69.26 76.42 84.26 95.10 105.5630.60 35.40 39.50 43.60 48.40 54.60 61.006.60 7.30 8.30 9.60 10.80 12.60 14.301.40 1.50 1.70 2.00 2.30 2.60 2.902.10 2.00 2.60 3.00 3.50 3.90 4.202.40 2.70 3.00 2.80 3.00 3.60 4.000.40 0.40 0.30 0.30 0.30 0.30 0.40
11.83 13.09 13.86 15.12 15.96 17.50 18.7616.90 18.70 19.80 21.60 22.80 25.00 26.800.70 0.70 0.70 0.70 0.70 0.70 0.70
74.78 84.57 97.34 110.65 121.80 141.46 162.141965 1966 1967 1968 1969 1970 1971
21.80 29.60 32.30 36.30 41.50 43.70 48.5021.80 29.60 32.30 36.30 41.50 43.70 48.5041.07 48.18 52.88 63.28 76.59 74.54 72.780.71 0.73 0.73 0.73 0.73 0.72 0.72
57.70 66.40 72.90 86.90 104.60 103.10 101.7055.50 64.00 70.50 84.20 101.50 99.80 98.2051.10 58.60 64.40 76.40 91.70 88.90 85.804.40 5.40 6.10 7.80 9.80 10.90 12.400.30 0.30 0.30 0.30 0.40 0.40 0.401.20 1.40 1.40 1.60 1.90 2.10 2.200.70 0.70 0.70 0.80 0.80 0.80 0.90
43.21 45.86 49.25 55.63 61.43 66.08 71.920.71 0.73 0.73 0.73 0.73 0.72 0.72
60.70 63.20 67.90 76.40 83.90 91.40 100.5060.70 63.20 67.90 76.40 83.90 91.40 100.50
106.08 123.64 134.44 155.22 179.52 184.32 193.19-31.29 -39.07 -37.10 -44.57 -57.73 -42.87 -31.05

1972 1973 1974 1975 1976 1977 197896.10 110.50 131.90 163.90 180.50 193.90 209.3089.70 103.30 123.20 153.60 169.50 183.00 195.506.40 7.20 8.50 9.70 10.10 10.00 11.90
-‐-‐-‐ -‐-‐-‐ 0.20 0.60 0.90 0.90 1.9082.71 89.74 101.93 112.92 120.72 130.07 144.570.72 0.72 0.71 0.70 0.70 0.71 0.71
115.40 125.36 143.03 162.44 172.04 184.05 203.6366.80 72.90 81.20 92.30 98.80 105.10 112.9016.20 18.10 20.80 23.60 24.70 26.70 29.603.10 3.40 4.20 5.00 5.10 5.40 6.004.70 5.00 6.60 8.00 9.50 11.80 16.004.40 4.50 5.20 6.20 6.40 6.80 7.700.60 0.60 0.60 0.60 0.80 0.60 0.70
19.60 20.86 24.43 26.74 26.74 27.65 30.7328.00 29.80 34.90 38.20 38.20 39.50 43.900.70 0.70 0.70 0.70 0.70 0.70 0.70
178.81 200.24 233.83 276.82 301.22 323.97 353.871972 1973 1974 1975 1976 1977 1978
56.00 71.90 81.20 85.20 96.80 108.30 126.0056.00 71.90 81.20 85.20 96.80 108.30 126.0088.65 94.85 107.68 102.60 120.90 139.64 162.870.72 0.72 0.71 0.70 0.70 0.71 0.71
123.70 132.50 151.10 147.60 172.30 197.60 229.40120.00 128.50 146.90 143.20 167.50 192.60 223.90102.80 109.60 126.50 120.70 141.20 162.20 188.9017.20 18.90 20.40 22.50 26.30 30.40 35.000.40 0.50 0.60 0.70 0.80 0.80 0.902.40 2.60 2.70 2.80 3.10 3.30 3.600.90 0.90 0.90 0.90 0.90 0.90 1.00
77.33 83.90 89.01 94.05 102.73 112.86 121.330.72 0.72 0.71 0.70 0.70 0.71 0.71
107.90 117.20 124.90 135.30 146.40 159.70 170.90107.90 117.20 124.90 135.30 146.40 159.70 170.90221.98 250.65 277.89 281.86 320.43 360.80 410.20-43.18 -50.41 -44.06 -5.04 -19.21 -36.83 -56.33
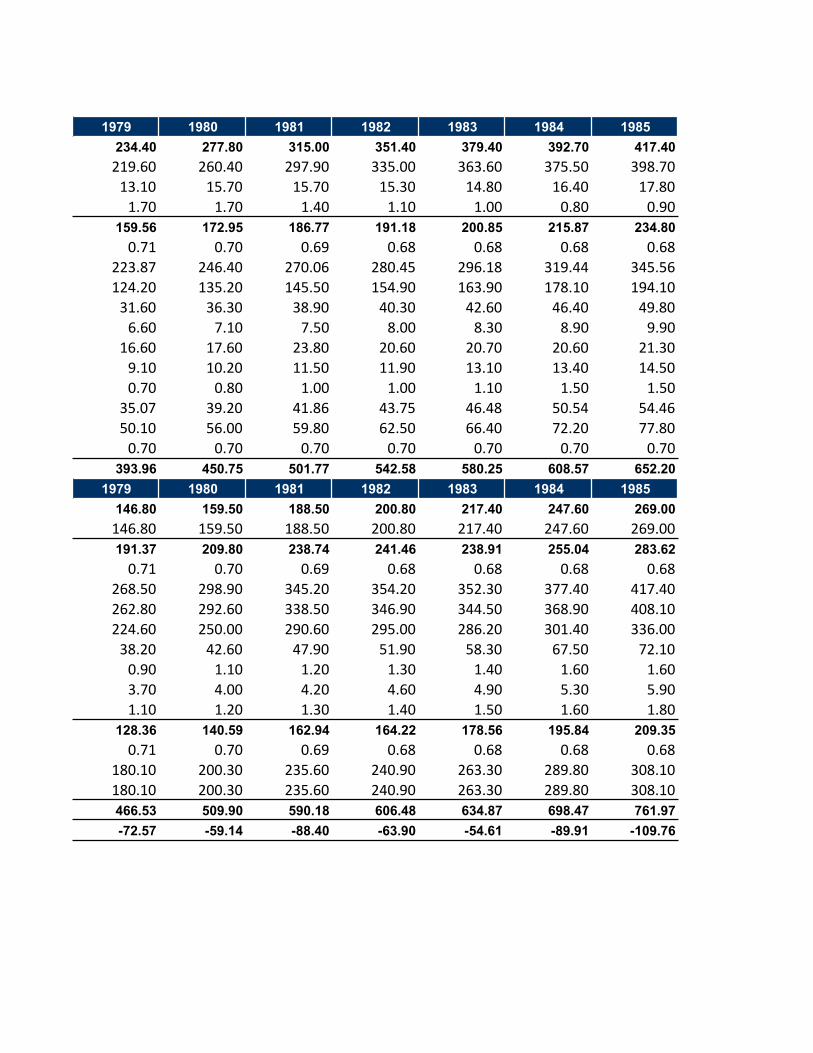
1979 1980 1981 1982 1983 1984 1985234.40 277.80 315.00 351.40 379.40 392.70 417.40219.60 260.40 297.90 335.00 363.60 375.50 398.7013.10 15.70 15.70 15.30 14.80 16.40 17.801.70 1.70 1.40 1.10 1.00 0.80 0.90
159.56 172.95 186.77 191.18 200.85 215.87 234.800.71 0.70 0.69 0.68 0.68 0.68 0.68
223.87 246.40 270.06 280.45 296.18 319.44 345.56124.20 135.20 145.50 154.90 163.90 178.10 194.1031.60 36.30 38.90 40.30 42.60 46.40 49.806.60 7.10 7.50 8.00 8.30 8.90 9.90
16.60 17.60 23.80 20.60 20.70 20.60 21.309.10 10.20 11.50 11.90 13.10 13.40 14.500.70 0.80 1.00 1.00 1.10 1.50 1.50
35.07 39.20 41.86 43.75 46.48 50.54 54.4650.10 56.00 59.80 62.50 66.40 72.20 77.800.70 0.70 0.70 0.70 0.70 0.70 0.70
393.96 450.75 501.77 542.58 580.25 608.57 652.201979 1980 1981 1982 1983 1984 1985
146.80 159.50 188.50 200.80 217.40 247.60 269.00146.80 159.50 188.50 200.80 217.40 247.60 269.00191.37 209.80 238.74 241.46 238.91 255.04 283.620.71 0.70 0.69 0.68 0.68 0.68 0.68
268.50 298.90 345.20 354.20 352.30 377.40 417.40262.80 292.60 338.50 346.90 344.50 368.90 408.10224.60 250.00 290.60 295.00 286.20 301.40 336.0038.20 42.60 47.90 51.90 58.30 67.50 72.100.90 1.10 1.20 1.30 1.40 1.60 1.603.70 4.00 4.20 4.60 4.90 5.30 5.901.10 1.20 1.30 1.40 1.50 1.60 1.80
128.36 140.59 162.94 164.22 178.56 195.84 209.350.71 0.70 0.69 0.68 0.68 0.68 0.68
180.10 200.30 235.60 240.90 263.30 289.80 308.10180.10 200.30 235.60 240.90 263.30 289.80 308.10466.53 509.90 590.18 606.48 634.87 698.47 761.97-72.57 -59.14 -88.40 -63.90 -54.61 -89.91 -109.76

1986 1987 1988 1989 1990 1991 1992445.30 467.70 497.90 542.60 601.30 679.30 763.30424.30 444.70 473.80 517.40 573.80 650.70 734.1020.10 22.10 23.20 24.30 26.60 27.70 28.100.90 0.90 0.90 0.90 0.90 0.90 1.10
250.84 269.03 288.31 307.05 333.87 353.50 371.570.68 0.69 0.69 0.68 0.68 0.68 0.68
367.32 390.59 417.84 451.22 489.87 519.30 547.65210.90 226.10 244.50 269.00 292.70 311.30 329.3052.00 55.80 60.90 66.00 71.80 76.30 79.0010.70 11.30 12.10 13.50 15.00 15.90 16.7019.80 19.10 18.60 18.00 18.40 18.70 22.2014.60 15.20 15.90 16.50 17.30 18.50 19.301.50 2.40 2.00 2.00 2.50 3.00 3.10
57.82 60.69 63.84 66.22 72.17 75.60 78.0582.60 86.70 91.20 94.60 103.10 108.00 111.500.70 0.70 0.70 0.70 0.70 0.70 0.70
696.14 736.73 786.21 849.65 935.17 1032.80 1134.871986 1987 1988 1989 1990 1991 1992
289.40 306.90 343.70 365.50 388.80 406.50 429.70289.40 306.90 343.70 365.50 388.80 406.50 429.70298.49 336.95 348.39 385.29 403.96 399.31 414.280.68 0.69 0.69 0.68 0.68 0.68 0.68
437.10 489.20 504.90 566.20 592.70 586.60 610.60427.40 478.50 493.40 553.80 579.70 573.00 595.60350.00 392.50 402.80 451.50 470.10 461.30 475.2077.40 86.00 90.60 102.30 109.60 111.70 120.401.40 1.60 1.70 1.80 1.90 2.00 2.106.30 6.80 7.30 7.80 8.10 8.40 9.202.00 2.30 2.50 2.80 3.00 3.20 3.70
220.84 239.35 258.41 271.44 289.66 311.16 327.980.68 0.69 0.69 0.68 0.68 0.68 0.68
323.40 347.50 374.50 398.90 425.00 457.10 483.40323.40 347.50 374.50 398.90 425.00 457.10 483.40808.73 883.20 950.49 1022.23 1082.42 1116.97 1171.95
-112.60 -146.47 -164.28 -172.59 -147.25 -84.17 -37.09

1993 1994 1995 1996 1997 1998 1999810.30 849.30 898.20 941.60 973.10 997.20 1037.00781.30 821.60 869.50 910.70 940.70 964.10 1001.7027.90 26.60 27.60 30.00 31.40 32.00 34.201.10 1.10 1.10 0.90 1.00 1.10 1.10
385.23 404.45 422.42 436.12 461.05 487.61 532.170.68 0.68 0.67 0.66 0.67 0.67 0.68
569.35 598.56 630.87 657.01 691.87 728.63 785.31343.30 362.40 387.90 408.40 434.10 460.30 495.3081.00 84.20 86.00 87.70 89.20 93.30 101.1017.10 18.10 19.40 20.70 22.40 23.70 25.0024.00 22.40 24.00 21.10 20.90 19.60 22.4019.20 21.60 21.90 23.20 23.30 24.70 25.902.50 2.50 2.70 3.30 3.90 4.20 4.80
82.25 87.36 88.97 92.61 98.07 102.83 110.81117.50 124.80 127.10 132.30 140.10 146.90 158.30
0.70 0.70 0.70 0.70 0.70 0.70 0.701195.53 1253.75 1320.62 1377.72 1434.15 1484.81 1569.17
1993 1994 1995 1996 1997 1998 1999451.40 481.30 504.40 525.70 556.60 592.50 627.30451.40 481.30 504.40 525.70 556.60 592.50 627.30437.43 466.57 498.10 552.21 617.21 686.88 750.440.68 0.68 0.67 0.66 0.67 0.67 0.68
646.50 690.50 743.90 831.90 926.20 1026.40 1107.40631.70 674.70 727.50 815.60 908.90 1008.20 1088.50505.50 542.50 585.80 663.30 744.20 825.20 893.00126.20 132.20 141.70 152.30 164.70 183.00 195.50
2.30 2.50 2.50 2.50 2.80 3.00 3.008.90 9.20 9.70 9.30 9.90 10.40 10.803.60 4.10 4.20 4.50 4.60 4.80 5.10
340.40 368.39 373.56 385.53 407.56 427.96 456.470.68 0.68 0.67 0.66 0.67 0.67 0.68
503.10 545.20 557.90 580.80 611.60 639.50 673.60503.10 545.20 557.90 580.80 611.60 639.50 673.601229.23 1316.27 1376.06 1463.44 1581.37 1707.34 1834.21
-33.70 -62.52 -55.44 -85.72 -147.22 -222.53 -265.04

2000 2001 2002 2003 2004 2005 20061091.90 1197.90 1309.80 1380.10 1456.00 1550.30 1666.501057.80 1158.60 1266.30 1334.70 1408.90 1499.90 1607.9033.10 37.90 41.90 44.00 45.80 49.20 57.301.00 1.40 1.60 1.40 1.30 1.20 1.30
576.01 609.92 643.40 673.19 707.67 742.96 774.960.68 0.67 0.67 0.67 0.67 0.67 0.66
849.06 906.55 958.46 1003.38 1055.04 1112.20 1176.39536.00 574.10 593.20 617.00 652.70 686.10 728.00109.70 116.00 130.10 142.20 150.00 162.20 167.2028.10 30.60 33.00 32.90 34.40 36.60 37.9022.10 22.30 26.50 30.60 30.40 28.80 31.4029.10 30.50 35.10 34.30 36.60 38.70 41.504.50 3.90 2.80 2.60 3.10 3.70 4.00
119.56 129.15 137.76 143.78 147.84 156.10 166.39170.80 184.50 196.80 205.40 211.20 223.00 237.70
0.70 0.70 0.70 0.70 0.70 0.70 0.701667.91 1807.82 1953.20 2053.29 2163.67 2293.26 2441.46
2000 2001 2002 2003 2004 2005 2006669.80 695.50 712.40 737.70 784.90 825.60 871.10669.80 695.50 712.40 737.70 784.90 825.60 871.10836.01 830.77 705.05 671.59 701.54 807.29 890.720.68 0.67 0.67 0.67 0.67 0.67 0.66
1232.30 1234.80 1050.30 1001.00 1045.90 1208.50 1352.101213.00 1215.10 1029.80 978.80 1022.10 1183.60 1325.80995.60 991.80 828.50 774.10 798.50 932.10 1049.60217.40 223.30 201.30 204.70 223.60 251.50 276.20
3.10 3.30 3.40 3.70 4.40 4.70 5.0011.40 11.30 11.90 12.70 13.70 14.00 14.704.80 5.10 5.20 5.80 5.70 6.20 6.60
480.72 489.59 511.92 542.10 579.46 624.26 653.430.68 0.67 0.67 0.67 0.67 0.67 0.66
708.60 727.70 762.60 808.00 863.90 934.50 991.90708.60 727.70 762.60 808.00 863.90 934.50 991.901986.53 2015.87 1929.37 1951.39 2065.90 2257.15 2415.24-318.62 -208.04 23.83 101.90 97.77 36.11 26.22
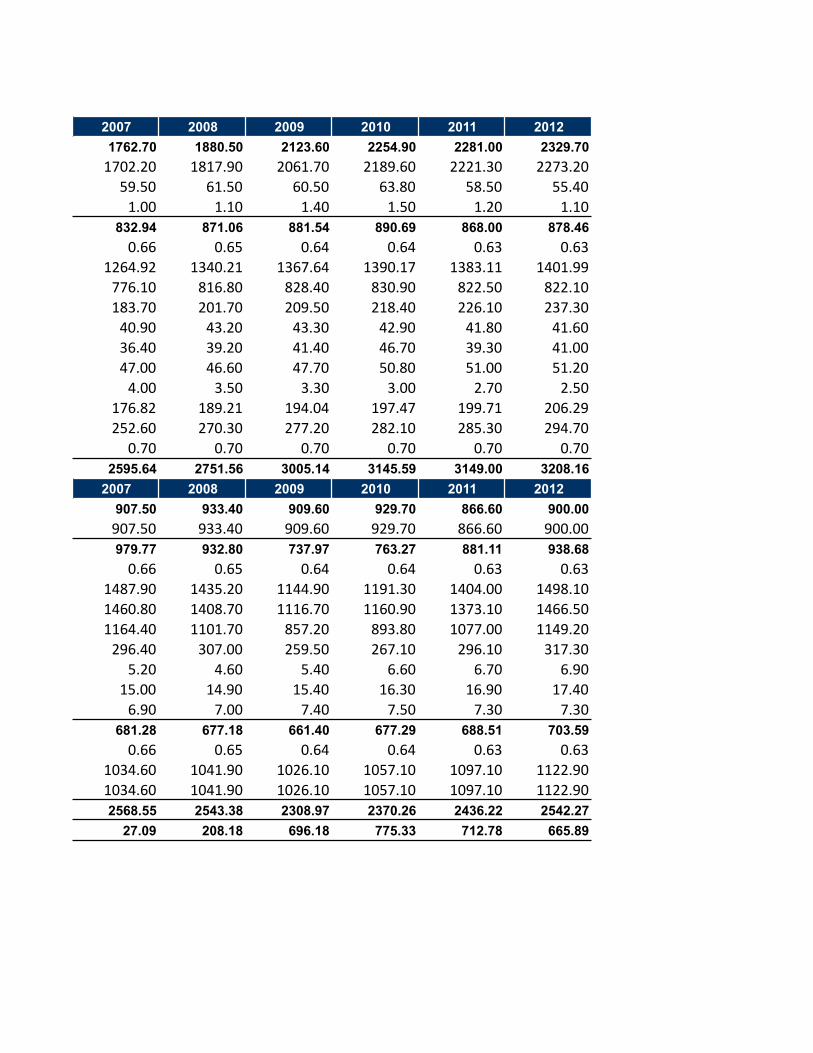
2007 2008 2009 2010 2011 20121762.70 1880.50 2123.60 2254.90 2281.00 2329.701702.20 1817.90 2061.70 2189.60 2221.30 2273.2059.50 61.50 60.50 63.80 58.50 55.401.00 1.10 1.40 1.50 1.20 1.10
832.94 871.06 881.54 890.69 868.00 878.460.66 0.65 0.64 0.64 0.63 0.63
1264.92 1340.21 1367.64 1390.17 1383.11 1401.99776.10 816.80 828.40 830.90 822.50 822.10183.70 201.70 209.50 218.40 226.10 237.3040.90 43.20 43.30 42.90 41.80 41.6036.40 39.20 41.40 46.70 39.30 41.0047.00 46.60 47.70 50.80 51.00 51.204.00 3.50 3.30 3.00 2.70 2.50
176.82 189.21 194.04 197.47 199.71 206.29252.60 270.30 277.20 282.10 285.30 294.70
0.70 0.70 0.70 0.70 0.70 0.702595.64 2751.56 3005.14 3145.59 3149.00 3208.16
2007 2008 2009 2010 2011 2012907.50 933.40 909.60 929.70 866.60 900.00907.50 933.40 909.60 929.70 866.60 900.00979.77 932.80 737.97 763.27 881.11 938.680.66 0.65 0.64 0.64 0.63 0.63
1487.90 1435.20 1144.90 1191.30 1404.00 1498.101460.80 1408.70 1116.70 1160.90 1373.10 1466.501164.40 1101.70 857.20 893.80 1077.00 1149.20296.40 307.00 259.50 267.10 296.10 317.30
5.20 4.60 5.40 6.60 6.70 6.9015.00 14.90 15.40 16.30 16.90 17.406.90 7.00 7.40 7.50 7.30 7.30
681.28 677.18 661.40 677.29 688.51 703.590.66 0.65 0.64 0.64 0.63 0.63
1034.60 1041.90 1026.10 1057.10 1097.10 1122.901034.60 1041.90 1026.10 1057.10 1097.10 1122.902568.55 2543.38 2308.97 2370.26 2436.22 2542.27
27.09 208.18 696.18 775.33 712.78 665.89

A4: Net Social Wage for Sweden (Billions of Swedish Kronor)Expenditures 1965 1966
Expenditure Group I: Entirely Allocated to Labor (E1) 11.82 13.38Social Security, welfare and income support 7.87 8.67Housing and community services 0.79 1.05Other economic services 3.15 3.66Expenditure Group II: Partially Allocated to Labor (E2*LS) 5.16 6.27 Labor Share 0.72 0.72Expenditure Group II Total (E2) 7.17 8.751Education 4.58 5.41Health 1.12 1.69Recreation and culture -‐-‐-‐ -‐-‐-‐Energy -‐-‐-‐ -‐-‐-‐Environment -‐-‐-‐ -‐-‐-‐Postal Services 1.47 1.65Railways -‐-‐-‐ -‐-‐-‐E1+E2*LS = Total benefits received by labor 16.98 19.65
Taxes 1965 1966Tax Group I: Paid Entirely by Labor (T1) 4.86 5.59Contributions for social insurance 4.85 5.58Payroll Taxes 0.01 0.02Tax Group II: Partially Allocated to Labor (T2*LS) 13.86 15.14 Labor Share 0.72 0.72Tax Group II Total (T2) 19.35 21.13Total income taxes = federal + state and local income taxes 17.97 19.71 Federal income taxes 8.68 8.68 States & local income taxes 9.29 11.03Other Taxes 0.00 0.00Motor Vehicle and licenses 0.66 0.71Personal Property Taxes 0.71 0.71Tax Group III Labor Total: Partially Allocated to Labor = T3*LS 8.46 9.90 Labor Share 0.72 0.72Tax Group III Total (T3) 11.81 13.81Indirect Taxes 11.81 13.81T1+T2*LS+T3*LS = Total taxes paid by labor 27.19 30.64(E1+E2*LS) - (T1+T2*LS+T3*LS) = Net Social Wage -10.21 -10.98

1967 1968 1969 1970 1971 1972 197314.29 15.05 16.08 17.98 21.89 24.22 30.029.59 10.66 11.65 13.36 16.82 18.43 22.860.92 0.69 0.40 0.48 0.87 0.96 1.143.78 3.69 4.02 4.14 4.20 4.83 6.026.93 7.38 8.27 8.89 9.81 10.79 11.080.72 0.72 0.72 0.72 0.72 0.73 0.70
9.669 10.304 11.545 12.403 13.694 14.805 15.8246.15 6.58 7.38 7.89 9.00 9.35 10.121.71 1.73 1.84 2.00 2.01 2.61 2.37
-‐-‐-‐ -‐-‐-‐ -‐-‐-‐ -‐-‐-‐ -‐-‐-‐ -‐-‐-‐ -‐-‐-‐-‐-‐-‐ -‐-‐-‐ -‐-‐-‐ -‐-‐-‐ -‐-‐-‐ -‐-‐-‐ -‐-‐-‐-‐-‐-‐ -‐-‐-‐ -‐-‐-‐ -‐-‐-‐ -‐-‐-‐ -‐-‐-‐ -‐-‐-‐
1.82 1.99 2.32 2.51 2.68 2.85 3.342.34 2.42 2.51 2.66 2.72 -‐-‐-‐ 3.11
21.22 22.43 24.35 26.87 31.70 35.00 41.111967 1968 1969 1970 1971 1972 1973
6.99 8.61 10.14 11.12 13.60 15.86 19.016.98 8.59 9.52 10.36 11.87 13.77 14.830.02 0.02 0.62 0.77 1.73 2.10 4.18
16.75 18.44 20.74 24.32 25.26 29.48 29.680.72 0.72 0.72 0.72 0.72 0.73 0.70
23.37 25.74 28.95 33.93 35.25 40.46 42.3721.82 23.87 26.94 31.70 32.86 37.95 39.609.59 10.44 11.69 13.86 13.39 15.25 14.67
12.23 13.43 15.25 17.84 19.47 22.69 24.930.00 0.02 0.04 0.04 0.14 0.15 0.160.75 0.97 1.04 1.18 1.25 1.28 1.440.80 0.87 0.93 1.01 1.00 1.09 1.17
10.69 11.59 12.46 13.18 16.38 17.83 18.450.72 0.72 0.72 0.72 0.72 0.73 0.70
14.91 16.17 17.38 18.39 22.85 24.47 26.3414.91 16.17 17.38 18.39 22.85 24.47 26.3434.43 38.64 43.34 48.62 55.24 63.17 67.14
-13.21 -16.21 -18.99 -21.75 -23.53 -28.17 -26.03
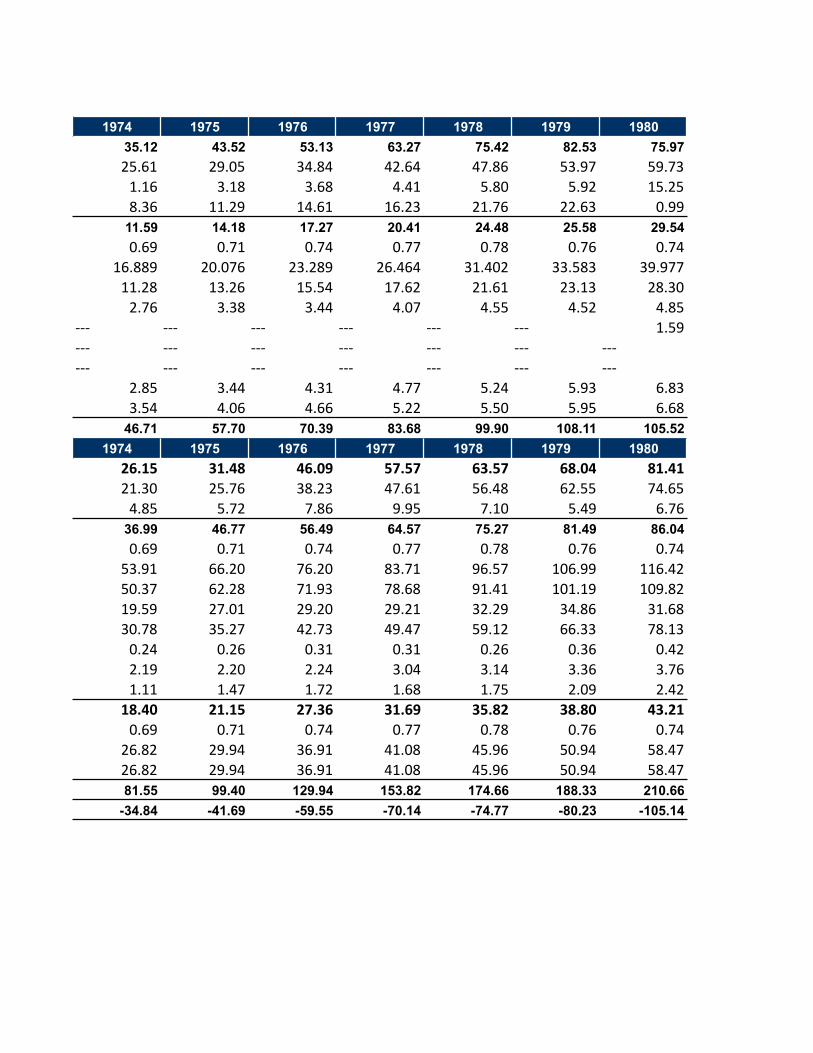
1974 1975 1976 1977 1978 1979 198035.12 43.52 53.13 63.27 75.42 82.53 75.9725.61 29.05 34.84 42.64 47.86 53.97 59.731.16 3.18 3.68 4.41 5.80 5.92 15.258.36 11.29 14.61 16.23 21.76 22.63 0.99
11.59 14.18 17.27 20.41 24.48 25.58 29.540.69 0.71 0.74 0.77 0.78 0.76 0.74
16.889 20.076 23.289 26.464 31.402 33.583 39.97711.28 13.26 15.54 17.62 21.61 23.13 28.302.76 3.38 3.44 4.07 4.55 4.52 4.85
-‐-‐-‐ -‐-‐-‐ -‐-‐-‐ -‐-‐-‐ -‐-‐-‐ -‐-‐-‐ 1.59-‐-‐-‐ -‐-‐-‐ -‐-‐-‐ -‐-‐-‐ -‐-‐-‐ -‐-‐-‐ -‐-‐-‐-‐-‐-‐ -‐-‐-‐ -‐-‐-‐ -‐-‐-‐ -‐-‐-‐ -‐-‐-‐ -‐-‐-‐
2.85 3.44 4.31 4.77 5.24 5.93 6.833.54 4.06 4.66 5.22 5.50 5.95 6.68
46.71 57.70 70.39 83.68 99.90 108.11 105.521974 1975 1976 1977 1978 1979 1980
26.15 31.48 46.09 57.57 63.57 68.04 81.4121.30 25.76 38.23 47.61 56.48 62.55 74.654.85 5.72 7.86 9.95 7.10 5.49 6.76
36.99 46.77 56.49 64.57 75.27 81.49 86.040.69 0.71 0.74 0.77 0.78 0.76 0.74
53.91 66.20 76.20 83.71 96.57 106.99 116.4250.37 62.28 71.93 78.68 91.41 101.19 109.8219.59 27.01 29.20 29.21 32.29 34.86 31.6830.78 35.27 42.73 49.47 59.12 66.33 78.130.24 0.26 0.31 0.31 0.26 0.36 0.422.19 2.20 2.24 3.04 3.14 3.36 3.761.11 1.47 1.72 1.68 1.75 2.09 2.42
18.40 21.15 27.36 31.69 35.82 38.80 43.210.69 0.71 0.74 0.77 0.78 0.76 0.74
26.82 29.94 36.91 41.08 45.96 50.94 58.4726.82 29.94 36.91 41.08 45.96 50.94 58.4781.55 99.40 129.94 153.82 174.66 188.33 210.66
-34.84 -41.69 -59.55 -70.14 -74.77 -80.23 -105.14

1981 1982 1983 1984 1985 1986 198783.76 97.63 106.42 118.80 112.40 124.34 130.1165.05 63.13 68.38 75.75 79.37 86.99 94.6617.53 18.07 20.05 23.77 13.86 17.34 16.721.18 16.43 17.98 19.27 19.17 20.02 18.73
28.68 32.85 33.34 34.77 35.68 38.01 40.360.74 0.72 0.70 0.68 0.69 0.69 0.70
38.597 45.741 47.918 51.047 51.857 54.963 57.92931.41 33.14 35.64 37.67 40.01 42.02 44.925.45 4.99 4.76 4.57 4.58 4.92 4.991.74 2.44 2.63 2.78 2.97 3.13 3.15
-‐-‐-‐ 5.17 4.88 6.03 4.30 4.90 4.87-‐-‐-‐ -‐-‐-‐ -‐-‐-‐ -‐-‐-‐ -‐-‐-‐ -‐-‐-‐ -‐-‐-‐-‐-‐-‐ -‐-‐-‐ -‐-‐-‐ -‐-‐-‐ -‐-‐-‐ -‐-‐-‐ -‐-‐-‐-‐-‐-‐ -‐-‐-‐ -‐-‐-‐ -‐-‐-‐ -‐-‐-‐ -‐-‐-‐ -‐-‐-‐
112.44 130.47 139.76 153.56 148.08 162.35 170.471981 1982 1983 1984 1985 1986 1987
93.37 94.14 109.80 120.74 124.31 144.22 158.4885.84 86.63 95.66 103.78 108.21 124.46 137.287.53 7.51 14.14 16.96 16.11 19.76 21.20
95.67 97.94 104.79 112.13 127.87 145.77 174.780.74 0.72 0.70 0.68 0.69 0.69 0.70
128.75 136.38 150.60 164.64 185.85 210.79 250.86121.87 128.81 140.04 153.33 170.41 190.23 211.7933.59 34.84 35.35 37.24 41.01 48.92 58.8088.27 93.97 104.69 116.09 129.40 141.32 152.990.44 0.50 0.51 0.64 0.62 0.75 0.983.86 3.90 4.14 4.22 4.66 5.89 5.332.58 3.17 5.91 6.45 10.16 13.92 32.76
49.06 51.76 58.29 64.95 76.14 81.92 93.080.74 0.72 0.70 0.68 0.69 0.69 0.70
66.02 72.08 83.78 95.37 110.66 118.46 133.5966.02 72.08 83.78 95.37 110.66 118.46 133.59
238.10 243.84 272.88 297.82 328.32 371.91 426.34-125.66 -113.37 -133.12 -144.26 -180.24 -209.56 -255.87

1988 1989 1990 1991 1992 1993 1994139.12 154.88 175.60 210.11 268.82 243.96 230.16101.95 110.94 125.16 131.07 139.21 138.84 145.9718.69 24.85 27.76 37.02 43.68 40.03 37.9818.48 19.09 22.69 42.01 85.93 65.08 46.2137.67 41.24 50.85 52.50 45.94 31.42 32.250.70 0.71 0.73 0.73 0.72 0.70 0.68
54.047 58.112 69.714 71.767 64.081 45.137 47.22144.70 48.38 59.41 61.74 54.62 37.04 39.694.99 5.09 5.22 4.97 3.34 1.88 1.453.35 3.92 4.46 4.42 5.12 5.22 5.461.00 0.73 0.64 0.63 1.00 0.99 0.62
-‐-‐-‐ -‐-‐-‐ -‐-‐-‐ -‐-‐-‐ -‐-‐-‐ -‐-‐-‐ -‐-‐-‐-‐-‐-‐ -‐-‐-‐ -‐-‐-‐ -‐-‐-‐ -‐-‐-‐ -‐-‐-‐ -‐-‐-‐-‐-‐-‐ -‐-‐-‐ -‐-‐-‐ -‐-‐-‐ -‐-‐-‐ -‐-‐-‐ -‐-‐-‐
176.79 196.12 226.45 262.60 314.76 275.38 262.421988 1989 1990 1991 1992 1993 1994169.86 199.18 224.55 252.71 237.65 207.21 221.54153.80 182.25 205.87 225.80 216.12 197.82 211.3916.06 16.93 18.69 26.91 21.53 9.39 10.15
185.00 212.37 237.66 218.94 207.58 203.25 213.690.70 0.71 0.73 0.73 0.72 0.70 0.68
265.43 299.25 325.84 299.30 289.53 292.00 312.86238.67 268.82 290.83 259.82 255.90 261.42 283.0469.67 77.58 70.76 20.54 10.69 11.73 21.13169.00 191.25 220.07 239.28 245.22 249.69 261.91
1.71 1.49 1.26 0.40 0.45 0.44 0.736.00 6.04 7.12 7.77 6.84 6.89 4.14
19.05 22.90 26.63 31.32 26.34 23.25 24.9599.84 113.04 132.45 144.34 131.78 132.55 134.220.70 0.71 0.73 0.73 0.72 0.70 0.68
143.25 159.28 181.59 197.31 183.81 190.43 196.51143.25 159.28 181.59 197.31 183.81 190.43 196.51454.70 524.58 594.66 615.99 577.00 543.02 569.45
-277.91 -328.46 -368.21 -353.39 -262.24 -267.64 -307.03
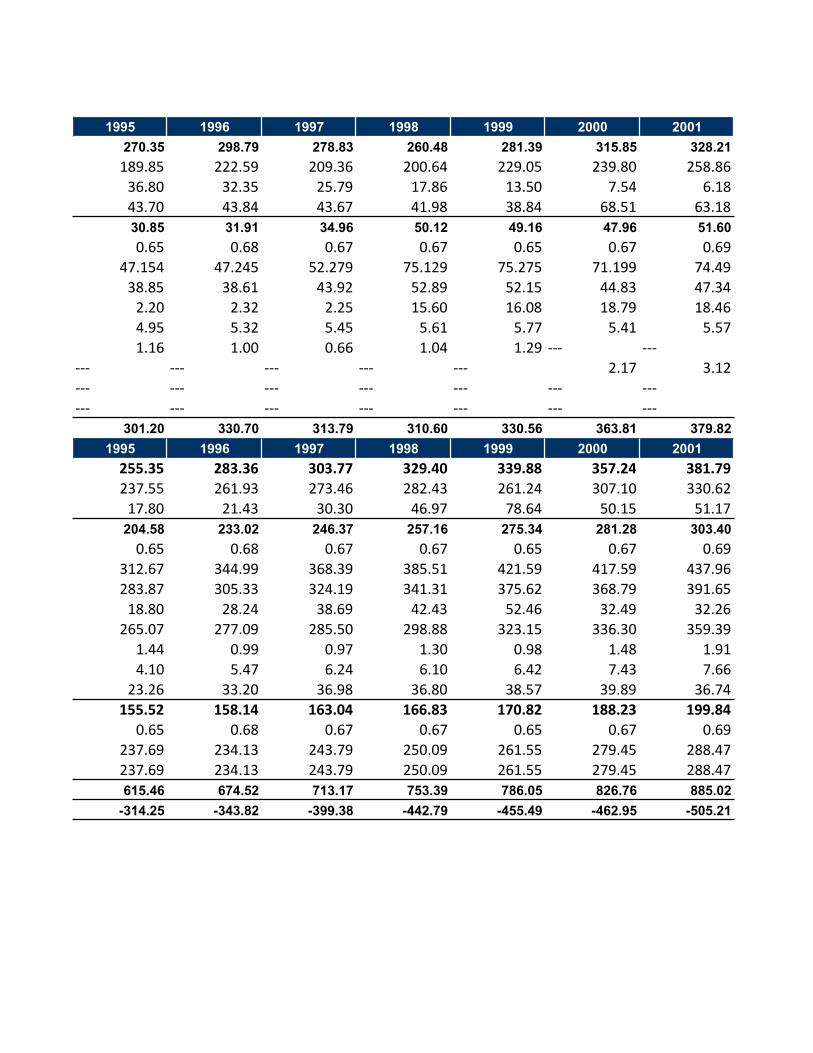
1995 1996 1997 1998 1999 2000 2001270.35 298.79 278.83 260.48 281.39 315.85 328.21189.85 222.59 209.36 200.64 229.05 239.80 258.8636.80 32.35 25.79 17.86 13.50 7.54 6.1843.70 43.84 43.67 41.98 38.84 68.51 63.1830.85 31.91 34.96 50.12 49.16 47.96 51.600.65 0.68 0.67 0.67 0.65 0.67 0.69
47.154 47.245 52.279 75.129 75.275 71.199 74.4938.85 38.61 43.92 52.89 52.15 44.83 47.342.20 2.32 2.25 15.60 16.08 18.79 18.464.95 5.32 5.45 5.61 5.77 5.41 5.571.16 1.00 0.66 1.04 1.29 -‐-‐-‐ -‐-‐-‐
-‐-‐-‐ -‐-‐-‐ -‐-‐-‐ -‐-‐-‐ -‐-‐-‐ 2.17 3.12-‐-‐-‐ -‐-‐-‐ -‐-‐-‐ -‐-‐-‐ -‐-‐-‐ -‐-‐-‐ -‐-‐-‐-‐-‐-‐ -‐-‐-‐ -‐-‐-‐ -‐-‐-‐ -‐-‐-‐ -‐-‐-‐ -‐-‐-‐
301.20 330.70 313.79 310.60 330.56 363.81 379.821995 1996 1997 1998 1999 2000 2001255.35 283.36 303.77 329.40 339.88 357.24 381.79237.55 261.93 273.46 282.43 261.24 307.10 330.6217.80 21.43 30.30 46.97 78.64 50.15 51.17
204.58 233.02 246.37 257.16 275.34 281.28 303.400.65 0.68 0.67 0.67 0.65 0.67 0.69
312.67 344.99 368.39 385.51 421.59 417.59 437.96283.87 305.33 324.19 341.31 375.62 368.79 391.6518.80 28.24 38.69 42.43 52.46 32.49 32.26265.07 277.09 285.50 298.88 323.15 336.30 359.39
1.44 0.99 0.97 1.30 0.98 1.48 1.914.10 5.47 6.24 6.10 6.42 7.43 7.66
23.26 33.20 36.98 36.80 38.57 39.89 36.74155.52 158.14 163.04 166.83 170.82 188.23 199.84
0.65 0.68 0.67 0.67 0.65 0.67 0.69237.69 234.13 243.79 250.09 261.55 279.45 288.47237.69 234.13 243.79 250.09 261.55 279.45 288.47615.46 674.52 713.17 753.39 786.05 826.76 885.02
-314.25 -343.82 -399.38 -442.79 -455.49 -462.95 -505.21
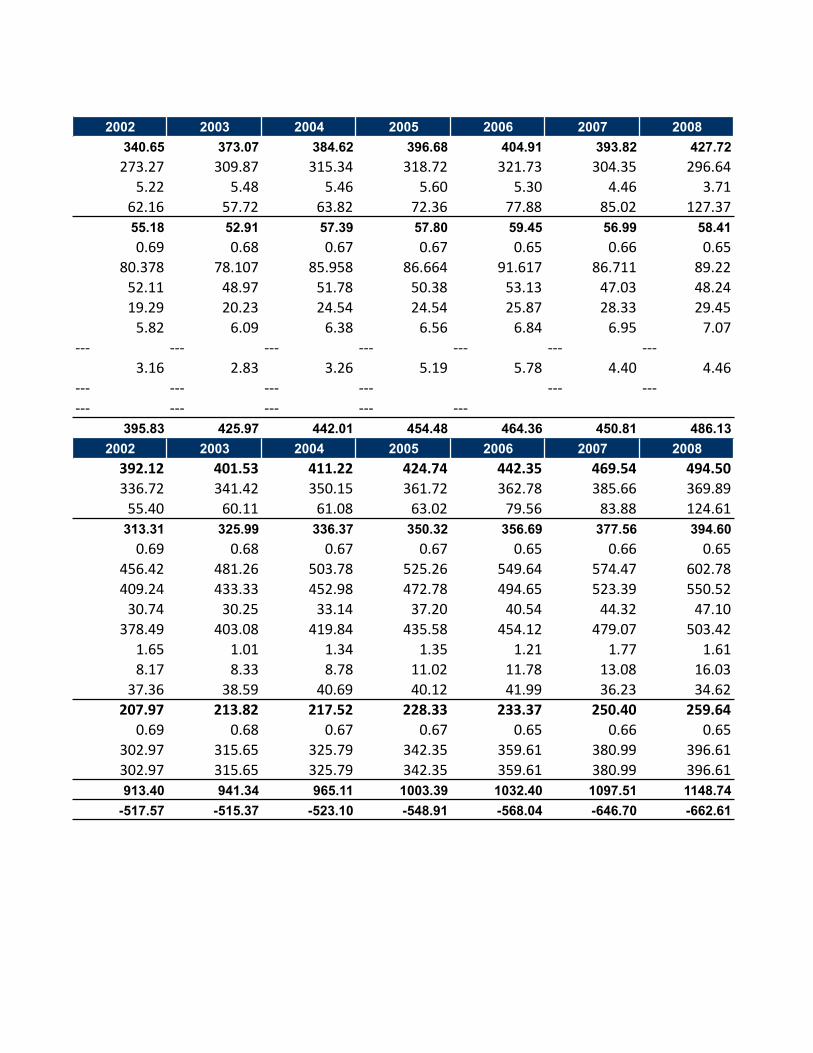
2002 2003 2004 2005 2006 2007 2008340.65 373.07 384.62 396.68 404.91 393.82 427.72273.27 309.87 315.34 318.72 321.73 304.35 296.64
5.22 5.48 5.46 5.60 5.30 4.46 3.7162.16 57.72 63.82 72.36 77.88 85.02 127.3755.18 52.91 57.39 57.80 59.45 56.99 58.410.69 0.68 0.67 0.67 0.65 0.66 0.65
80.378 78.107 85.958 86.664 91.617 86.711 89.2252.11 48.97 51.78 50.38 53.13 47.03 48.2419.29 20.23 24.54 24.54 25.87 28.33 29.455.82 6.09 6.38 6.56 6.84 6.95 7.07
-‐-‐-‐ -‐-‐-‐ -‐-‐-‐ -‐-‐-‐ -‐-‐-‐ -‐-‐-‐ -‐-‐-‐3.16 2.83 3.26 5.19 5.78 4.40 4.46
-‐-‐-‐ -‐-‐-‐ -‐-‐-‐ -‐-‐-‐ -‐-‐-‐ -‐-‐-‐-‐-‐-‐ -‐-‐-‐ -‐-‐-‐ -‐-‐-‐ -‐-‐-‐
395.83 425.97 442.01 454.48 464.36 450.81 486.132002 2003 2004 2005 2006 2007 2008392.12 401.53 411.22 424.74 442.35 469.54 494.50336.72 341.42 350.15 361.72 362.78 385.66 369.8955.40 60.11 61.08 63.02 79.56 83.88 124.61
313.31 325.99 336.37 350.32 356.69 377.56 394.600.69 0.68 0.67 0.67 0.65 0.66 0.65
456.42 481.26 503.78 525.26 549.64 574.47 602.78409.24 433.33 452.98 472.78 494.65 523.39 550.5230.74 30.25 33.14 37.20 40.54 44.32 47.10378.49 403.08 419.84 435.58 454.12 479.07 503.42
1.65 1.01 1.34 1.35 1.21 1.77 1.618.17 8.33 8.78 11.02 11.78 13.08 16.03
37.36 38.59 40.69 40.12 41.99 36.23 34.62207.97 213.82 217.52 228.33 233.37 250.40 259.64
0.69 0.68 0.67 0.67 0.65 0.66 0.65302.97 315.65 325.79 342.35 359.61 380.99 396.61302.97 315.65 325.79 342.35 359.61 380.99 396.61913.40 941.34 965.11 1003.39 1032.40 1097.51 1148.74
-517.57 -515.37 -523.10 -548.91 -568.04 -646.70 -662.61

2009 2010 2011 2012397.73 400.69 388.52 401.84306.26 303.67 297.20 304.92
4.42 4.22 3.59 3.5087.05 92.80 87.73 93.4266.06 67.52 66.16 67.260.67 0.65 0.64 0.65
98.158 103.757 103.234 103.3553.87 57.20 56.41 54.2232.37 33.85 33.53 35.607.37 8.39 8.90 9.23
-‐-‐-‐ -‐-‐-‐ -‐-‐-‐ -‐-‐-‐4.54 4.32 4.39 4.31
-‐-‐-‐ -‐-‐-‐ -‐-‐-‐ -‐-‐-‐
463.79 468.21 454.68 469.102009 2010 2011 2012476.20 486.54 509.45 527.71353.61 379.03 354.11 367.68122.59 107.51 155.34 160.03406.32 403.34 408.16 431.630.67 0.65 0.64 0.65
603.74 619.77 636.85 663.19551.09 565.45 582.86 608.4039.94 42.60 44.64 46.00511.15 522.85 538.23 562.41
1.99 1.42 1.75 1.8016.38 16.40 15.72 15.6034.29 36.51 36.51 37.38
270.58 279.71 279.84 285.780.67 0.65 0.64 0.65
402.04 429.80 436.64 439.10402.04 429.80 436.64 439.101153.10 1169.59 1197.45 1245.12-689.31 -701.38 -742.77 -776.01