a historical perspective to revenue performance in kenya · a historical perspective to revenue...
TRANSCRIPT

Uphold Public Interest
A Historical Perspective to Revenue Performance in Kenya
KENYA’S REVENUE ANALYSIS
2010-2015

The Institute of Certified Public Accountants of KenyaCPA Centre, Ruaraka, Thika Road P. O. Box 59963 - 00200 Nairobi Kenya
Telephone : +254 (020) 2304226, 2304227 Fax : +254 (020) 8562206Mobile : +254 727 531006 / 733 856262 / 721 469796 / 721 469169
Email: [email protected] Website: www.icpak.com
Copyright ©ICPAK 2016
ISBN No. 978-9966-1808-2-7
All rights reserved. No part of this publication may be reproduced, stored in a retrieval system, or transmitted in any form, or by any means, electronic, mechanical, photocopying,
recording, scanning or otherwise, without prior permission in writing of the Institute.
Kenya’s Revenue Analysis Report iii
KENYA’S REVENUE ANALYSIS
2010 -2015

Kenya’s Revenue Analysis Reportiv
Kenya’s Revenue Analysis Report i
CONTENTSLIST OF TABLES........................................................................................................................ii
LIST OF FIGURES.....................................................................................................................iii
LIST OF EQUATIONS...............................................................................................................iii
PREFACE .................................................................................................................................iv
ACKNOWLEDGMENT ..............................................................................................................v
ABBREVIATIONS.....................................................................................................................vi
EXECUTIVE SUMMARY ...........................................................................................................1
BACKGROUND ........................................................................................................................2
1.1 FISCAL POLICY AND ECONOMIC GROWTH IN KENYA...........................................................3
1.2 HISTORY OF TAX REFORMS IN KENYA..........................................................................................4
1.3 TAX EFFICIENCY IN KENYA...............................................................................................................6
1.4 GLOBAL DEVELOPMENTS IN DESIGNING A TAXATION REGIME..........................................7
OBJECTIVES OF THE STUDY (REVENUE ANALYSIS)...............................................................8
SCOPE OF STUDY.....................................................................................................................8
JUSTIFICATION FOR THE STUDY.............................................................................................9
METHODOLOGY.....................................................................................................................10
2.1 TAX REVENUE TO GDP RATIO........................................................................................................11
2.2 GROWTH RATE..................................................................................................................................11
2.3 TAX BUOYANCY.................................................................................................................................12
RESEARCH FINDINGS............................................................................................................14
3.1 OVERAL REVENUE PERFORMANCE 2010-2015......................................................................14
Kenya’s Revenue Analysis Reportii
3.2 REVENUE GROWTH AND GDP.....................................................................................................16
3.3 KENYA’S REVENUE PORTFOLIO....................................................................................................17
3.4 REVENUE GROWTH........................................................................................................................18
3.5 TAX REVENUE TO GDP RATIO ......................................................................................................19
3.6 KENYA’S TAX REVENUE PERFORMANCE.....................................................................................20
3.6.1 INCOME TAX......................................................................................................................................21
3.6.2 VAT.......................................................................................................................................................22
3.6.3 CUSTOMS & EXCISE DUTY............................................................................................................24
3.6.4 APPROPRIATIONS IN AID..............................................................................................................26
3.7 KENYA’S TAX EFFICIENCY..............................................................................................................27
3.7.1 PAYE AND OTHER INCOME...........................................................................................................27
3.7.2 IMPORT DUTY & EXCISE................................................................................................................28
3.7.3 BUOYANCY OF VAT.........................................................................................................................28
3.8 REVENUE FORECASTS .......................................................................................................................28
CONCLUSION.........................................................................................................................30
RECOMMENDATIONS............................................................................................................31
DIRECT TAXES...............................................................................................................................................31
INDIRECT TAXES...........................................................................................................................................33
PLANNING FOR PUBLIC EXPENDITURE IN LIGHT OF REVENUE GENERATION CAPABILITIES...............35
REVENUE FORECASTING...........................................................................................................................36
BIBLIOGRAPHY......................................................................................................................37

Kenya’s Revenue Analysis Report iii
L I S T O F TA B L E STable 1: Revenue Table...............................................................................................................................14
Table 2 : Tax Buoyancy Table....................................................................................................................27
L I S T O F F I G U R E SFigure 1: GDP to Tax Revenue..................................................................................................................16
Figure 2: Revenue Performance..............................................................................................................17
Figure 3: Revenue Growth........................................................................................................................18
Figure 4: Tax Revenue to GDP Ratio.......................................................................................................19
Figure 5: Tax Revenue Trends (2010-2015)............................................................................................20
Figure 6: Income Tax Trend.......................................................................................................................21
Figure 7: VAT Trend......................................................................................................................................23
Figure 8: Proportion of Tax Revenue Trend.........................................................................................23
Figure 9: Excise & Customs Trend...........................................................................................................24
Figure 10 : Excise Revenue Chart............................................................................................................25
Figure 11: Appropriation In Aid...............................................................................................................26
Figure 12 : Tax Buoyancy Chart.............................................................................................................29
L I S T O F E Q UAT I O N SEquation 1: Tax-to-GDP ratio....................................................................................................................11
Equation 2: Growth Rate............................................................................................................................11
Equation 3: Tax Buoyancy..........................................................................................................................13

Kenya’s Revenue Analysis Reportiv
P R E FAC E
The Institute of Certified Public Accountants of Kenya (ICPAK) is a statutory body of accountants
with the mandate to develop and regulate the accountancy profession in Kenya. The Institute is
further mandated under Sec 8 of the Accountants’ Act of 2008 to advise the Cabinet Secretary for
Finance on matters relating to governance and accountability in all sectors of the economy.
As Kenya’s budget continues to grow in trillions of shillings, there is need to put up a healthy fiscal
management system that ensures stable revenues over time, improves equity and efficiency of taxes
and, promotes investment towards economic growth and increased national income.
This report provides a timely presentation of a trend analysis of revenue growth as well as tax revenue
yield over the past five years in a bid to inform budget planning and monitoring processes in Kenya. It
highlights the growing variance between revenue targets and actual exchequer collections which has
been occasioned by among others, substantial increases in public expenditure which has led to exerting
commensurate pressure on the revenue targets.
The report affords recommendations critical in informing policy makers on the appropriate revenue
raising mechanisms to implement to ensure the country meets its revenue projections. It recommends
the adoption of the following among other measures to boost the country’s revenue raising capability;
reforming the regime on direct taxes through the implementation of means tested tax incentives
and a review of the Income brackets, shifting revenue reliance away from direct taxes, addressing the
progressivity of VAT through the application of a graduated approach to VAT and planning for public
expenditure in light of revenue generation capabilities.
We further observe that tax payer compliance is critical to achieving and meeting the revenue targets.
However, the same is strongly influenced by the perception of where the tax payer’s resources are being
applied. We are of the opinion that proper utilization of revenue generated from the taxpayers will
inevitably raise the tax compliance rate in the country. We trust that going forward, as a country, we shall
cut our deficit financing and provide financial oversight to ensure that wastage and poor management
of public resources is met with accountability for these actions.
FCPA Fernandes Barasa
Chairman- ICPAK

Kenya’s Revenue Analysis Report v
AC K N OW L E D G M E N TThis Report was prepared by the Public Policy and Governance team led by CPA Fredrick Riaga, CPA
Georgina Malombe, Hillary Onami, Naomi Rono and Elias Wakhisi and was edited by CPA Nixon Omindi.
The team received professional guidance from the Public Finance and Tax Workstream led by CPA Philip
Muema and the Public Policy and Governance Committee led by FCPA John Mudany and FCPA Julius
Mwatu. Grateful to the key tax practitioners and professionals including CPA Rajesh Shah, CPA Robert
Waruiru, CPA Ednah Gitachu, CPA Francis Kamau, CPA Maurice Oray, CPA Wycliff Kibisu, FCPA Erastus
Kwaka, CPA Michael Mburugu and CPA Joash Kosiba for their profound insights.
We acknowledge the significant contributions from the National Treasury, the Parliamentary Budget
Office and the Kenya Revenue Authority towards the review and validation of this report. We express
our gratitude to Dr. Geoffrey Mwau-Director General, Budget, Fiscal and Economic affairs, Mr. Joseline
Ogai of KRA, Mr. John Njera, Ms. Geraldine Kyalo and Mr. Cromwel Pkomu all of National Treasury for
their input.
This report would not have been possible without the efforts of many others including the entire
Institute’s Council, Committees and Secretariat, the editor, designers and printers to mention but a few,
who in one way or another contributed in ways and means to the success of this report.
Receive our sincere gratitude.
CPA Dr. Patrick Ngumi, (PhD)
Chief Executive- ICPAK
Kenya’s Revenue Analysis Reportvi
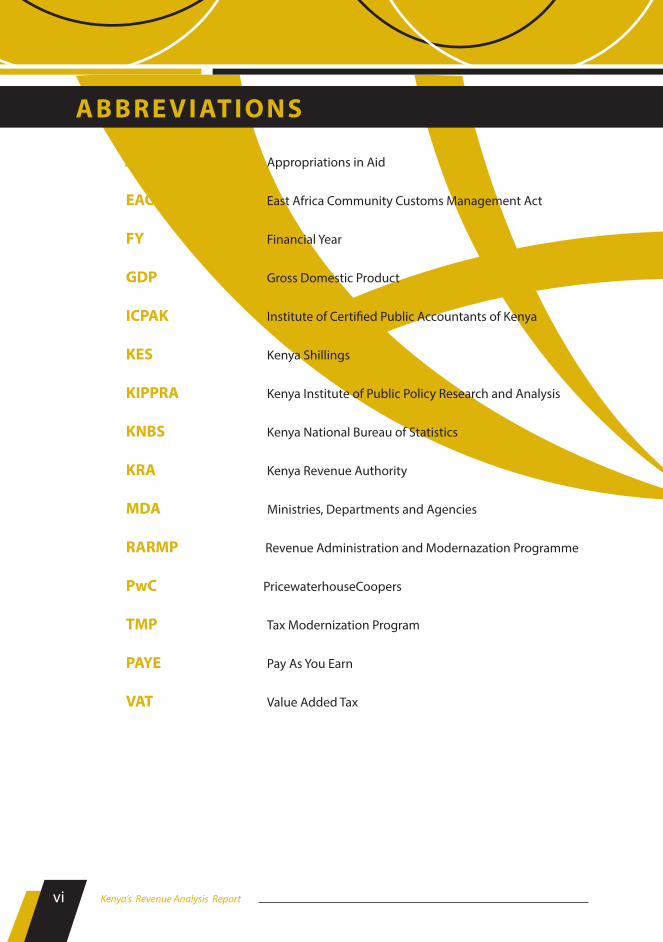
A B B R E V I AT I O N S
AIA Appropriations in Aid
EACCMA East Africa Community Customs Management Act
FY Financial Year
GDP Gross Domestic Product
ICPAK Institute of Certified Public Accountants of Kenya
KES Kenya Shillings
KIPPRA Kenya Institute of Public Policy Research and Analysis
KNBS Kenya National Bureau of Statistics
KRA Kenya Revenue Authority
MDA Ministries, Departments and Agencies
RARMP Revenue Administration and Modernazation Programme
PwC PricewaterhouseCoopers
TMP Tax Modernization Program
PAYE Pay As You Earn
VAT Value Added Tax
Kenya’s Revenue Analysis Report 1
E X E C U T I V E S U M MA RYThis paper gives a five-year historical analysis of revenue performance in Kenya. It aims to inform budget
planning and monitoring processes in Kenya by ensuring a balanced budget. It is premised on the
fact that a good fiscal management system ensures stable revenues over time, improves equity and
efficiency of taxes and, promotes investment towards economic growth and increased national income.
The study focused on Kenya’s annual revenue performance between the financial years 2010/11 to
2014/15. It considered in greater detail, the performance of tax revenues being the largest contributor to
the revenue portfolio, in order to establish performance trends for the specific taxes, identify strengths
and weaknesses in the country’s revenue generation, collection and administration capabilities. It
describes the year on year behaviour of the main taxes with a view to analyse the performance of each
category of tax for the FY 2010/11 through to 2015/16.
The report begins with a brief description of Kenya’s revenue portfolio and an assessment of how the
total amount of revenue rose in Kenya, both tax and non-tax revenue. It then provides an overview of
the contribution made by each tax to the total. In the subsequent sections, it analyses the behaviour of
each of the main taxes, that is, Income Tax, Valued Added Tax, Excise Duty, Customs duty, between the
years 2010-2015.
It also provides an analysis of the current system in the context of tax reforms and policy changes that
have been implemented during the period of study in order to evaluate the impact of these policy
initiatives on the overall revenue performance of the Country. Performance is said to be satisfactory if
the given revenue sources provide increasing revenue year after year. It also depends on how best the
potential revenue bases have been tapped through a country’s effort to raise revenue.
The study utilised three indicators in its analysis to evaluate the revenue performance between the fiscal
years 2010/11-2014/15. From the analysis, it was observed that Kenya’s revenue portfolio is significantly
driven by tax revenue and that the primary contributor to tax revenue is income tax. This indicated
that direct taxes still drove the tax revenue structure of the country and hence efforts should be made
to diversify the sources and increase the tax bases. The analysis of the performance of various taxes
indicated that overly, there has been an increase in collection of taxes in the country. The analysis also
observed that taxes from AIA have been on a downward trend, a finding that has been observed by the
Controller of Budget in her reports, which identified poor reporting of revenues generated from AIA’s by
Government MDAs.
Kenya’s Revenue Analysis Report2
BAC KG RO U N DTaxation is the largest source of government revenue in Kenya. Marina et al. (2002) contends that,
taxation is the only known practical manner for collecting resources in order to finance public
expenditure for goods and services consumed by the public. However, non-tax revenue, also plays
a significant role in funding sustainable public budgets.
As the significant source of revenue, a sound tax system is one that exhibits the qualities to raise
essential revenue to deter excessive government borrowing, and in a manner that does not
introduce economic imbalances. A country’s revenue performance is considered satisfactory on
a given measuring scale if the available revenue sources provide increasing revenue year after
year. The sources should also be income elastic with reference to their base and should generate
commensurate revenues to fund the government’s expenditure plans.
A good fiscal management system ensures that there are stable revenues over time. Tax analysis
and revenue forecasting have therefore become increasingly important functions as governments
undertake to reform their tax and budget systems in order to enhance tax revenue, improve equity
and efficiency of taxes, and promote investment and consequently economic growth with a view to
increasing the national income. It is widely recognised that fiscal policy stability is key in promoting
both domestic and foreign private-sector investment.
Understanding revenue forecasting practices is essential to budget planning and monitoring
processes. Revenue forecasts define the resource envelope and forms the basis for effective
medium-term planning. They serve as the principal resource constraint and, if integrated in a top-
down budget preparation process facilitate allocation of resources across different priority sectors.
To ensure a balanced budget and or to curtail deficit financing, it is important for the National
Treasury to effectively monitor not only the expenditure side but also the collection of tax revenues
on a regular basis. It has been observed that although Kenya’s GDP has been growing at almost
the same rate over the years, there has been limited policy intervention to expand the tax base
particularly, in formalising the incomes earned from the informal sector to facilitate the collection
of taxes. Further, the growth of tax revenue however falls short of the ever ambitious growth in
public expenditure. To strike a balance, the National Treasury has resorted to debt financing leading
to the accumulation of national debt, projected to rise to KES 2.9 trillion by end of 2015.
Kenya’s Revenue Analysis Report 3
1.1 FISCAL POLICY AND ECONOMIC GROW TH IN KENYA Economic theory tells us that the nature of the tax regime can harm or foster growth. A
regime that causes distortions to private agents’ investment incentives can retard investment
and economic growth. Analogously, if a tax regime is such that it leads to internalization of
externalities by private agents, it may induce efficiency in resource allocation and thus foster
investment and growth of the economy. The same applies to the nature of government
expenditure: excessive spending on consumption at the expense of investment is likely to
deter growth and vice versa.
Kenya has had mixed economic performance since its independence in 1963. During the
first decade of independence, the performance of the Kenyan economy was impressive.
The growth of real GDP averaged 6.6% per year over the period 1964 –1973, and compared
favourably with some of the Newly Industrialized Countries (NICs) of East Asia. This remarkable
performance was attributed to consistency of economic policy, promotion of smallholder
agricultural farming, high domestic demand, and expansion of market for domestic output
within the East African region. The second decade marked the end of easy growth options
and the emergence of powerful external shocks which, together with imprudent fiscal and
monetary management, ushered in an era of slow and persistent economic decline with
average real GDP falling to 5.2% over the period.
In the third decade, the effects of expansionary fiscal policy of the previous decade, which led
to the establishment of highly protected but grossly inefficient private industries and state
corporations began to cause serious strain on the economy’s scarce resources. Budget deficits
increased rapidly, exports and imports fell, and the economy performed poorly with average
real GDP falling further to 4.2% over the period. The downward spiral continued in the fourth
decade of independence. A combination of poor fiscal and monetary policy regime, external
and internal shocks as well as political events resulted in the worst economic performance in
the short history of the country. The average real GDP fell to a low of 2.2% between 1990 and
2002, (M’Amanja & Morrissey, 2005).
The biggest effect of the variations, have been variations in the tax revenue. To address these
variations, there have been initiatives to modernize the Kenyan tax system since 1986. One of
the key objectives of the modernization programme was to ensure that the revenue structure
was flexible enough to guarantee increased revenues during the growth process without the
Kenya’s Revenue Analysis Report4
necessity of resorting to discretionary policy or inflationary financing. For the tax policy to
mitigate the dangers of perpetual fiscal imbalances, it is expected that tax revenue will grow
faster than national income, (Muriithi & Moyi, 2003).
It is important to mention that in the fifth decade, specifically the year 2014, Kenya earned its
place in the top 10 economies in Africa, however, a large percentage of the population are still
living in extreme poverty. This may come as a surprise following the rebasing of the economy
that saw a 25.3 % increase in the country’s economic size, reflected in the increase of estimated
Gross Domestic Product (GDP) from US $ 44.1 billion to US $55.2 billion. GDP rebasing involves
replacing old base year volume and price measures to more recent base year, in this case year
2001 to 2009, in order to reflect more accurate realities of an economy. This resulted in the
elevation of Kenya’s World Bank economic status from a low income economy, to a middle
income economy with a per capita GDP of US $1,246. The rebasing of the economy also
saw Information and Communication Technology (ICT) sectors established as a standalone
sector, informed by the highly productive telecoms industry that birthed mobile payments
technology, placing Kenya at the frontier of innovation. This increase in the national income
had an effect on the tax revenue to GDP ratio.
1.2 HISTORY OF TAX REFORMS IN KENYARevenue mobilization was not a challenge for the government in the first decade of
independence until the energy crisis of 1970 which necessitated tax reforms to mobilize more
revenue (KIPPRA, 2006). One of the key reforms during this era was the adoption of the Income
Tax Act, Cap 470 in 1973 (AFDB, 2010). Since then, there have been three distinct phases of
tax reform measures. According to a study by African Development Bank Group (AFDB, 2010),
the initial measures were aimed at widening the tax base by way of introducing the sales tax
in 1973 and the capital gains tax in 1975. These were reactive strategies aimed at mitigating
the decline in duty revenues brought about by the imports substitution and industrialization
policies.
Subsequently in the third decade, additional tax reforms were instituted. The World Bank study
of 1985 on Kenya’s economic policy led to drafting of Sessional Paper No. 1 of 1986. Under the
theme – Economic Management for Renewed Growth – the Sessional Paper underscored the
necessity to boost local revenue to fund economic development.

Kenya’s Revenue Analysis Report 5
In the period 1986 and 2002, through policy framework on Tax Modernization Programme
(TMP), there was an effort to entrench tax reforms by: improving revenue raising capacity from
22 to 28 % of GDP, improving economic efficiency of the tax system through lowering and
rationalization of tax rates, enhancing greater reliance on self-assessment system supported
by selective tax audits, improving administrative efficiency through computerization, and
lastly address constraints in existing tax structures as well as overreliance on direct taxes
(KIPPRA, 2006).
The formation of Kenya Revenue Authority (KRA), initially articulated in the TMP, through
the KRA Act (Chapter 469 of the Laws of Kenya) overhauled the legislative framework that
existed since independence. The KRA was expected to improve tax administration and
implement organisational reforms that would improve tax administration. The focus of KRA’s
administrative reforms in the first 10 years of its existence centred on achieving rationalization
and stabilization of its organisational structure and general administrative systems (Cheeseman
& Griffiths, 2005).
Faced with the challenges posed by manual processes, KRA in its second corporate plan
recommended a strategy to address the identified challenges due to manual system of
operation through the Revenue Administration Reform and Modernization Programme
(RARMP) which commenced in 2004/05. The goal was to transform KRA into a modern fully
integrated and client focused tax administration unit. Key initiatives introduced with the
RARMP were; the Integrated Tax Management Systems (ITMS) for domestic revenue that
initiated the E registration, Electronic Tax Registers (ETR’s) to be used by VAT registered tax
payers (introduced in January 2005) and the Simba 2005 System (S2005S) to automate over
90% of customs operations (Ochieng, Wawire, Manyasa, & Thuku, 2014).
According to Muriithi & Moyi, (2003), tax reforms indeed had a positive impact on overall
tax yield, even though the impact of the reforms was not always uniform. The reforms had
a bigger impact on direct taxes than on indirect taxes, suggesting that revenue leakage was
still a major problem for indirect taxes. The better responsiveness of direct taxes could then be
attributed to the relative effectiveness of the reforms in direct taxes, which not only made the
tax system simpler but also reduced avenues for evasion and corruption.
Kenya’s Revenue Analysis Report6
The analysis of revenue performance in Kenya needs to be evaluated alongside a clear
understanding of the reform path. The historical successes and failures are sources of valuable
lessons to inform the policy initiatives applied to strengthen the fiscal capability in the country.
1.3 TAX EFFICIENCY IN KENYA
Tax efficiency in Kenya, has been a subject
that has attracted significant discussion
among policy makers. According to Okech &
Mburu (2011), the efficiency of a tax system
was determined by applying the concepts of
tax buoyancy and elasticity. The differences
between tax elasticity and buoyancy is
that tax elasticity measures the built-in response of revenues to changes in income, while
tax buoyancy quantifies the total change in revenue accompanying changes in income. This
implies that tax elasticity corrects revenue data for changes in tax policy parameters. The
study carried out by Okech & Mburu (2011) noted that the Kenya tax system is neither income
elastic nor buoyant supporting earlier findings by Moyi and Ronge (2006) and Muriithi and
Moyi (2003). Whereas Moyi and Muriithi (2006) found buoyancy as being 0.662, Muriithi and
Moyi (2003) found elasticity of tax system to be 0.645.
Additionally, the study affirmed that all major tax components in the country are inelastic.
Income tax and excise tax had unit buoyancies below 1, over the study period contradicting
Muriithi and Moyi (2003) who found the two taxes to have had buoyancies of above 1. The
analysis proposed that the variance in buoyancies could be explained by the various tax
reforms that were introduced after the study by Murrithi and Moyi (2003) including the
introduction of ETR facility, Simba system among others. Further, from the study, import duty
was the most buoyant tax component while the VAT was the least buoyant.
Major tax components were found to be inelastic based on tax-to-base inelastic however,
import duty, excise duty and VAT had base-to-income elasticity of above 1, while income
tax had approximately unity base-to-income elasticity. The study therefore concluded that
a large percentage of tax revenue comes from discretionary tax policy and not from pure
responsiveness of tax revenue to changes in national income. The study empirically affirms
Kenya is yet to achieve this characteristic of a good tax system.

Kenya’s Revenue Analysis Report 7
1.4 GLOBAL DEVELOPMENTS IN DESIGNING A TAXATION REGIMEIn recent years, discussions on the ideal structure for a tax system, has been the subject of
debate among fiscal policy professionals. The key question among government policy makers
has been, ‘should rates of taxes tied to consumption be reduced to help taxpayers by increasing
disposable income or increased to generate the much-needed tax revenues?’ (PwC, 2013). In the
European Union (EU), most of the ten states that became EU members in May 2004 rely more
on a value-added tax than on a corporate income tax. In Germany, the Tax Reform Act 2008
reduced the overall corporate tax rate from about 40 to about 30 percent, while simultaneously
raising the value-added tax rate from 16 to 19 percent, thereby increasing the importance of
indirect taxes in the overall tax system. The United States Congress also debated the Fair Tax
Act of 2007, which proposed to repeal the income tax and other current federal taxes, such as
the estate and gift tax, and implement a national sales tax instead.
The push to generate tax revenues is driven by growing pressure on public budgets in a tough
economic climate, and the need to reduce government deficits. Electronic tax filing and
payments were the most common tax reforms undertaken by countries worldwide during
the past year, according to the latest edition of the Paying Taxes Report from the World Bank
Group and PwC (PwC, 2015). Economies which have invested in online filing and payment
infrastructure are reaping a digital dividend from these systems.
The growth of globalization has also had strong implications on the taxation regime applied
in various countries. This has been attributed to the operations of multinational corporations
operating in those countries. A large source of missed revenue is related to the mis-pricing
of goods and services that are transferred
within the multinational corporation,
among the subsidiaries primarily with
the aim of transferring out profits to low
tax jurisdictions. Several economies are
therefore adopting rules of transfer pricing
in order to safeguard from income shifting
that would affect the overall revenue
performance of the country (Godin &
Hindriks, 2015).
Kenya’s Revenue Analysis Report8
O B J E C T I V E S O F T H E S T U DY In line with its mandate to advise of matters related to accountability, the Institute undertook
this analysis with the primary objective of using evidence to evaluate government’s fiscal
position in order to inform overall fiscal sustainability of the Country.
The specific objectives of the study were as follows;
a) To establish the trend of tax and non-tax revenue performance for FY 2010/2011 – FY
2014/2015.
b) To examine the strengths and weaknesses facing revenue raising capabilities in
Kenya.
c) To provide information and recommendations to aid revenue forecasting.
S CO P E O F S T U DY This revenue analysis took a historical approach to analyse the revenue performance of the
country and will focus on revenue data between the FY 2010/2011 until FY 2014/2015 in order
to assess the trends as well as tax revenue yield. It also focused on revenue collected by the
National government. It utilized performance indicators to assess tax and non-tax revenue
performance, with a view to providing valuable recommendations for revenue generation.
According to the Budget Policy Statement (BPS) 2016, the National Treasury reported the total
cumulative revenue, including Appropriations in Aid, amounting to KES 568.8 billion against a
target of 642.9 billion, implying a shortfall of 74.7 billion. The shortfall has lead policy makers
to question the approach used in forecasting national revenue to finance the annual budget.
The study will therefore assess the revenue targets against the actual revenue collected in
order to establish the trend and propose recommendations.
Due to the asymmetry in fiscal information, the analysis relied on revenue data provided by
the Kenya National Bureau of Statistics 2015 Statistical Abstract for the overall analysis of
revenue performance. The data provided in the statistical abstract further informed the choice
of a 5-year study period.
In analysing tax efficiency, the study also utilized quarterly revenue data provided by the KRA
for the FY 2005/2006 to FY 2014/2015.
Kenya’s Revenue Analysis Report 9
J U S T I F I C AT I O N F O R T H E S T U DYThe budget for the FY 2015/2016, the fifth (5th) annual budget under the Constitution of Kenya
2010, saw the release of a KES 2.2 Trillion budget figures. The sheer size of that budget has
occasioned discussions regarding the country’s capability to raise the revenue to fund the
expenditure plans given the level of the national debt book and; previous performances and
overall budget absorption capacity at both levels of government.
The debate on how realistic Kenya’s budgeting framework is has also ensued with the recorded
failure by the revenue collector, the Kenya Revenue Authority, to meet the revenue targets
for the FY 2014/15 and the first quarter of FY 2015/16. This notwithstanding, Government’s
ambition to roll out a significant number of infrastructural development has been poised to
compound the budget financing challenges.
These concerns, coupled with the revision of the World Banks growth forecasts in September
2015, should lead our policy makers to ponder on whether our economic statistical forecasts
are right. Given that Kenya’s revenue portfolio is highly driven by tax revenues, we pose to ask
in this study whether we have established an optimal revenue structure for maximum yield.
Through this analysis, we provide objective assessment of Kenya’s past revenue performance.
We anticipate that the outcomes of the analysis and the resulting information will be valuable
in the design, formulation and execution of sound fiscal and macroeconomic policies, as well
as budget planning for subsequent financial years.

Kenya’s Revenue Analysis Report10
M E T H O D O LO G YThe study conducted an extensive desk review to ascertain the gaps and inform the objects
of the study. The desk review analysed reports from various government departments and
entities, independent commissions, scholars and organisations on the respective subject
matter.
The study employed a multiplicative model to historical time series data, collected from the
KNBS statistical abstract 2015 and data provided by the KRA, in order to adjust for seasonality
and irregularity in the revenue data. The multiplicative model is used where seasonal variation
in the data increases over time. According to the quarterly data provided, this phenomenon is
witnessed in the revenue data, thus informing the selection of this model. While we recognize
that there are advanced techniques to deal with data irregularity lagged effects, the study
chose to apply the approach above in order to address the seasonal variation in the data.
The analysis also applied a Tax Buoyancy Model to evaluate the response of the individual taxes
to changes in National Income levels, in order to establish the productivity of the tax system.
Although the use of Tax Elasticity would have yielded more reliable results, this approach is
very demanding in terms of data requirements. Due to the limitation of information specific
to discretionary measures applied during the study period, the Institute chose to utilize the
Buoyancy indicator to measure responsiveness of tax.
In identifying the appropriate tax base for the buoyancy model, the study utilised GDP as
the tax base to establish the buoyancy on all taxes. While we recognise that using various
tax bases such as consumption, production and national income would have enhanced the
reliability of the results, due to the unavailability of quarterly data for the period 2005/2006 to
2014/2015, the Institute chose to utilise quarterly GDP as the overall tax base.
In summary, the analysis utilises the tax revenue to GDP ratio, the revenue growth rate and
the tax buoyancy rate to establish Kenya’s revenue performance and tax responsiveness over
the study period.
Kenya’s Revenue Analysis Report 11
2.1 TAX REVENUE TO GDP RATIOThis method attempts to ascertain whether the tax revenue of a government is increasing at
a rate higher than the rate of increase of the national income or GDP. Tax to GDP ratio or tax
revenue as a percentage of GDP is an indicator which provides some information necessary
to understand the government’s fiscal deficit that is if government is spending more and
receiving less than the overall deficit will rise on a year on year trajectory.
In developed economies, tax revenue increases significantly during an economic boom and
substantially reduces during recessions. The relationship is typically reflected by the following
response; when tax revenue increases and GDP does not, Tax-to-GDP ratio will increase, and
when Tax revenue decreases and GDP increase, Tax-to-GDP ratio will decrease.
This study uses this indicator to evaluate Kenya’s revenue performance in comparison with
other economies, namely; Nicaragua, Malaysia, South Africa, Sri Lanka, Sweden, Australia,
Rwanda and Senegal using the following equation:
Equation 1: Tax-to-GDP ratio
Tax-to-GDP ratio = Tax revenue / GDP of a country.
2.2 GROW TH RATEThe analysis utilized this method to assess the change in revenue over the past year as a
percentage relative to the base year. This method establishes the estimate of growth rate of
revenue over a period of time.
This estimate may be made with reference to the preceding year or with reference to the
preceding time period. When it is estimated with reference to the past year, it is calculated as
the percentage change over the year as follows;
Equation 2: Growth Rate
∆ R/R
Where;
∆ R -Represents the change in revenue collections over the past year
R - Represents revenue collections.

Kenya’s Revenue Analysis Report12
This method uses a ratio of change in revenue in the current year over the total revenue of the
past year and provides estimates for total revenue or for individual components of revenue.
However, its significance is limited in analysing the causal relationship that suggests which
variables have contributed to growth. This is especially true of variables such as price change,
tax effort, or variation in GDP that affect the growth rate (Purohit, 2005).
2.3 TAX BUOYANCYTax buoyancy estimates the revenue response with endogenized tax policy. Tax buoyancy
measures the total response of a tax to a change in income and shows the growth that result
from the automatic growth of the base, occasioned by an increase in the National Income or
GDP from discretionary tax changes. Unlike tax elasticity, the estimation of tax buoyancy does
not require that discretionary changes in tax policy be controlled.
It must be noted however, that where tax policy instruments are subject to change from time
to time, the elasticity of tax revenue may be difficult to estimate with considerable accuracy.
Elasticity would provide information necessary to understand the level of responsiveness of
tax revenue to discretionary measures; however, this approach relies on the completeness of
information necessary to isolate discretionary measures applied in the tax system. As such,
the estimation of tax elasticity requires an adjustment to the actual revenue series so as to
separate the growth of revenue arising from discretionary changes from that due to automatic
changes. (Belinga, et al., 2014)
The literature proposes four approaches namely; proportional adjustment, constant rate
structure, divisia index and econometric methods, in the adjustment of time series tax data
to eliminate the effects of discretionary tax measures. All the outlined approaches depend
heavily on the availability, nature and reliability of information on tax revenues.
Tax buoyancy on the other hand, measures the responsiveness of revenues including changes
in the tax system and its estimation does not require adjustments to the actual tax revenue.
In a tax environment like Kenya, which has experienced many changes in tax policies, it may
be difficult to identify and separate all discretionary tax policies that have been undertaken in
the country. In this context, where tax policy parameters are in a state of constant fluctuation,
the tax buoyancy provides an alternative approach to tax elasticity in evaluating tax revenue
performance.
Kenya’s Revenue Analysis Report 13
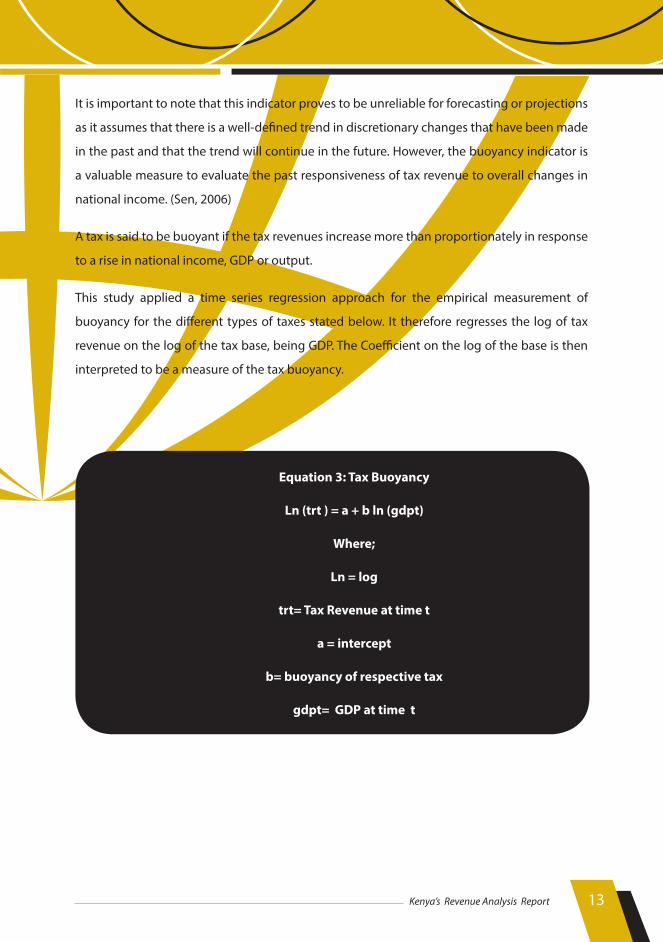
It is important to note that this indicator proves to be unreliable for forecasting or projections
as it assumes that there is a well-defined trend in discretionary changes that have been made
in the past and that the trend will continue in the future. However, the buoyancy indicator is
a valuable measure to evaluate the past responsiveness of tax revenue to overall changes in
national income. (Sen, 2006)
A tax is said to be buoyant if the tax revenues increase more than proportionately in response
to a rise in national income, GDP or output.
This study applied a time series regression approach for the empirical measurement of
buoyancy for the different types of taxes stated below. It therefore regresses the log of tax
revenue on the log of the tax base, being GDP. The Coefficient on the log of the base is then
interpreted to be a measure of the tax buoyancy.
Equation 3: Tax Buoyancy
Ln (trt ) = a + b ln (gdpt)
Where;
Ln = log
trt= Tax Revenue at time t
a = intercept
b= buoyancy of respective tax
gdpt= GDP at time t
Kenya’s Revenue Analysis Report14
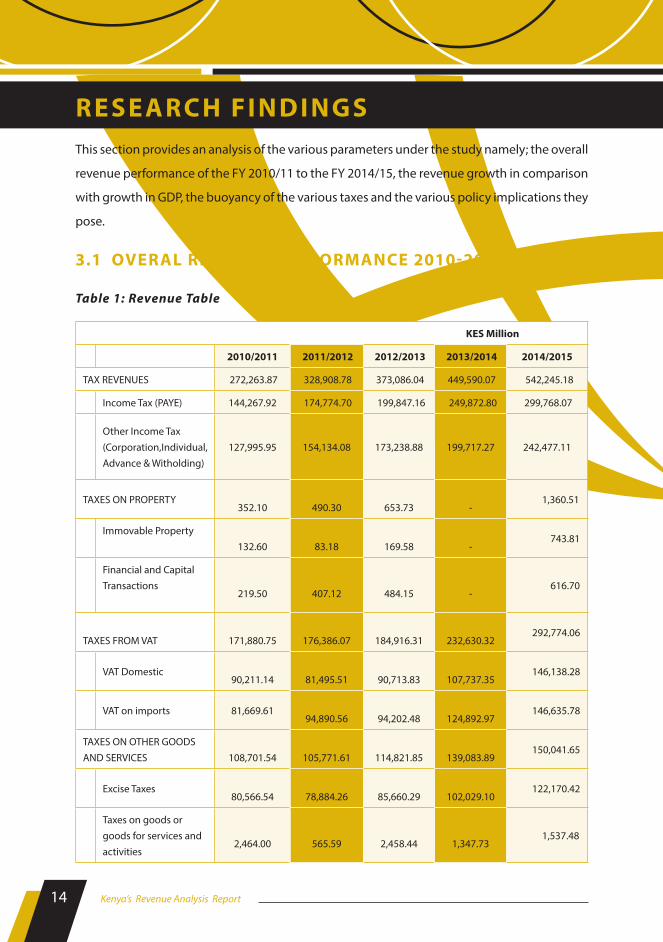
R E S E A RC H F I N D I N G SThis section provides an analysis of the various parameters under the study namely; the overall
revenue performance of the FY 2010/11 to the FY 2014/15, the revenue growth in comparison
with growth in GDP, the buoyancy of the various taxes and the various policy implications they
pose.
3.1 OVERAL REVENUE PERFORMANCE 2010-2015
Table 1: Revenue Table
KES Million
2010/2011 2011/2012 2012/2013 2013/2014 2014/2015
TAX REVENUES 272,263.87 328,908.78 373,086.04 449,590.07 542,245.18
Income Tax (PAYE) 144,267.92 174,774.70 199,847.16 249,872.80 299,768.07
Other Income Tax (Corporation,Individual,Advance & Witholding)
127,995.95 154,134.08 173,238.88 199,717.27 242,477.11
TAXES ON PROPERTY 352.10
490.30
653.73
-
1,360.51
Immovable Property 132.60
83.18
169.58
-
743.81
Financial and Capital Transactions
219.50
407.12
484.15
-
616.70
TAXES FROM VAT
171,880.75
176,386.07
184,916.31
232,630.32 292,774.06
VAT Domestic
90,211.14
81,495.51
90,713.83
107,737.35 146,138.28
VAT on imports 81,669.61
94,890.56
94,202.48
124,892.97 146,635.78
TAXES ON OTHER GOODS AND SERVICES
108,701.54
105,771.61
114,821.85
139,083.89
150,041.65
Excise Taxes
80,566.54
78,884.26
85,660.29
102,029.10 122,170.42
Taxes on goods or goods for services and activities
2,464.00
565.59
2,458.44
1,347.73
1,537.48
Kenya’s Revenue Analysis Report 15
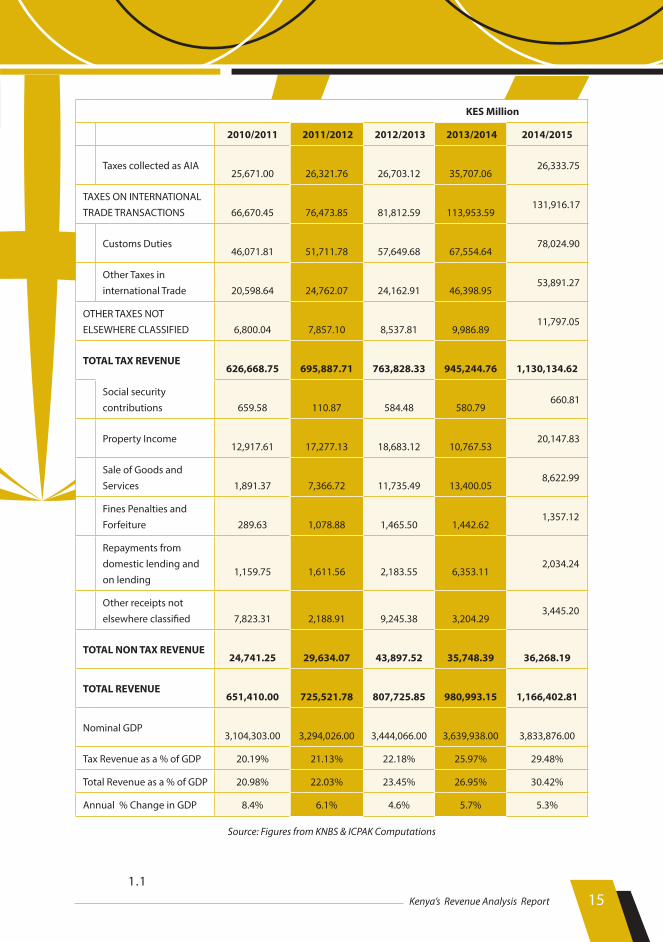
KES Million
2010/2011 2011/2012 2012/2013 2013/2014 2014/2015
Taxes collected as AIA
25,671.00
26,321.76
26,703.12
35,707.06 26,333.75
TAXES ON INTERNATIONAL TRADE TRANSACTIONS
66,670.45
76,473.85
81,812.59
113,953.59
131,916.17
Customs Duties
46,071.81
51,711.78
57,649.68
67,554.64 78,024.90
Other Taxes in international Trade
20,598.64
24,762.07
24,162.91
46,398.95
53,891.27
OTHER TAXES NOT ELSEWHERE CLASSIFIED
6,800.04
7,857.10
8,537.81
9,986.89
11,797.05
TOTAL TAX REVENUE
626,668.75 695,887.71
763,828.33
945,244.76
1,130,134.62
Social security contributions
659.58
110.87
584.48
580.79
660.81
Property Income
12,917.61
17,277.13
18,683.12
10,767.53 20,147.83
Sale of Goods and Services
1,891.37
7,366.72
11,735.49
13,400.05
8,622.99
Fines Penalties and Forfeiture
289.63
1,078.88
1,465.50
1,442.62
1,357.12
Repayments from domestic lending and on lending
1,159.75
1,611.56
2,183.55
6,353.11
2,034.24
Other receipts not elsewhere classified
7,823.31
2,188.91
9,245.38
3,204.29
3,445.20
TOTAL NON TAX REVENUE
24,741.25
29,634.07
43,897.52
35,748.39
36,268.19
TOTAL REVENUE
651,410.00
725,521.78
807,725.85
980,993.15
1,166,402.81
Nominal GDP
3,104,303.00
3,294,026.00
3,444,066.00
3,639,938.00
3,833,876.00
Tax Revenue as a % of GDP 20.19% 21.13% 22.18% 25.97% 29.48%
Total Revenue as a % of GDP 20.98% 22.03% 23.45% 26.95% 30.42%
Annual % Change in GDP 8.4% 6.1% 4.6% 5.7% 5.3%
Source: Figures from KNBS & ICPAK Computations
1.1
Kenya’s Revenue Analysis Report16
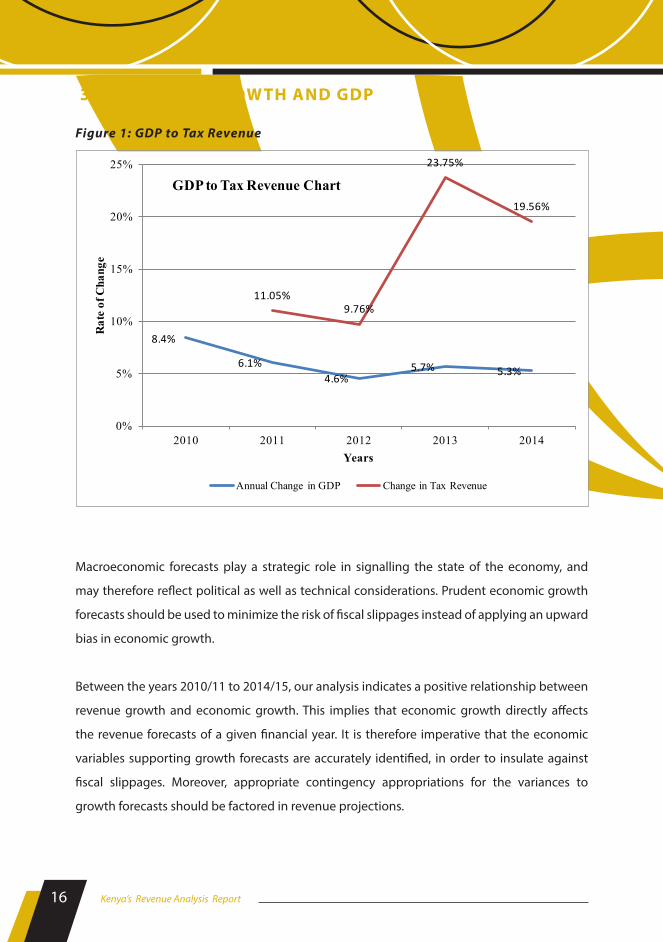
3.2 REVENUE GROW TH AND GDP
Figure 1: GDP to Tax Revenue
Macroeconomic forecasts play a strategic role in signalling the state of the economy, and
may therefore reflect political as well as technical considerations. Prudent economic growth
forecasts should be used to minimize the risk of fiscal slippages instead of applying an upward
bias in economic growth.
Between the years 2010/11 to 2014/15, our analysis indicates a positive relationship between
revenue growth and economic growth. This implies that economic growth directly affects
the revenue forecasts of a given financial year. It is therefore imperative that the economic
variables supporting growth forecasts are accurately identified, in order to insulate against
fiscal slippages. Moreover, appropriate contingency appropriations for the variances to
growth forecasts should be factored in revenue projections.
8.4%
6.1%4.6%
5.7% 5.3%
11.05%9.76%
23.75%
19.56%
0%
5%
10%
15%
20%
25%
2010 2011 2012 2013 2014
Rat
e of
Cha
nge
Years
GDP to Tax Revenue Chart
Annual Change in GDP Change in Tax Revenue
Kenya’s Revenue Analysis Report 17
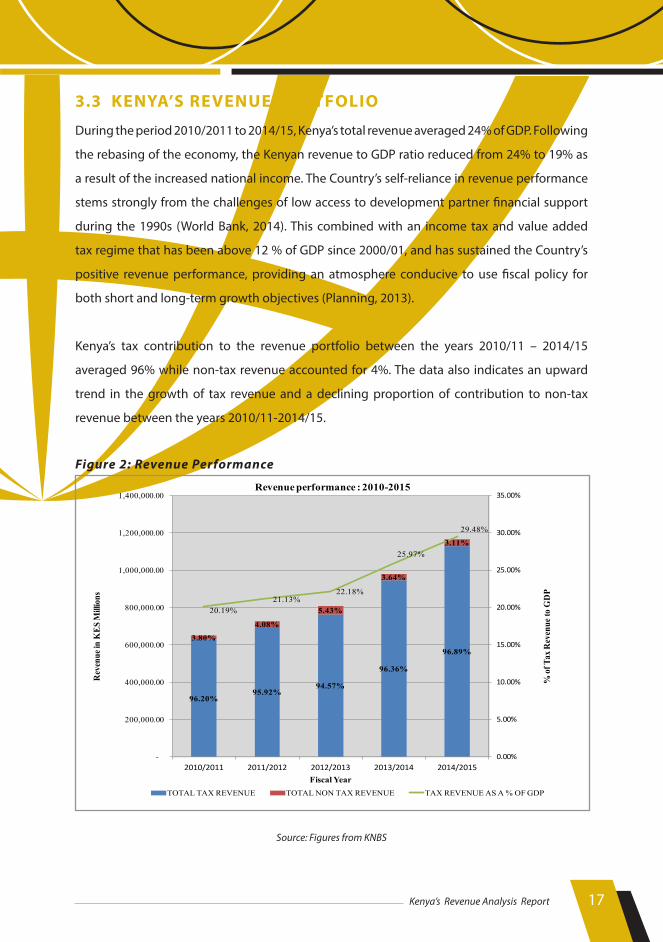
3.3 KENYA’S REVENUE PORTFOLIO
During the period 2010/2011 to 2014/15, Kenya’s total revenue averaged 24% of GDP. Following
the rebasing of the economy, the Kenyan revenue to GDP ratio reduced from 24% to 19% as
a result of the increased national income. The Country’s self-reliance in revenue performance
stems strongly from the challenges of low access to development partner financial support
during the 1990s (World Bank, 2014). This combined with an income tax and value added
tax regime that has been above 12 % of GDP since 2000/01, and has sustained the Country’s
positive revenue performance, providing an atmosphere conducive to use fiscal policy for
both short and long-term growth objectives (Planning, 2013).
Kenya’s tax contribution to the revenue portfolio between the years 2010/11 – 2014/15
averaged 96% while non-tax revenue accounted for 4%. The data also indicates an upward
trend in the growth of tax revenue and a declining proportion of contribution to non-tax
revenue between the years 2010/11-2014/15.
Figure 2: Revenue Performance
Source: Figures from KNBS
96.20%95.92%
94.57%
96.36%
96.89%
3.80%
4.08%
5.43%
3.64%
3.11%
20.19%21.13%
22.18%
25.97%
29.48%
0.00%
5.00%
10.00%
15.00%
20.00%
25.00%
30.00%
35.00%
-
200,000.00
400,000.00
600,000.00
800,000.00
1,000,000.00
1,200,000.00
1,400,000.00
2010/2011 2011/2012 2012/2013 2013/2014 2014/2015
% of
Tax
Rev
enue
to G
DP
Rev
enue
in K
ES M
illio
ns
Fiscal Year
Revenue performance : 2010-2015
TOTAL TAX REVENUE TOTAL NON TAX REVENUE TAX REVENUE AS A % OF GDP
Kenya’s Revenue Analysis Report18
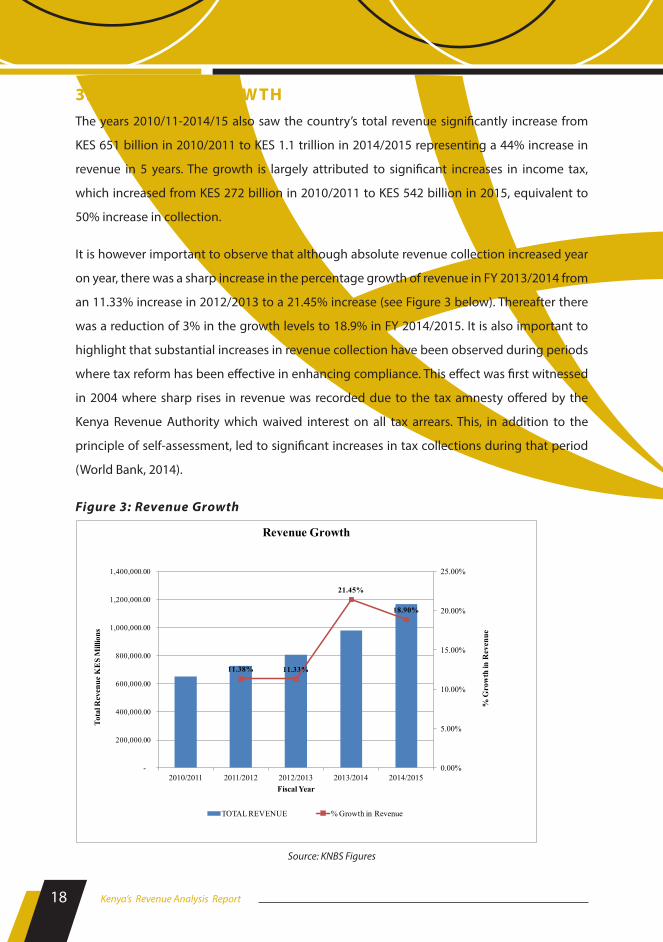
3.4 REVENUE GROW THThe years 2010/11-2014/15 also saw the country’s total revenue significantly increase from
KES 651 billion in 2010/2011 to KES 1.1 trillion in 2014/2015 representing a 44% increase in
revenue in 5 years. The growth is largely attributed to significant increases in income tax,
which increased from KES 272 billion in 2010/2011 to KES 542 billion in 2015, equivalent to
50% increase in collection.
It is however important to observe that although absolute revenue collection increased year
on year, there was a sharp increase in the percentage growth of revenue in FY 2013/2014 from
an 11.33% increase in 2012/2013 to a 21.45% increase (see Figure 3 below). Thereafter there
was a reduction of 3% in the growth levels to 18.9% in FY 2014/2015. It is also important to
highlight that substantial increases in revenue collection have been observed during periods
where tax reform has been effective in enhancing compliance. This effect was first witnessed
in 2004 where sharp rises in revenue was recorded due to the tax amnesty offered by the
Kenya Revenue Authority which waived interest on all tax arrears. This, in addition to the
principle of self-assessment, led to significant increases in tax collections during that period
(World Bank, 2014).
Figure 3: Revenue Growth
Source: KNBS Figures
11.38% 11.33%
21.45%
18.90%
0.00%
5.00%
10.00%
15.00%
20.00%
25.00%
-
200,000.00
400,000.00
600,000.00
800,000.00
1,000,000.00
1,200,000.00
1,400,000.00
2010/2011 2011/2012 2012/2013 2013/2014 2014/2015
% G
row
th in
Rev
enue
Tota
l Rev
enue
KE
S M
illio
ns
Fiscal Year
Revenue Growth
TOTAL REVENUE % Growth in Revenue
Kenya’s Revenue Analysis Report 19
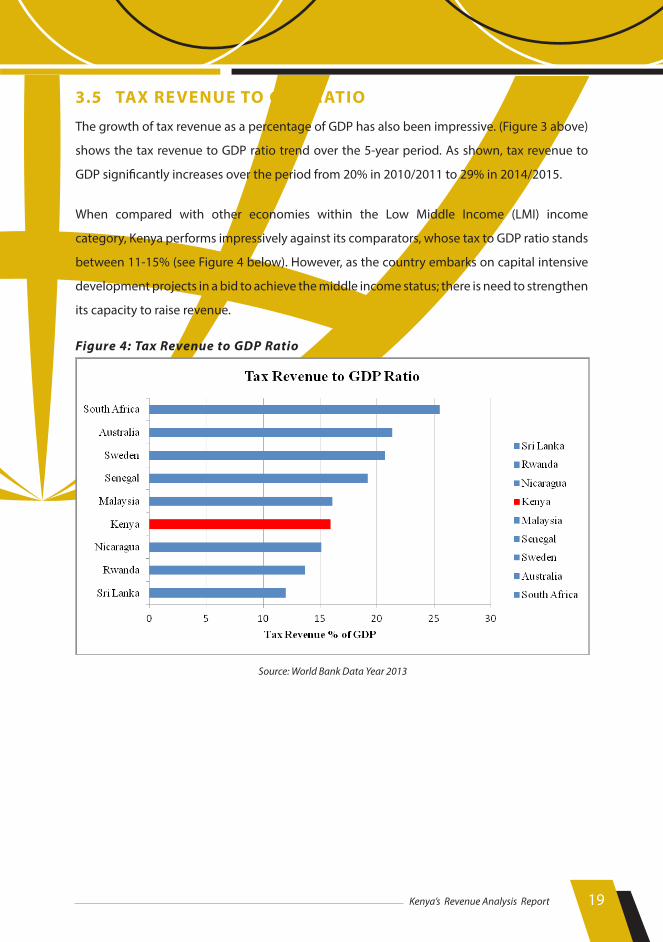
3.5 TAX REVENUE TO GDP RATIO
The growth of tax revenue as a percentage of GDP has also been impressive. (Figure 3 above)
shows the tax revenue to GDP ratio trend over the 5-year period. As shown, tax revenue to
GDP significantly increases over the period from 20% in 2010/2011 to 29% in 2014/2015.
When compared with other economies within the Low Middle Income (LMI) income
category, Kenya performs impressively against its comparators, whose tax to GDP ratio stands
between 11-15% (see Figure 4 below). However, as the country embarks on capital intensive
development projects in a bid to achieve the middle income status; there is need to strengthen
its capacity to raise revenue.
Figure 4: Tax Revenue to GDP Ratio
Source: World Bank Data Year 2013
Kenya’s Revenue Analysis Report20
POLICY IMPLICATIONS
A trend analysis of revenue growth is critical in informing revenue projections for the coming
years. Kenya’s budget process has inadequately facilitated accurate forecasts for resource
collection. The common tendency has therefore been to make overly optimistic revenue
projections leading to an increased uncertainty of resource flows.
The role of Parliament is critical in providing oversight over the revenue projections. According
to the Parliamentary report on the Budget Policy Statement, the Budget and Appropriations’
Committee expressed concerns over the revenue projections provided by the executive in the
FY 2014/2015 which the Committee thought of as ambitious and not backed by economic
fundamentals. However, during the evaluations of the budget estimates, the Committee did
not vary the projections accordingly, leading to the adoption of the current revenue estimates
guiding the country’s revenue collection.
Revenue projections are usually supported by various tax policy and administration
initiatives. The budget FY 2014/2015 for instance, anticipated some reforms in the policy
and legal framework on tax administration through implementation of the Excise Act 2015,
comprehensive review of the Income Tax Act and the enactment of the Tax Procedures Law.
The Excise Act 2015 and the Tax Procedures Act were only enacted into law in December 2015,
while the process of reviewing the Income Tax Act is unlikely to be completed by the end
of FY 2015/2016. These delays in effecting anticipated policy measures have an impact on
the revenue productivity. The process to automate revenue administration through iTax has
also been shrouded in a lot of implementation challenges with the knock on effect on overall
revenue collection. The KRA automation committee has reported reductions in the revenue
collection in Q1 & Q2 raising concerns regarding Kenya’s revenue performance in 2015/2016.
Kenya’s Revenue Analysis Report 21
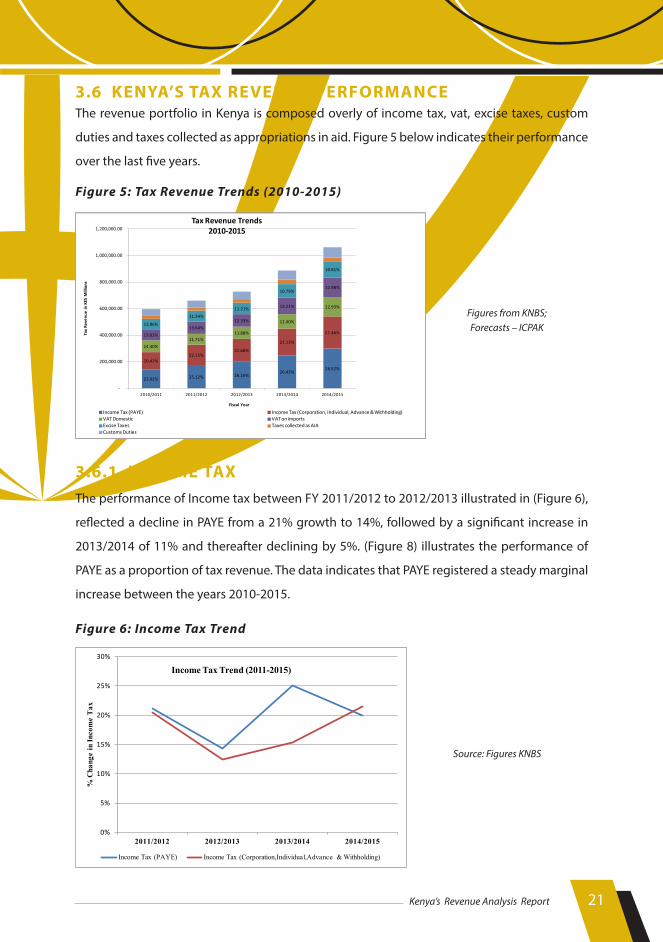
3.6 KENYA’S TAX REVENUE PERFORMANCEThe revenue portfolio in Kenya is composed overly of income tax, vat, excise taxes, custom
duties and taxes collected as appropriations in aid. Figure 5 below indicates their performance
over the last five years.
Figure 5: Tax Revenue Trends (2010-2015)
Figures from KNBS;Forecasts – ICPAK
3.6.1 INCOME TAXThe performance of Income tax between FY 2011/2012 to 2012/2013 illustrated in (Figure 6),
reflected a decline in PAYE from a 21% growth to 14%, followed by a significant increase in
2013/2014 of 11% and thereafter declining by 5%. (Figure 8) illustrates the performance of
PAYE as a proportion of tax revenue. The data indicates that PAYE registered a steady marginal
increase between the years 2010-2015.
Figure 6: Income Tax Trend
Source: Figures KNBS
0%
5%
10%
15%
20%
25%
30%
2011/2012 2012/2013 2013/2014 2014/2015
% C
hang
e in
Inco
me
Tax
Income Tax Trend (2011-2015)
Income Tax (PAYE) Income Tax (Corporation,Individual,Advance & Withholding)
23.02% 25.12% 26.16%26.43%
26.52%
20.42%22.15%
22.68%
21.13%
21.46%
14.40%
11.71%11.88%
11.40%
12.93%
13.03%
13.64%
12.33%
13.21%
12.98%
12.86%
11.34%
11.21%
10.79%
10.81%
-
200,000.00
400,000.00
600,000.00
800,000.00
1,000,000.00
1,200,000.00
2010/2011 2011/2012 2012/2013 2013/2014 2014/2015
Tax
Reve
nue
in K
ES M
illio
ns
Fiscal Year
Tax Revenue Trends2010-2015
Income Tax (PAYE) Income Tax (Corporation, Individual, Advance & Withholding)VAT Domestic VAT on importsExcise Taxes Taxes collected as AIACustoms Duties

Kenya’s Revenue Analysis Report22
Other Income Tax similarly declined between the FY 2011/2012 to 2012/2013 from 21% to
12%, followed by a steady increase in 2013/2014 of 3% and 6% in 2014/2015. However, the
proportion of corporation tax as a proportion of tax revenue grew marginally between the
years 2010 to 2012 followed by a decline in 2012/2013 and a marginal increase in 2013/2014.
POLICY IMPLICATIONSOver 40% of the tax collection in Kenya is generated from direct taxes. (Figure8) below
provides a pictorial representation on the proportion of particular taxes in total tax revenue.
The improved performance of income taxes can largely be attributed to higher tax compliance
(World Bank, 2014).
This analysis corresponds with the KRA’s revenue performance report 2013/2014 that
attributed the sharp increase in PAYE tax revenue to the implementation of devolution, which
introduced the County payroll. The marginal increase in the proportion of Income tax as a
percentage of tax revenue is reflective of the minimal policy initiatives implemented to reform
the income tax regime in Kenya. As noted above, this tax contributes the largest proportion
to the tax revenue portfolio. However, according the KRA Kenya has only registered 1.6
Million tax payers. This implies that out of a population of 43 million people, under 5% of the
population contribute to income tax. This therefore raises fundamental questions regarding
the harnessing of the tax base in Kenya. It is therefore critical that the Income Tax regime is
reviewed to broaden the tax base in order to realize increased revenue collection.
3.6.2 VAT Domestic VAT underperformed in the FY 2010/11 registering negative growth of -9.6%. This
is attributed to the impact of VAT Withholding that was occasioned by a slow processing of
payments on development projects. According to the KRA, in the same year, significant donor
funding was directed to infrastructure development which was either tax exempt or the sector
taxpayers recorded high input tax deductions. However, this trend reversed in FY 2012/2013
registering a positive growth of 11.3% and a further 18.7% in FY 2013/14.
VAT on Domestic goods increased significantly by 17% between the FY 2013/14 and FY 2014/15.
This was attributed to the implementation of the VAT Act 2013that applied the standard rate
to more goods and services. The reintroduction of withholding VAT may also have had an
impact on the increased collection of domestic VAT. Withholding VAT was reintroduced in the
Finance Act of 2014, at the rate of 6%, with effect from 19th September 2014.

Kenya’s Revenue Analysis Report 23
Figure 7: VAT Trend
Source: Figures from
KNBS
As illustrated in (Figure 5), the share of VAT on the other hand has progressively declined from
27% of tax revenue in 2010/2011 to 25% in 2014/2015. The passing of the VAT Act 2013 marked a
significant step in the process of tax reforms in the country. The past 2 decades have hardly seen
substantial changes in tax policy apart from the piecemeal amendments to the tax statutes,
motivated by the need to ensure tax collection increases. (Figure 7) displays a convergence in
the proportion of VAT from imports and VAT from domestic, with a year on year reduction in the
import VAT and a progressive increase in the domestic VAT. This may be due to the harmonization
of the EACMA in line with the regional integration efforts aimed at reducing tax rates on imports.
Figure 8: Proportion of Tax Revenue Trend
Source: Figures from
KNBS
-15%
-10%
-5%
0%
5%
10%
15%
20%
25%
30%
35%
40%
2011/2012 2012/2013 2013/2014 2014/2015
VAT Trend (2011-2015)
VAT Domestic VAT on imports
23.02%
25.12%26.16% 26.43% 26.52%
20.42%
22.15% 22.68%
21.13% 21.46%
4.10% 3.78% 3.50% 3.78%
2.33%
7.35% 7.43% 7.55% 7.15% 6.90%
0.0%
5.0%
10.0%
15.0%
20.0%
25.0%
30.0%
2010/2011 2011/2012 2012/2013 2013/2014 2014/2015
% of
Tax
Rev
enue
Fiscal Year
Proportion of Tax Revenue Trend
Income Tax (PAYE) Income Tax (Corporation, Individual,Advance & Withholding)VAT Domestic VAT on importsExcise Taxes Taxes collected as AIACustoms Duties

Kenya’s Revenue Analysis Report24
3.6.3 CUSTOMS & EXCISE DUTYCustoms and Excise duties account for and an average of 7.2% and 11.4% respectively, of
the total tax revenue collected over the 5-year period. These taxes constitute the indirect tax
portfolio which applies to a broad base of the society. Excise duty has traditionally been used
as a revenue raising mechanism on high volume and price inelastic goods. In modern taxation
regimes, excise tax is used to address negative externalities associated with consumption of
commodities. It is therefore primarily applied to tobacco, alcohol, motor vehicles and fuels.
The function of a customs tax is primarily to facilitate trade and protect the society. The
administration of Customs duty in Kenya is underpinned by the East Africa Community
Customs Management Act (EACCMA) of 2004. As such, any customs policy interventions are
based on consultations with member states, as provided by the protocol on the establishment
of the East African Customs Union.
Figure 9: Excise & Customs Trend (2011 – 2015)
Source: Figures from KNBS
-2.09%
8.59%
19.11% 19.74%
-5.0%
0.0%
5.0%
10.0%
15.0%
20.0%
25.0%
2011/2012 2012/2013 2013/2014 2014/2015
Excise & Customs Trend (2011-2015)
Excise Taxes Customs Duties
Kenya’s Revenue Analysis Report 25
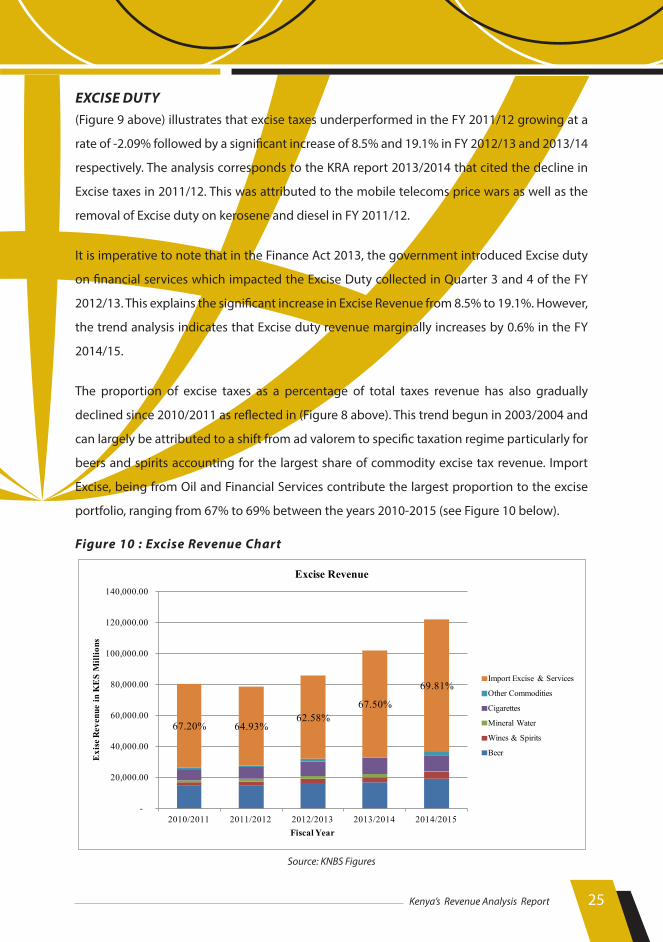
EXCISE DUTY(Figure 9 above) illustrates that excise taxes underperformed in the FY 2011/12 growing at a
rate of -2.09% followed by a significant increase of 8.5% and 19.1% in FY 2012/13 and 2013/14
respectively. The analysis corresponds to the KRA report 2013/2014 that cited the decline in
Excise taxes in 2011/12. This was attributed to the mobile telecoms price wars as well as the
removal of Excise duty on kerosene and diesel in FY 2011/12.
It is imperative to note that in the Finance Act 2013, the government introduced Excise duty
on financial services which impacted the Excise Duty collected in Quarter 3 and 4 of the FY
2012/13. This explains the significant increase in Excise Revenue from 8.5% to 19.1%. However,
the trend analysis indicates that Excise duty revenue marginally increases by 0.6% in the FY
2014/15.
The proportion of excise taxes as a percentage of total taxes revenue has also gradually
declined since 2010/2011 as reflected in (Figure 8 above). This trend begun in 2003/2004 and
can largely be attributed to a shift from ad valorem to specific taxation regime particularly for
beers and spirits accounting for the largest share of commodity excise tax revenue. Import
Excise, being from Oil and Financial Services contribute the largest proportion to the excise
portfolio, ranging from 67% to 69% between the years 2010-2015 (see Figure 10 below).
Figure 10 : Excise Revenue Chart
Source: KNBS Figures
67.20% 64.93%62.58%
67.50%
69.81%
-
20,000.00
40,000.00
60,000.00
80,000.00
100,000.00
120,000.00
140,000.00
2010/2011 2011/2012 2012/2013 2013/2014 2014/2015
Exi
se R
even
ue in
KE
S M
illio
ns
Fiscal Year
Excise Revenue
Import Excise & Services
Other Commodities
Cigarettes
Mineral Water
Wines & Spirits
Beer
Kenya’s Revenue Analysis Report26
CUSTOMS
The statistical analysis on customs indicates that the collection of customs revenue declined
in FY 2011/2012, followed by a marginal increase in the FY 2012/2013 and a 6% increase in the
FY 2013/2014 and finally a 2% decline in FY 2014/2015.
The analysis above also indicates that the proportion of customs tax to total tax revenue
marginally increased between the FY 2010/2011 to 2012/2013, growing at a rate of 0.1%. This
was then followed by a drop in growth of 0.4% in FY 2013/2014 and a further reduction of
0.2% in 2014/2015.
The statistics indicate Kenya’s consistency in policy implementation with the Common Market
Protocol, which intends to reduce tariffs between the member states in order to facilitate
intra-regional trade.
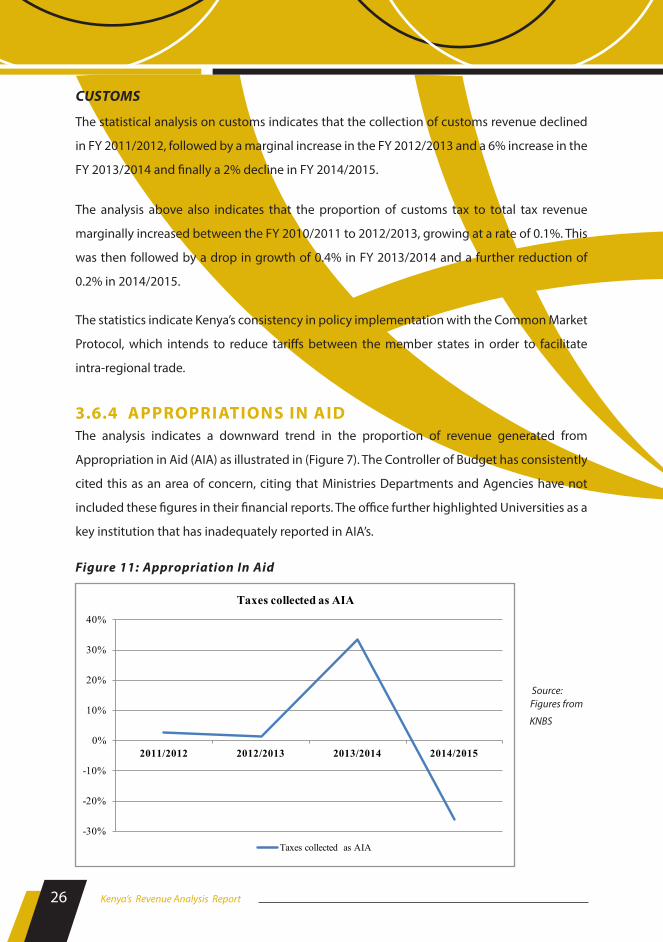
3.6.4 APPROPRIATIONS IN AIDThe analysis indicates a downward trend in the proportion of revenue generated from
Appropriation in Aid (AIA) as illustrated in (Figure 7). The Controller of Budget has consistently
cited this as an area of concern, citing that Ministries Departments and Agencies have not
included these figures in their financial reports. The office further highlighted Universities as a
key institution that has inadequately reported in AIA’s.
Figure 11: Appropriation In Aid
Source: Figures from
KNBS
-30%
-20%
-10%
0%
10%
20%
30%
40%
2011/2012 2012/2013 2013/2014 2014/2015
Taxes collected as AIA
Taxes collected as AIA
Kenya’s Revenue Analysis Report 27
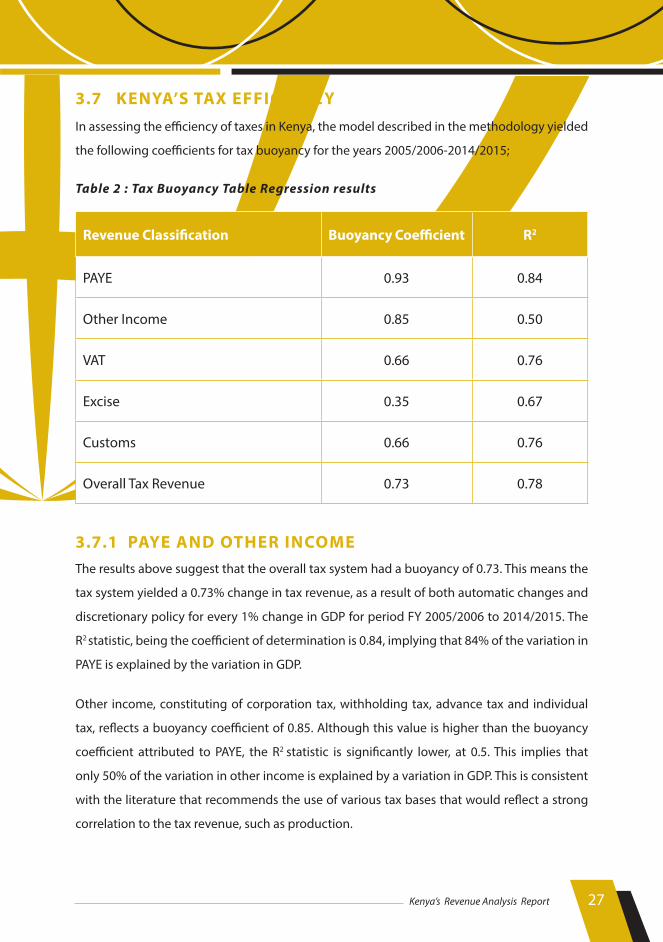
3.7 KENYA’S TAX EFFICIENCYIn assessing the efficiency of taxes in Kenya, the model described in the methodology yielded
the following coefficients for tax buoyancy for the years 2005/2006-2014/2015;
Table 2 : Tax Buoyancy Table Regression results
Revenue Classification Buoyancy Coefficient R2
PAYE 0.93 0.84
Other Income 0.85 0.50
VAT 0.66 0.76
Excise 0.35 0.67
Customs 0.66 0.76
Overall Tax Revenue 0.73 0.78
3.7.1 PAYE AND OTHER INCOMEThe results above suggest that the overall tax system had a buoyancy of 0.73. This means the
tax system yielded a 0.73% change in tax revenue, as a result of both automatic changes and
discretionary policy for every 1% change in GDP for period FY 2005/2006 to 2014/2015. The
R2 statistic, being the coefficient of determination is 0.84, implying that 84% of the variation in
PAYE is explained by the variation in GDP.
Other income, constituting of corporation tax, withholding tax, advance tax and individual
tax, reflects a buoyancy coefficient of 0.85. Although this value is higher than the buoyancy
coefficient attributed to PAYE, the R2 statistic is significantly lower, at 0.5. This implies that
only 50% of the variation in other income is explained by a variation in GDP. This is consistent
with the literature that recommends the use of various tax bases that would reflect a strong
correlation to the tax revenue, such as production.
Kenya’s Revenue Analysis Report28
3.7.2 IMPORT DUTY & EXCISE
The results drawn from the buoyancy model on import duty and excise duty reflect coefficients
lower than 1. It is important to note that the excise coefficient, being 0.35 was the lowest
coefficient in the selected taxes. This may also be due to the tax base. Although customs
registered higher buoyancy that excise, both taxes do not provide an adequate yield for every
1% change in GDP.
The buoyancy of excise duty may be associated with excise duty regime applied in Kenya.
Experience has shown that ad valorem taxes are more buoyant than specific taxes and would
therefore lead to higher tax revenues. In addition, ad valorem rates adjust automatically to
inflation, as compared to specific taxes which have to be adjusted periodically to keep up with
inflation.
3.7.3 BUOYANCY OF VAT The buoyancy analysis for VAT registered a coefficient of 0.66 with an R2 value of 0.76. Although
VAT is a consumption tax and utilizing consumption as a tax base would have yielding more
reliable results, the use of GDP as a proxy is valuable in analysing the response of VAT to
changes in overall national income. This is a helpful indicator in identifying the appropriate
policy interventions to apply in order to increase the level of revenue collection in the county.
Kenya’s Revenue Analysis Report 29
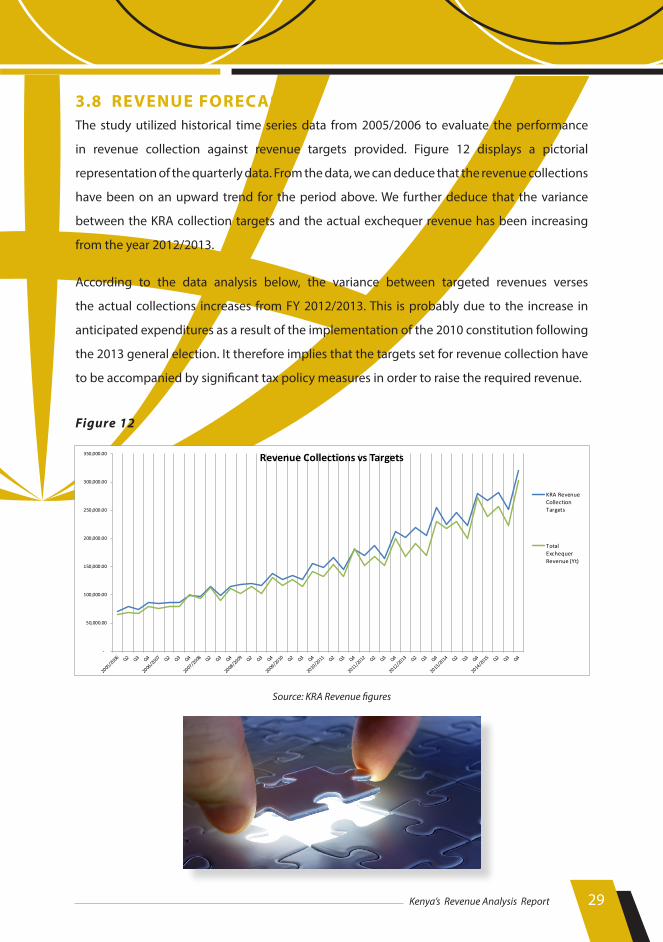
3.8 REVENUE FORECASTS The study utilized historical time series data from 2005/2006 to evaluate the performance
in revenue collection against revenue targets provided. Figure 12 displays a pictorial
representation of the quarterly data. From the data, we can deduce that the revenue collections
have been on an upward trend for the period above. We further deduce that the variance
between the KRA collection targets and the actual exchequer revenue has been increasing
from the year 2012/2013.
According to the data analysis below, the variance between targeted revenues verses
the actual collections increases from FY 2012/2013. This is probably due to the increase in
anticipated expenditures as a result of the implementation of the 2010 constitution following
the 2013 general election. It therefore implies that the targets set for revenue collection have
to be accompanied by significant tax policy measures in order to raise the required revenue.
Figure 12
Source: KRA Revenue figures
-
50,000.00
100,000.00
150,000.00
200,000.00
250,000.00
300,000.00
350,000.00 Revenue Collections vs Targets
KRA RevenueCollectionTargets
TotalExchequerRevenue (Yt)

Kenya’s Revenue Analysis Report30
CO N C LU S I O NRevenue performance denotes the relative change in the yield from tax and non-tax sources.
It encompasses changes in rates, bases, and governance of revenue measures. Performance
is said to be satisfactory if the given revenue sources provide increasing revenue year after
year. Although the magnitude of revenue depends on the performance of each source, the
structure of direct and indirect taxes also affects the overall performance. It also depends on
how best the potential revenue bases have been tapped through a country’s effort to raise
revenue.
This analysis has utilized three indicators to evaluate the revenue performance between the
years 2010/11-2014/15. The analysis concludes that Kenya’s revenue portfolio is significantly
driven by tax revenue. The analysis also concludes that the primary contributor to tax revenue
is income tax. This finding is consistent with the literature on tax performance globally. It is
therefore safe to conclude that direct taxes still drive the tax revenue structure of the country.
The analysis of the performance of various taxes indicates that overall, there has been an
increase collection of taxes in the country. The analysis also concludes that taxes from AIA have
been on a downward trend. This finding is consistent with the Controller of Budget reports,
which identified poor reporting of revenues generated from AIA’s by government agencies.
The analysis has provided the trends in revenue and would be valuable information to consider
in the preparation of forecasts in future. The analysis has also established the buoyancy for the
various taxes. It is apparent that PAYE registers the highest coefficient of buoyancy, however,
still below the coefficient necessary for taxes to be considered buoyant. The performance of
various taxes aligns with the findings the buoyancy and reflects the effectiveness of the tax
system in responding to changes in national income.

Kenya’s Revenue Analysis Report 31
R E CO M M E N DAT I O N SFrom the study findings, the following policy considerations are recommended:
DIRECT TAXESOur analysis has shown that Kenya’s revenue portfolio is heavily dependent on direct taxes,
with PAYE contributing a larger proportion to overall tax revenue. It further indicates that
over the 5-year period, the trend on the proportion of PAYE has increased year on year, while
corporation tax has been on downward trend. This implies that the largest tax burden is
applied on income, with a higher proportion applied on labour than capital.
Overall, the tax system in Kenya is designed to place a higher tax burden on high income
earners and simultaneously, it gives a standard individual tax relief, thus decreasing the tax
wedge on salaries in the lower income groups.
The findings indicate that PAYE is the largest contributor to Income Tax. This implies that the
country needs implement policies that enhance the contribution of corporation tax to this
tax head. Although the corporation tax regime has undergone numerous reforms in a bid to
improve revenue mobilization and attract foreign capital, there is a high possibility that fiscal
policies enforced to provide generous tax incentives to foreign corporations is decreasing
the tax burden of large foreign companies rather than that of small and medium domestic
enterprises.
a. Implement means tested tax incentives
Given that tax incentives erode the tax base, we recommend that the KRA enhances
its use of tax incidence analysis to establish where the highest incidence of taxation
is for the Income taxes. This will allow the authority to advise the National Treasury
on the appropriate means tested tax policy initiatives that utilize the ‘ability to pay
principle’, foster the growth of domestic industries, cushion the vulnerable and
ensure maximum revenue yield from the economy.

Kenya’s Revenue Analysis Report32
b. Review the income brackets
Currently, Kenya applies a progressive income tax with a top tax bracket of 30 per cent
of income. We commend the National Treasury for reviewing the Income brackets
through the Budget Statement FY 2015-2016 and Finance Act 2016 to reflect the
economic realities of personal income in Kenya.
Figure 13 below is a pictorial representation of the trend in real wage earnings
between the years 2006-2014, reflecting a downward trend in real wage earnings
that could be as a result of increased inflation.
Figure 13
Source: Data from KNBS
According to the 2010 KNBS consumer price index, the range of Real average wage earnings
has been between 300,000 and 450,000 per annum. The change in real average wage earnings
is influenced significantly by the inflationary rates. The KNBS Urban Consumer price index
outlines the income groups as follows; Lower Income - KES 284,040 Per Annum (KES 23,670
per month) constituting 72% of the urban population. It defines the middle income bracket at
KES 284,052 - 1,440,000 Per Annum (KES 23,671 -120,000 per month) constituting 24% of the
population. It also defines the upper Income bracket as being above KES 1,440,000 per annum
or 120,000 per month constituting 3.76% of the population.
Kenya’s Revenue Analysis Report 33
This analysis provides an indication that only 30% of the urban population as subjected to
direct taxes.
In addition to widening the tax brackets, tax policy needs to prioritize broadening of the
tax base through targeted policy measure to include the informal sector in order to prevent
adverse labor incentives.
c. Fast Track the reform of the Income Tax regime
Our analysis has indicated the tax revenue contributes over 90% of the revenue
collection in the country. It has also indicated that income tax is the largest
contributor to the tax revenue basket.
The business community has consistently identified several distortions that grant
some firms preferential treatment in the payment of taxes. The Cabinet Secretary
in the budget statement for 2015 identified the review of the Income Tax Act as a
priority reform to be completed by September 2015. Any delayed review will affect
the realization of revenue targets.
d. Shift revenue reliance away from direct taxes
The review of the Income tax act should be coupled with efforts to implement tax
policy to deliberately shift reliance from direct taxes towards indirect taxes to fund
its expenditure. A shift from direct taxes to indirect taxes might exert a beneficial
effect on employment levels and GDP even at unchanged overall revenue levels.
This will also ensure that a larger proportion of the population is contributing to the
tax net as consumption increases.
INDIRECT TAXESOur analysis has shown that Kenya’s indirect taxes have the lowest buoyancy coefficient, which
implies that they yield the lowest proportion of revenue to an increase in national income
or GDP. Indirect taxes are also considered regressive; placing a higher tax burden on lower
income groups, whose propensity to consume is higher than in the case of higher earners.
Kenya’s consumption taxes are however designed to exclude the population with the lowest
disposable income from the tax net.
Kenya’s Revenue Analysis Report34
a. Address the progressivity of VAT
The progressivity of VAT has been achieved through the exclusion of basic necessities,
however Several proposals have been tabled to zero rate the basic consumer
commodities. The government exempted these items instead of zero rating them. For
the tax payer exemption is not an appropriate treatment for essential goods because
when a commodity is exempt from VAT, it implies that the manufacturer incurs VAT on
the raw materials however they are unable to recover this amount from VAT on the
sales. The manufacturer is therefore forced to adjust prices of the commodities as a
means of compensation, increasing the price of basic commodities.
b. Apply a graduated approach to VAT
We recommend that a graduated VAT approach be applied to simplify its administration
and enhance progressivity of the tax.
This approach is used in most of the European Union (EU) countries. The VAT directive
provides1that the standard rate must be between 15 and 25%. However, each member
state may choose its standard rate within the parameters set out. A reduced VAT rate
of at least 5% can be enacted for supplies of goods and services referred to in an
exhaustive list in the VAT directive. Only Denmark applies a single standard rate of
25%.
We hereby propose that the VAT rate is split into three categories namely; firstly, a
lower rate for basic consumer commodities which could be set at maybe 30% of the
standard rate, secondly, a standard rate for all the other commodities and lastly a
higher rate for specific commodities which are considered luxury items. This could be
set at 130% of the standard rate.
1 Articles 96 and 97 of the VAT directive, Council Directive 2006/112/EC, http://ec.europa.eu/taxation_
customs/taxation/vat/key_documents/index_en.htm.

Kenya’s Revenue Analysis Report 35
c. Broaden the tax base The National Treasury has expressed intent to broaden the tax base and improve
revenue administration, through policy reforms such as the revision of the excise rates
for selected products through the new Excise Act 2015 anticipated to raise KES 25
Billion in revenues for the government. However, as a result of the delayed enactment
of the act, the KRA forecasts revised the anticipated collection to KES 19 billion.
It may be imprudent for the government to place substantial reliance on the
enactment of tax policy legislation, in forecasting for revenues necessary to fund
public expenditure. This has a ripple effect on the debt obligation that government
will need to engage to finance the deficit.
We therefore recommend that the Parliament prioritizes the legislation of money
bills due to the potential impact on service delivery, whereas the policy makers (NT)
should also be prudent when fusing forecasts premised on legislations in budget
proposals especially in the base year.
PLANNING FOR PUBLIC EXPENDITURE IN LIGHT OF
REVENUE GENERATION CAPABILITIESRevenue generation cannot be evaluated independent of expenditure management. The
FY 2014/2015 witnessed the presentation of the Kenya’s largest budget.This is projected to
increase in the long run. The revenue target has as a result, substantially increased. This is telling
of the ongoing economic activity. However, the expenditure reports received from the Office
of the Controller of Budget and the Auditor General cast a very negative image on Kenya’s
expenditure management. While revenue generation has over the years performed well,
an expenditure management framework that does not reflect prudence and accountability
renders the revenue generated efforts void.
It is critical for institutions mandated of provide financial oversight to ensure that wastage
and poor management of public resources is met with accountability for these actions. Tax
payer compliance is strongly influenced by their perception of where their resources are being
applied. The utilization of revenue generated to deliver public services will inevitably raise the
tax compliance rate in the country.
Kenya’s Revenue Analysis Report36
REVENUE FORECASTING
Our analysis has highlighted the growing variance between revenue targets and actual
exchequer collections. The utilization of the appropriate forecasting model is critical to the
accuracy and sustainability of the country’s budgeting process. If revenue targets are arbitrarily
set due to expenditure pressures, it will create an unhealthy appetite for expenditure that is
unsustainable.
We therefore recommend that the revenue forecasts place adequate reliance on economic
indicators and historical performance in order evaluate the country’s revenue potential.
This also needs to be accompanied by sound tax policy that would increase the potential of
collection for revenue.
Kenya’s Revenue Analysis Report 37
B I B L I O G R A P HYAFDB, 2010. Domestic Resource Mobilization for Poverty Reduction in East Africa: Kenya Case
Study, s.l.: African Development Bank Group.
Authority, K. R., 2011. Indirect Taxes Kenya, Nairobi: Kenya Revenue Authority.
Bank, W., 1985. Ghana: Towards Structural Adjustment, Washington, D.C: World Bank Group.
Bank, W., 2014. Public Expenditure Review : Decision Time, Spend More or Spend Smart?,
Nairobi: World Bank Group.
Belinga, V., Benedek, D., Mooij, R. d. & Norregaard, J., 2014. Tax Buoyancy in OECD Countries,
s.l.: International Monetary Fund.
Cheeseman, N. & Griffiths, R., 2005. Increasing tax tevenue in Sub-Saharan Africa: The case
of Kenya., Oxford, United Kingdom: Oxford Council on Good Governance Economic Analysis.
IMF, 2014. Government Finance Statistics Manual. Washington DC: International Monetary
Fund Publication Services.
Kenya, G. o., 2014. Finance Act 2014, Nairobi: Government Printer.
KIPPRA, 2006. Lessons for Kenya’s Tax Reforms Experience, Nairobi: Kenya Institute of Public
Policy Research and Analysis.
M’Amanja, D. & Morrissey, O., 2005. Fiscal policy and economic growth in Kenya. Nottingham:
Centre for Research in Economic Development and International Trade, University of
Nottingham.
Muriithi, M. K. & Moyi, E., 2003. Tax reforms and revenue mobilization in Kenya.
Ochieng, O. V., Wawire, N. H. W., Manyasa, E. O. & Thuku, G. K., 2014. Effects of Tax Reforms on
Buoyancy and Elasticity of the Tax System. International Journal of Economics and Finance,
pp. 97-111.

Kenya’s Revenue Analysis Report38
Okech, Timothy C., and Peter G. Mburu. “Analysis of responsiveness of tax revenue to changes
in national income in Kenya between 1986-2009.”International Journal of Business and Social
Science 2.21 (2011).
Planning, M. o. D. a., 2013. Comprehensive Public Expenditure Review 2013 : Eye on Budget -
Spending for Results, Nairobi: Government of Kenya.
Purohit, M., 2005. Simple Tools for Evaluating Revenue Performance in a Developing Country.
In: Fiscal Management. Washington DC: World Bank, pp. 71-82.
PwC, 2013. Shifting the Balance From Direct to Indirect Taxes : Bringing New Challenges,
London: PWC.
Sen, P., 2006. A Note on Estimating Tax Elasticities. Indian Economic Journal, p. 171.
Watrin, C. & Ullmann, R., 2008. Comparing direct and indirect taxation: The influence of framing
on tax compliance. European Journal of Comparative Economics, pp. 33-56.

Kenya’s Revenue Analysis Report 39

Kenya’s Revenue Analysis Report 1