a house price index based on the spar method
TRANSCRIPT
Journal of Housing Economics 18 (2009) 214–223
Contents lists available at ScienceDirect
Journal of Housing Economics
journal homepage: www.elsevier .com/locate / jhec
A house price index based on the SPAR method q
Paul de Vries a, Jan de Haan b,*, Erna van der Wal b, Gust Mariën a
a Delft University of Technology, OTB Research Institute for Housing, Urban and Mobility Studies, The Netherlandsb Statistics Netherlands, Division of Macro-economic Statistics and Dissemination, The Netherlands
a r t i c l e i n f o a b s t r a c t
Article history:Received 19 June 2009Available online 21 July 2009
JEL classification:C43R31
Keywords:Appraisal valueHouse price indexRepeat salesSPAR method
1051-1377/$ - see front matter � 2009 Elsevier Incdoi:10.1016/j.jhe.2009.07.002
q The views expressed in this paper are those of thnecessarily reflect the policies of Statistics Netheracknowledge constructive comments from Henny CSylvia Jansen, Paul Knottnerus, Cor Lamain, and Alicas from participants at the EMG workshop (DecSydney, Australia) and at the 2008 World Congressand Economic Performance Measures for Nations (MBridge Marriott Hotel, Arlington, USA).
* Corresponding author. Address: Statistics NethMacro-economic Statistics and Dissemination, 249Netherlands.
E-mail addresses: [email protected] (P. de Vriede Haan), [email protected] (E. van der Wal), a.(G. Mariën).
Within the European Union there has been a push to provide European governments andthe European Central Bank with the statistics they need for monitoring the owner-occupiedsector. This paper reports on the results of a project to develop a house price index for theNetherlands. From January 2008, Kadaster, the Dutch land registry office, and StatisticsNetherlands began jointly publishing house price index numbers for the whole countryand for some specific dwelling types and regions. A number of special institutional featuresof the situation in the Netherlands contributed to the choice of index construction method.The indexes are computed using the Sale Price Appraisal Ratio (SPAR) method, which uti-lizes the ratios of transaction prices and previous appraisal values. We describe the SPARmethod, compare it with repeat sales methods and assess the reliability of the officialDutch appraisal values. Empirical results for January 1995–March 2009 are presented.The SPAR method performs well compared to repeat sales, and the results reported willbe of interest to other countries that have, or could instigate, institutional arrangementssimilar to those in the Netherlands.
� 2009 Elsevier Inc. All rights reserved.
1. Introduction
In 2004, the Netherlands initiated a project to develop ahouse price index for the owner-occupied sector. The ef-forts were part of a broader, and urgent, push within theEuropean Union to provide European governments and
. All rights reserved.
e authors and do notlands. We gratefullyoolen, Martijn Dröes,e Nakamura as wellsember 13–15, 2006,on National Accounts
ay 12–17, 2008, Key
erlands, Division of2 JP The Hague, The
s), [email protected] ([email protected]
the European Central Bank with the statistics they needfor monitoring the owner-occupied sector.1 The currentcredit crunch has underlined the importance of having reli-able house price indexes. The objectives of the Dutch projecthave recently been achieved and are being reported on inthis paper. From January 2008, Kadaster, the Dutch land reg-istry office, and Statistics Netherlands began jointly publish-ing house price index numbers for the whole country and forsome specific dwelling types and regions. The indexes arecomputed using the so-called Sale Price Appraisal Ratio(SPAR) method. A number of special institutional featuresof the situation in the Netherlands contributed to the choice
1 Apart from house prices as such, the treatment of owner-occupiedhousing in the HICPs, the consumer price indexes produced in EuropeanUnion Member States on the basis of harmonized standards, is also ofinterest. HICPs are needed in particular for the assessment of priceconvergence, for monitoring inflation and for conducting monetary policyin the euro zone. For an extensive discussion on alternative methods toincorporate owner-occupied housing into a consumer price index, seeDiewert (2003).
3 The multi-period time dummy variable hedonic price index seems tohave dominated the literature. There are other types of hedonic indexesthat may be more suitable. Hill and Melser (2007) argue that ‘double’hedonic imputation might be a better choice: the characteristics param-eters are allowed to change over time, and this method seems to be less
P. de Vries et al. / Journal of Housing Economics 18 (2009) 214–223 215
of index construction method. The results reported may beof interest to other countries that have, or could institute,similar institutional arrangements.
Prior to the introduction of the SPAR indexes, Kadasteralready started publishing house price index numbers forthe owner-occupied sector in May 2005. A set of 55monthly indexes was computed, consisting of a nation-wide index, four regional indexes and indexes based oncombinations of region and dwelling type. These indexes,described extensively in Jansen et al. (2008), were esti-mated using a weighted version of the repeat sales ap-proach (Case and Shiller, 1987; Abraham and Schauman,1991; Calhoun, 1996). The repeat sales method was origi-nally developed by Bailey et al. (1963). They argue that thismethod is more efficient than other methods as it utilizesinformation on prices from earlier periods and includes itin selling prices in later periods. However, there are a num-ber of drawbacks, which make repeat sales indexes unsuit-able for official statistics. One of the most seriousdrawbacks is revision, which means that past values ofthe index will be revised by present-day information (Bar-oni et al., 2004). In other words, additional sales reverber-ate on the index values because new pairs provideinformation on movements in the house prices which goesbeyond the information obtained from the sample.
Bourassa et al. (2006), who also discuss the problem ofrevision and other drawbacks, present the SPAR index asan alternative to hedonic or repeat sales indexes. Like therepeat sales method, the SPAR method is based onmatched pairs but, in contrast, uses (nearly) all price datathat is available for the period under observation. Sincethe majority of the houses sold during the observation per-iod were not sold during the index reference or base peri-od, there is a general shortage of transaction prices for thebase period. The base period prices are therefore estimatedusing appraisals of the houses. In the Netherlands officialgovernment appraisals are collected under the Real EstateLaw [Wet Waardering Onroerende Zaken]. In contrast with arepeat sales index, the SPAR index is not revised when datafor new periods is added. Bourassa et al. (2006) ‘‘maintainthat the advantages and the relatively limited drawbacksof the SPAR model make it an ideal candidate for use bygovernment agencies in developing house price indexes”.
Price indexes can be either value weighted or equallyweighted. A value-weighted price index explicitly orimplicitly weights the indexes of individual dwellings bytheir base period prices (values). The literature stresses thatthe choice between a value weighted and an equallyweighted index should depend on the aim of the index(see e.g., Wang and Zorn, 1997). Our focus is on an indexthat aims at measuring the price change of the owner-occu-pied housing stock, and the weighted (arithmetic) variantof the SPAR method seems a suitable choice. Some users,on the other hand, may wish to have a price index for a‘mean dwelling’.2 An unweighted (geometric) mean index,which arises for example from a standard repeat approach,might be more appropriate in that case. The intention of
2 This most likely holds for the Dutch Central Bank that requires financialinstitutions to specify their risks by estimating the actual liquidation valuefor every single dwelling in their mortgage portfolio.
Kadaster and Statistics Netherlands, however, was to producehouse price index numbers according to a single method.
The paper is organized as follows: Section 2 contains abrief review of the literature on two ‘traditional’ methods,hedonic modelling and the repeat sales method, and givesbackground information on the SPAR method. Section 3 ar-gues that in the Netherlands individual property appraisalscan be used for constructing the SPAR index and presentssome empirical evidence on their reliability. Section 4compares repeat sales and SPAR index numbers. Section5 concludes.
2. Three approaches to measuring house price indexes
Houses are sold infrequently and the composition, or‘quality mix’, of the properties sold usually varies substan-tially from period to period. This introduces bias in simpleprice index measures such as the mean or median. Forexample, if in the current period a disproportionate numberof high-priced houses were sold, then the mean or medianprice would rise, even if not a single house had increased invalue (Case and Shiller, 1987). This drawback has led to thedevelopment of alternative methods, particularly to hedo-nic and repeat sales methods. An advantage of the hedonicapproach over other methods is that, at least in principle, itcan adjust for quality changes of the individual properties.
2.1. Hedonics
Hedonic regression models were initially used to sepa-rate price and quality changes in capital goods and for dura-ble consumer goods such as cars to calculate quality-adjusted price indexes (see e.g., Griliches, 1971). Later, he-donic modeling came to be widely used in housing marketresearch (Mason and Quigley, 1996). A hedonic model ex-presses the price Pit of house i in period t as a function of aset of physical (and possibly also other) characteristics, Qi,and time t:
Pit ¼ f ðQ i; tÞ: ð1Þ
The hedonic coefficients can be interpreted as shadowprices which reflect the value of a characteristic.3 Forexample, an extra room will push up the value of the prop-erty by a specific amount. Specifying the correct functionalform and including the correct set of quality characteristicsis an essential element of hedonic modeling. Mason andQuigley (1996) argue that the functional form assumptionis particularly awkward in the housing context because thehedonic price function summarizes not only consumer pref-erences and production technologies but also various quan-tities which are historically determined, hard to measure,
prone to omitted variables bias. However, just like repeat sales indexes (seeSection 4), multi-period time dummy indexes are subject to revision – theyviolate ‘temporal fixity’. Nevertheless, the advantage of the multi-periodtime dummy method is its efficiency since data across different timeperiods are pooled.
216 P. de Vries et al. / Journal of Housing Economics 18 (2009) 214–223
and inaccessible to economic theory (see also de Vries andBoelhouwer, 2005). They furthermore argue that the exis-tence of sub-markets might go some way towards explain-ing why the standard hedonic specification may not work.Despite the drawbacks, researchers have examined numer-ous datasets and model specifications to determine the mar-ginal effect of housing characteristics on house prices and toconstruct house price indexes. For a recent review, see Sir-mans et al. (2005).
In the Netherlands, the prices of all houses sold are re-corded by Kadaster, the land registry office. Unfortunately,dwelling characteristics other than built surface area andtype of dwelling (detached house, corner house, terracedhouse, semi detached house) are not registered. This pre-vents the use of hedonic modeling for the construction ofquality-adjusted house price indexes.
2.2. Repeat sales
The repeat sales model is extensively addressed in theliterature (see Bailey et al., 1963; Case and Shiller, 1987,1989; Goetzmann, 1992; Calhoun, 1996; Dreiman and Pen-nington-Cross, 2004), so a brief description will sufficehere. Bailey et al. (1963) laid the foundations for the repeatsales method. As the name already suggests, the repeatsales approach models the price changes of houses thatare repeatedly sold. Essentially, it uses a collection of pricespaid for single properties at different points in time to esti-mate a vector of numbers that best explains the observedprice changes over the sample period (Abraham andSchauman, 1991). Specifically, it expresses the logarithmof the ratio of the house price Pis2 in the second sale periods2 and the price Pis1 in the initial or first period s1 (s1 < s2) as
lnðPis2=Pis1Þ ¼ f ðDitÞ; ð2Þ
where Dit is a set of time dummy variables. For the firstsale of a particular house the time dummy has the value�1, for the second sale it has the value +1. All other dum-mies have the value 0.
Case and Shiller (1987) proposed the weighted repeatsales method, an adapted version of the unweighted meth-od described by Bailey et al. (1963). They argue that thelonger the holding period becomes, the greater the variancein individual house price change will be. This type of heter-oscedasticity may undermine the efficiency of the repeatsales index (Wang and Zorn, 1997). Calhoun (1996) distin-guishes three stages in the estimation of the weighted re-peat sales model. In the first stage the original model ofBailey et al. is calculated. The second and third stages aimto improve the efficiency of the first-stage parameter esti-mates, accounting for the possibility that the estimation er-ror is positively related to the time interval betweensubsequent transactions.4
4 Jansen et al. (2008) found that heteroscedasticity was of little impor-tance in the Dutch data – the amount of explained variance was less thanone percent. They also encountered a problem with the weights necessaryto correct for heteroscedasticity. In conclusion, Jansen et al. (2008) arguethat the original repeat sales method of Bailey et al. (1963) seems moreappropriate for calculating a house price index in the Netherlands than itsweighted counterpart.
2.3. SPAR
The Sale Price Appraisal Ratio (SPAR) method has beenapplied in New Zealand since the early 1960s. It is advo-cated by Bourassa et al. (2006) as an alternative approachto measuring house price indexes. Like repeat sales meth-ods, the SPAR method is based on matched pairs but, incontrast, uses (nearly) all price data that is available forthe period of observation. Since the vast majority of housesthat are sold during the current period were not sold dur-ing the index reference or base period, there is a lack oftransaction prices for the base period. The base periodprices are therefore estimated using (official government)appraisals of the properties.
de Haan et al. (2008) indicate that there are varioustypes of SPAR indexes; they can be either value weightedor equally weighted. If an equally weighted index is pre-ferred, the geometric variant would be the best choice.For an index that tracks the changes in the value of thehousing stock, in which we are particularly interested here,the weighted arithmetic variant seems a natural choice.The value-weighted arithmetic SPAR index can be writtenin the following three ways:
ISPAR;t ¼Pnt
j¼1Pjt=Pnt
j¼1Aj0Pn0i¼1Pi0=
Pn0i¼1Ai0
¼Pnt
j¼1wj0Pjt
Aj0
� �Pn0
i¼1wi0Pi0Ai0
� �
¼Pn0
i¼1Ai0=n0Pntj¼1Aj0=nt
" # Pntj¼1Pjt=ntPn0i¼1Pi0=n0
; ð3Þ
where Pjt and Pi0 denote the transaction prices for houses jand i in the current period t and the period 0 in which thehouses were valued (the appraisal or base period); Aj0 andAi0 are the respective appraisals; nt and n0 are the numberof houses sold in period t and 0 (the sample sizes). The sec-ond expression on the right-hand side of Eq. (3) shows thebasic idea behind the value-weighted SPAR index. In thenumerator a price change is computed for each house soldin period t as the ratio of the actual transaction price andthe appraisal. These house-specific price ratios are thenweighted by their (base period) value share wj0 ¼Aj0=
Pntj¼1Aj0, which explains the name ‘value-weighted in-
dex’. Thus, more valuable houses have a greater impacton the index than less valuable houses. The denominatorof (3) is a scaling factor, independent of time t, which isneeded to make the index equal to 1 in the base period. Itcan alternatively be interpreted as a factor that correctsthe numerator for possible over-estimation or under-esti-mation of the appraisals with respect to the transactionprices. Obviously, the denominator of (3) goes to 1 if in per-iod 0 the appraisals would approach the transaction prices.5
The third expression on the right of (3) shows that thevalue-weighted SPAR index can also be viewed as theproduct of the simple ratio of mean transaction pricesand a factor between square brackets. This bracketed factor
5 The underlying assumption of the SPAR method is in fact that a linearrelation through the origin exists in the base period between appraisalvalues and transaction prices for all houses sold in both the base period andthe current period. See also Section 3, where we address the reliability ofthe Dutch appraisals.
P. de Vries et al. / Journal of Housing Economics 18 (2009) 214–223 217
is a ratio of mean appraisals and adjusts the ratio of meansale prices for compositional change. In practice it may bedesirable to apply the SPAR method to relatively homoge-neous strata, since stratification by itself reduces the effectof compositional changes.
Though the SPAR method controls for changes in thequality mix of the sample, it does not control for qualitychanges of individual houses; the same goes for the repeatsales approach. It has been suggested that we adjust thevaluations to take account of home improvements that re-quire planning permission. Unfortunately, such adjust-ments are infeasible in the Netherlands because planningpermission data are available only at aggregate (project)level and not for individual dwellings. Note that the SPARmethod (as well as the repeat sales method) automaticallycontrols for location as it is based on the matched pairsprinciple. This is an advantage compared to the hedonicmethod where it is often difficult to control for micro-location.
3. Representativity of the data
To estimate repeat sales and SPAR house price indexes,we exploited the dataset of Kadaster, the Dutch Land Reg-istry Office. We call this dataset the ‘transaction dataset’.For the SPAR method, in addition we used an ‘appraisaldataset’ with official appraisal values from the municipali-ties. An important question of course is whether the qual-ity of the appraisals is satisfactory. Before explaining howthe appraisals were determined and presenting evidenceon their reliability, we first describe the transactiondataset.
3.1. Transaction dataset
Our (national) transaction dataset contains data onapproximately 2.7 million individual transactions regard-ing second-hand, or resold, houses between January 1995and March 2009.6 A number of transactions were removedfor reasons of validity. We applied price limits between10,000 and 5 million euros. Dwellings that were sold morethan twice in the same month were excluded. For the SPARindex, dwellings for which the corresponding appraisal val-ues could not be found due to problems with merging thedata files, could of course not be used. For the repeat salesindex, dwellings with an extremely large surface area (over1000 square meters) were excluded. Obviously, only dwell-ings sold twice or more could be used here, pertaining toabout half of all transactions.
The literature suggests that repeated transactions witha short time interval might be ‘unusual’ in the sense thatthey may be distressed sales arising from, for example, di-vorce or job loss or that they may be speculative transac-tions (Englund et al., 1998; Steele and Goy, 1997; Clappand Giacotto, 1999). In the Netherlands no conveyancetax needs to be paid on a house that is resold within6 months. Jansen et al. (2008) have shown that a number
6 Transactions for newly built houses are not recorded by Kadaster. Thatis, houses have to be resold before they enter the transactions dataset.
of speculative sales took place during the boom between1998 and 2001. Clapp and Giacotto (1999) and Steele andGoy (1997) suggest eliminating very short holds from thedataset. Jansen et al. (2008) explored the potential impactof such very short holds by calculating the monthly growthrate for each house sold. The mean growth rates were 8.2%,5.2%, 1.2% and 0.9% for houses sold within 6 months, with-in 12 months, within all periods, and between 12 monthsand the end of the period, respectively. Thus, houses resoldwithin 12 months typically realize a huge increase in valueper month, which can potentially bias the index.
3.2. Appraisal dataset
In the real estate literature there has been some discus-sion about appraisal values and their use in house pricemeasurement (Geltner, 1991; Edelstein and Quan, 2006;Leventis, 2006). Most studies are based on appraisals ofdwellings that are about to be re-financed. That is why,in general, the findings suggest that appraisals tend to bepositively biased – they tend to over-predict the actualselling price of the property (Leventis, 2006). In the Neth-erlands official appraisals are collected under the Real Es-tate Law [Wet Waardering Onroerende Zaken] for taxpurposes, not for re-financing. Dutch households pay localtax according to the value of their dwelling. Householdswho feel that the appraisal value is too high may lodgean appeal. Though legally appraisals should reflect themarket values of the houses, we expected local authoritiesto underestimate them in order to avoid court procedures.So initially we assumed that the appraisal values wouldtend to under-predict the market values of the properties.However, an investigation into this issue proved us wrong(van der Wal et al., 2006; de Vries et al., 2006).
Dutch municipalities are legally obliged to have up-to-date estimates of the value of each real estate object in Jan-uary 1995, 1999, 2003, 2005, and 2007. As of January 2007,houses are appraised on an annual basis. Appraisal valuesare determined ex post. For example, preliminary apprais-als for January 2007 were determined at the beginning of2008. The definitive values were available at the end of2008 after taking into account any appeals lodged byhome-owners.7 At the time of this study, appraisals for2008 were thus not yet available, so we distinguish five ap-praisal periods when computing SPAR index numbers (vander Wal, 2008). The records need continuous updating tobe complete and ‘correct’.
The entire process is monitored on the government’sbehalf by Council for Real Estate Assessment, the Waarder-ingskamer. There is no prescribed method of appraisal, butmost municipalities appraise the objects using (hedonic-type) valuation models in combination with visual inspec-tions and local market information. For privacy reasons weare not allowed to publish research findings based on ap-praisal data without explicit permission from the Dutchmunicipalities – it is they who own the appraisals. For this
7 As the appraisals are determined ex post, they include home improve-ments carried out between the date of valuation (for example January2007) and the date upon which the property was accorded an official value(here at the end of 2008).

0
100
200
300
400
500
600
700
800
900
1000
0 100 200 300 400 500 600 700 800 900 1000
Appraisal Value
Real House Price
Source: Kadaster Netherlands, computation OTB and Statistics Netherlands (10% sample)
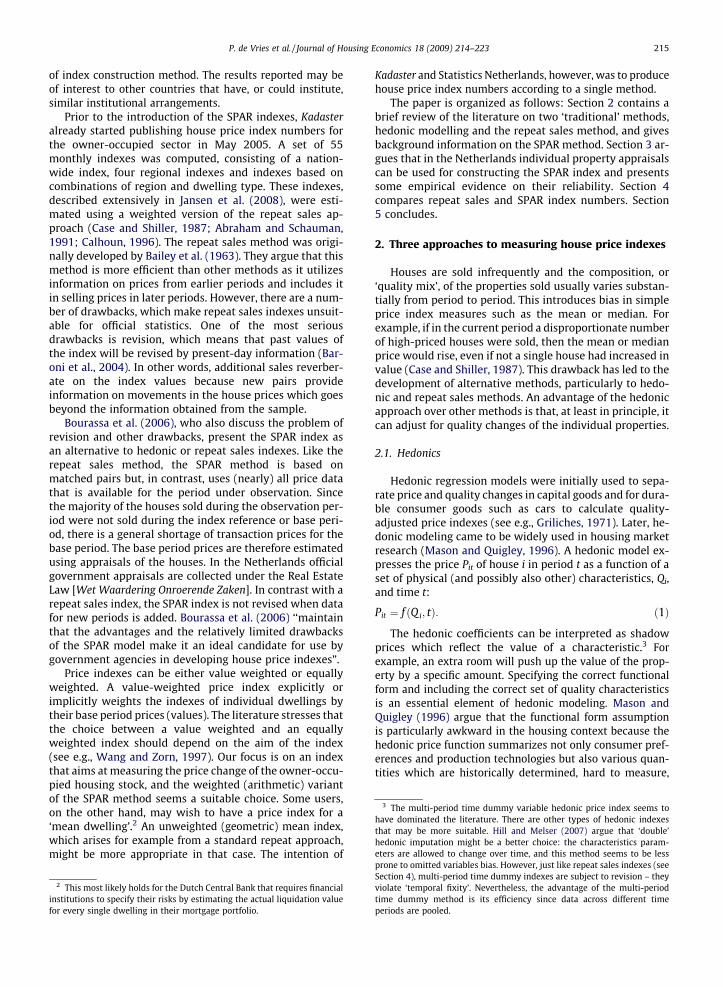
Fig. 1. Real house prices and appraisal values in January 2003.
Table 1Difference between real house prices and appraisal values.
Appraisal date Mean Aj (€) Mean rPj (€) Fraction rPj/Aj (€) Change in standard deviation (%) R2
January 1995 87,607 90,538 0.968 16.2 0.903January 1999 133,901 130,532 1.026 11.4 0.940January 2003 202,695 200,167 1.012 10.7 0.951
Source: Kadaster Netherlands, computation OTB and Statistics Netherlands.
218 P. de Vries et al. / Journal of Housing Economics 18 (2009) 214–223
study all municipalities in the province of Overijssel, ex-cept Hengelo and Dinkelland, granted us permission topublish the results, using definitive appraisal values for1995, 1999, and 2003. Unpublished research has shownthat our results are representative for the Netherlands asa whole.
A problem when comparing the current sale price Pit
and the appraisal value Ai0 is the difference in observationperiod. We therefore computed a ‘real’ house price, RPi0,using the repeat sales House Price Index (HPI) which waspublished by Kadaster until January 20088
RPi0 ¼ ðHPI0=HPItÞPit: ð4Þ
The scatter plot in Fig. 1, which is based on data of Jan-uary 2003 for the Province of Overijssel, shows the coher-ence between these values. For the SPAR approach to workwell, the relation between appraisals and actual (real)house prices should be linear with a zero intercept term(apart from any random disturbances). The linear regres-sion line is also shown in Fig. 1. The line almost crossesthe origin, and the fit is satisfactory with an R2 value of0.91. For 1995 and 1999 the R2 values are slightly lower:0.86 and 0.88.
8 The repeat sales House Price Index, published by Kadaster, has beencalculated by OTB Research Institute for Housing, Urban and MobilityStudies. For this study, we extended the time series to March 2009.
We conducted another simple but efficient comparisonof the real house prices and the appraisals, again for Janu-ary 1995, 1999, and 2003. The percentage differences be-tween the mean appraisal and the mean real house pricedeclined over time, indicating that the reliability of theappraisals has improved (Table 1). The decrease in thestandard deviation endorses these findings. In the first per-iod, the appraisal value underestimated the price by morethan one percent on average. In the second period, startingin 1999, the appraisal values overestimated the sale prices,but the absolute difference between the transaction pricesand the appraisals and the standard deviation decreasedconsiderably. The same pattern is observable in the thirdperiod.
Finally, we analyzed the ratio Fi0 of the real house priceand the appraisal value:
Fi0 ¼ ðRPi0=Ai0Þ: ð5Þ
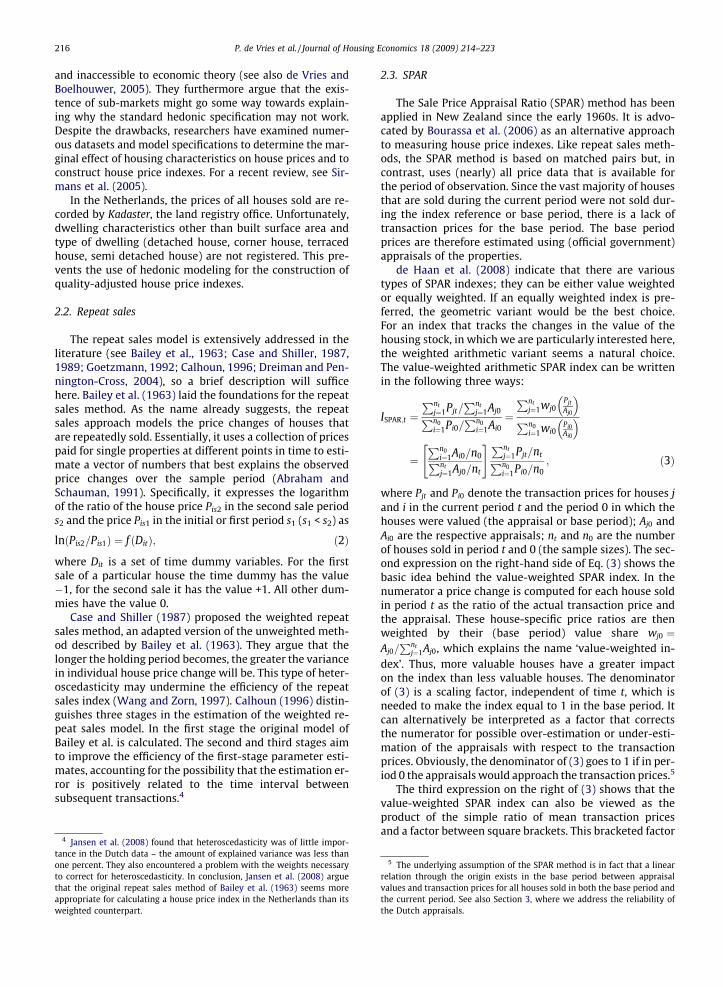
In line with the principles of the Dutch Real Estate Law,we expect the ratio Fi0 to be approximately equal to 1.Fig. 2 depicts the distribution of the ratios for each apprai-sal date using 20 classes of equal size on the x axis. The twomiddle classes (0.95–1.00 and 1.00–1.05) are in black toindicate the anticipated mid-point. The three graphs showthat the distribution became increasingly steeper overtime, indicating that more and more dwellings acquired a‘normal’ fraction. In 1995 the ratio Fi0 was between 0.90

1995
0.0
2.0
4.0
6.0
8.0
10.0
12.0
14.0
16.0
0.50thru0.55
0.55thru0.60
0.60thru0.65
0.65thru0.70
0.70thru0.75
0.75thru0.80
0.80thru0.85
0.85thru0.90
0.90thru0.95
0.95thru1.00
1.00thru1.05
1.05thru1.10
1.10thru1.15
1.15thru1.20
1.20thru1.25
1.25thru1.30
1.30thru1.35
1.35thru1.40
1.40thru1.45
1.45thru1.50
ratio
distribution (%)
1999
0.0
5.0
10.0
15.0
20.0
25.0
0.50thru0.55
0.55thru0.60
0.60thru0.65
0.65thru0.70
0.70thru0.75
0.75thru0.80
0.80thru0.85
0.85thru0.90
0.90thru0.95
0.95thru1.00
1.00thru1.05
1.05thru1.10
1.10thru1.15
1.15thru1.20
1.20thru1.25
1.25thru1.30
1.30thru1.35
1.35thru1.40
1.40thru1.45
1.45thru1.50
ratio
distribution (%)
2003
0.0
5.0
10.0
15.0
20.0
25.0
30.0
35.0
0.50thru0.55
0.55thru0.60
0.60thru0.65
0.65thru0.70
0.70thru0.75
0.75thru0.80
0.80thru0.85
0.85thru0.90
0.90thru0.95
0.95thru1.00
1.00thru1.05
1.05thru1.10
1.10thru1.15
1.15thru1.20
1.20thru1.25
1.25thru1.30
1.30thru1.35
1.35thru1.40
1.40thru1.45
1.45thru1.50
ratio
distribution (%)
Source: Kadaster Netherlands; computation OTB and Statistics Netherlands
Fig. 2. Distribution of the ratio of real house price and appraisal value in the province of Overijssel (the Netherlands).
P. de Vries et al. / Journal of Housing Economics 18 (2009) 214–223 219
and 1.10 for only 56% of all properties while it rose to 79%in 2003. Thus, the (real) house price and the appraisal va-lue have drawn closer together.
We believe that the quality of the official Dutch apprais-als – certainly as of January 2003 – is sufficient for calculat-ing a house price index based on the SPAR method. The
0
50
100
150
200
250
300
350
1995 1996 1997 1998 1999 2000 2001 2002 2003 2004 2005 2006 2007
index Jan 1995 = 100
repeat sales index
spar index
Source: Kadaster Netherlands; computation OTB and Statistics Netherlands
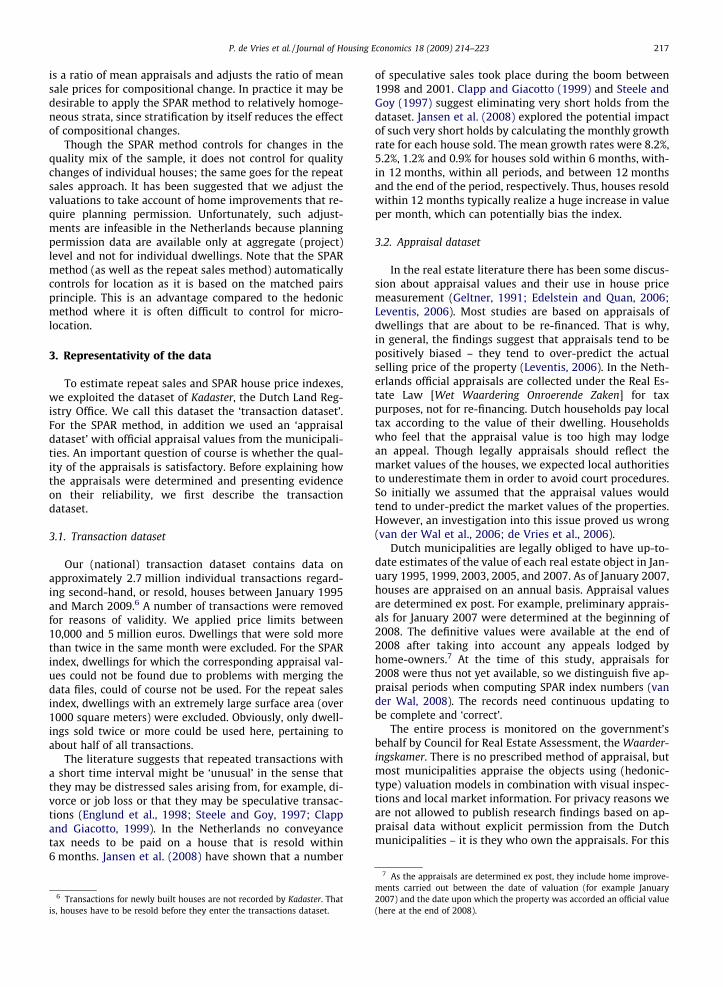
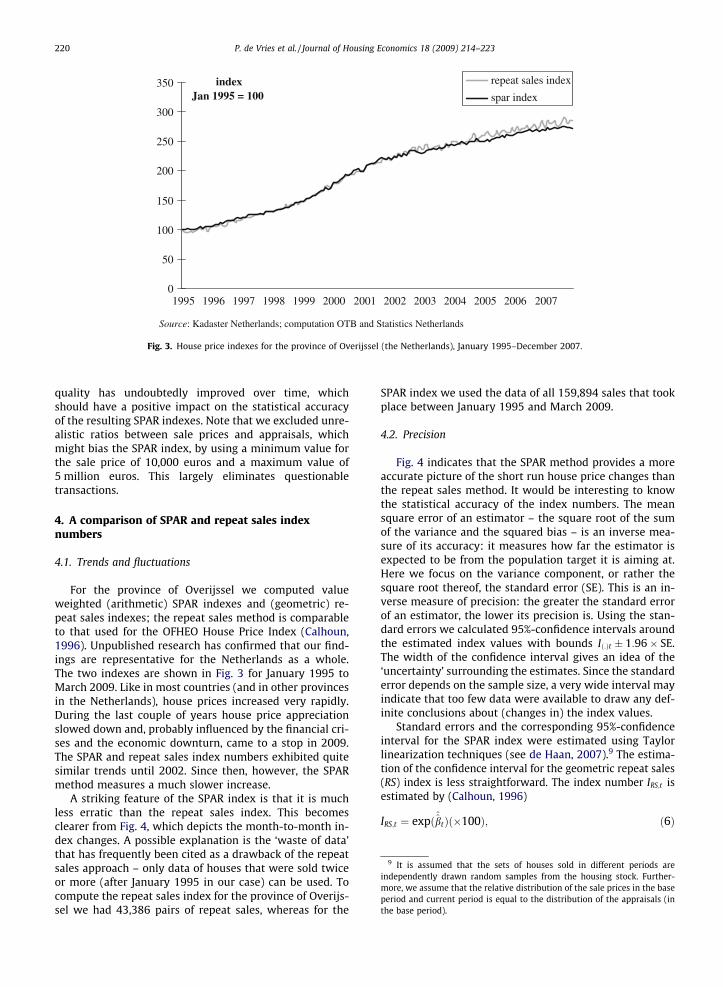
Fig. 3. House price indexes for the province of Overijssel (the Netherlands), January 1995–December 2007.
9 It is assumed that the sets of houses sold in different periods areindependently drawn random samples from the housing stock. Further-more, we assume that the relative distribution of the sale prices in the baseperiod and current period is equal to the distribution of the appraisals (inthe base period).
220 P. de Vries et al. / Journal of Housing Economics 18 (2009) 214–223
quality has undoubtedly improved over time, whichshould have a positive impact on the statistical accuracyof the resulting SPAR indexes. Note that we excluded unre-alistic ratios between sale prices and appraisals, whichmight bias the SPAR index, by using a minimum value forthe sale price of 10,000 euros and a maximum value of5 million euros. This largely eliminates questionabletransactions.
4. A comparison of SPAR and repeat sales indexnumbers
4.1. Trends and fluctuations
For the province of Overijssel we computed valueweighted (arithmetic) SPAR indexes and (geometric) re-peat sales indexes; the repeat sales method is comparableto that used for the OFHEO House Price Index (Calhoun,1996). Unpublished research has confirmed that our find-ings are representative for the Netherlands as a whole.The two indexes are shown in Fig. 3 for January 1995 toMarch 2009. Like in most countries (and in other provincesin the Netherlands), house prices increased very rapidly.During the last couple of years house price appreciationslowed down and, probably influenced by the financial cri-ses and the economic downturn, came to a stop in 2009.The SPAR and repeat sales index numbers exhibited quitesimilar trends until 2002. Since then, however, the SPARmethod measures a much slower increase.
A striking feature of the SPAR index is that it is muchless erratic than the repeat sales index. This becomesclearer from Fig. 4, which depicts the month-to-month in-dex changes. A possible explanation is the ‘waste of data’that has frequently been cited as a drawback of the repeatsales approach – only data of houses that were sold twiceor more (after January 1995 in our case) can be used. Tocompute the repeat sales index for the province of Overijs-sel we had 43,386 pairs of repeat sales, whereas for the
SPAR index we used the data of all 159,894 sales that tookplace between January 1995 and March 2009.
4.2. Precision
Fig. 4 indicates that the SPAR method provides a moreaccurate picture of the short run house price changes thanthe repeat sales method. It would be interesting to knowthe statistical accuracy of the index numbers. The meansquare error of an estimator – the square root of the sumof the variance and the squared bias – is an inverse mea-sure of its accuracy: it measures how far the estimator isexpected to be from the population target it is aiming at.Here we focus on the variance component, or rather thesquare root thereof, the standard error (SE). This is an in-verse measure of precision: the greater the standard errorof an estimator, the lower its precision is. Using the stan-dard errors we calculated 95%-confidence intervals aroundthe estimated index values with bounds Ið:Þt � 1:96� SE.The width of the confidence interval gives an idea of the‘uncertainty’ surrounding the estimates. Since the standarderror depends on the sample size, a very wide interval mayindicate that too few data were available to draw any def-inite conclusions about (changes in) the index values.
Standard errors and the corresponding 95%-confidenceinterval for the SPAR index were estimated using Taylorlinearization techniques (see de Haan, 2007).9 The estima-tion of the confidence interval for the geometric repeat sales(RS) index is less straightforward. The index number IRS;t isestimated by (Calhoun, 1996)
IRS;t ¼ expð^̂btÞð�100Þ; ð6Þ

-8.00
-6.00
-4.00
-2.00
0.00
2.00
4.00
6.00
8.00
1995 1996 1997 1998 1999 2000 2001 2002 2003 2004 2005 2006 2007
%-mutation repeat sales index
spar index
Source: Kadaster Netherlands; computation OTB and Statistics Netherlands
Fig. 4. Monthly %-change of the house price indexes for the province of Overijssel (the Netherlands), January 1995–December 2007.
P. de Vries et al. / Journal of Housing Economics 18 (2009) 214–223 221
where ^̂bt denotes the estimated parameter from a general-ized least squares regression. The corresponding standarderror is
rIRS;t ¼ IRS;trb̂t; ð7Þ
where rb̂tpertains to the standard error of the estimated
coefficient from the third step of the generalized leastsquares regression.
Since the magnitude of the standard error depends onthe level of the index, a relative measure of precisionwould be more appropriate. One such (inverse) measure,PRECt, is obtained by dividing the width of the confidenceinterval, WCt , by the index number (and multiplying by100):
PRECt ¼ ðWCt=Ið:Þ;tÞ � 100: ð8Þ
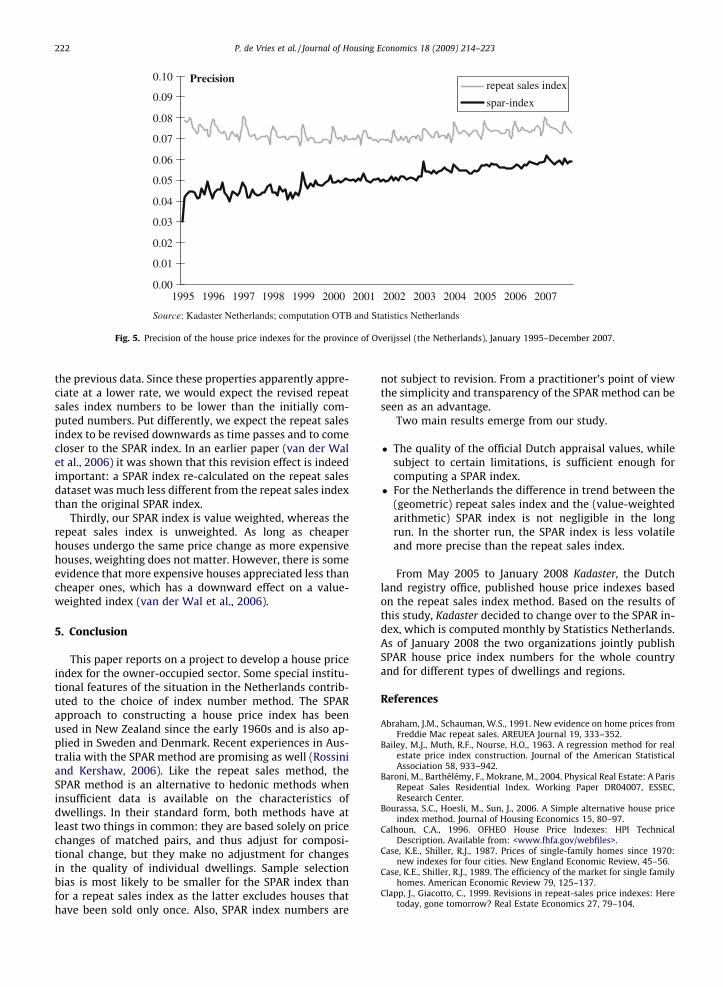
Fig. 5 displays the precision of both price indexesaccording to this relative measure. The SPAR index wasmore precise than the repeat sales index across the entireperiod. At first glance, this seems obvious given that theSPAR index utilizes all data. But there is a caveat. Each timehouses were re-valued – in our case in January 1999, Jan-uary 2003, January 2005, and January 2007 – a newshort-term SPAR index series was compiled, based on themost recent appraisal values. The five short-term serieswere subsequently multiplied to obtain the long-run seriesthat is shown in Fig. 3. This type of ‘chaining’ will in gen-eral raise the standard error of the long-run SPAR series be-cause each time a new source of sampling error, andmaybe also non-sampling error, is added (see also Shi,2008, who describes something similar. This cumulativeeffect can be seen in Fig. 5: the precision clearly decreasesin subsequent valuation periods.
If the ‘uncertainty’ of the chained SPAR index increasesover time, why do we use the newly available appraisals inthe first place? Why not stick to the old ones and computea direct, unchained index? The reason is that newly built
houses that are resold can only be incorporated throughchaining as, by definition, they have not been valued inthe past. A direct SPAR index would thus become lessand less representative for the (changing) housing stock.Furthermore, it would have been strange not to benefitfrom the improved quality of the appraisals, the more sobecause many users are interested in short-term houseprice movements rather than in very long time series.
4.3. Cause and effect
There are three potential explanations for the differencein the trend of the two indexes. Firstly, the repeat sales ap-proach leads to an index based on a geometric mean of theindividual appreciation rates, whereas our SPAR index hasan arithmetic structure. It is well known that a geometricindex is smaller than its arithmetic counterpart unless allappreciation rates are the same (Wang and Zorn, 1997).To check this, we also estimated arithmetic repeat sales in-dex numbers (Shiller, 1991). These indexes scarcely devi-ated from the usual geometric repeat sales indexnumbers. Conversely, geometric SPAR index numbers ap-peared to differ only marginally from the arithmetic SPARnumbers. Thus, in our dataset the effect of using geometricor arithmetic means was negligible.
Secondly, the two indexes are computed from differentsamples. The SPAR index uses all transaction data, whereasthe repeat sales index only uses data of houses that havebeen repeatedly sold. The mean house price in the repeatsales dataset was approximately 8% lower than the meanhouse price in the SPAR dataset. Jansen et al. (2008) ob-served that Dutch properties resold within short timeintervals appreciate at a higher rate than properties resoldwithin longer time intervals (see also Clapp and Giacotto,1999). In a repeat sales index, after additional sales comeavailable, new matched pairs of houses provide additionalinformation about price changes beyond that found with
0.00
0.01
0.02
0.03
0.04
0.05
0.06
0.07
0.08
0.09
0.10
1995 1996 1997 1998 1999 2000 2001 2002 2003 2004 2005 2006 2007
Precisionrepeat sales index
spar-index
Source: Kadaster Netherlands; computation OTB and Statistics Netherlands
Fig. 5. Precision of the house price indexes for the province of Overijssel (the Netherlands), January 1995–December 2007.
222 P. de Vries et al. / Journal of Housing Economics 18 (2009) 214–223
the previous data. Since these properties apparently appre-ciate at a lower rate, we would expect the revised repeatsales index numbers to be lower than the initially com-puted numbers. Put differently, we expect the repeat salesindex to be revised downwards as time passes and to comecloser to the SPAR index. In an earlier paper (van der Walet al., 2006) it was shown that this revision effect is indeedimportant: a SPAR index re-calculated on the repeat salesdataset was much less different from the repeat sales indexthan the original SPAR index.
Thirdly, our SPAR index is value weighted, whereas therepeat sales index is unweighted. As long as cheaperhouses undergo the same price change as more expensivehouses, weighting does not matter. However, there is someevidence that more expensive houses appreciated less thancheaper ones, which has a downward effect on a value-weighted index (van der Wal et al., 2006).
5. Conclusion
This paper reports on a project to develop a house priceindex for the owner-occupied sector. Some special institu-tional features of the situation in the Netherlands contrib-uted to the choice of index number method. The SPARapproach to constructing a house price index has beenused in New Zealand since the early 1960s and is also ap-plied in Sweden and Denmark. Recent experiences in Aus-tralia with the SPAR method are promising as well (Rossiniand Kershaw, 2006). Like the repeat sales method, theSPAR method is an alternative to hedonic methods wheninsufficient data is available on the characteristics ofdwellings. In their standard form, both methods have atleast two things in common: they are based solely on pricechanges of matched pairs, and thus adjust for composi-tional change, but they make no adjustment for changesin the quality of individual dwellings. Sample selectionbias is most likely to be smaller for the SPAR index thanfor a repeat sales index as the latter excludes houses thathave been sold only once. Also, SPAR index numbers are
not subject to revision. From a practitioner’s point of viewthe simplicity and transparency of the SPAR method can beseen as an advantage.
Two main results emerge from our study.
� The quality of the official Dutch appraisal values, whilesubject to certain limitations, is sufficient enough forcomputing a SPAR index.
� For the Netherlands the difference in trend between the(geometric) repeat sales index and the (value-weightedarithmetic) SPAR index is not negligible in the longrun. In the shorter run, the SPAR index is less volatileand more precise than the repeat sales index.
From May 2005 to January 2008 Kadaster, the Dutchland registry office, published house price indexes basedon the repeat sales index method. Based on the results ofthis study, Kadaster decided to change over to the SPAR in-dex, which is computed monthly by Statistics Netherlands.As of January 2008 the two organizations jointly publishSPAR house price index numbers for the whole countryand for different types of dwellings and regions.
References
Abraham, J.M., Schauman, W.S., 1991. New evidence on home prices fromFreddie Mac repeat sales. AREUEA Journal 19, 333–352.
Bailey, M.J., Muth, R.F., Nourse, H.O., 1963. A regression method for realestate price index construction. Journal of the American StatisticalAssociation 58, 933–942.
Baroni, M., Barthélémy, F., Mokrane, M., 2004. Physical Real Estate: A ParisRepeat Sales Residential Index. Working Paper DR04007, ESSEC,Research Center.
Bourassa, S.C., Hoesli, M., Sun, J., 2006. A Simple alternative house priceindex method. Journal of Housing Economics 15, 80–97.
Calhoun, C.A., 1996. OFHEO House Price Indexes: HPI TechnicalDescription. Available from: <www.fhfa.gov/webfiles>.
Case, K.E., Shiller, R.J., 1987. Prices of single-family homes since 1970:new indexes for four cities. New England Economic Review, 45–56.
Case, K.E., Shiller, R.J., 1989. The efficiency of the market for single familyhomes. American Economic Review 79, 125–137.
Clapp, J., Giacotto, C., 1999. Revisions in repeat-sales price indexes: Heretoday, gone tomorrow? Real Estate Economics 27, 79–104.

P. de Vries et al. / Journal of Housing Economics 18 (2009) 214–223 223
de Haan, J., 2007. Formulae for the Variance of (Changes in) the SPARIndex. Mimeo, Statistics Netherlands, Voorburg, The Netherlands [inDutch].
de Haan, J., van der Wal, E., de Vries, P., 2008. The Measurement of HousePrices: A Review of the SPAR Method. Statistics Netherlands.Available from: <www.cbs.nl>.
de Vries, P., Boelhouwer, P.J., 2005. Local house price developments andhousing supply. Property Management 23, 80–96.
de Vries, P., Jansen, S.T., Lamain, C., Boelhouwer, P.J., Coolen, H.C.C.H., vander Wal, E., ter Steege, D., 2006. Market Price and Appraisal Value inthe Province of Overijssel, Kadaster, Apeldoorn, The Netherlands [inDutch].
Diewert, W.E., 2003. The Treatment of Owner Occupied Housing andOther Durables in a Consumer Price Index. Discussion Paper No. 95-01, Department of Economics, University of British Columbia,Vancouver. Available from: <www.econ.ubc.ca/discpapers>.Forthcoming In: Diewert, W.E., Greenlees, J., Hulten, C. (Eds.), PriceIndex Concepts and Measurement, NBER Studies in Income andWealth. University of Chicago Press.
Dreiman, M.H., Pennington-Cross, A., 2004. Alternative methods ofincreasing the precision of weighted repeat sales house priceindices. Journal of Real Estate Finance and Economics 28, 299–317.
Edelstein, R.H., Quan, D.C., 2006. How does appraisal smoothing bias realestate returns measurement? Journal of Real Estate Finance andEconomics 32, 41–60.
Englund, P., Quigley, J.M., Redfearn, C., 1998. Improved price indexes forreal estate: measuring the course of Swedish housing prices. Journalof Urban Economics 44, 171–196.
Geltner, D.M., 1991. Smoothing in appraisal-based returns. Journal of RealEstate Finance and Economics 4, 327–345.
Goetzmann, A., 1992. The accuracy of real estate indices: repeat salesestimators. Journal of Real Estate Finance and Economics 5, 5–53.
Griliches, Z., 1971. Price Indices and Quality Change. Harvard UniversityPress, Cambridge, MA.
Hill, R.J., Melser, D., 2007. Hedonic imputation and the price indexproblem: an application to housing. Economic Inquiry 46, 593–609.
Jansen, S.T., de Vries, P., Coolen, H.C.C.H., Lamain, C., Boelhouwer, P.J.,2008. Developing a house price index for the Netherlands: a practicalapplication of weighted repeat sales. Journal of Real Estate Financeand Economics 37, 163–186.
Leventis, A., 2006. Removing Appraisal Bias from a Repeat-transactionsHouse Price Index: A Basic Approach. OFHEO Working Paper 06-1.
Mason, C., Quigley, J.M., 1996. Non-parametric hedonic housing prices.Housing Studies 11, 373–385.
Rossini, P., Kershaw, P., 2006. Developing a Weekly Residential PriceIndex Using the Sales Price Appraisal Ratio. Paper presented at thetwelfth Annual Pacific-Rim Real Estate Society Conference, 22–25January 2006, Auckland.
Shi, S., 2008. Evaluating a House Price Index Based on the Sale PriceAppraisal Ratio (SPAR) Method. Research Paper, Department ofEconomics and Finance, Massey University, New Zealand.
Shiller, R., 1991. Arithmetic repeat sales price estimators. Journal ofHousing Economics 1, 110–126.
Sirmans, G.S., Macpherson, D.A., Zietz, J., 2005. The composition ofhedonic pricing models. Journal of Real Estate Literature 13, 3–43.
Steele, M., Goy, R., 1997. Short holds, the distributions of first and secondsales, and bias in the repeat-sales price index. Journal of Real EstateFinance and Economics 14, 133–154.
van der Wal, E., 2008. Price Index Owner-occupied Existing Dwellings:Method Description. Available from: <www.cbs.nl>.
van der Wal, E., ter Steege, D., Kroese, B., 2006. Two Ways to Construct aHouse Price Index for the Netherlands: The Repeat Sale and the SalePrice Appraisal Ratio. Paper presented at the OECD-IMF Workshop onReal Estate Price Indexes, Paris, 6–7 November 2006.
Wang, F.T., Zorn, P.M., 1997. Estimating house price growth with repeatsales data: What’s the aim of the game? Journal of Housing Economics6, 93–118.