a hybrid continuum–discrete modelling approach to predict...
TRANSCRIPT

Phil. Trans. R. Soc. A (2010) 368, 2937–2960doi:10.1098/rsta.2010.0085
A hybrid continuum–discrete modellingapproach to predict and control angiogenesis:analysis of combinatorial growth factor and
matrix effects on vessel-sprouting morphologyBY ANUSUYA DAS*, DOUGLAS LAUFFENBURGER, HARRY ASADA
AND ROGER D. KAMM
Biological Engineering, Massachusetts Institute of Technology,Cambridge, MA, USA
Angiogenesis is crucial during many physiological processes and is influenced by variousbiochemical and biomechanical factors. Models have proved useful in understanding themechanisms of angiogenesis and also the characteristics of the capillaries formed aspart of the process. We have developed a three-dimensional hybrid, agent–field modelwhere individual cells are modelled as sprout-forming agents in a matrix field. Cellindependence, cell–cell communication and stochastic cell response are integral partsof the model. The model simulations incorporate probabilities of an individual cell totransition into one of four stages—quiescence, proliferation, migration and apoptosis.We demonstrate that several features, such as continuous sprouts, cell clustering andbranching, that are observed in microfluidic experiments conducted under controlledconditions using few angiogenic factors can be reproduced by this model. We also identifythe transition probabilities that result in specific sprout characteristics such as longcontinuous sprouts and specific branching patterns. Thus, this model can be used tocluster sprout morphology as a function of various influencing factors.
Keywords: angiogenesis; stochastic modelling; three-dimensional model
1. Introduction
Angiogenesis is the formation of new blood vessels from a monolayer ofcells or by the reorganization of capillaries via morphogenesis. It is crucialduring development, and for physiological processes like menstrual cycles andreproduction. Two other cases are of particular interest. First, angiogenesisoccurs during invasive tumour growth because of the additional nourishmentrequired by the tumour. Second, it is essential for tissue engineering purposesbecause it is necessary to be able to predict and control capillary development inscaffolds during in vitro tissue development. The primary stages of angiogenesiscan be categorized as (i) endothelial cell (EC) activation by chemotactic agents,(ii) secretion of proteases into the matrix, (iii) selection of ECs for sprouting,*Author for correspondence ([email protected]).
One contribution of 13 to a Theme Issue ‘The virtual physiological human: computer simulationfor integrative biomedicine II’.
This journal is © 2010 The Royal Society2937
on June 16, 2018http://rsta.royalsocietypublishing.org/Downloaded from

2938 A. Das et al.
(iv) capillary growth, (v) tubulogenesis (vi) non-angiogenic growth of bloodvessels via capillary loop formation, and (vii) formation of second-generationcapillaries (Adams & Alitalo 2007).
The process of angiogenesis is regulated by a balance between several pro-angiogenic and anti-angiogenic factors. Over the years, numerous factors—VEGF,PLGF, PDGF, TNF-a, TGF-b, a-FGF, b-FGF, ENA/VASP (Folkman & Shing1992), angiopoietin-1 (Ang-1), angiopoietin-2 (Ang-2) (Davis et al. 1996) andchemokines like PF4 (Slungaard 2005)—have been shown to influence the process.Additionally, it has also been demonstrated that mechanical factors such as flow,extra-cellular matrix (ECM) stiffness and surface shear stress each affects theextent and directionality of capillary formation. Helm et al. (2005) showed thatinterstitial flow of the order of 1 mm s−1 in combination with VEGF induceddirectionality in capillary structures (in the direction of flow) and caused fibrin-bound VEGF to be released via proteolysis. Yamamura et al. (2007) studiedthe effect of substrate stiffness on bovine pulmonary microvascular endothelialcells (BPMECs) and demonstrated that BPMECs cultured on flexible collagengels form networks in 3 days and show extensive sprouting and formation ofcomplex networks in 5 days, whereas the cells cultured on stiffer gels tend toform aggregates and thicker networks.
Angiogenesis modelling is a useful tool for understanding the interplay betweenall the factors that affect it and for the design of experiments of a predictivenature. Over the years, various models spanning different scales and focusing ondifferent aspects of angiogenesis have been developed. These can be classified ascontinuum models (Dallon & Othmer 1997; Anderson & Chaplain 1998; Levineet al. 2000; Chaplain & Anderson 2004; Chaplain et al. 2006; Chaturvedi et al.2005) and discrete models (Stokes & Lauffenburger 1991; Anderson & Chaplain1998; Mantzaris et al. 2004; Chaplain et al. 2006).
The continuum models are based on conservation equations for chemotacticand haptotactic gradients. In one such continuum model, the Chaplain groupmodels a ‘tissue response unit’, which includes an EC, tumour angiogenic factorand a generic matrix molecule. The numerical solution is obtained from a finite-difference approximation subject to no flux boundary conditions and a specifiedinitial condition. They have also developed a discretized version of the continuummodel where the motion of the capillary in response to a tumour is governed bythe EC at the tip (Anderson & Chaplain 1998).
The cellular Potts model (CPM) is a lattice-based model developed to describethe behaviour of cellular structures and their interactions. It could be anagent-based model, which is a computational model that is based on one (ormore) specific component(s) and its effect on the individual cells (agents) beingmodelled. A two-dimensional agent-based model of angiogenesis based on CPMhas been developed by Peirce et al. (2004), where they identify multiple celltypes and growth factors. Their cell-level rule-based model of network growthin mesenteric tissue predicts new vessel formation, vessel length extensions andrecruitment of contractile perivascular cells in response to localized pressure,circumferential strain and focal application of growth factors. The Sherrattgroup has used an extension of the Potts model to simulate malignant cellsand quantify invasion morphology as a function of cell–cell adhesion (Turner &Sherratt 2002). In a different approach, the Popel group has developed a multi-scale integrative model with specific modules for various growth factor receptor
Phil. Trans. R. Soc. A (2010)
on June 16, 2018http://rsta.royalsocietypublishing.org/Downloaded from

Continuum–discrete model of angiogenesis 2939
pairs and ECM proteolysis (Qutub et al. 2009). Their model considers oxygendelivery by haemoglobin-based oxygen carriers (Tsoukias et al. 2007), the cellularresponse to oxygen in skeletal muscles (Ji et al. 2005) and a cell-based model thatresults in angiogenesis via reorganization of existing capillaries (Qutub & Popel2009). Other models include a random walk model (Plank & Sleeman 2004a,b)which is distinguished by the fact that it places no restrictions on the direction ofcapillary growth, an individual cell-based two-dimensional mathematical modelof tumour angiogenesis in response to a diffusible angiogenic factor (Plank &Sleeman 2004a,b) and a fractal-based model in which the smaller pieces ofthe system show ‘statistical self-similarity’ to the whole and the anatomicalentities are given a fractal dimension. Random walk models that incorporatebiochemical cascades when VEGF binding occurs have also been developed (Levinet al. 2002). Physiological models like one of corneal angiogenesis have alsobeen developed. Jackson & Zheng (2010) have developed one such model thatintegrates a mechanical model of elongation with a biochemical model of cellphenotype variation. Despite the wide variety in the modelling approach, mostof the models focus on tumour angiogenesis instead of in vitro capillary growth,and may lack one of the following: stochasticity, a three-dimensional frameworkor simplified binding kinetics, and are therefore difficult to apply in practicefor tissue engineering applications. A combination of these characteristics in amodel used for tissue engineering applications will be very useful. Finally, modelvalidation in many of the existing models is a challenge owing to the difficultyin controlling all important factors in vivo combined with limited capability ofmost in vitro systems to replicate angiogenesis.
The complex biological processes leading to capillary morphogenesis are aconsequence of cell-level decisions that are based on global broadcast signals,limited near-neighbour communication and stochastic decision-making withfeedback control. Integrating these factors, a cell becomes programmed to followone of several state trajectories that could be characterized as quiescence, division,apoptosis or migration. We have developed a model to address the needs forgreater understanding of the process and for a practical tool with predictivecapabilities.
This is a three-dimensional coarse-grained multi-scale hybrid model where eachcell is modelled as an individual decision-making entity and cell–cell interactionsare incorporated via the combined effect of cells on the matrix and the effect ofthe surrounding matrix in the individual cell decision-making process. Thus, thismodel demonstrates the phenomenon that when individual cells are modelledindependently according to a set of rules and when cell–cell communicationis embedded, the cell ensemble results in capillaries with features that can beattained experimentally in bioreactors for controlled tissue engineering purposes.It also provides a platform for bracketing these cell-ensemble results into clusterswith different sprout characteristics and identifying the factors that affect them.Most importantly, this paper presents a model framework designed alongsideexperimental constraints and one that can simulate capillaries like the onesgenerated in an in vitro microfluidic system. This model–experiment cross-talk iscrucial in identifying the effect of individual influencing factors on angiogenesis.
A major driving force in this model is its usefulness in predicting the angiogenicresponse in a closely regulated experimental platform with the objective ofproviding validation and of implementing feedback control over a prototypical
Phil. Trans. R. Soc. A (2010)
on June 16, 2018http://rsta.royalsocietypublishing.org/Downloaded from

2940 A. Das et al.
cell culturemedia
angiogenicstimuli
gel scaffold
model domain
EC monolayer onthe side wall of flow channel
Figure 1. Horizontal flow reactor where capillaries are formed from the monolayer seeded onto onesurface of the gel (adapted from Vickerman et al. 2008). The region included in the model domainis boxed.
biological process. One such experimental platform is the microfluidic systemrecently developed by our group (Vickerman et al. 2008). The first step inanalysing model predictions is to identify a set of relevant sprout characteristicsthat would be useful in measuring the effect of different conditions and couldbe easily measured in real time during an experiment. These features are thencompared with the simulation results.
2. Methods
This section outlines the basic steps in model development and the experimentalsystem used for validation.
(a) Experimental system
A two-channel microfluidic device (figure 1) fabricated in PDMS was used forall experiments. Human microvascular endothelial cells (Lonza, CC-0207, Batchno. 0000097428) were seeded as a monolayer on collagen I, which acted as thematrix. The device has four ports for media, two for each channel, and two gelfilling ports. It is similar to one described in Vickerman et al. (2008). Cells werestained with 0.01 mM Hoestch nuclear dye and 20 mM 5-chloromethylfluoresceindiacetate (CMFDA; CellTracker Green CMFDA; Molecular Probes, Invitrogen,C7025) cytoplasmic dye. Phase-contrast and confocal microscopies were used tomonitor capillary development under different treatment conditions.
(b) Model development
The model is discrete and can be divided into two distinct parts or modules: oneis stochastic and the other is deterministic. These modules communicate with eachother to predict capillary formation as a function of the local microenvironmentincluding the effects of growth factors and matrix properties. This interplay isdepicted in figure 2. This is a three-dimensional lattice model based on Markovprocesses, where at any time point each lattice point can be occupied by a cell,the matrix or remain empty. A cell can be in one of three states: quiescent,
Phil. Trans. R. Soc. A (2010)
on June 16, 2018http://rsta.royalsocietypublishing.org/Downloaded from

Continuum–discrete model of angiogenesis 2941
field
via field
initial conditions
(a) (b)
cell state
morphology
Figure 2. The two components of the model: (a) deterministic field and (b) stochastic cellpopulation behaviour. The field represents the set of deterministic equations that specify the localmicroenvironment. Variables that specify the state of the field act locally on the cells, determiningtheir state and morphology governed by probability distributions. Feedback occurs by virtue of thefactors secreted by the cells such as growth factors and degradation enzymes.
migrating or proliferating. It can also undergo apoptosis, at which point thelattice point becomes empty. Every lattice point that is occupied by the matrix isreferred to as the ‘field’ and has associated with it concentrations of the variousgrowth factors and matrix properties. In its current form, the model only includesVEGF, Ang-1 and MMP concentrations and matrix stiffness. However, this canbe easily extended to include any number of growth factors and is modular innature. Capillary features successfully depicted in this three-dimensional modelare continuous sprouts, secondary and tertiary branches and cell clusters—all ofwhich are observed in experiments. Three-dimensional modelling enables capillarysurface area and protrusion volume calculations in the simulations and theircomparison to experiments conducted in microfluidic devices. It also enables theproper representation of the factors in the surrounding matrix and their effectson individual cell response.
The deterministic component of the model includes the diffusion–convection–reaction equations that govern these growth factor concentrations. All cell–cellcommunication occurs via the field, i.e. the surrounding matrix. Direct cell–cellinteractions were avoided to support the independence of each cell. Otherwise, themodel would have to deal with joint probabilities of multiple cells, which are quiteintricate. On the other hand, by making this assumption, we are still ensuring thatthe essence of cell–cell interactions is included while minimizing model complexity.This is done by a field variable termed the ‘connectivity factor’. Anything the cell‘gives’ or ‘receives’ from a nearby cell is done via this field-associated factor.
A cell can exist in four main states: migrating (M ), proliferating (P), quiescent(Q) and apoptotic (A). Its transition between states is depicted in figure 3.Once it undergoes transition to either a migratory or a proliferating state, itsubsequently passes through a series of sub-states. The number of these sub-states
Phil. Trans. R. Soc. A (2010)
on June 16, 2018http://rsta.royalsocietypublishing.org/Downloaded from

2942 A. Das et al.
M1
M2
M3
Mm
QA
P1
P2 P3
P4
Pp
11
1
1
1
1
1
1
pQ→P
pQ→Q
pQ→M
apoptotic
proliferating
migratory
Figure 3. States in the Markov process: the state of a single cell can evolve from quiescent (Q), toproliferating (P), migratory (M ) or apoptotic (A). Once in the migratory or proliferating states, thecell remains there for ‘m’ or ‘p’ sequential sub-states, respectively, before returning to quiescence.From the apoptotic state, the cell dies after a specified period and cannot again become quiescent.
is determined by the time of persistence of migration and the average cell cycleof an individual cell, thereby enabling us to account for differences in the timescales of these processes. Consequently, if a cell can exist in ‘m’ migratory sub-states and ‘p’ dividing sub-states, a transition probability matrix is established.Transition probabilities, e.g. pQ→Q , pQ→M (1), pQ→P(1), pQ→A, where M (1) andP(1) are the first steps of the respective processes, depend on the global (g) andlocal (l) conditions such as growth factor concentration and matrix properties ina manner described below.
The transition of each cell from one state at time t to another at time t + Dt isstochastic and is a function of its current state, the condition of the surroundingmatrix and external governing factors such as the presence or absence of flow, thegrowth factors present in neighbouring matrix and initial matrix stiffness. Thatis, transition from state Xt to Xt+Dt is described as Xt+Dt = f (Xt , U t(g), U t(l)),where U t(g) are the global or external factors and U t(l) are the local factors or thecharacteristic of the surrounding matrix and measured by the output Y t . Certainvariables like growth factor concentrations only affect the local environmentwhile other factors like flow and pressure gradients have a global effect. Thedifference being, in the case of global influence, the same function is applied atall spatial locations, while in the case of local variables, the changes are calculatedat each lattice point. This function is represented in the model as a transitionprobability.
Phil. Trans. R. Soc. A (2010)
on June 16, 2018http://rsta.royalsocietypublishing.org/Downloaded from

Continuum–discrete model of angiogenesis 2943
(i) Field equations
The field equations in this model are presented below and can be simplifiedwhen required to provide feedback control. The field equations are written inthis instance to include one growth factor, VEGF, and one protease, MMP.Similar equations for other factors can be easily incorporated. Cvegf_s, Cvegf_b,Cvegf_r, CMMP, M and Mcl are the concentrations of soluble VEGF, VEGF boundto matrix, VEGF bound to receptor, MMP, matrix-binding sites available forbinding to MMP and cleaved matrix, respectively.
The following governing equations describe Cvegf_s, Cvegf_b, CMMP and M ,where Dvegf is the diffusion coefficient of soluble VEGF, DMMP is the diffusioncoefficient of MMP and v is the interstitial flow velocity causing convectivetransport of VEGF. kon_m and koff_m are the binding constants for the reactionbetween soluble VEGF and binding motifs in the matrix. kon_c and koff_c are thebinding constants for the reaction between soluble VEGF and VEGF receptors onthe ECs. f is the density of cells and Cvegf_rec is the number of VEGF receptors perunit volume, equal to the number of receptors on a single cell times f. Prvegf andPrMMP are the rate of production of VEGF and MMP by a single cell, respectively.f will be set equal to 1 for those grid points containing a cell (since we assumehere a density of one cell per unit volume), and f = 0 for matrix. kc_m is the rateat which the the matrix is cleaved by MMP.
The binding kinetics for the VEGF, MMP and matrix-binding sites (M ) are:
Cvegf_s + Cvegf_r � Cvegf_r, (2.1)
rate constants kon_c and koff_c
f −→ CMMP, (2.2)
production rate PrMMP
CMMPM −→ Mcl, (2.3)
rate constant kc_m.The governing conservation equations are those for soluble VEGF:
vCvegf_s
vt= −�v · VCvegf_s + DvegfV
2Cvegf_s + Rvegf_s, (2.4)
where
Rvegf_s = −kon_mCvegf_sM + koff_mCvegf_b − kon_cCvegf_sCvegf_rec
+ koff_cCvegf_r + Prvegff;
for bound VEGF:vCvegf_b
vt= Rvegf_b, (2.5)
where
Rvegf_b = kon_mCvegf_sM − koff_mCvegf_b − kc_mCMMPVvegf_b;
for MMP:vCMMP
vt= −�v.VCMMP + DMMPV2CMMP + RMMP, (2.6)
Phil. Trans. R. Soc. A (2010)
on June 16, 2018http://rsta.royalsocietypublishing.org/Downloaded from

2944 A. Das et al.
whereRMMP = PrMMPf;
and for the concentration of matrix-binding sites:
vMvt
= RM, (2.7)
whereRM = −kc_mCMMPM .
Assuming local chemical equilibrium and given the fact that VEGF (VEGF-165Isoform) binding to the matrix (collagen I) at pH 7.4 is negligible (Goerges &Nugent 2004), the equations simplify further. Also, there is no convectivetransport owing to interstitial flow, but this can be added to the model easily.
The first two equations are simplified as follows:
vCvegf_s
vt= DvegfV
2Cvegf_s + Rvegf_s, (2.8)
whereRvegf_s = −kon_cCvegf_sCvegf_rec + koff_cCvegf_r + Prvegff
and
vCvegf_b
vt∼ 0. (2.9)
These equations are discretized and used in instances where all the parametersare known. While most have been experimentally derived, some of the parametervalues would still be subject to considerable uncertainty. In those cases, anapproximation was made.
The diffusion term in equations (2.8) is discretized spatially as follows:
(DvegfV2Cvegf_s)x ,y,z ,t
= Dvegf[(Cvegf_s)x ,y,z+1,t − 2(Cvegf_s)x ,y,z ,t + (Cvegf_s)x ,y,z−1,t
]
[Dz2]+ Dvegf
[(Cvegf_s)x+1,y,z ,t − 2(Cvegf_s)x ,y,z ,t + (Cvegf_s)x−1,y,z ,t
]
[Dx2]+ Dvegf
[(Cvegf_s)x ,y+1,z ,t − 2(Cvegf_s)x ,y,z ,t + (Cvegf_s)x ,y−1,z ,t
]
[Dy2] , (2.10)
where Dx , Dy and Dz are the spacings of the computational grid in x , yand z , respectively, and are equal to 10 mm (figure 4). The diffusion term inequation (2.6) is discretized similarly.
For the reaction terms, the following methodology is used. The concentrationof the biomolecules being modelled will locally change in a single time stepby an amount that is dictated by local conditions. This change in theconcentration is a sum of the local consumption and production of that molecule
Phil. Trans. R. Soc. A (2010)
on June 16, 2018http://rsta.royalsocietypublishing.org/Downloaded from

Continuum–discrete model of angiogenesis 2945
20
(a) (b)
15
10
5
20
20
18
16
14
12
10
8
6
4
2
15
10
5
5.04.5
4.03.5
3.0 05
1015
20
020
1510
5 510
1520
Figure 4. Occurrence of cell–cell communication occurs via the field. (a) The simulation showsa sprout growing in a three-dimensional lattice normalized to the characteristic length of a cell(10 mm). (b) The field evolution shows the change in the free matrix-binding sites normalized tothe maximum concentration in three spatial coordinates. This demonstrates the effect of migratingcells on the matrix via the MMPs as a change in their concentration is observed in the regionsurrounding a developed sprout.
and is expressed asR = DCi,P,j − DCi,C,j , (2.11)
and whereDCi,C,j = (Ci,C,j)t+Dt − (Ci,C,j)t
andDCi,P,j = (Ci,P,j)t+Dt − (Ci,P,j)t .
These could potentially be experimentally determined by measuring changes inthe concentration of signalling molecules, MMP and matrix around a singlecell. This can be done by using fluorescent collagen and measuring the matrixproperties around individual cells. However, as such experimental data forindividual cells are not available, these DC values can be empirically establishedrelative to the rates of production and degradation of these substances byquantifying the qualitative effects on individual cells. When those are beingascertained, DCi,C,j and DCi,P,j represent step functions associated with thischange at the jth level in the concentration of the ith biomolecule includedin the model owing to consumption and production by the cells, respectively.In the simulation results included in this paper, we have used a two-levelchange for the biomolecules being considered, i.e. high production/consumptionor low production/consumption. These changes depend on the cell state and thesurrounding matrix characteristics. One can imagine that instead of having only ahigh and low value (e.g. where j = 1 or 2) for each of these reactions, we can havefiner increments where each element is dependent on the different permutationsand combinations of other factors in the field. The existing model frameworkallows for such expansion depending on the different pro- and anti-angiogenicfactors being considered.
Phil. Trans. R. Soc. A (2010)
on June 16, 2018http://rsta.royalsocietypublishing.org/Downloaded from

2946 A. Das et al.
The equations are discretized over time and the spatial derivatives arecalculated at time t.
Equation (2.8) is discretized as
D(Cvegf_s)x ,y,z
Dt= DvegfV
2Cvegf_s + (Rvegf_s)x ,y,z , (2.12)
where(Rvegf_s)x ,y,z = DCvegf_s,P,j − DCvegf_s,C,j ,
and where
DCvegf_s,C,j = (Cvegf_s,C,j)t+Dt − (Cvegf_s,C,j)t
and
DCvegf_s,P,j = (Cvegf_s,P,j)t+Dt − (Cvegf_s,P,j)t .
At a time t, the amount of VEGF produced and consumed via binding to thecells is a function of the cell state and the state of the surrounding matrixconcentration of soluble VEGF, i.e. Cvegf_s in the lattice. Thus, the reactionterms are evaluated based on the cell state. kon_c and koff_c values were obtainedfrom the literature (Mac Gabhann & Popel 2007). Hence, the amount of VEGFconsumed (DCvegf_s,C,i) is determined by the rate equation. However, as it isdifficult to obtain the amount of VEGF produced by an individual cell, it wasapproximated by the following method. If there is a migrating cell at a givenlattice point, we assume it produces a certain amount of VEGF (DCvegf_s,P,1)if the surrounding VEGF concentration is below a certain threshold and adifferent amount (DCvegf_s,P,2) when it is above a threshold. This threshold ofthe surrounding VEGF is 12 units (or 24 ng ml−1 normalized to the minimumconcentration of VEGF, i.e. 2 ng ml−1). This was chosen because it has beenshown that VEGF induces its own expression in microvascular ECs in a STAT3-dependent fashion when the cells are treated with 25 ng ml−1 VEGF (Bartoli et al.2003).
Assuming negligible interstitial flow, equation (2.6) is discretized as
D(CMMP)x ,y,z
Dt= DMMPV2CMMP + (RMMP)x ,y,z . (2.13)
The change in MMP concentration owing to production in equation (2.13) wasapproximated by assuming that the change around a migrating cell (DCMMP,P,1)and that around a quiescent or proliferating cell (DCMMP,P,2) are different.
Equation (2.7) is discretized as
D(CM)x ,y,z
Dt= (RM)x ,y,z . (2.14)
The value of kc_m is obtained from the literature (Karagiannis & Popel 2004).The amount of matrix consumed (DCM,C,i) is determined by the rate equationand the state of the cell as a migrating cell tends to release more MMP, cleavingthe matrix.
Phil. Trans. R. Soc. A (2010)
on June 16, 2018http://rsta.royalsocietypublishing.org/Downloaded from

Continuum–discrete model of angiogenesis 2947
(ii) Cell transitions
The transition probability of a cell from one state to another is dependent onthe initial conditions, such as growth factor concentrations in the medium andmatrix stiffness. Cell decisions are made once every hour or every ‘cellular’ timestep. Thus, in a period of every hour, a certain number of cells migrate, proliferate,become quiescent and die. These probabilities are derived empirically. We haveexplored the range of probabilities and identified combinations that depict sproutcharacteristics seen under certain experimental conditions. These combinationsare shown in figure 5. The transitional probability to a particular state at timet + 1 can be written as
pM ,t+1 = pQ,t · pQ→M ,t + pM ,1,t + · · · + pM ,m−1,t − pM ,m,t
= pQ,t · pQ→M ,t + pM ,t − pM ,m,t , (2.15)
pQ,t+1 = pQ,t · pQ→Q,t + pMm ,t + pPp,t − pQ,t · pQ→M
− pQ,t · pQ→P − pQ→A,t , (2.16)
pP,t+1 = pQ,t · pQ→P,t + pP,1,t + · · · + pP,p−1,t − pP,p,t
= pQ,t · pQ→P,t + pP,t − pP,p,t (2.17)
and pA,t+1 = pQ,t · pQ→A,t , (2.18)
where pM ,t+1, pQ,t+1, pP,t+1 and pA,t+1 are the probabilities that the cell state attime t+1 becomes M , Q, P or A, respectively.
Parameters pQ,t , pMm ,t and pPp ,t are the probabilities defined as
pQ,t = p(Xt = Q), (2.19)
pM ,t =m∑
i=1
pMi,t (2.20)
and pP,t =p∑
i=1
pPi,t , (2.21)
and pQ→M ,t , pQ→Q,t , pQ→P,t and pQ→A,t are the transition probabilities tomigration, quiescence, proliferation and apoptosis, respectively, under theinstantaneous global and local conditions. These are expressed as a probabilitydistribution of percentages of transition (equations (2.22)–(2.25)). Theseprobabilities are to be determined experimentally. Alternatively, they could bespecified functions of the activation of relevant intracellular signalling pathways.
pQ→M ,t = p(Xt+1 = M |Xt = Q), (2.22)
pQ→Q,t = p(Xt+1 = Q|Xt = Q), (2.23)
pQ→P,t = p(Xt+1 = P|Xt = Q) (2.24)
and pQ→A,t = p(Xt+1 = A|Xt = Q). (2.25)
Phil. Trans. R. Soc. A (2010)
on June 16, 2018http://rsta.royalsocietypublishing.org/Downloaded from

2948 A. Das et al.
20(a)
(b)
(c)
1816141210864220 15 10 5 5 10 15 20
201816141210864220
2018161412108642
20 20 1551015105
15 10 5 5 10 15 20
Figure 5. Simulation and experimental results for five transition probability sets. The x-, y-and z-axes show the spatial coordinates of the device that are normalized to the characteristiclength of a cell (10 mm). The cell network grows upwards from a monolayer. (a) Transitionprobabilities = [0.5, 0.1, 0.35, 0.05] and an initial condition of uniform VEGF (20 ng ml−1)and Ang-1 (500 ng ml−1) in less stiff gel (collagen I concentration = 2 mg ml−1); (b) transitionprobabilities = [0.7, 0.15, 0.1, 0.05] and an initial condition of VEGF (40 ng ml−1) in less stiff gel(collagen I concentration = 2 mg ml−1); (c) transition probabilities = [0.85, 0.05, 0.05, 0.05] andan initial condition of Ang-1 (500 ng ml−1) in less stiff gel (collagen I concentration = 2 mg ml−1);(d) transition probabilities = [0.80, 0.1, 0.05, 0.05] and an initial condition of VEGF (40 ng ml−1)in stiffer gels (collagen I concentration = 2.5 mg ml−1); (e) transition probabilities = [0.7, 0.2, 0.05,0.05] and an initial condition of VEGF (20 ng ml−1) and Ang-1 (500 ng ml−1) in stiffer gels (collagenI concentration = 2.5 mg ml−1).
For the current simulation, these transitional probabilities are arbitrarily variedto depict the presence of VEGF, Ang-1 and differences in matrix stiffness. Certain‘rules’ for cell transition are outlined below.
Phil. Trans. R. Soc. A (2010)
on June 16, 2018http://rsta.royalsocietypublishing.org/Downloaded from

Continuum–discrete model of angiogenesis 2949
(d )
(e)
2018161412108642
2018161412108642
20 15 10 5
20 15 10 5
5 10 15 20
5 10 15 20
Figure 5. (Continued.)
— Initially, a uniform monolayer of cells is assumed to exist on the surfaceof the matrix. New sprouts are allowed to be initiated for the first 4 h.This is implemented to prevent multiple sprout formation and depicts thebiological state when only certain cells in the monolayer sprout and act as‘inhibitors’ on nearby cells. This lateral inhibition is enforced via the field.
— Each cell undergoes a ‘decision-making’ process where it can decide tomigrate, divide, die or stay quiescent.
— If a cell has ‘decided’ to migrate, the direction of migration is stochastic,though it is biased towards the lattice position occupied by the matrix thatis associated with the highest concentration of chemoattractants and MMPby giving the cell a higher probability to migrate towards that lattice point.It has a lower probability to migrate into any of the other matrix-occupiedlattice positions.
— If a cell has decided to divide, the new cell occupies the matrix-occupiedlattice position that is associated with the highest concentration of MMPas it causes local degradation of the matrix.
— If a cell dies, its position is occupied by empty space.— A cell can migrate only into a lattice position occupied by matrix but can
divide into either empty space or matrix.— If two cells choose the same lattice point into which to divide or migrate,
a tie-breaking rule is applied.— A migrating or dividing cell releases MMP into each of the adjacent matrix
elements, thus influencing the migration of itself and neighbouring cells.The amount released depends on the state of the cell and can be classifiedas ‘low’ or ‘high’—the values of which are recorded in table 1.
Phil. Trans. R. Soc. A (2010)
on June 16, 2018http://rsta.royalsocietypublishing.org/Downloaded from

2950 A. Das et al.
Table 1. The variables used in the four different rate equations described above have two differentactivities: high and low. These are normalized by the starting concentrations and are thereforedimensionless.
condition atwhich thehigh values
high in model are used low in model
VEGFconsumption
DCvegf_s,C,1 changein VEGF owingto consumptionby a single cell
−kon_cCvegf_sCvegf_rec+koff_cCvegf_r
VEGFconcentration>12
DCvegf_s,C,2 0
VEGFproduction
DCvegf_s,P,1 changein VEGF owingto production bya single cell
0.05 ± 0.025 VEGFconcentration>10
DCvegf_s,P,2 0.04 ± 0.02
MMPproduction
DCMMP,P,1 changein MMP owingto production bya single cell
0.6 ± 0.2 cell ismigrating
DCMMP,P,2 0.2 ± 0.1
matrix-bindingsites
DCM,C,1 change inMMP bindingsites owing toMMP
−kc_mCMMPM high release ofMMP
DCM,C,2 0
— VEGF is both released and consumed by the cells according to the stateof the cell and the surrounding VEGF concentration. As explained earlierand recorded in table 1, the surrounding local concentration above whichVEGF production is high is 12 and that above which VEGF consumptionby a cell is high is 10 units.
— Cells are allowed to divide both at the monolayer and in the stalks.— In the current simulations, the number of migration sub-states (m) is 3
and the number of proliferation sub-states (p) is 20, where each ‘cellular’time step corresponds to approximately 1 h.
— VEGF influences endothelial decision making via both paracrine andautocrine signalling. So, the deterministic model accounts for the diffusion,consumption and production of VEGF and MMP by the cells.
— While the sample simulations included in this paper account for changein concentration of VEGF and MMP, and initial addition of VEGF(40 or 20 ng ml−1) and/or Ang-1 (500 ng ml−1) to the field, the module-based algorithm and signalling molecules interacting with the cellsin a modular array format ensure that additional molecules can beincluded easily.
— In the simulations, the three-dimensional lattice is normalized to thecharacteristic length of an EC of approximately 10 mm. The concentrationsof the different growth factors and MMP are normalized to the maximumconcentration in every simulation.
— All simulations are recorded 50 h after the monolayer is established. Allexperimental images are documented 2 days after cell seeding.
Phil. Trans. R. Soc. A (2010)
on June 16, 2018http://rsta.royalsocietypublishing.org/Downloaded from

Continuum–discrete model of angiogenesis 2951
3. Results
(a) Sprout morphology
In all the simulations, cells were seeded as a monolayer and a VEGF gradientwas established from z = 20 before the simulations were started. Simulations wererun with different transition probabilities for pQ→Q , pQ→M (1), pQ→P(1) and pQ→Atransitions.
Figure 5a–e is generated for five such sets of transition probabilities andincludes a pictorial representation of sprout formation under different conditionsand phase-contrast images of experimental conditions that give rise to similarsprout formation characteristics. The experiments were conducted in themicrofluidic devices referred to above, with or without two important growthfactors: VEGF and Ang-1. Various experiments conducted in the microfluidicdevice in our laboratory have demonstrated that capillary stabilization is achievedwhen Ang-1 is used in the media along with VEGF. Since the experimentsin our laboratory have been limited to VEGF and Ang-1, it was decided toincorporate these two pro-angiogenic factors in the first stage of the modelling. Ithas also been shown that Ang-1 has an impact on VEGF signalling irrespectiveof the presence or absence of Ang-2 (Zhu et al. 2002). Ang-2 is a naturalantagonist and disrupts blood vessel formation. As the primary goal of the paperis to determine conditions that will result in the evolution of well-developedcapillaries, it was decided to first focus on such factors. In our experience,high transition probability of migration and proliferation corresponds to highconcentrations of growth factors and matrix of optimal stiffness, while lowprobabilities correspond to a lower concentration of growth factors and a softeror stiffer matrix. High concentration of Ang-1 implies a lower rate of regressionowing to capillary stabilization. These figures are included here to demonstratethat certain experimental conditions can be reproduced by some combinationof transition probabilities. The exact matching of these probabilities to specificconditions will require further experimentation.
When the transition probabilities represent extreme states such as 85 per centmigration/5 per cent proliferation/5 per cent quiescence/5 per cent proliferation,many migratory cells are seen that protrude far into the matrix. Under a differentextreme state, e.g. 85 per cent proliferation/5 per cent migration/5 per centquiescence/5 per cent proliferation, the entire monolayer starts to proliferateand forms large cell clusters. These extreme cases are not representative ofany physiological condition, but were conducted to demonstrate the range ofapplicability of the model. As observed in figure 5, longer sprouts are observedwith a higher migration probability and almost no sprouts are observed when thecells have a higher probability to remain quiescent.
Sprout formation under conditions of VEGF (20 ng ml−1) and high Ang-1(500 ng ml−1), which act as sprout-stimulating and sprout-stabilizing agents,respectively, in a collagen I gel made with concentration 2 mg ml−1 andsimulation generated with transition probabilities that result in a similarmorphology to the above mentioned condition are shown in figure 5a. Thebranching network is well developed under such conditions. Simply by removingAng-1 and increasing VEGF concentration, so that there is a high concentrationof the sprout-stimulating agent (VEGF 40 ng ml−1) but no sprout-stabilizing
Phil. Trans. R. Soc. A (2010)
on June 16, 2018http://rsta.royalsocietypublishing.org/Downloaded from

2952 A. Das et al.
1
1 2 3 4 5 6
2
3
4
5
6
0.05
0.15
0.25
0.30
0.45
0.55
0.6
0.6
0.6
0.55
0.4
0.3
0.3
0.2
0.1
0.1
0.1
0.1
0.05
0.05
0.05
0.05
0.05
0.05
0
50
100
150
200
250pQ→Q pQ→M pQ→P pQ→A
leng
th
decreasingproliferation
decreasingmigration
Figure 6. Average protrusion length of capillaries into matrix as a function of transition probabilitytrends. The numbers along the x-axis of the graph represent transition probability sets describedin the accompanying table.
agent, cell clusters and short branches are prevalent (figure 5b). With only Ang-1(500 ng ml−1) present and no VEGF, the absence of a sprout-stimulating agentleads to relatively less sprout formation. Very few stable capillaries are observedrelative to small sprouts and single migrating cells (figure 5c). With only VEGF(40 ng ml−1) and no Ang-1 in a stiffer collagen I gel (2.5 mg ml−1), there isa sprout-stimulating agent but no sprout-stabilizing agent. But owing to thestiffer gels, the cells find it harder to migrate; hence they cannot form manybranches (figure 5d). When both VEGF (20 ng ml−1) and Ang-1 (500 ng ml−1)are present in a stiffer gel (2.5 mg ml−1 collagen I), some capillary-like structuresare observed, but fewer and longer branches and more cell clusters are observedat the monolayer than would be seen in a less stiff matrix under the sameconditions (figure 5e). In this case, the branches have fewer cells per branchcompared with the same growth factor combination in a softer matrix. Thesesample results demonstrate that by proper adjustments of the parameters, themodel can produce a variety of morphologies. In addition, the model can also beused to explore how specific features depend on the imposed conditions, as in thefollowing examples.
Consider first the average protrusion length of cells into the matrix (figure 6).This is determined by calculating the depth to which cells penetrate at each latticepoint in the monolayer in the z direction and assuming unit volume occupiedby each cell. Corresponding sets of transitional probabilities are listed in thefigure. In the first three transitional sets, the probabilities to migrate and die areheld constant, the probability to divide decreases and that to remain quiescentincreases. In the next three transitional probability sets, the probabilities to divideand die are held constant, the probability to migrate decreases and that to remainquiescent increases. As expected, certain transition probabilities result in highercell protrusion into the matrix. As the probability of the cell to remain in thequiescent state increases in the first dataset, the protrusion distance increasesbecause of the lower proliferation rate. Thus, fewer sprouts are initiated andthe ones that are, grow long. This implies that while proliferation occurs bothin the monolayer and in the sprouts, addition of any proliferating agent affectsthe proliferation rate in the monolayer more significantly. Hence, the addition
Phil. Trans. R. Soc. A (2010)
on June 16, 2018http://rsta.royalsocietypublishing.org/Downloaded from

Continuum–discrete model of angiogenesis 2953
0
0.5
1.0
1.5
2.0
2.5
3.0
3.5(a)
(c)
1/4 1/2 3/4 1 4/3 2 4
M/Q
1/2 3/4 1 4/3 20
0.51.01.52.02.53.03.54.0
P/Q
aver
age
num
ber
aver
age
num
ber
(b)
1/2 3/4 1 4/3 20
0.51.01.52.02.53.03.54.04.55.0
P/M
aver
age
num
ber
Figure 7. Average number of different capillary morphologies as a function of different transitionprobabilities. (a) M/Q ratios (keeping transition to P and to A constant); (b) P/M ratios (keepingtransition to Q and to A constant); (c) P/Q ratios (keeping transition to M and to A constant).Lines with filled diamonds, continuous sprouts; lines with filled circles, discontinuous sprouts; lineswith filled squares, cell clusters at monolayer; lines with filled triangles, migrating cells.
of growth factors that simulate proliferation should result in a larger networkof sprouts and/or more cell clusters. In the second data cluster, with a highermigration probability, longer sprouts are formed. While the difference in sproutlength is not significant with small changes in migration probability, the trendsobserved are very significant. It provides an insight into the conditions that wouldgive rise to network-like versus single-sprout-like capillary structures.
(b) Continuous sprouts versus cell clustering
In order to understand the effect of each of the different transition probabilities,the number of different morphologies are recorded when two of the four transitionsare kept constant and the other two are systematically varied. Figure 7 shows anaverage of 30 simulations for each of these conditions.
To determine the effect of increasing specific transitional probabilities, wevaried specific ratios (migration (M ) to quiescent (Q); proliferation (P) toquiescence (Q); and migration (M ) to proliferation (P)) systematically by keepingthe other two constant in each case. The results observed for each of theabove-mentioned variations are depicted in figures 7 and 8. As the M/Q ratio
Phil. Trans. R. Soc. A (2010)
on June 16, 2018http://rsta.royalsocietypublishing.org/Downloaded from

2954 A. Das et al.
0
0.2
0.4
0.6
0.8
1.0
1.2
0
0.5
1.0
1.5
2.0
2.5
3.0
0
0.5
1.0
1.5
2.0
2.5
3.0(a)
(b)
(c)
ratio
ratio
ratio
1/2 3/4 1 4/3 2
P/M
1/4 1/2 3/4 1 4/3 2 4M/Q
1/2 3/4 1 4/3 2P/Q
Figure 8. Ratio of continuous sprouts to other morphologies as a function of increasing transitionratios: (a) as a function of increasing M/Q values (keeping transition to P and to A constant); (b)as a function of increasing P/M ratios (keeping transition to Q and to A constant); (c) as a functionof increasing P/Q values (keeping transition to M and to A constant). Lines with filled diamonds,continuous sprouts/discontinuous sprouts; lines with filled circles, continuous sprouts/cell clustersat monolayer; lines with filled squares, continuous sprouts/migrating cells.
increases (figure 7a), the number of individual migrating cells increases and thenumber of cell clusters at the monolayer decreases. This is because at a certainfixed transition probability of proliferation, as the tendency of cells to migrateincreases, cluster formation decreases. However, discontinuous sprouts or clustersformed away from the monolayer show a bimodal response. At the first peak, theseclusters tend to be broader, and at the second peak (when the tendency to migrateis higher than that to proliferate), these clusters tend to be longer. When theratio of migration to quiescence nears one, the number of such ‘floating clusters’decreases. This is also the condition that causes an increase in the number ofcontinuous cell sprouts. This shows that these two morphologies lie in two distinctareas in the space map of the different transition probabilities.
A crucial element in capillary morphology prediction would be in identifyingthe balance between the transition probabilities of migration and proliferation.Figure 7b shows the effect of varying these two transition probabilities keepingthe transition to quiescence and transition to apoptosis fixed at 15 per centand 5 per cent, respectively. The most relevant prediction is that the number ofcontinuous probabilities peak when this ratio tends to one. Though the number ofcell clusters in the matrix does not change much, these clusters, like the clustersat the monolayer, tend to become larger as this ratio increases.
Phil. Trans. R. Soc. A (2010)
on June 16, 2018http://rsta.royalsocietypublishing.org/Downloaded from

Continuum–discrete model of angiogenesis 2955
The simulations in figure 7c were generated while keeping the transitionprobability of migration fixed at 15 per cent and the transition probability ofapoptosis fixed at 5 per cent. While the number of continuous sprouts anddiscontinuous sprouts or cell clusters in the matrix remains unchanged as theratio increases, it is also important to note that at this fixed transition rate formigration, very few continuous sprouts are formed. Since this lies in the first halfof the curve that determines the effect of migration on sprout formation as shownin figure 7a, it is verified that sprout formation is optimal at a higher migrationtransition probability. The number of single migrating cells decreases and thenumber of clusters at the monolayer increases as this ratio increases.
The customary capillary morphology found in vivo is continuous sprouts,and its ratio to each of the other morphologies as a function of the ratio ofthe transition probabilities between migration and quiescence, proliferation andmigration and proliferation and quiescence are shown in figure 8. As expected,the curves peak when there is a balance between migration and quiescence,which translates into effective capillary induction and stabilization (figure 8a).The model predicts that the ratio between proliferation and quiescence should beincreased in order to increase the number of continuous sprouts in comparison toindividual migrating cells (figure 8c). Again, as expected after observing figure 7b,the number of continuous sprouts is maximized in comparison to any othercapillary morphology when the ratio of transitioning to proliferation to that oftransitioning to migration tends towards one (figure 8b).
(c) Branching
This model is also a useful tool for studying and analysing branching patternsin capillary formation. Very little is known about the characteristics of capillarynetworks and the factors that influence them. In order to use this model to studysuch patterns, we first need to identify certain significant characteristics. Welimited these to number of sprouts, number of total branches, number of branchesper sprout and number of anastomoses per simulation. These were analysed as afunction of changing transition probabilities based on the expectation that mostgrowth factors will have an impact on migration, proliferation, apoptosis andquiescence and hence will fall in the transition data space being analysed. Theresults shown in figure 9 can be used to narrow down the transition probabilitiesthat provide the desired network characteristics.
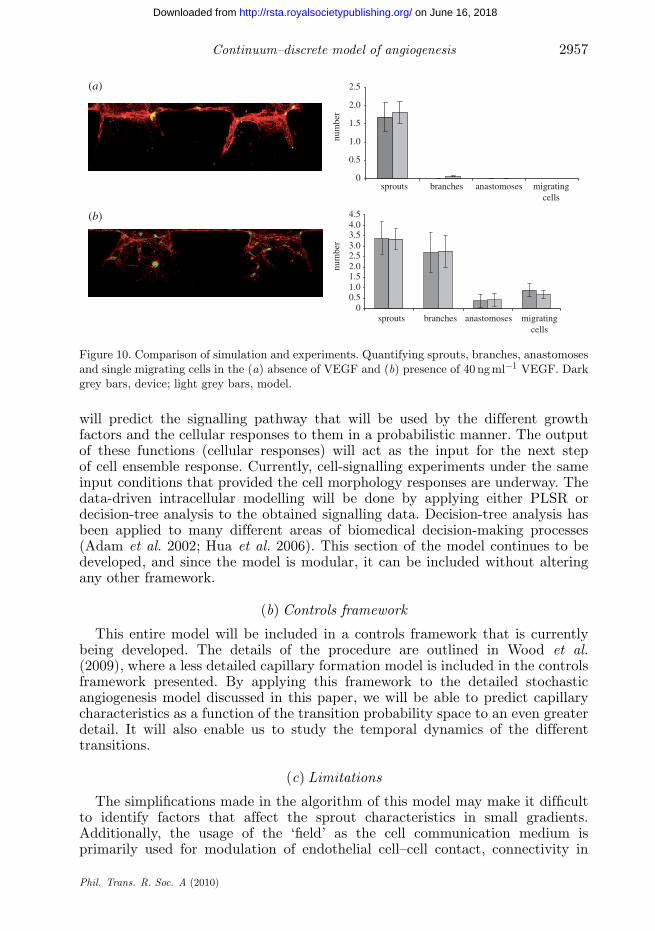
(d) Predicting sprout characteristics with and without VEGF
A very simple prediction is made using the described model, and experimentswere conducted in the microfluidic devices to demonstrate the model–experimentoverlap. The conditions used to demonstrate this are the presence and absenceof VEGF—the most crucial pro-angiogenic factor.
The concentrations used are no VEGF and 40 ng ml−1 VEGF in a collagen Imatrix. Absence of VEGF implies a set of conditions that increases the bias for thecells to remain quiescent and decreases their bias to migrate or proliferate. Hence,they fall in the following bracket of transition probabilities: [0.85, 0.05, 0.05, 0.05].Presence of 40 ng ml−1 VEGF implies that there is comparatively a higher biasfor cell migration and proliferation. Thus, they fall in the following bracket oftransition probabilities: [0.7, 0.15, 0.1, 0.05]. The experiments were conducted in
Phil. Trans. R. Soc. A (2010)
on June 16, 2018http://rsta.royalsocietypublishing.org/Downloaded from

2956 A. Das et al.
00.51.01.52.02.53.03.54.0
02468
101214(a)
(b)
(c)
increasing ratio of P : M transition
1
2
3
4
5
6
0
num
ber
num
ber
num
ber3/4 1 4/3 2
increasing ratio of P : Q transition
3/4 1 4/3 2
increasing ratio of Q : M transition3/41/2 1 4/3 2
Figure 9. Branching patterns as a function of increasing transition probabilities. (a) IncreasingP/M transition; (b) increasing Q/M transition; (c) increasing P/Q transition. Lines with filleddiamonds, number of sprouts; lines with filled triangles, number of branches; lines with filledsquares, number of anastomoses.
the microfluidic devices that are described earlier and stained with phalloidin(Invitrogen) after being fixed. The images were obtained using an Olympusconfocal microscope and processed using IMAGEJ software (NIH, Bethesda, MD,USA). As recorded, most of the sprouts formed under no VEGF condition werelocated along a surface of the device and showed only two-dimensional invasion.The sprouts under the pro-angiogenic condition of 40 ng ml−1 VEGF showedthree-dimensional invasion and well-developed branching. This was reflected inthe model predictions as well.
Figure 10 summarizes the results obtained from experiments and simulationsunder the aforementioned conditions. The model results are an average of 30simulations each and the experiments are an average of 16 experimental regions.The mean number of sprouts, number of branches, number of anastomoses andnumber of migrating cells predicted by the model are reflected in the experimentsconducted in the devices.
4. Discussion
(a) Intracellular signalling
An advantage of this model is that it allows for the incorporation of anintracellular signalling model. Though it has not been included in the samplesimulations provided in this paper, the model can call intracellular modulesduring the different states: migration, division and quiescence. These functions
Phil. Trans. R. Soc. A (2010)
on June 16, 2018http://rsta.royalsocietypublishing.org/Downloaded from
Continuum–discrete model of angiogenesis 2957
00.51.01.52.02.53.03.54.04.5
num
ber
num
ber
0
0.5
1.0
1.5
2.0
2.5(a)
(b)
sprouts branches anastomoses migratingcells
sprouts branches anastomoses migratingcells
Figure 10. Comparison of simulation and experiments. Quantifying sprouts, branches, anastomosesand single migrating cells in the (a) absence of VEGF and (b) presence of 40 ng ml−1 VEGF. Darkgrey bars, device; light grey bars, model.
will predict the signalling pathway that will be used by the different growthfactors and the cellular responses to them in a probabilistic manner. The outputof these functions (cellular responses) will act as the input for the next stepof cell ensemble response. Currently, cell-signalling experiments under the sameinput conditions that provided the cell morphology responses are underway. Thedata-driven intracellular modelling will be done by applying either PLSR ordecision-tree analysis to the obtained signalling data. Decision-tree analysis hasbeen applied to many different areas of biomedical decision-making processes(Adam et al. 2002; Hua et al. 2006). This section of the model continues to bedeveloped, and since the model is modular, it can be included without alteringany other framework.
(b) Controls framework
This entire model will be included in a controls framework that is currentlybeing developed. The details of the procedure are outlined in Wood et al.(2009), where a less detailed capillary formation model is included in the controlsframework presented. By applying this framework to the detailed stochasticangiogenesis model discussed in this paper, we will be able to predict capillarycharacteristics as a function of the transition probability space to an even greaterdetail. It will also enable us to study the temporal dynamics of the differenttransitions.
(c) Limitations
The simplifications made in the algorithm of this model may make it difficultto identify factors that affect the sprout characteristics in small gradients.Additionally, the usage of the ‘field’ as the cell communication medium isprimarily used for modulation of endothelial cell–cell contact, connectivity in
Phil. Trans. R. Soc. A (2010)
on June 16, 2018http://rsta.royalsocietypublishing.org/Downloaded from

2958 A. Das et al.
the sprout and lateral inhibition owing to notch signalling. Since the cellscannot change shapes in the current format of the model, such communicationrestricts the ability to maintain the cell junction. This limitation of the modelcan be overcome by allowing the cells to change shape in future versions.Additionally, cell polarity and intercellular communication, which is a functionof cell polarity, is ignored in the current form of the model. It can be foreseenthat this can be incorporated when cells are allowed to change shape. In thatevent, the cell communication function will have to evolve to account for thatcomplexity.
(d) Advantages
The advantage of the three-dimensional agent-based coarse-grain stochasticangiogenesis model outlined here is that several angiogenic factors can be includedand that it can function both as a stand-alone model and inside the controlframework mentioned above. Most importantly, all simulations can be comparedin-house with experiments conducted in the mircrofluidic devices described.By modelling cell populations via the application of global controls that arecollectively modified by the aggregate cell population, cell–cell interactions areintroduced into this model in an explicit manner. Several previous works havemodelled capillary growth as a function of the leading cell or developed modelsthat involve distinct zones of capillaries. For example, Balding & McElwain (1985)modelled two regions of EC density: the sprout proper and the tip; however,they neglected dynamics of the cells remaining on the monolayer. Such cell–cell interactions are crucial for developing a model that reflects the impact ofcellular signalling molecules and the ECM because of the feedback loop thatexists between the aggregate effect of cells on the matrix and the impact of thematrix on each individual cell. Since then, as mentioned in the introduction,several types of models that provide crucial insights into the process have beendeveloped. However, the model we present is unique in its ability to cross-talkwith experimental results, and thus provides a platform for predicting non-tumourangiogenesis in in vitro bioreactors.
By developing a model based on the influence of global and local conditions, thecoarse-grain combined impact of various biochemical and biomechanical factorson angiogenesis can be determined. The model can be extended to include anynumber of biomolecules that are either being added to the bioreactor (affectingglobal conditions) or being secreted/consumed by migrating/dividing cells(affecting local conditions) because the ‘molecular matrix’, i.e. the componentsassociated with each lattice in the field, can be of any size. Such a methodology isessential in order to develop a system-based, experimentally verifiable approachto the process of capillary formation.
This model enables us to simulate individual cell behaviour and compare cellpopulation behaviour at the end of the simulation. Certain basic characteristicsobserved in these simulations that reflect experimental observations are thepresence of continuous sprouts, their differential formation as a function of addedgrowth factors, horizontal and vertical migration and cell clustering. Differenttransitional probabilities reflect these experimental observations, and future workwill explore the predictive nature of such a model.
Phil. Trans. R. Soc. A (2010)
on June 16, 2018http://rsta.royalsocietypublishing.org/Downloaded from

Continuum–discrete model of angiogenesis 2959
5. Conclusion
In conclusion, we demonstrate here the successful implementation of a three-dimensional agent–field model for capillary formation that can generatesprouts with characteristics similar to those observed in three-dimensionalin vitro experiments. This is a hybrid stochastic–deterministic model whereindividual cells are modelled independently and their communication via cell–cell interactions is included in a mathematically simplified manner that capturesthe importance of that action but does not complicate the implementation.The simulation results obtained are characteristically similar to experimentalobservations as shown, indicating that this model can be used for variousdemonstrative and predictive applications.
We would like to acknowledge NSF-EFRI grant no. 0735997 and the Singapore-MIT Alliance forResearch and Technology for funding.
References
Adam, B. et al. 2002 Serum protein fingerprinting coupled with a pattern-matching algorithmdistinguishes prostate cancer from benign prostate hyperplasia and healthy men. Cancer Res.62, 3609–3614.
Adams, R. H. & Alitalo, K. 2007 Molecular regulation of angiogenesis and lymphangiogenesis. Nat.Rev. Mol. Cell Biol. 8, 464–478. (doi:10.1038/nrm2183)
Anderson, A. R. & Chaplain, M. A. 1998 Continuous and discrete mathematical models of tumorinduced angiogenesis. Bull. Math. Biol. 60, 857–899. (doi:10.1006/bulm.1998.0042)
Balding, D. & McElwain, M. D. 1985 A mathematical model of tumor induced capillary growth.J. Theor. Biol. 114, 53–73. (doi:10.1016/S0022-5193(85)80255-1)
Bartoli, M., Platt, D., Lemtalsi, T., Xiaolin, G., Brooks, S. E., Marrero, M. B. & Caldwell, R. B.2003 VEGF differentially activates STAT3 in microvascular endothelial cells. FASEB J. 17,1562–1564.
Chaplain, M. & Anderson, A. 2004 Mathematical modelling of tumour-induced angiogenesis:network growth and structure. Cancer Treat. Res. 117, 51–75.
Chaplain, M. A., McDougall, S. R. & Anderson, A. R. 2006 Mathematical modelingof tumor induced angiogenesis. Annu. Rev. Biomed. Eng. 8, 233–257. (doi:10.1146/annurev.bioeng.8.061505.095807)
Chaturvedi, R. H. C., Kazmierczak, B., Schneider, T., Izaguirre, J. A., Glimm, T.,Hentschel, H. G., Glazier, J. A., Newman, S. A. & Alber, M. S. 2005 On multiscaleapproaches to three-dimensional modeling of morphogenesis. J. R. Soc. Interface 2, 237–253.(doi:10.1098/rsif.2005.0033)
Dallon, J. C. & Othmer, H. G. 1997 A discrete cell model with adaptive signaling for aggregationof dictyostelium discoideum. Phil. Trans. R. Soc. Lond. B 352, 391–417. (doi:10.1098/rstb.1997.0029)
Davis, S. et al. 1996 Isolation of angiopoietin-1, a ligand for the TIE2 receptor, by secretion-trapexpression cloning. Cell 87, 1161–1169. (doi:10.1016/S0092-8674(00)81812-7)
Folkman, J. & Shing, Y. 1992 Angiogenesis. J. Biol. Chem. 267, 10931–10934.Goerges, A. L. & Nugent, M. A. 2004 pH regulates vascular endothelial growth factor binding to
fibronectin. J. Biol. Chem. 279, 2307–2315. (doi:10.1074/jbc.M308482200)Helm, C. L., Fleury, M. E., Zisch, A. H., Boschetti, F. & Swartz, M. A. 2005 Synergy
between interstitial flow and VEGF directs capillary morphogenesis in vitro through agradient amplification mechanism. Proc. Natl Acad. Sci. USA 102, 15 779–15 784. (doi:10.1073/pnas.0503681102)
Hua, F., Hautaniemi, S., Yokoo, R. & Lauffenburger, D. A. 2006 Integrated mechanistic and data-driven modelling for multivariate analysis of signalling pathways. J. R. Soc. Interface 3, 515–526.(doi:10.1098/rsif.2005.0109)
Phil. Trans. R. Soc. A (2010)
on June 16, 2018http://rsta.royalsocietypublishing.org/Downloaded from

2960 A. Das et al.
Jackson, T. & Zheng, X. 2010 A cell-based model of endothelial cell migration,proliferation and maturation during corneal angiogenesis. Bull. Math. Biol. 72, 830–868.(doi:10.1007/s11538-009-9471-1)
Ji, J. W., Tsoukias, N. M., Goldman, D. & Popel, A. S. 2005 A computational model of oxygentransport in skeletal muscle for sprouting and splitting modes of angiogenesis. J. Theor. Biol.241, 94–108. (doi:10.1016/j.jtbi.2005.11.019)
Karagiannis, E. D. & Popel, A. S. 2004 A theoretical model of type I collagen proteolysis by matrixmetalloproteinase (MMP) 2 and membrane type 1 MMP in the presence of tissue inhibitor ofmetalloproteinase 2. J. Biol. Chem. 279, 39 105–39 114. (doi:10.1074/jbc.M403627200)
Levine, H. A., Sleeman, B. D. & Nilsen-Hamilton, M. 2000 A mathematical model for the roles ofpericytes and macrophages in the initiation of angiogenesis. I. The role of protease inhibitors inpreventing angiogenesis. Math. Biosci. 168, 77–115. (doi:10.1016/S0025-5564(00)00034-1)
Levine, H. A., Tucker, A. L. & Nilsen-Hamilton, M. 2002 A mathematical model for the role of cellsignal transduction in the initiation and inhibition of angiogenesis. Growth Factors 20, 155–175.(doi:10.1080/0897719031000084355)
Mac Gabhann, F. & Popel, A. S. 2007 Interactions of VEGF isoforms with VEGFR-1, VEGFR-2,and neuropilin in vivo: a computational model of human skeletal muscle. Am. J. Physiol. HeartCirc. Physiol. 292, H459–H474. (doi:10.1152/ajpheart.00637.2006)
Mantzaris, N. V., Webb, S. & Othmer, H. G. 2004 Mathematical modeling of tumor-inducedangiogenesis. J. Math. Biol. 49, 111–187. (doi:10.1007/s00285-003-0262-2)
Peirce, S. M., Van Gieson, E. J. & Skalak, T. C. 2004 Multicellular simulation predictsmicrovascular patterning and in silico tissue assembly. FASEB J. 18, 731–733.
Plank, M. J. & Sleeman, B. D. 2004a Lattice and non-lattice models of tumour angiogenesis. Bull.Math. Biol. 66, 1785–1819. (doi:10.1016/j.bulm.2004.04.001)
Plank, M. J. & Sleeman, B. D. 2004b A reinforced random walk model of tumour angiogenesis andanti-angiogenic strategies. Math. Med. Biol. 20, 135–181. (doi:10.1093/imammb/20.2.135)
Qutub, A. A. & Popel, A. S. 2009 Elongation, proliferation and migration differentiate endothelialcell phenotypes and determine capillary sprouting. BMC Syst. Biol. 3, 13. (doi:10.1186/1752-0509-3-13)
Qutub, A., Gabhann, F., Karagiannis, E., Vempati, P. & Popel, A. 2009 Multiscale models ofangiogenesis. IEEE Eng. Med. Biol. Mag. 28, 14–31. (doi:10.1109/MEMB.2009.931791)
Slungaard, A. 2005 Platelet factor 4: a chemokine enigma. Int. J. Biochem. Cell Biol. 37, 1162–1167.(doi:10.1016/j.biocel.2004.12.003)
Stokes, C. L. & Lauffenburger, D. A. 1991 Analysis of the roles of microvessel endothelial cellrandom motility and chemotaxis in angiogenesis. J. Theor. Biol. 152, 377–403. (doi:10.1016/S0022-5193(05)80201-2)
Tsoukias, N. M., Goldman, D., Vadapalli, A., Pittman, R. N. & Popel, A. S. 2007 A computationalmodel of oxygen delivery by hemoglobin-based oxygen carriers in three-dimensionalmicrovascular networks. J. Theor. Biol. 248, 657–674. (doi:10.1016/j.jtbi.2007.06.012)
Turner, S. & Sherratt, J. A. 2002 Intercellular adhesion and cancer invasion: a discrete simulationusing the extended Potts model. J. Theor. Biol. 216, 85–100. (doi:10.1006/jtbi.2001.2522)
Vickerman, V., Blundo, J., Chung, S. & Kamm, R. 2008 Design, fabrication and implementationof a novel multi-parameter control microfluidic platform for three-dimensional cell culture andreal-time imaging. Lab Chip 8, 1468–1477. (doi:10.1039/b802395f)
Wood, L., Das, A., Kamm, R. & Asada, H. 2009 A stochastic broadcast feedback approach toregulating cell population morphology for microfluidic angiogenesis platforms. IEEE Trans.Biomed. Eng. 6, 2299–2303. (doi:10.1109/TBME.2009.2026732)
Yamamura, N., Sudo, R., Ikeda, M. & Tanishita, K. 2007 Effects of the mechanical properties ofcollagen gel on the in vitro formation of microvessel networks by endothelial cells. Tissue Eng.13, 1443–1453. (doi:10.1089/ten.2006.0333)
Zhu, W. H., MacIntyre, A. & Nicosia, R. F. 2002 Regulation of angiogenesis by vascularendothelial growth factor and angiopoietin-1 in the rat aorta model: distinct temporal patternsof intracellular signaling correlate with induction of angiogenic sprouting. Am. J. Pathol. 161,823–830.
Phil. Trans. R. Soc. A (2010)
on June 16, 2018http://rsta.royalsocietypublishing.org/Downloaded from