a hybrid statistical- dynamical approach to tropical
TRANSCRIPT

A HYBRID STATISTICAL-DYNAMICAL APPROACH TO TROPICAL CYCLONE WIND SPEED PROBABILITIES
Andrea Schumacher, CIRA/CSU
Workshop on Effective Use of Hurricane Ensembles17 Nov 2015, Miami, FL

Outline
Overview of the Monte Carlo wind speed probability model (MC Model) How uncertainty is currently incorporated
Incorporation of global model tracks – hybrid statistical dynamical MC Model Methodology Real-time display
Verification
2

Overview of the MC Model3

MC Model Basics
Estimates probability of 34-, 50- and 64-kt winds to 5 days 1000 track realizations generated from random sampling
NHC track and intensity error distributions Wind radii of realizations from radii CLIPER model and its
radii error distributions Serial correlation of errors included Probability at a point computed by counting the number of
realizations passing within the wind radii of interest Developed under JHT, implemented in 2006, several
updates since (incorporation of GPCE)
4

1000 Track Realizations 34 kt 0-120 h Cumulative Probabilities
MC Model ExampleHurricane Earl 31 Aug 2010 00 UTC
5

How situation-specific track uncertainty is incorporated now
6
Sample different track forecast error distributions based on GPCE tercile (low/avg/high)
Lower GPCE Higher GPCE

Incorporating ensembles
Current method anchored to deterministic NHC forecast Unable to represent multiple track scenarios (be design)
Example:
Joaquin (AL112015)1 Oct 2015 00 UTC
GFS ens (red)ECMWF ens (yellow)
7

Data
Tropical cyclone advisories and forecasts a-decks, b-decks and e-decks
Global numerical model ensemble forecasts GFS (20 members) CMC (20 members) ECMWF (50 members) FNMOC (20 members) UKMET (23 members) 133 model track forecasts total
8

Methods
Replaced track realizations with global model ensemble tracks 1000 133 realizations
Intensity and radii same as statistical version Atlantic, NE Pacific, NW Pacific basins Runs on numbered invests (not verified) Latency ~ 6-12 hrs
Runs as soon as first ensembles are available Keeps updating until all are available
Runs at 0 and 12 UTC
9

Real-time hybrid WSPs
http://www.hfip.org/data/Display of: Ensemble probability
Select model: Windspeed probability thresholds
10

Brier scoresReliabilityAtlantic, NE Pacific, NW Pacific basins
2012-2014 Verification11

% Reduction in Brier scores - Atlantic
Both 34-kt and 64-kt, all years:Hybrid Brier scores < statistical Brier scores(i.e., magnitude of errors is smaller)
12

Reliability – Atlantic (34kt 0-120h Cum)
Statistical: tendency to underforecast, especially higher probabilities (although 2013 was almost perfect – lots of weaker Atlantic systems)
Hybrid: underforecasts more than statistical
13
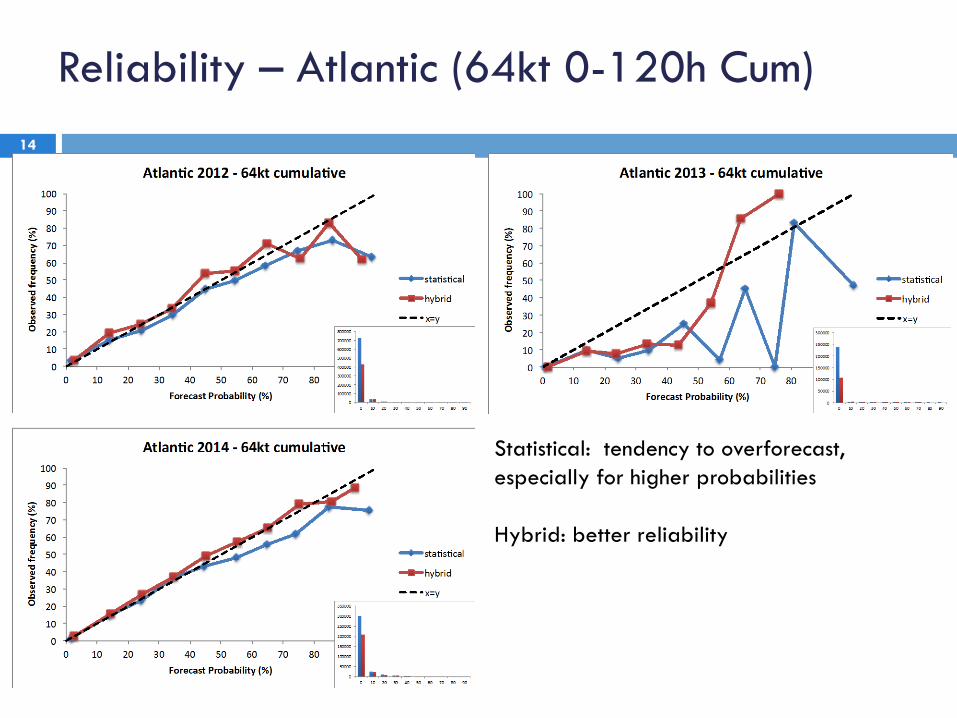
Reliability – Atlantic (64kt 0-120h Cum)
Statistical: tendency to overforecast, especially for higher probabilities
Hybrid: better reliability
14

% Reduction in Brier scores – NE Pacific
34-kt cumulative and incremental:Hybrid BS < statistical BS(i.e., magnitude of errors is smaller)
64-kt cumulative and incremental:Hybrid BS ≥ statistical BS(i.e., magnitude of errors is larger)
15

Reliability – NE Pacific (34kt 0-120h Cum)
Statistical: consistently overforecasts
Hybrid tendency to underforecast improves reliability
16

Reliability – NE Pacific (64kt 0-120h Cum)
Statistical: slight tendency to overforecast
Hybrid: better reliability
17

% Reduction in Brier scores – NW Pacific
Both 34-kt and 64-kt, all years:Hybrid Brier scores < statistical Brier scores(i.e., magnitude of errors is smaller)
18

Reliability – NW Pacific (34kt 0-120h Cum)
Statistical: tendency to underforecast, especially higher probabilities
Hybrid: very similar to statistical
19

Reliability – NW Pacific (64kt 0-120h Cum)
Statistical: tendency to underforecast
Hybrid: same to better reliability
20

Summary / Future work
Verification, hybrid vs. statistical Atlantic
improves Brier scores
worsens conditional bias towards underforecasting probabilities
NE Pacific impact on Brier scores mixed
improves conditional bias towards overforecasting probabilities
NW Pacific improves Brier scores
slightly worsens conditional bias towards underforecasting probabilties
Future work Continue running hybrid WSPs in real time
Evaluate hybrid WSPs in applications that use WSPs Application to TCCORs (B. Sampson)
21

Future work – other hybrid methodologies
22
Statistical Consensus Stat + Con
GFS CMCGFS NAVGEM UKMET

Thank you! Questions?
Goerss, J. S., 2007: Prediction of consensus tropical cyclone track forecast error. Mon. Wea. Rev., 135, 1985–1993.
Knaff, J. A., C. R. Sampson, M. DeMaria, T. P. Marchok, J. M. Gross, and C. J. McAdie, 2007: Statistical tropical cyclone wind radii prediction using climatology and persistence. Wea. Forecasting, 22, 781–791.
DeMaria, M., J.A. Knaff, R.D. Knabb, C.A. Lauer, C.R. Sampson, and R.T. DeMaria, 2009: A New Method for Estimating Tropical Cyclone Wind Speed Probabilities. Wea. Forecasting, 24, 1573–1591.
DeMaria.M., J.A. Knaff, M.J. Brennan, D. Brown, R.D. Knabb, R.T DeMaria, A. Schumacher, C.A. Lauer, D.P. Roberts, C.R. Sampson, P. Santos, D. Sharp, and K.A. Winters, 2013: Improvements to the operational tropical cyclone wind speed probability model. Wea. Forecasting, 28, 586-602.
23

Extra slides24

25
Impacts of using fewer realizations
In the log-log diagram, errors (E) are nearly a linear function of N:
E = C / Nz
Where C and Z are constants. Taking the natural log of both sides gives
y = mx + b
Where y = ln(E), x = ln(N), b = ln(C), and m = -z.
Fitting (7) to max. error data yields:z = 0.485, C = 109.2%
Fitting (7) to avg. error data yields:z = 0.490, C = 15.8%
Maximum and average errors are both inversely proportional to the square root of N:
E ~ 1/N0.5
For N = 1000, avg E = 0.5%For N = 100, avg E = 1.6%i.e., factor of 10 reduction in N
Yields smaller increase in E (~factor of 3)
(6)
(7)

How situation-specific track uncertainty is incorporated now
Lower GPCE Higher GPCE
26