a hybrid type ia supernova with an early flash...
TRANSCRIPT

A hybrid type Ia supernova with an early flash triggeredby helium-shell detonation
Ji-an Jiang1,2, Mamoru Doi1,3,4, Keiichi Maeda5,3, Toshikazu Shigeyama4, Ken’ichi Nomoto3,
Naoki Yasuda3, Saurabh W. Jha6, Masaomi Tanaka7,3, Tomoki Morokuma1,3, Nozomu Tominaga7,3,
Zeljko Ivezic9, P. Ruiz-Lapuente10,11, M. D. Stritzinger12, P. A. Mazzali13,14, Christopher Ashall13,
Jeremy Mould15, D. Baade16, Nao Suzuki3, Andrew J. Connolly9, F. Patat16, Lifan Wang17,18,
Peter Yoachim9, David Jones19,20, Hisanori Furusawa7, Satoshi Miyazaki7,21
1Institute of Astronomy, Graduate School of Science, The University of Tokyo, 2-21-1 Osawa,
Mitaka, Tokyo 181-0015, Japan
2Department of Astronomy, Graduate School of Science, The University of Tokyo, 7-3-1 Hongo,
Bunkyo-ku, Tokyo 113-0033, Japan
3Kavli Institute for the Physics and Mathematics of the Universe (WPI), The University of
Tokyo, 5-1-5 Kashiwanoha, Kashiwa, Chiba 277-8583, Japan
4Research Center for the Early Universe, Graduate School of Science, The University of Tokyo,
7-3-1 Hongo, Bunkyo, Tokyo 113-0033, Japan
5Department of Astronomy, Kyoto University, Kitashirakawa-Oiwake, Sakyo, Kyoto 606-8502,
Japan
6Department of Physics and Astronomy, Rutgers, The State University of New Jersey, 136 Frel-
inghuysen Road, Piscataway, NJ 08854, USA
7National Astronomical Observatory of Japan, 2-21-1 Osawa, Mitaka, Tokyo 181-8588, Japan
8Department of Physics, Faculty of Science and Engineering, Konan University, 8-9-1 Okamoto,
Kobe, Hyogo 658-8501, Japan
9Department of Astronomy, University of Washington, Box 351580, Seattle, WA 98195-1580,
1

USA
10Instituto de Fısica Fundamental, Consejo Superior de Investigaciones Cientıficas, c/. Serrano
121, E-28006, Madrid, Spain
11Institut de Ciencies del Cosmos (UB-IEEC), c/. Martı i Franques 1, E-08028, v, Spain
12Department of Physics and Astronomy, Aarhus University, Ny Munkegade 120, 8000 Aarhus
C, Denmark
13Astrophysics Research Institute, Liverpool John Moores University, IC2, Liverpool Science
Park, 146 Brownlow Hill, Liverpool L3 5RF, UK
14Max-Planck-Institut fur Astrophysik, Karl-Schwarzschild-Str. 1, D-85748 Garching, Ger-
many
15Centre for Astrophysics and Supercomputing, Swinburne University of Technology, Hawthorn,
Vic 3122, Australia
16European Organisation for Astronomical Research in the Southern Hemisphere (ESO), Karl-
Schwarzschild-Str. 2, 85748 Garching b. Munchen, Germany
17George P. and Cynthia Woods Mitchell Institute for Fundamental Physics Astronomy, Texas
A. M. University, Department of Physics and Astronomy, 4242 TAMU, College Station, TX
77843, USA
18Purple Mountain Observatory, Chinese Academy of Sciences, Nanjing 210008, China
19Instituto de Astrofısica de Canarias, E-38205 La Laguna, Tenerife, Spain
20Departamento de Astrofısica, Universidad de La Laguna, E-38206 La Laguna, Tenerife,
Spain
21SOKENDAI (The Graduate University for Advanced Studies), Mitaka, Tokyo, 181-8588, Japan
2

Type Ia Supernovae (SNe Ia) arise from the thermonuclear explosion of carbon-oxygen
white dwarfs1,2. Though the uniformity of their light curves makes them powerful cosmo-
logical distance indicators3,4, long-standing issues remain regarding their progenitors and
explosion mechanisms2,5,6. Recent detection of the early ultraviolet pulse of a peculiar
subluminous SN Ia has been claimed as new evidence for the companion-ejecta interac-
tion through the single-degenerate channel7,8. Here, we report the discovery of a promi-
nent but red optical flash at ∼ 0.5 days after the explosion of a SN Ia which shows hybrid
features of different SN Ia sub-classes: a light curve typical of normal-brightness SNe Ia,
but with strong titanium absorptions, commonly seen in subluminous SN Ia spectra. We
argue that the early flash of such a hybrid SN Ia is different from predictions of previ-
ously suggested scenarios such as the companion-ejecta interaction8−10. Instead it can be
naturally explained by a SN explosion triggered by a detonation of a thin helium shell
either on a near-Chandrasekhar-mass white dwarf (& 1.3 M) with low-yield 56Ni or on a
sub-Chandrasekhar-mass white dwarf (∼ 1.0 M) merging with a less massive secondary.
This finding provides compelling evidence that one branch of the proposed explosion mod-
els, the Helium-ignition scenario, does exist in nature, and such a scenario may account
for explosions of white dwarfs in a wider mass range in contrast to what was previously
supposed11−14.
A faint optical transient was discovered on UT April 4th, 2016 through the newly established
high-cadence deep-imaging survey which is optimized for finding Type Ia Supernovae (SNe Ia)
within a few days after explosion with the Subaru/Hyper Suprime-Cam (HSC)15—“the MUlti-
3
band Subaru Survey for Early-phase SNe Ia” (MUSSES). Close attention has been paid to one
transient because its brightness increased by∼ 6.3 times within 20 hours of the first observation.
We designated this fast-rising transient as MUSSES1604D (the official ID is SN 2016jhr), the
fourth early-phase SN candidate found in the April 2016 observing run of MUSSES.
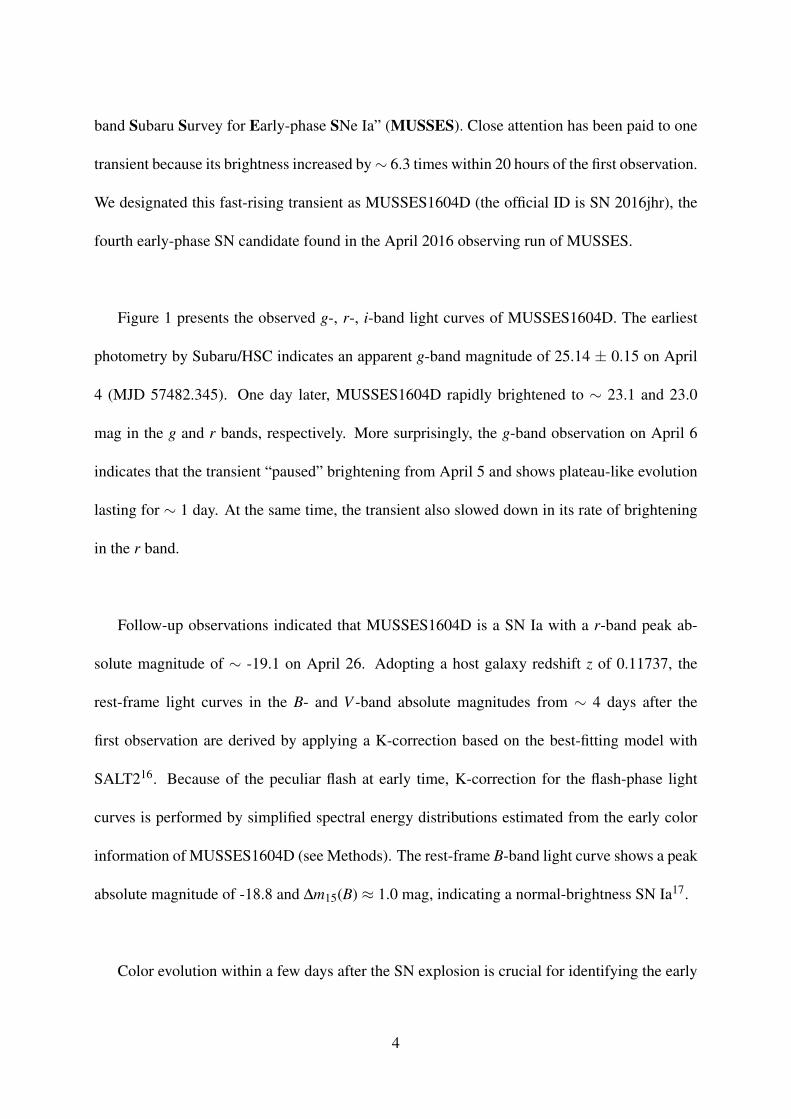
Figure 1 presents the observed g-, r-, i-band light curves of MUSSES1604D. The earliest
photometry by Subaru/HSC indicates an apparent g-band magnitude of 25.14 ± 0.15 on April
4 (MJD 57482.345). One day later, MUSSES1604D rapidly brightened to ∼ 23.1 and 23.0
mag in the g and r bands, respectively. More surprisingly, the g-band observation on April 6
indicates that the transient “paused” brightening from April 5 and shows plateau-like evolution
lasting for ∼ 1 day. At the same time, the transient also slowed down in its rate of brightening
in the r band.
Follow-up observations indicated that MUSSES1604D is a SN Ia with a r-band peak ab-
solute magnitude of ∼ -19.1 on April 26. Adopting a host galaxy redshift z of 0.11737, the
rest-frame light curves in the B- and V -band absolute magnitudes from ∼ 4 days after the
first observation are derived by applying a K-correction based on the best-fitting model with
SALT216. Because of the peculiar flash at early time, K-correction for the flash-phase light
curves is performed by simplified spectral energy distributions estimated from the early color
information of MUSSES1604D (see Methods). The rest-frame B-band light curve shows a peak
absolute magnitude of -18.8 and ∆m15(B) ≈ 1.0 mag, indicating a normal-brightness SN Ia17.
Color evolution within a few days after the SN explosion is crucial for identifying the early
4

flash8,10. In contrast to another peculiar early-flash SN Ia iPTF14atg with B−V color evolution
obtained only from ∼ 5 days after the discovery7, the specific survey strategy of the MUSSES
project enables us to obtain the color information of MUSSES1604D from ∼ 1 day after our
first observation (Figure 2), which shows a B−V color of∼ 0.1 mag at first, and rapidly reddens
to ∼ 0.4 mag in one day.
The interaction of SN ejecta with a non-degenerate companion star8,18,19 (companion-ejecta
interaction, CEI) or with dense circumstellar material9,10 (CSM-ejecta interaction) are popu-
lar scenarios to explain the early optical flash. In order to produce a prominent optical flash
comparable to that of MUSSES1604D, either a companion with a very extended envelope or
a large-scale CSM distribution is required. In the CEI scenario, a prominent flash generated
from the inner hot region of ejecta can be observed through the hole which is carved by a
red-giant companion8,19. In the CSM-ejecta-interaction scenario, a more extended CSM dis-
tribution could generate a brighter flash but with longer diffusion time. Our best-fitting CEI
model (Figure 2 & 3) and previous simulations of both two scenarios8,10,19 all indicate that the
particular blue color evolution is inevitable when producing the early flash as bright as that of
MUSSES1604D (Extended Data Figure 1), which is incompatible with the red and rapid early
color evolution observed for MUSSES1604D.
Peculiar spectral features have been discovered around the peak epoch (Figure 4). At a first
glance, the Si II λ6355 line, “W”-shape S II feature, and Ca II H & K absorptions are reminis-
cent of a normal SN Ia, while the weak Si II λ5972 line indicates a higher photospheric tem-
perature compared to those of SNe Ia with similar luminosities. On the other hand, prominent
5

absorption features such as the Ti II trough around 4150 A, usually attributed to low tempera-
ture, have been found at the same time, in contrast to the brightness indicated by the light curve.
By inspection of near-maximum spectra of over 800 non-subluminous SNe Ia, we found three
MUSSES1604D-like SNe Ia—SN 2006bt, SN 2007cq, and SN 2012df (Extended Data Figure
2 & 3). This fraction of ∼ 0.5% indicates the rarity of such hybrid SNe Ia.
The peculiar spectral features and the early flash followed by a normal-brightness light
curve observed for MUSSES1604D are incompatible with predictions of classical explosion
mechanisms20,21 through the hydrogen-accreting single degenerate channel, but suggested by a
specific scenario in which the SN explosion is triggered by the He-shell detonation, so-called
the double-detonation (DDet) scenario12,13,22,23. In principle, a He-shell detonation not only
generates a shock wave propagating toward the center of the white dwarf (WD) and ignites car-
bon burning near the center, but also allocates 56Ni and other radioactive isotopes such as 52Fe
and 48Cr to the outermost layers where the optical depth is relatively low12,23. Therefore energy
deposited by decaying radioactive isotopes diffuses out and consequently results in a prominent
flash in the first few days after the explosion (see Methods). Observationally, the plateau-like
light curve enhancement can be observed with the day-cadence observations. At the same time,
a significant amount of not only iron group elements but also intermediate mass elements such
as Ti and Ca will be produced in the outermost layers12,13,23. Vast numbers of absorption lines
of these elements are very effective in blocking the flux in the blue part of the spectrum, thus
leading to a relatively red B−V color evolution in general. Indeed, while a substantial amount
of He is left after the detonation, the expected spectrum would not show a trace of He in the
optical24. By assuming a progenitor star with a WD mass of 1.03 M and a He-shell mass
6

as low as ∼ 0.054 M (as required to trigger the He detonation on the surface of a 1.03 M
WD12,23), the prominent early flash, peculiar early color evolution and Ti II trough feature are
reproduced simultaneously (Figures 2–4). The similar early-phase photometric behavior found
in our simulation has also been independently shown by a simulation of the sub-Chandrasekhar
DDet model by another group very recently25, showing the validity of our simulation and inter-
pretation.
A potential issue in our simulation is the assumption of a sub-Chandrasekhar-mass WD with
a thin He-shell. The amount of synthesized 56Ni is sensitive to the mass of the exploding WD
and determines the peak luminosity12,23. The DDet model requires a sub-Chandrasekhar-mass
WD (∼ 1 M) for the peak luminosity of MUSSES1604D. However, DDet happening on such a
WD would lead to a fast-evolving B-band light curve, which is inconsistent with a much slower-
evolving light curve observed for MUSSES1604D. In addition, an early flash resulting from the
corresponding He mass of 0.054 M is too bright. We suggest two alternative scenarios that
also involve He detonation to solve this issue. A He-ignited violent merger14 can easily trigger a
detonation in a thin He shell, and could produce the light curve of MUSSES1604D, but by fine-
tuning the configuration of the binary system. Whether core detonation can be triggered by the
thin-He-shell detonation through the double-degenerate channel is also an open question26,27.
Alternatively, the lower mass He can be detonated on the surface of a near-Chandrasekhar-mass
WD, which provides a better and more straightforward account of the light curve and spectral
features (Figures 2–4). Further investigation suggests that the best-fitting WD mass is in the
range of 1.28–1.38 M but with a low-yield 56Ni compared with the prediction by DDet (see
Methods). This suggests that there could be a mechanism to reduce the mass of 56Ni in the
7

explosion triggered by the He detonation. For example, the shock wave generated by the He
detonation may trigger a deflagration rather than a detonation near the center of the WD28 due
to the high degeneracy pressure inhibiting the formation of a shock wave as strong as the sub-
Chandrasekhar-mass WD counterpart. Though the observed peculiarities of MUSSES1604D
can be naturally explained by this scenario, how a thin He-shell is formed on such a massive
WD during the binary evolution still requires further investigation.
The discovery of MUSSES1604D indicates that the He-detonation-triggered scenario is also
promising to explain early-flash SNe Ia in addition to other “popular” scenarios8−10. The promi-
nent optical excess and peculiar color evolution in the earliest phase together with absorptions
due to Ti II ions in around-max spectra can be used as indicators of this scenario. The slow-
evolving B-band light curve makes the classical sub-Chandrasekhar DDet model previously
supposed11,12 unlikely. Recent work shows that the sub-Chandrasekhar DDet scenario could
explain a part of normal SNe Ia if only a negligible amount of He exists at the time of the
He-shell detonation29,30. Given that MUSSES1604D is best explained by a thin He-shell but
still more massive than required in the above scenario, it opens up a possibility that the He-
detonation-trigger scenario would produce a range of observational counterparts, controlled by
the masses of both the WD and the He shell. The discovery of MUSSES1604D thus provides
the first observational calibration about the range and combination of these quantities realized
in nature.
8

1. Filippenko, A. V. Optical Spectra of Supernovae. Ann. Rev. Astron. Astrophys. 35, 309–355(1997).
2. Maoz, D., Mannucci, F. & Nelemans, G. Observational Clues to the Progenitors of Type IaSupernovae. Ann. Rev. Astron. Astrophys. 52, 107–170 (2014).
3. Perlmutter, S., et al. Measurements of Ω and Λ from 42 High-Redshift Supernovae. Astro-phys. J. 517, 565–586 (1999).
4. Riess, A. G., et al. Observational Evidence from Supernovae for an Accelerating Universeand a Cosmological Constant. Astron. J. 116, 1009–1038 (1998).
5. Hillebrandt, W. & Niemeyer, J. C. Type IA Supernova Explosion Models. Ann. Rev. Astron.Astrophys. 38, 191–230 (2000).
6. Whelan, J. & Iben, I., Jr. Binaries and Supernovae of Type I. Astrophys. J. 186, 1007–1014(1973).
7. Cao, Y. et al. A strong ultraviolet pulse from a newborn type Ia supernova. Nature. 521,328–331 (2015).
8. Kasen, D. Seeing the Collision of a Supernova with Its Companion Star. Astrophys. J. 708,1025–1031 (2010).
9. Levanon, N., Soker, N. & Garcıa-Berro, E. Constraining the double-degenerate scenario forType Ia supernovae from merger ejected matter. Mon. Not. Astron. Roy. Soc. 447, 2803–2809(2015).
10. Piro, A. L. & Morozova, V. S. Exploring the Potential Diversity of Early Type Ia SupernovaLight Curves. Astrophys. J. 826, 96 (2016).
11. Bildsten, L., Shen, K. J., Weinberg, N. N. & Nelemans, G. Faint Thermonuclear Supernovaefrom AM Canum Venaticorum Binaries. Astrophys. J. Lett. 662, L95–L98 (2007).
12. Fink, M., et al. Double-detonation sub-Chandrasekhar supernovae: can minimum heliumshell masses detonate the core? Astron. & Astrophys. 514, 53 (2010).
13. Woosley, S. E. & Kasen, D. Sub-Chandrasekhar Mass Models for Supernovae. Astrophys.
9

J. Lett. 747, 38 (2011).
14. Pakmor, R., Kromer, M., Taubenberger, S. & Springel, V. Helium-ignited Violent Mergersas a Unified Model for Normal and Rapidly Declining Type Ia Supernovae. Astrophys. J. Lett.770, L8 (2013).
15. Miyazaki, S., et al. Hyper Suprime-Cam. SPIE, 8446, 84460Z-1–84460Z-9 (2012).
16. Guy, J., et al. SALT2: using distant supernovae to improve the use of type Ia supernovae asdistance indicators. Astron. & Astrophys. 466, 11–21 (2007).
17. Phillips, M. M. The absolute magnitudes of Type IA supernovae. Astrophys. J. Lett. 413,L105–L108 (1993).
18. Pan, K., Ricker, P. M. & Taam, R. E. Impact of Type Ia Supernova Ejecta on Binary Com-panions in the Single-degenerate Scenario. Astrophys. J. 750, 151 (2012).
19. Kutsuna, M. & Shigeyama, T. Revealing progenitors of type Ia supernovae from their lightcurves and spectra. Publ. Astron. Soc. Jap. 67, 54 (2016).
20. Nomoto, K., Thielemann, F. -K. & Yokoi, K. Accreting white dwarf models for type I su-pern. III. Carbon deflagration supernovae. Astrophys. J. 286, 644–658 (1984).
21. Khokhlov, A. M. Delayed detonation model for type IA supernovae. Astron. & Astrophys.245, 114–128 (1991).
22. Guillochon, J., Dan, M., Ramirez-Ruiz, E. & Rosswog, S. Surface Detonations in DoubleDegenerate Binary Systems Triggered by Accretion Stream Instabilities. Astrophys. J. Lett.709, L64–L69 (2010).
23. Kromer, M., et al. Double-detonation Sub-Chandrasekhar Supernovae: Synthetic Observ-ables for Minimum Helium Shell Mass Models. Astrophys. J. 719, 1067–1082 (2010).
24. Boyle, A., Sim, S. A., Hachinger, S. & Kerzendorf, W. Helium in Double-Detonation Mod-els of Type Ia Supernovae. Astron. & Astrophys. 599, 46 (2017).
25. Noebauer, U. M., et al. Early light curves for Type Ia supernova explosion models. Preprintat (http://arxiv.org/abs/1706.03613) (2017).
10

26. Shen, K. J. & Bildsten, L. The Ignition of Carbon Detonations via Converging Shock Wavesin White Dwarfs. Astrophys. J. 785, 61 (2014).
27. Tanikawa, A., et al. Hydrodynamical Evolution of Merging Carbon-Oxygen White Dwarfs:Their Pre-supernova Structure and Observational Counterparts. Astrophys. J. 807, 40 (2015).
28. Nomoto, K., Sugimoto, D. & Neo, S. Carbon Deflagration Supernova, an Alternative toCarbon Detonation. Astrophys Space Sci. 39, L37–L42 (1976).
29. Blondin, S., Dessart, L., Hillier, D. J. & Khokhlov. A. M. Evidence for sub-Chandrasekhar-mass progenitors of Type Ia supernovae at the faint end of the widthluminosity relation. Mon.Not. Astron. Roy. Soc. 470, 157–165 (2017).
30. Shen, K. J., Kasen, D., Miles, B. J. & Townsley, D. M. Sub-Chandrasekhar-mass whitedwarf detonations revisited. Preprint at (http://arxiv.org/abs/1706.01898) (2017).
11

Author Contributions J.J. initiated the study, conducted analysis and wrote the manuscript
as the PI of the MUSSES project. M.D. contributed to the initiation of the MUSSES project,
and assisted with the manuscript preparation and the analysis together with K.M. and T.S. K.M.
and T.S. organized the efforts for the theoretical interpretation with J.J. and M.D. K.M. inves-
tigated the He-detonation-triggered explosion models and conducted radiative transfer calcula-
tions used to generate simulated light curves and spectra. T.S. developed and ran the radiative
transfer calculations used to generate simulated CEI-induced light curves. K.N. provided in-
sights into the He-detonation-triggered explosion models and assisted with the analysis. N.Y.,
H.F. and M.S are core software developers for HSC and in charge of the HSC SSP project.
N.Y. also developed the HSC transient server with N.T. and M.T. for the real-time candidates
selection and contributed to the Subaru/HSC observation and data reduction. T.M. contributed
to the Subaru/HSC observation and the Kiso/KWFC ToO observation. S.W.J. contributed to the
SALT spectroscopies and data reduction. Z.I., A.C., P.Y., P.R-L., N.S., F.P., D.B., J.M., L.W.,
M.D.S., D.J., P.A.M. and C.A. are core collaborators of the MUSSES project who are in charge
of follow-up observations (including proposal preparations) with ARC, GTC, VLT, NOT, INT
and LT. All the authors contributed to discussions.
Author Information The authors declare no competing financial interests. Correspondence
and requests for materials should be addressed to J.J. (email: [email protected]).
12
-20
-18
-16
-14
-12
0 10 20 30 40 50 60
18
20
22
24
26
i−1
r
g+1
Ab
so
lute
ma
gn
itu
de
Ap
pa
ren
t m
ag
nitu
de
Days since the explosion (April 3)
-16.5
-15
-13.5
0 1 2 3 4 5
22
23
24
25
26
HSC rHSC g
Figure 1: The multi-band light curve of MUSSES1604D. Photometry in g, r and i bands
(observer-frame) are in the AB system. The error bars denote 1-σ uncertainties. Dashed lines
in g, r and i bands are best-fitting light curves derived from the non-early photometry (t & 12
days) with SALT216. The explosion epoch is estimated by adopting a classical t2 fireball model
for the early-flash phase (see Methods). The inset zooms in on the early-phase multi-band light
curve by Subaru/HSC, which shows that the brightening in g-band “paused” after the second-
night observation.
13

0
0.5
1
1.5
-20 -10 0 10 20 30 40
a
B−V
SN 2011fe
SN 2012ht
SN 2015F
SN 2006bt
iPTF14atg
MUSSES1604D
0
0.5
1
1.5
-20 -10 0 10 20
MUSSES1604DMUSSES1604D (g−r)
Companion-Ejecta Interaction
(1.03+0.054)MO. WD-He(1.28+0.013)MO. WD-He
(1.38+0.010)MO. WD-He(1.38+0.030)MO. WD-He
b
B−V
Days since B-band max (rest-frame)
Figure 2: Comparative analysis of MUSSES1604D color evolution. The upper panel
presents B−V color evolution of MUSSES1604D, iPTF14atg, SN 2006bt (MUSSES1604D-
like), SN 2012ht (transitional), SN 2015F and SN 2011fe (normal). The lower panel shows
the color evolution predicted by CEI, He-detonation model for the sub-Chandrasekhar-mass
WD and the newly proposed He-detonation models for the near-Chandrasekhar-mass WD un-
der different He-shell mass assumptions. The date of B-band maximum is ∼ 20 days after the
explosion. As the bandpass difference between the rest-frame B/V band and the observer-frame
g/r band is inconspicuous at z∼ 0.1, the observed g−r color evolution is provided for reference.
Error bars represent 1-σ uncertainties.
14

-20
-18
-16
-14
-12
0 10 20 30 40
a
Ab
so
lute
B m
ag
nitu
de
Days since the explosion (April 3)
-16.5
-15
-13.5
0 1 2 3 4
-20
-18
-16
-14
-12
0 10 20 30 40
b
Ab
so
lute
V m
ag
nitu
de
Days since the explosion (April 3)
-16.5
-15
-13.5
0 1 2 3 4
Figure 3: Rest-frame B- and V -band light curves of MUSSES1604D and simulations. K-
corrections in the flash (open squares) and the post-flash phase (solid squares) are carried out
with different methods. Each panel includes He-detonation models for sub-Chandrasekhar-
mass WD (1.03 M WD + 0.054 M He-shell; black dashed line) and massive WD (1.28 M
WD + 0.013 M He-shell, orange long-dashed line; 1.38 M WD + 0.01 M He-shell, red
dotted line; 1.38 M WD + 0.03 M He-shell, red solid line) conditions. The inset zooms in
on the flash phase and also includes our best-fitting CEI model assuming a 1.05 M red-giant
companion (magenta dash-dot line). The first-night g-band data (blue circles) are included in
panel a. Error bars denote 1-σ uncertainties.
15

4000 5000 6000 7000
4000 5000 6000 7000 8000
MUSSES1604D at −2 day
SN 2011fe at −1.3 day
SN 1999dq at −2.5 day
iPTF14atg at −2 day
SN 1999by at −2 day
SN 2000cx near max
SN 2012df near max
Si IIS IIFe II/IIITi IICa II a
Sca
led
F λ
+ c
onst
ant
Rest−frame wavelength (Å)
Observer−frame wavelength (Å)
4000 5000 6000 7000 8000
4000 5000 6000 7000 8000 9000
1.38 MO. WD + 0.000 MO. He−shell
1.38 MO. WD + 0.010 MO. He−shell
1.38 MO. WD + 0.030 MO. He−shell
1.28 MO. WD + 0.013 MO. He−shell
1.03 MO. WD + 0.054 MO. He−shell
b
Rest−frame wavelength (Å)
Observer−frame wavelength (Å)
Figure 4: The around-maximum spectral comparison between MUSSES1604D, other ob-
served SNe Ia of different types, and models. In panel a, the spectrum of MUSSES1604D
taken 2 days before the B-band maximum by SALT is compared with that of SN 2011fe (nor-
mal), SN 1999dq (shallow-silicon), SN 1999by (subluminous), iPTF14atg (early-flash) and
SN 2012df (MUSSES1604D-like) at similar epoch. Major absorption features are labeled on
the spectrum of MUSSES1604D. In panel b, simulated spectra of the classical W7 deflagration
model, the newly proposed He-detonation models with different He-shell mass assumptions and
the classical double-detonation model for the sub-Chandrasekhar-mass WD are compared with
MUSSES1604D at the same epoch.
16

Methods
I. The Handbook for MUSSES1604D
The MUSSES project and the discovery of MUSSES1604D The Subaru Hyper Suprime-
Cam15 (HSC) is a new generation large field camera which started to serve as a facility instru-
ment of the 8.2-m Subaru telescope for open-use from 2014. With a total of 116 CCDs, a single
HSC pointing covers 1.8 square degrees and reaches to a g-band limiting magnitude (5-σ ) of
about 26.5 mag with exposure time of 300 s.
The MUlti-band Subaru Survey for Early-phase SNe Ia (MUSSES) is a newly established
project which aims to systematically investigate the photometric and spectroscopic behavior
of SNe Ia within a few days after their explosions (hereafter Early-phase SNe Ia, ESNe Ia)
with Subaru/HSC and other 1–10 m class telescopes around the world. In every semester, we
plan to carry out 1–2 observing runs and each of them includes two stages: the Subaru/HSC
survey (2–3 nights) and follow-up observations. For the survey stage, Subaru/HSC observes
over 100 square degrees of sky with a g-band limiting magnitude of 26.0 (5-σ ) every night
for finding ESNe Ia and obtaining their multi-band light curve information. Using the HSC
transient pipeline and newly employed machine-learning classifiers, we are able to carry out
real-time candidate selection during the survey and trigger photometric/spectroscopic follow-
ups within one day after the Subaru observation. Because of the fast brightening of ESNe Ia,
photometric follow-up observations can be conducted well with 1–4 m telescopes. The strategy
of MUSSES gives a very large photometric dynamic range, enabling us to observe ESNe Ia
17

even reaching to redshift z ∼ 0.3.
In order to make the best use of the Subaru time, the MUSSES observing run in April 2016
adopted a specific survey mode which combines both HSC Subaru Strategic Program (HSC
SSP31, 1-night g-band observation, from UT 2016 April 4.17 to UT 2016 April 4.67) and open-
use observation (1.5-nights g- and r-band observation, from UT 2016 April 5.17 to 5.67 and
April 6.43 to 6.67 respectively).
The supernova MUSSES1604D (official ID: SN 2016jhr) was discovered on UT 2016 April
4.345 at α(J2000) = 12h18m19s.85 and δ (J2000) = +0015’17.38” with a g-band magnitude of
25.14 mag upon discovery (Extended Data Figure 4), and was the fourth ESN candidate found
in the April observing run. MUSSES1604D was located about 5.8” (to the southwest) from
the host galaxy. The redshift of the host galaxy is 0.11737 ± 0.00001 according to the SDSS
(Data Release 12)32. With cosmological parameters H0 = 70 km s−1 Mpc−1, Ωm = 0.30, ΩΛ
= 0.70 and Ων = 0.00, we calculate a luminosity distance of 546.5 megaparsecs and a distance
modulus of 38.67 mag for MUSSES1604D.
The host galaxy The red color with a visible Hα emission feature suggests that the host
galaxy of MUSSES1604D is a star-forming early type galaxy33. Further analysis of the SDSS
photometry and spectroscopy shows the semi major axis of the host is ∼ 27.9 kiloparsecs and
the stellar mass is ∼ 2.8 × 10¹⁰ M, which is also consistent with an early type galaxy, e.g. an
S0 galaxy.
18

Follow-up observations Our scheduled early follow-up observations at La Palma island
and Apache Point Observatory were lost due to poor weather conditions. Fortunately, HSC SSP
r-band observation conducted in two days after our Subaru/HSC observations successfully took
another r-band image of MUSSES1604D, which provides a crucial constraint on the timescale
of the early-flash. Multi-band follow-up observations with the 8.2-m Gemini-North telescope,
the 3.5-m ARC telescope, the 2.5-m Nordic Optical Telescope (NOT), the 2.5-m Isaac Newton
Telescope (INT), the 2-m Liverpool Telescope (LT) and the 1.05-m Kiso Schmidt telescope
have been conducted from about -8 days to +40 days after the B-band maximum. For the
spectroscopic observations, we triggered the 9.2-m SALT telescope and the 8.2-m Gemini-
North telescope at specific epochs to get spectral evolution from about -2 days to one month
after the B-band maximum (Extended Data Figure 2).
Data reduction and photometric calibration As MUSSES1604D resides at the edge of
the host galaxy, contamination from the host is negligible except for the photometry of the
earliest Subaru/HSC observation. The morphology of the host galaxy indicates a symmetric S0
galaxy. We thus built the host template with GALFIT34,35 and performed the standard point
spread function (PSF) photometry with the IRAF DAOPHOT package36 on host-subtracted
images. The photometry has been tested by subtracting the SN from the original image using
an artificial PSF star with the derived photometric magnitude. The average flux of the residual
region is comparable with the surrounding region and well below the photometric error of the
discovery image by Subaru (∆m≈ 0.14 mag). PSF photometry is performed on host-subtracted
images for all follow-up observations. The photometry is then calibrated to the standard SDSS
photometric system by adopting a color term correction based on field stars37. For spectroscopic
19

data reduction, all data were reduced with standard routines in IRAF.
II. Light curve fitting and K-correction
Considering the limited understanding of spectral features during the early optical flash
phase of MUSSES1604D, we adopt different methods to derive the rest-frame light curves
at flash and post-flash phases respectively. For the post-flash light curves, we firstly fit the
observed light curves by applying the SALT2 model of SNe Ia spectrophotometric evolution
which is built using a large data set including light curves and spectra of both nearby and
distant SNe Ia16. After light curve fitting, K-correction is performed for the rest-frame B- and
V -band light curves according to the best-fitting spectral sequence model of MUSSES1604D
with SNCosmo38. For the light curve in the flash phase (within 5 days after the explosion),
we applied the color-based K-correction with a pseudo power-law spectral energy distribution
(SED) function f (ν) = kνα , where k and α are parameters derived by the early color information
of MUSSES1604D. Considering there is no indication of Na I D absorptions in any of our
spectra (S/N ∼ 18 per resolution element near the wavelength of Na I D lines for the around-
max spectrum) and the supernova was located far away from the center of an S0 type host, we
only take into account the Galactic extinction of E(B−V )MW = 0.0263 mag (SFD, 199839) in
this paper. The rest-frame B- and V -band light curves are shown in Extended Data Figure 3.
The K-corrected rest-frame light curve of MUSSES1604D indicates a B-band peak absolute
magnitude of -18.8 but with ∆m15(B) ≈ 1.0 mag, corresponding to a slow-evolving normal-
brightness SN Ia according to the Phillips relation17. The V -band light curve of MUSSES1604D
20

is consistent with typical normal-brightness SNe Ia, such as SN 2011fe. All photometric data
in observer and rest frames are listed in Extended Data Table 1.
III. Explanations for the peculiarities of MUSSES1604D
The “peculiarities” of MUSSES1604D mainly include: 1) a prominent optical flash with
peculiar color evolution at very early time; 2) the red B−V color evolution in general; 3) a
normal-brightness SN Ia with prominent Ti II absorptions in the around-max spectrum; 4) a
slow-evolving B-band light curve. In this section, we compare different scenarios which may
account for such peculiarities and find the best solution.
The companion-ejecta interaction We performed two-dimensional axisymmetric radiation
hydrodynamic simulations of the explosions of a WD with a Chandrasekhar mass in binary
systems to obtain light curves and spectra resulting from collisions between the ejecta and
the companion star (Kutsuna-Shigeyama CEI models19,40). The ejecta are described by the
W7 model20. The best-fitting light curves presented in Figure 3 are the expected outcome
of an explosion in a binary system with a separation of 2.5×1013 cm when we observe this
event from the companion side. The companion star is a red giant with a mass of 1.05 M
(the core mass is 0.45 M) and a radius of 8.9×1012 cm, filling the Roche lobe. The initial
mass of the companion was assumed to be 1.50 M. Although the CEI-induced early flash
could be prominent under this condition, we cannot reproduce the early light curves and B−V
color evolution of MUSSES1604D because a strong but long-duration flash will be produced
after interacting with a red giant which has a more extended envelope8,19. For the spectral
21

peculiarity (Figure 4), the prominent Ti II lines also contradict the predictions from typical
explosion models through the hydrogen-accreting single degenerate channel5,20.
Further comparisons of early-phase light curves with both Kutsuna-Shigeyama (K-S) and
Kasen’s (K10) CEI models8,19 are presented in panels (a)–(c) of Extended Data Figure 1. Note
that K10 predicts brighter early flash than K-S models because it assumes instantaneous ther-
malization in the shocked matter while K-S models approximately take into account ther-
malization processes between shocked matter and radiation (cooling of shocked matter by
bremsstrahlung). As K10 noticed, the assumption of instantaneous thermalization tends to
underestimate the energies of photons and also results in overestimating the emissivity from
shocked matter. Therefore, K10 models produce a prominent flash with a low-mass main-
sequence companion while K-S models can only marginally produce a comparable early flash
with a red-giant companion. Accordingly, K-S models with a main-sequence companion pro-
duce an even fainter early flash. Despite the different assumptions in two CEI models, both of
the models with an early flash as bright as that of MUSSES1604D predict blue color of B−V
. 0.1 in the first 4 days after the explosion, which is incompatible with the observations of
MUSSES1604D.
The CSM-ejecta interaction In the double-degenerate progenitor scenario where a SN Ia
is generated from the merger of two WDs, a considerable amount of material from the dis-
rupted secondary WD may get pushed out to a large radius41,42 and possibly result in an early
ultraviolet/optical flash due to the interaction with the ejecta9,10. The strong early light curve
enhancement requires a very extended CSM distribution10,43. Regardless of the physical possi-
22

bility of reaching the CSM distribution under their assumptions, interacting with more extended
CSM not only strengthens the early flash but also increases the diffusion time, and consequently
results in a bluer and longer flash phase10. As can be seen in panels (d)–(f) of Extended Data
Figure 1, early light curves and color evolution predicted by the CSM-ejecta interaction are
apparently different from those of MUSSES1604D. To produce a flash with the comparable
brightness to the observed one, the particular blue and slow color evolution is inevitable for the
CSM-ejecta interaction even after fine-tuning the CSM scale and the 56Ni distribution of the
inner ejecta. Therefore, the CSM-ejecta interaction cannot explain the prominent early flash
with a red and rapid B−V color evolution observed for MUSSES1604D.
The He-detonation-triggered scenarios Another scenario is the SN Ia explosion triggered
by the detonation of the He layer. The He detonation accommodates the radioactive materials as
the nucleosynthesis ash. For example, the He detonation on the surface of the Chandrasekhar-
mass WD would leave 56Ni as a main energy source in this layer with the mass fraction (X56Ni)
reaching to∼ 20% (see below). The diffusion time scale44 of this He layer to optical photons is
estimated to be∼ 2 days×(κ/0.2cm2g−1)0.5(MHe/0.02M)0.5(VHe/20,000kms−1)−0.5. Here,
the subscript “He” is used for the quantities related to the He layer, and the He as a dominant
element in the layer is assumed to be fully ionized. The decay power at ∼ 2 days from the 56Ni
in the He layer is estimated to be∼ 2.5×1041 erg s−1 (X56Ni/0.2)×(MHe/0.02M). Therefore,
the radioactivity in the He-detonation ash is predicted to produce a prompt flash lasting for a few
days with the peak bolometric magnitude of∼ -16 assuming the He mass MHe ∼ 0.03 M. This
scenario roughly explains the nature of the early flash found for MUSSES1604D. For the sub-
Chandrasekhar WD, the abundance in the He ash is dominated by the other radioactive isotopes,
23

52Fe and 48Cr, and they power the early flash. Still, a similar argument as above applies.
The synthetic light curves and spectra expected for the He-shell detonation models are sim-
ulated as follows (Figures 2–4). We constructed a series of toy one-dimensional models which
mimic the results of DDet hydrodynamic simulations13,23. The density structure is assumed
to be exponential in velocity space, where the kinetic energy is specified by the energy gener-
ation for the assumed burned composition structure. A stratified structure in the composition
and uniform abundance pattern in each layer are assumed, where the distribution of the burning
products is set to represent the DDet models23.
The model structures are shown in Extended Data Figures 5 and 6. Our sub-Chandrasekhar
model and the Chandrasekhar model are similar to a typical DDet model and W7 model, re-
spectively, in the mass coordinate. For the Chandrasekhar WD model, we replace a part of
56Ni-rich region by the Si-rich region, leading to a more centrally confined structure than the
W7 model. Note that we assume a stable Fe/Ni region in the core of the Chandrasekhar model,
the mass of which is taken to be ∼ 0.2 M similar to the W7 model. For each model, we run
multi-frequency and time-dependent Monte-Carlo radiation transfer calculations45, which were
updated to include radioactive energy input from the decay chains of 52Fe/Mn/Cr and 48Cr/V/Ti
together with 56Ni/Co/Fe. The code assumes LTE for the ionization, which is generally believed
to be a good approximation in the early phase. For example, in the W7 model, LTE and NLTE
simulations yield indistinguishable light curves (except for the U-band) until ∼ 25 days after
the explosion, corresponding to ∼ 5 days after the B-maximum46. In addition, we do not in-
clude the non-thermal excitation of He; generally He absorption lines are invisible for the DDet
24

models even with this effect24.
The peculiar early light curve and color evolution as well as the strong Ti II absorptions for
MUSSES1604D can be naturally reproduced by the DDet scenario, as shown by the model for
the 1.03 M WD with 0.054 M He (ash) layer in Figure 2–4. We note that the idea that the
DDet model predicts the early flash by the radioactive decays of the He ash has been indepen-
dently proposed by another groupi. Their model, qualitatively similar to our sub-Chandrasekhar
model, leads to the early flash and the color evolution in the first few days powered by the decay
of 52Fe and 48Cr, as is similar to our model prediction. Their model lacks around/post-maximum
light curve and spectral information, therefore further comparison between the two models is
not possible. Although the sub-Chandrasekhar DDet model can explain most of peculiarities
of MUSSES1604D, it has prominent defects in the resulting fast evolution of the simulated B-
band light curve (see also refs13,23). Note that the fast decline of B-band light curve predicted
by this classical DDet scenario of the sub-Chandrasekhar-mass WD happens from ∼ 17 days
after the explosion, and the magnitude becomes ∼ 1.4 mag fainter than the peak at t ∼ 25 days.
The difference between the LTE and NLTE treatments in the first 25 days after the explosion is
too small to account for such abnormal light curve evolution46, and thus it is unlikely that the
LTE assumption accounts for this discrepancy. Another issue is that the quantity of radioac-
tive isotopes (0.054 M of the He layer as a minimal He shell for the He detonation) produces a
stronger flash than that of MUSSES1604D, which indicates the observationally required amount
of the He layer is smaller. For further investigation of the classical DDet scenario, we ran a grid
of models spanning WD masses between ∼ 0.9 and 1.4 M, but all the models predict very fast
iThe paper by Noebauer et al.25 was posted on arXiv after we had submitted the original manuscript in whichwe proposed the same idea based on our own simulations.
25

evolution in the B-band light curve and/or too bright peak luminosity.
Indeed, this fast evolution in the B-band light curve has been recognized as one of the issues
in the (sub-Chandrasekhar) DDet model13, since the Fe-peak and Ti/Cr in the He ash should
start blocking the photons in the bluer bands once the temperature decreases after the maximum
light, and this argument is not sensitive to the LTE or NLTE treatment. It has been shown that
this problem would be remedied if the mass of the He layer is much smaller than the classical
DDet Model so as not to provide a large opacity29,30,47, partly based on an idea that such a small
amount of He (< 0.01 M) would lead to the detonation when a substantial fraction of carbon is
mixed in the He layer48. We have also confirmed from our model sequence that the light curves
of sub-Chandrasekhar DDet models are indeed roughly consistent with normal (but relatively
faint and fast-evolving) SNe Ia, once the He layer would be removed. However, this scenario
would not explain MUSSES1604D, as we do see prominent early flash and signatures of the He
ash in the maximum spectra.
To remedy the abnormal fast-evolution issue in the classical DDet scenario, we investigated
additional models in which we allow that the relation between the WD mass and the final 56Ni
production expected in DDet is not necessarily fulfilled. By coordinating combinations of the
WD mass, M(56Ni), and the He mass, the most straightforward choice we found is shown in
Figures 2–4, where the models with 1.38 M WD, 0.01–0.03 M He-ash layer, and 0.43 M of
56Ni are presented. Additionally we investigated the model with 1.28 M WD, 0.013 M He-
ash layer, and 0.44 M of 56Ni. While such a relatively less massive WD model can also give a
slow-evolving light curve, the pre-maximum B−V color turns out to be too red. Therefore, we
26

constrain the acceptable WD mass range between 1.28 and 1.38 M. In addition, an even better
consistency of the light curves and color evolution from ∼ 5 days after the B-band maximum
could be expected for our preferred model (1.38M WD + 0.03 M He-shell) once the NLTE
effects were taken into account46.
From these analyses, we suggest two scenarios that involve He detonation. First is the He-
ignited violent merger scenario14. In this case, the primary WD mass should still be ∼ 1 M
to produce the peak luminosity. The accretion stream of He during the merging process may
trigger a detonation even if the He mass is small14,27. If the secondary is swept up by the ejecta,
this would explain the slow-evolving light curve. However, there are two drawbacks to this
scenario. (1) Whether the core detonation can be triggered by the thin-He-shell detonation26,27,
and (2) it will involve fine-tuning of the merging configuration (e.g., masses of the WDs) to
reproduce the observational features of MUSSES1604D.
The other scenario is the He detonation on the surface of a nearly Chandrasekhar-mass WD,
as is motivated by our light curve and spectral models which reproduce the observational re-
sults quite well by simply assuming the standard Chandrasekhar-mass WD without fine-tuning.
The amount of He mass is also consistent in this picture to trigger the detonation there. The
evolutionary track of this binary system toward the He detonation on the surface of a WD
more massive than 1.3 M has been never discussed in the literature. Further investigations
are needed to explore whether this scenario can be realized or not. Another drawback is that in
the classical DDet scenario it will produce too much 56Ni by the core detonation, resulting in
an over-luminous SN Ia. Still, the fact that this simple model explains all the main features of
27

MUSSES1604D is striking, indicating that it is unlikely to be a mere coincidence. This would
suggest that there could be a mechanism to reduce the mass of 56Ni as compared to the classical
DDet picture.
A more realistic light curve and spectra might be different if one takes into account the pos-
sible viewing-angle effect related to both the violent merger scenario and the He-ignited near-
Chandrasekhar-WD scenario. Our one-dimensional models only address an angle-averaged
behavior. The Ti/Fe absorptions will be stronger than our one-dimensional prediction if the
line of sight intersects a region of the He ash. The initial light curve enhancement would also
be dependent on the viewing angle, but this effect would be much less prominent than in the
absorption.
Another issue is that the Si and S features are not very well reproduced. In general, while
these features are qualitatively well explained, obtaining quantitatively good fits is an issue even
with sophisticated NLTE modeling49. We find that these features are also sensitive to detailed
composition structure even in one-dimensional simulations. Providing detailed fitting for these
features is beyond the scope of this paper, as these are theoretically more uncertain than the
features we have analyzed in this paper.
IV. The explosion epoch of MUSSES1604D
Extrapolating the explosion epoch based on the 56Ni-powered light curve is controversial
because a considerable “dark phase” between the explosion and the radioactive decay from SN
28

ejecta may exist for some SNe Ia50−53. For example, the best-observed SN Ia so far, SN 2011fe
likely has a one-day “dark phase” though the SN was discovered at the brightness of ∼ 1/1000
of its peak brightness52,54. More stringent restriction on the explosion epoch not only requires
deep-imaging observations but also specific radiation mechanisms at early time to light up the
“dark phase”55. Thanks to the deep imaging capability of Subaru/HSC and the early flash of
MUSSES1604D, the explosion time of MUSSES1604D can be pinpointed.
For the He-detonation-triggered scenario, the early optical flash is produced immediately
from the radioactive decay at the surface of the SN ejecta, which is the earliest optical emission
except for the almost non-detectable cooling emission from the shock-heated WD soon after
the SN shock breakout50,56. Thus, MUSSES1604D was discovered at an earlier phase than any
previously discovered SNe Ia. On the basis of an effectively negligible “dark phase” before the
early flash and on-surface radioactive isotopes distribution generated from the He detonation,
we adopt the classical t2 fireball model (t is the time since the explosion) for the rising phase
of the early flash, assuming that neither the photospheric temperature nor the velocity changes
significantly in estimating the explosion epoch of MUSSES1604D. The result indicates that the
first observation of MUSSES1604D is at ∼ 0.51+0.08−0.06 days after the SN explosion. According
to the best-fitting light curves derived from the post-flash multi-band photometry (Figure 1), the
g-band magnitude reaches the same level of our first observation (25.14 mag) at t ∼ 3 days,
suggesting that a non-negligible “dark phase” may commonly exist for non-flash SNe Ia.
V. The MUSSES1604D-like SNe Ia and their rarity
29

The rate of He-detonation-triggered SNe Ia can be constrained by estimating the fraction of
MUSSES1604D-like SNe Ia. By inspecting over 1,000 SNe Ia from normal to various kinds
of subtypes which have at least one good spectrum from about -6 to +12 days after the B-band
maximum through published resources and open SN databases57,58, three MUSSES1604D-like
SNe Ia (without early-phase observations) have been found. The screening criteria and de-
tailed properties of the MUSSES1604D-like SNe Ia are listed in Extended Data Table 2. In
addition to three normal-brightness SNe Ia (-19.4 . MB . -18.7) we mentioned here, some
subluminous SNe Ia also show good similarities to MUSSES1604D (e.g. 02es-like SNe Ia,
PTF10ops and SN 2010lp, which also have slow-evolving light curve and similar spectral fea-
tures to MUSSES1640D59,60). However, due to insufficient information for conclusive classifi-
cation, the discussion here focuses on the “top three” MUSSES1604D-like SNe Ia, SN 2006bt,
SN 2007cq, and SN 2012df61−64.
Normal-brightness SN Ia, SN 2006bt shows good similarity with MUSSES1604D in both
light curve and spectral features except for the Si II λ5972 absorption. Because there is no
Na I D feature in spectra of SN 2006bt and the SN is far away from the center of an S0/a
host galaxy, the absolute magnitude is shown in Extended Data Table 2 without taking into
account the host extinction. Well-organized follow-up observations for SN 2006bt indicate
early Ti II absorptions, slow-evolving B-band light curve and similar B−V color evolution to
MUSSES1604D.
SN 2007cq is classified as another MUSSES1604D-like SN Ia. In particular, the pre-
maximum spectroscopy of SN 2007cq shows that prominent Ti II absorptions have been de-
30
tected from about 6 days before the B-band maximum, which is consistent with the prediction
of the He-detonation models12,23. Note that SN 2007cq shows shallower intermediate element
absorption features and bluer color than MUSSES1604D, which can be attributed to the larger
amount of 56Ni generated from the core explosion for SN 2007cq.
SN 2012df was located at the edge of an S0-like galaxy. The spectrum was taken near
the SN brightness peak with an unfiltered absolute magnitude of ∼ -18.9 (without extinction
correction). Despite the limited observational information for SN 2012df, high spectral simi-
larity between two SNe Ia has been found at a similar epoch (Figure 4). Therefore we classify
SN 2012df as a MUSSES1604D-like SN Ia. Comparisons of the spectral evolution and light
curves for MUSSES1604D-like SNe Ia are presented in Extended Data Figure 2 and 3 respec-
tively.
For a conservative estimation of the event rate of MUSSES1604D-like SNe Ia, we screen
out all subluminous SNe Ia though some of them may have the same origin59,60. Statistically
there are 4 MUSSES1604D-like SNe Ia out of ∼ 800 SNe Ia with B-band absolute magnitude
. -18.7, corresponding to a fraction of MUSSES1604D-like SNe Ia of ∼ 0.5%.
The traditional SN Ia classification mainly based on the SN brightness and spectral features
will classify MUSSES1604D and iPTF14atg into two peculiar subtypes although both two have
strong early light curve enhancements, slow-evolving light curves, prominent Ti II absorptions,
similar color evolution and host environments7,55, implying possible intrinsic connection of
two SNe65. However, whether iPTF14atg is also triggered by the He-shell detonation is still an
31

open question because the Ti II absorptions and red color of subluminous SNe Ia in post-flash
phase can be attributed to the low temperature of ejecta and the lack of early color information
prevents us from further comparisons with MUSSES1604D at the flash phase. It is worth noting
that the earliest B−V color of iPTF14atg at ∼ 5 days after the explosion probably is too red
to be explained by both CEI and CSM-ejecta interaction but is in line with the predictions by
He-detonation models (Figure 2). As a reference for the future work, in Extended Data Table
2, we list MUSSES1604D-like and iPTF14atg-like candidates selected from different SN Ia
branches59,60,66−68. Similarities among these objects may suggest intrinsic connection between
a number of SNe Ia in different subtypes.
Data availability. The photometric source data is available in the online version of the paper.
Both photometric and spectroscopic data will also be made publicly available on WISeREP3
(http://wiserep.weizmann.ac.il/).
Code availability. The post-flash light curve fitting and K-correction are carried out with the
SALT2 model and SNCosmo, which are available at http://supernovae.in2p3.fr/salt/doku.php &
https://sncosmo.readthedocs.io/en/v1.5.x/ respectively. We have opted not to make the code for
the companion-ejecta interaction (CEI) models and the radiation transfer code used to simulate
the He-detonation models available because they are not prepared for the open-use. Instead,
all the simulated light curves and spectra of the He detonation models shown in this paper are
available upon request.
31. Miyazaki, S., et al. Wide-field imaging with Hyper Suprime-Cam: Cosmology and GalaxyEvolution, A Strategic Survey Proposal for the Subaru Telescope. 1–30 (2014).
32

32. Bolton, A. S., et al. Spectral Classification and Redshift Measurement for the SDSS-IIIBaryon Oscillation Spectroscopic Survey. Astron. J. 144, 144 (2012).
33. Shimasaku, K., et al. Statistical Properties of Bright Galaxies in the Sloan Digital SkySurvey Photometric System. Astron. J. 122, 1238–1250 (2001).
34. Peng, C. Y., Ho, L. C., Impey, C. D. & Rix, H. -W. Detailed Decomposition of GalaxyImages. II. Beyond Axisymmetric Models. Astron. J. 139, 2097–2129 (2010).
35. The GALFIT software can be downloaded athttps://users.obs.carnegiescience.edu/peng/work/galfit/galfit.html.
36. Stetson, P. B. DAOPHOT: A Computer Program for Crowded-Field Stellar Photometry.Publ. Astron. Soc. Pac. 99, 191–222 (1987).
37. Doi, M., et al. Photometric Response Functions of the Sloan Digital Sky Survey Imager.Astron. J. 139, 1628–1648 (2010).
38. SNCosmo is available at https://sncosmo.readthedocs.io/en/v1.5.x/.
39. Schlegel, D. J., Finkbeiner, D. P. & Davis, M. Maps of Dust Infrared Emission for Use inEstimation of Reddening and Cosmic Microwave Background Radiation Foregrounds. Astro-phys. J. 500, 525–553 (1998).
40. Maeda, K., Kutsuna, M. & Shigeyama, T. Signatures of a Companion Star in Type Ia Su-pernovae. Astrophys. J. 794, 37 (2014).
41. Fryer, C. L., et al. Spectra of Type Ia Supernovae from Double Degenerate Mergers. Astro-phys. J. Lett. 725, 296–308 (2010).
42. Shen, K. J., Bildsten, L., Kasen, D. & Quataert, E. The Long-term Evolution of DoubleWhite Dwarf Mergers. Astrophys. J. 748, 35 (2012).
43. Levanon, N. & Soker, N. Early UV emission from disk-originated matter (DOM) in type Iasupernovae in the double degenerate scenario. Mon. Not. Astron. Roy. Soc. 470, 2510–2516(2017).
44. Arnett, D. Supernovae and Nucleosynthesis: An Investigation of the History of Matter from
33

the Big Bang to the Present. Princeton University Press (1996).
45. Kasen, D., Thomas, R. C. & Nugent, P. Time-dependent Monte Carlo Radiative TransferCalculations for Three-dimensional Supernova Spectra, Light Curves, and Polarization. Astro-phys. J. 651, 366–380 (2006).
46. Kromer, M. & Sim, S. A. Time-dependent three-dimensional spectrum synthesis for TypeIa supernovae. Mon. Not. Astron. Roy. Soc. 398, 1809–1826 (2009).
47. Sim, S. A.,et al. Detonations in Sub-Chandrasekhar-mass C+O White Dwarfs. Astrophys.J. 714, L52–L57 (2010).
48. Shen, K. J., & Moore, K. The Initiation and Propagation of Helium Detonations in WhiteDwarf Envelopes. Astrophys. J. 797, 46 (2014).
49. Nugent, P., Phillips, M., Baron, E., Branch, D. & Hauschildt, P. Evidence for a Spectro-scopic Sequence among Type 1a Supernovae. Astrophys. J. Lett. 455, L147–L150 (1995).
50. Piro, A. L., & Nakar, E. What can we Learn from the Rising Light Curves of RadioactivelyPowered Supernovae? Astrophys. J. 769, 67 (2013).
51. Piro, A. L., & Nakar, E. Constraints on Shallow 56Ni from the Early Light Curves of TypeIa Supernovae. Astrophys. J. 784, 85 (2014).
52. Mazzali, P. A., et al. Hubble Space Telescope spectra of the Type Ia supernova SN 2011fe:a tail of low-density, high-velocity material with Z < Z. Mon. Not. Astron. Roy. Soc. 439,1959–1979 (2014).
53. Zheng, W., et al. Estimating the First-light Time of the Type Ia Supernova 2014J in M82.Astrophys. J. Lett. 783, L24 (2014).
54. Nugent, P. E., et al. Supernova SN 2011fe from an exploding carbon-oxygen white dwarfstar. Nature. 480, 344–347 (2011).
55. Cao, Y., et al. SN2002es-like Supernovae from Different Viewing Angles. Astrophys. J.832, 86 (2016).
56. Piro, A. L., Chang, P. & Weinberg, N. N. Shock Breakout from Type Ia Supernova. Astro-phys. J. 708, 598–604 (2010).
34

57. Yaron, O. & Gal-Yam, A. WISeREP–An Interactive Supernova Data Repository. Publ.Astron. Soc. Pac. 124, 668–681 (2012).
58. Guillochon, J., Parrent, J., Kelley, L. Z. & Margutti, R. An Open Catalog for SupernovaData. Astrophys. J. 835, 64 (2017).
59. Maguire, K., et al. PTF10ops – a subluminous, normal-width light curve Type Ia supernovain the middle of nowhere. Mon. Not. Astron. Roy. Soc. 418, 747–758 (2011).
60. Kromer, M., et al. SN 2010lp–a Type Ia Supernova from a Violent Merger of Two Carbon-Oxygen White Dwarfs. Astrophys. J. Lett. 778, L18 (2013).
61. Foley, R. J., et al. SN 2006bt: A Perplexing, Troublesome, and Possibly Misleading TypeIa Supernova. Astrophys. J. 708, 1748–1759 (2010).
62. Ganeshalingam, M. et al. Results of the Lick Observatory Supernova Search Follow-upPhotometry Program: BVRI Light Curves of 165 Type Ia Supernovae. Astrophys. J. Suppl.190, 418–448 (2010).
63. Scalzo, R., et al. Type Ia supernova bolometric light curves and ejected mass estimatesfrom the Nearby Supernova Factory. Mon. Not. Astron. Roy. Soc. 440, 1498–1518 (2014).
64. Ciabattari, F., et al. Supernova 2012df = Psn J17481875+5218023. Central Bureau Elec-tronic Telegrams. No. 3161 (2012).
65. Kromer, M., et al. The peculiar Type Ia supernova iPTF14atg: Chandrasekhar-mass explo-sion or violent merger? Mon. Not. Astron. Roy. Soc. 459, 4428–4439 (2016).
66. Ganeshalingam, M., et al. The Low-velocity, Rapidly Fading Type Ia Supernova 2002es.Astrophys. J. 751, 142 (2012).
67. Li, W., et al. SN 2002cx: The Most Peculiar Known Type Ia Supernova. Publ. Astron. Soc.Pac. 115, 453–473 (2003).
68. Foley, R. J., et al. Type Iax Supernovae: A New Class of Stellar Explosion. Astrophys. J.767, 57 (2013).
35

-18
-17
-16
-15
-14
-20 -19 -18 -17 -16
aB
-ba
nd
ab
so
lute
ma
gn
itu
de
-18
-17
-16
-15
-14
-20 -19 -18 -17 -16
b
V-b
an
d a
bso
lute
ma
gn
itu
de
CEI(2MO. MS) K10CEI(6MO. MS) K10CEI(1MO. RG) K10
CEI(1.05MO. RG) K-S1.38MO. +0.03MO. WD-He
-0.6
-0.3
0
0.3
0.6
-20 -19 -18 -17 -16
c
B−V
-17
-16
-15
-14
-13
-12-20 -19 -18 -17 -16
d
V-b
an
d a
bso
lute
ma
gn
itu
de
Days since B-band max
-17
-16
-15
-14
-13
-12-20 -19 -18 -17 -16
e
V-b
an
d a
bso
lute
ma
gn
itu
de
Days since B-band max
-0.6
-0.3
0
0.3
0.6
-20 -19 -18 -17 -16
f
B−V
Days since B-band max
CEI(1.05MO. RG) K-S
CSM(Re=1010
cm) P16
CSM(Re=1011
cm) P16
CSM(Re=1012
cm) P161.38MO. +0.03MO. WD-He
Extended Data Figure 1: Comparison between MUSSES1604D and different models at
early phase. Symbols for MUSSES1604D data are the same as those in Figure 1–3 and the
results from our best-fitting He-detonation model (1.38 M WD + 0.03 M He-shell, red solid
lines) are provided in each panel. Panels present the simulated early B-band (a), V -band (b)
light curves and B−V color evolution (c) of the companion-ejecta interaction (CEI) observed
from the companion side. Dashed lines correspond to the K10 models with different composi-
tions of the binary system8. Magenta dash-dot line is our best-fitting K-S CEI model19. Though
an early flash as bright as that of MUSSES1604D could be produced with specific CEI models,
the predicted color is very blue at the CEI-flash phase. Panels d and e are V -band light curves
simulated by the CSM-ejecta interaction with deep and shallow 56Ni distribution for the inner
ejecta respectively (Piro & Morozova, P1610). Dotted lines correspond to external mass of Me
= 0.3 M with different outer radius Re. Panel f is the color evolution under the same assump-
tions as (e). Similar to the CEI models, combinations of early light curves and color evolution
predicted by the CSM-ejecta interaction show apparent discrepancies with MUSSES1604D.
36

4000 5000 6000 7000 8000
4000 5000 6000 7000 8000 9000
SN 2007cq at −4.4 day
MUSSES1604D at −2 day (SALT)
SN 2006bt at −2 day
SN 2012df near max
SN 2006bt at +1.9 day
MUSSES1604D at +2.6 day (Gemini−N)
SN 2006bt at +6.9 day
SN 2007cq at +7.2 day
SN 2011fe at +11.7 day
MUSSES1604D at +12 day (SALT)
SN 2007cq at +15 day
SN 2006bt at +17.9 daySN 2011fe at +23.7 day
MUSSES1604D at +26 day (Gemini−N)
Si IIS IIFe II/III
Ti IICa II
Sca
led
F λ
+ c
onst
ant
Rest−frame wavelength (Å)
Observer−frame wavelength (Å)
Extended Data Figure 2: The spectral evolution of MUSSES1604D and analogs. The
spectra of MUSSES1604D (dark green) are compared with analogous SNe Ia, SN 2006bt,
SN 2007cq and SN 2012df at similar epochs. Late-phase spectra of SN 2011fe are included
for reference. The SALT/RSS follow-up observations were carried out -2 and 12 days after the
B-band maximum and the other two spectra were taken by Gemini-N/GMOS 3 and 26 days
after the B-band maximum respectively.
37

-20
-18
-16
-14
-20 -10 0 10 20
V
B+2.5
B+2.5V
MUSSES1604D
SN2006bt
SN2007cq
iPTF14atg
SN2011fe- - - - - - -
Ab
so
lute
ma
gn
itu
de
Days since B-band max
Extended Data Figure 3: The rest-frame B- and V -band light curves of MUSSES1604D
and other SNe Ia. K-corrections in flash (open squares) and post-flash phase (solid squares
with dashed lines) of MUSSES1604D are carried out with different methods. An excellent light
curve match is shown for MUSSES1604D, SN 2006bt and SN 2007cq. Another peculiar early-
flash SN Ia iPTF14atg also shows similar light curves though the brightness is ∼ 1 magnitude
fainter than MUSSES1604D. Light curves of normal SN Ia, SN 2011fe (black dotted lines) are
provided for reference. Magnitudes shown here are in the Vega system and the error bars denote
1-σ uncertainties.
38
a b5" 5"
MUSSES1604D (April 5th, 2016)
MUSSES1604D (April 4th, 2016)
Extended Data Figure 4: Early Subaru/HSC g-band images for MUSSES1604D. Panel
a shows the earliest Subaru/HSC image of MUSSES1604D (α(J2000) = 12h18m19s.85,
δ (J2000) = +0015’17.38”) taken on UT 2016 April 4.345, when the g-band magnitude of
MUSSES1604D was 25.14 ± 0.15. Then, the SN rapidly brightens to ∼ 23.1 mag in one day
(panel b).
39

Extended Data Table 1: Imaging observations of MUSSES1604DUT Date Phasea Telescope/Instrument g r i Bb V b
Apr 04.34 -19.62 Subaru/HSC 25.14 (15) – – – –
Apr 04.39 -19.58 Subaru/HSC 24.96 (16) – – – –
Apr 05.25 -18.82 Subaru/HSC 23.09 (07) – – – –
Apr 05.29 -18.78 Subaru/HSC 23.15 (06) – – – –
Apr 05.33 -18.74 Subaru/HSC 23.09 (05) – – – –
Apr 05.34 – 05.43 -18.74 – -18.65 Subaru/HSC 23.08 (05) 22.99 (05) – 22.71 (10) 22.57 (03)
Apr 05.49 -18.59 Subaru/HSC – 22.96 (06) – – –
Apr 05.55 -18.54 Subaru/HSC – 22.91 (05) – – –
Apr 06.46 – 06.56 -17.73 – -17.64 Subaru/HSC 23.05 (05) 22.64 (05) – 22.91 (10) 22.48 (03)
Apr 08.51 -15.89 Subaru/HSC – 22.14 (04) – – 22.50
Apr 17.41 -7.93 ARC/ARCTIC 20.35 (03) 20.06 (03) – 20.33 20.06
Apr 26.59 0.29 Kiso/KWFC – 19.60 (06) – 19.93 19.61
Apr 28.93 2.38 INT/WFC 19.95 (02) 19.64 (01) 19.84 (01) 19.98 19.61
May 05.07 7.87 NOT/ALFOSC 20.32 (03) 19.81 (02) 20.04 (02) 20.24 19.76
May 05.93 8.64 LT/IO:O 20.39 (02) 19.73 (01) 20.01 (02) 20.29 19.79
May 11.93 14.01 LT/IO:O 20.89 (03) 20.04 (03) 20.30 (04) 20.77 20.11
May 14.14 15.99 ARC/ARCTIC 21.04 (04) 20.15 (02) 20.29 (02) 20.97 20.22
May 19.89 – 19.92 21.14 – 21.16 NOT/ALFOSC 21.63 (06) 20.42 (02) 20.32 (04) 21.49 20.43
May 25.32 26.00 Gemini-N/GMOS 22.01 (02) 20.67 (02) – 21.93 20.62
May 28.91 29.21 LT/IO:O 22.41 (08) 20.80 (03) 20.55 (03) 22.17 20.78
Jun 06.98 37.33 NOT/ALFOSC 22.69 (04) 21.21 (04) 20.98 (05) 22.68 21.26
Notes. The magnitudes in g, r and i bands (observer-frame, AB system) have been transferred to the standard SDSS photometric system byadopting the color term correction based on field stars, and rest-frame B- and V -band magnitudes are in the Vega system. Numbers in parenthesiscorrespond to 1-σ statistical uncertainties in units of 1/100 mag.
a Days (rest-frame) relative to the estimated date of the B-band maximum, 2016 April 26.27.b K-correction for the flash-phase (April 4–8) observations is carried out by using the power-law spectral energy distribution models derived
from the color of early flash. For post-flash observations, K-correction is performed according to the best-fitting spectral sequence model ofMUSSES1604D. The Galactic extinction (E(B−V )MW = 0.0263 mag) has been corrected.
40

1.38M + 0.03MHe
Mas
s fr
actio
ns
1.38M + 0.03MHe
Mas
s fr
actio
ns
1.03M + 0.054MHe M
ass
frac
tions
1.03M + 0.054MHe
Mas
s fr
actio
nsa b
c d
Extended Data Figure 5: The composition structures of the models used for radiation
transfer simulations. The composition structures shown here are He-detonation models for
the sub-Chandrasekhar-mass WD (1.03 M WD + 0.054 M He-shell; panels a & c) and the
Chandrasekhar-mass WD (1.38 M WD + 0.03 M He-shell; panels b & d). The mass frac-
tions of selected elements are shown as a function of the velocity (panels a & b) and the mass
coordinate (panels c & d). Colors used for selected elements are same for all panels.
41

1.38M + 0.03MHe
1.03M + 0.054MHe
Extended Data Figure 6: The density structures of the models used for radiation transfer
simulations. The density structures (as a function of the velocity) shown here are He-detonation
models for the sub-Chandrasekhar-mass WD (1.03 M WD + 0.054 M He-shell; black dashed
line) and the Chandrasekhar-mass WD (1.38 M WD + 0.03 M He-shell; red solid line).
42

Extended Data Table 2: Properties of MUSSES1604D- and iPTF14atg-like SNe IaSN BMax
a ∆m15(B) B−V TiII SiII V SiII λ6355c TiII
Name (mag) (mag) Levelb Absorptionsc,d λ5972c,e (km s−1) Evolutionf
MUSSES1604D-Like SN Ia CandidatesMUSSES1604D -18.8+ 1.0+ Red+ Very Deep+ Shallow+ 11,800+ Slow+
SN 2012df+ -18.9g+ — Marginal-red+ Deep+ Shallow+ 12,000+ —
SN 2007cq+ -19.4+ 1.1+ Normal− Deep+ Shallow+ 11,000+ Slow+
SN 2006bt+ -18.9+ 1.1+ Marginal-red+ Deep+ Intermediate − 11,600+ Slow+
SN 2011fe− -19.2+ 1.2 | Normal− Intermediate− Intermediate − 10,300 | Normal−iPTF14atg-Like SN Ia Candidates
iPTF14atg -17.7+ 1.3+ Red+ Very Deep+ Deep+ 7,300+ Normal+SN 2002es+ -17.9+ 1.3+ Red+ Very Deep+ Deep+ 6,000+ Normal+SN 2010lp? -17.9+ 1.4+ Ultra-Red+ Very Deep+ Deep+ 10,600− —PTF10ops? -17.8+ 1.1+ Ultra-Red+ Deep+ Deep+ 10,000− Normal+SN 2011ay? -18.1+ 1.3+ Red+ Deep+ Intermediate | 5,600+ Fast−SN 2008A? -17.9+ 1.3+ Red+ Deep+ Intermediate | 6,900+ Fast−SN 2005hk? -17.7+ 1.5 | Marginal-red | Deep+ Deep + 6,100+ Fast−SN 2008ae? -17.1 | 1.4+ Ultra-Red+ Deep+ Intermediate | 7,900+ Fast−SN 2002cx? -17.5+ 1.2+ Normal− Deep+ Intermediate | 5,500+ Normal+
Notes. For each property, we use “+”, “ | ” and “-” footnotes as “support”, “neutral” and “opposite” respectively to show the similarity betweencandidates and MUSSES1604D/iPTF14atg. For all three MUSSES1604D-like SNe Ia, the host extinction are neglected because the relatively farlocation of SNe to the center of their S0/a host galaxies and the non-detection of Na I D lines in their spectra. Galactic extinction has been appliedwith E(B−V )MW of 0.1096 and 0.050 mag for SN 2007cq and SN 2006bt respectively.
a The absolute magnitude for iPTF14atg, 02es-like (SN 2002es, SN 2010lp, PTF10ops) and all normal-brightness SNe Ia are calculated byusing cosmological parameters H0 = 70.0 km s−1 Mpc−1, Ωm = 0.30, ΩΛ = 0.70 and Ων = 0.00. In the case of 02cx-like SNe Ia, we adopt thevalue from the related paper68.
b The B−V color information near the B-band maximum. Here, we define B−V ≥ 0.4 mag, 0.4 mag > B−V ≥ 0.2 mag, 0.2 mag > B−V ≥0.1 mag, 0.1 mag > B−V ≥ -0.1 mag and -0.1 mag > B−V as “ultra-red”, “red”, “marginal-red”, “normal” and “blue” respectively.
c Spectral features at around the B-band maximum. For normal-brightness and subluminous SNe Ia, spectra taken on the closest epoch to t =-2 and t = 0 (relative to the B-band maximum) are used for the similarity comparisons respectively.
d The relative strength of Ti II absorptions near the B-band maximum. The strength is relative to normal-type SNe Ia, e.g. SN 2011fe.e We define the equivalent width of Si II λ5972, EW (SiIIλ5972) < 10 A, 10 A ≤ EW (SiIIλ5972) < 30 A, 30 A ≤ EW (SiIIλ5972) as “Shallow”,
“Intermediate” and “Deep” respectively.f The relative evolution speed of Ti II absorptions in first 10 ± 2 days after the B-band maximum. The evolution speed is relative to SN 2011fe
and iPTF14atg for normal-brightness and subluminous SNe Ia respectively.g Unfiltered photometry without considering the Galactic extinction E(B−V )MW = 0.0393 mag.
43

Supplementary Information
Acknowledgements The authors thank S. C. Leung and M. Kokubo for helpful discussions.
We also thank the staff at the Southern African Large Telescope, the Nordic Optical Telescope,
and the Gemini-North telescope for observations and people who carried out follow-up obser-
vations which were unfruitful due to weather issue. Simulations for the He detonation models
were carried out on a Cray XC30 at the Center for Computational Astrophysics, National As-
tronomical Observatory of Japan. The work is partly supported by the World Premier Interna-
tional Research Center Initiative (WPI Initiative), MEXT, Japan, Grants-in-Aid for Scientific
Research of JSPS (16H01087 and 26287029 for M.D. and J.J.; 26800100 and 17H02864 for
K.M.; 6H06341, 16K05287, and 15H02082 for T.S.; 26400222, 16H02168, and 17K05382
for K.N.) and the research grant program of the Toyota foundation (D11-R-0830). S.W.J. ac-
knowledges support from the US National Science Foundation through award AST-1615455.
M.D.S acknowledges generous support provided by the Danish Agency for Science and Tech-
nology and Innovation realized through a Sapere Aude Level 2 grant, the Instrument-center
for Danish Astrophysics (IDA), and by a research grant (13261) from VILLUM FONDEN.
The Hyper Suprime-Cam (HSC) collaboration includes the astronomical communities of Japan
and Taiwan, and Princeton University. IRAF is distributed by the National Optical Astronomy
Observatory, which is operated by the Association of Universities for Research in Astronomy
(AURA) under a cooperative agreement with the National Science Foundation. The HSC in-
strumentation and software were developed by the National Astronomical Observatory of Japan
(NAOJ), the Kavli Institute for the Physics and Mathematics of the Universe (Kavli IPMU), the
University of Tokyo, the High Energy Accelerator Research Organization (KEK), the Academia
44

Sinica Institute for Astronomy and Astrophysics in Taiwan (ASIAA), and Princeton University.
Funding was contributed by the FIRST program from Japanese Cabinet Office, the Ministry of
Education, Culture, Sports, Science and Technology (MEXT), the Japan Society for the Pro-
motion of Science (JSPS), Japan Science and Technology Agency (JST), the Toray Science
Foundation, NAOJ, Kavli IPMU, KEK, ASIAA, and Princeton University. The Pan-STARRS1
Surveys (PS1) have been made possible through contributions of the Institute for Astronomy,
the University of Hawaii, the Pan-STARRS Project Office, the Max-Planck Society and its par-
ticipating institutes, the Max Planck Institute for Astronomy, Heidelberg and the Max Planck
Institute for Extraterrestrial Physics, Garching, The Johns Hopkins University, Durham Univer-
sity, the University of Edinburgh, Queen’s University Belfast, the Harvard-Smithsonian Center
for Astrophysics, the Las Cumbres Observatory Global Telescope Network Incorporated, the
National Central University of Taiwan, the Space Telescope Science Institute, the National
Aeronautics and Space Administration under Grant No. NNX08AR22G issued through the
Planetary Science Division of the NASA Science Mission Directorate, the National Science
Foundation under Grant No. AST-1238877, the University of Maryland, and Eotvos Lorand
University (ELTE). This paper makes use of software developed for the Large Synoptic Sur-
vey Telescope. We thank the LSST Project for making their code available as free software at
http://dm.lsst.org.
45