a 'ij,. c?? t error, miscommunications have the potential of narrowing the margin ... etc.) and...
TRANSCRIPT
A t 'ij,. C??
'AU 2

NOTICE
"This document is disseminated under the sponsorship of theDepartment of Transportation in the interest of informationexchange. The United States Government assumes no liability forits contents or use thereof.
A
REPORT DOCUMENATION PM
AnAayi fTovr (i Got al) Cnoller-ilot Voiceat itm hCounicationt 761 ALM/A M11
Joh AGEC UEONLp Lae btational Trans ORTato SDsTEm Cete RPRTYEPT AMISEROI
9. TITLE AND SUBTITLEIN AGNYMN()ADAOEIE)1. SPOSOING MUNNITRS
RsArc A andsi Developwent Servl)Cenrle-iooc
Washuingtion, DC 2059111
61. SUPPLEMETYNOS
7~. PERFORMINGORGNIZVATIONL AMILI TATNT 12RS )B. DEFRIST RIBU IZTION D
TechnicA.Vlp INfrationa Seranice, tio Sprisfeld, VA te 22161NUBE
Theprosesrc ofd thivanlysismereto eAdmineicurretpltcnrle omation pratics n teterminal-4Trnsproretaoty-ioneSyhours fvoCentaesrrmlclpstosi e i rfi oto oesCT~)wrexambindg Tere wer 6,14442nrle-op o esgs(~.laacst aef rlnisrcin ohl
Thedceralexviatifthontrollrsnmssragetion. theNC REPORT ofpee fifomto)wsexnd teNiBER oReearroeucha k and pev lopet reuStforeasweric anlzda sicino asg omlxty. Pilot 4/
error ndocumenth or nottheconroler epne to the pulctroughc terrr Naiontanlsi ihtecnrle otce
Teheneprtconlue Inoraith rermedvicns torinfutereied the pr2bliyo1c61caineros
14. ASUBJECT TEMSxmu 170 words)n
Tepiloe f hsaeyaswr ot Controlle Communic-cnrote omufenpations i theEEterI*nal
17 o. SC ITher C wSSFIATO 1,4 . SotrtECRITY- o CLAssICaTION 19. SlECRITY CLaSSIffICToN 20n. iMItAutions to AhSlAC
short ~ ~ ~ ~ ~ ~ ~ ~ ~ tnr orr chang rai(Revnis t. eaie n hssuyThecomleityof heconrolers mssge i~., he rof iecs f Ifometon)wa exmied and ANSI Stid: of

PREFACE
This research was sponsored by the Federal Aviationkdr 'stration's Research and Development Service, HumanPer nance Program (ARD-210). We thank Lawrence Cole, WilliamWhi- and John Zalenchak of that office for their support andhelpful suggestions. The voice tapes were analyzed, and raw datagathered, by Ben Cameron, John Chevalier, and Joseph Jarboe ofScience Applications International Corporation (SAIC). DavidNallek of SAIC performed much of the data analysis and providedother technical support. We thank then and their supervisor,Bryan Brett, for their many hours of tedious analysis. Dr.Jordan Nulter assisted in designing the test plan, providedcritical comments in the initial stages of this work, andprovided a great deal of administrative support to the project.Dr. Judith Bvp:' Cohen provided helpful comments on an earlierdraft of thi' 'pt, t. Finally, we thank the quality assurancespecialists aL tho darticipating ATC facilities who supplied thetapes for this arl, ysis.
Accesion For
NTIS CRA&IDTIC TABUnannounced El
J ........t. o ............. ... ... . . .
Disti ibution /
Availability Codes
Avail and/ orDist Special
iii
.hulc,3mEl. omwmml FM!..1
"KIm TO 1MiIC M.IuC TO UU.EU
Lam CAPPROXIMTIE) LamTn C( lMP Ti1)
1 Inc (In) w 2.5 contioters (cm) 1 mIllImeter Cm) a 0.01 ncIh (In)
I feet t) a 30 centimeters (cm) 1 centimeter Cm) a 0.4 inch (In)
1 Vard (yd) a 0.9 moter (m) 1 moter Ca) a 3.3 feet (ft)
I mite Cal) a 1.6 kilometers (00) 1 water (C) w 1.1 verd (Otr)I kltomter (Cm) 0 0.6 mile Cai)
AMA (PP•UNINATE) MA CAPUINATt)
I wire inch (Cq In, 2 6.5 s•oote centimeters Cc.) 1 sqare centimeter (co) - 0.16 eq"wo inch (eq In, inz)
I 8*mr feet Csq ft. ftz. o0.09s•mar er €m) 1 am ater (6) - 1.Z2em ,re yaw (eq yd. W)
1 square yard (eq yd. y*2 ) -0.8 qupote mter (.2) 1 esqure kiLtmter (mI2 ) a 0.4 s"mpre oiL (sq of. al2)
1 square miLe (sq at, I12) a 2.6 More kilometers CkiR2) 1 hectare (he) a 10,000 mqure moters (02) n 2.5 acres
I ere a 0.4 hectares (be) a &,DW 5quoW* meters (m2)
WAS - IEIGNT (CAPPOINATE) NASS - WEIGNT (APPIIRINATE)
I ounce (t) a 28 gri (gr) I grain (or) a 0.036 ounce (oz)
1 pound Ctb) a .45 kilogrm (kg) I kiLtog (ks) a 2.2 pounds (Wb)
Sshort ton a 2,000 pomuds tb) a 0.9 tone (t) 1 tom (t) a 1,000 kilogram (kg) a 1.1 short tons
VOLUM (*PN INATIZ) VOLUME (PPNINATE)
1 teespo e (top) a 5 ittltliters col) 1 mittititers Cal) a 0.03 fluid ounce (ft oz)
1 tablespoon (tbsp) w 15 milliliters (at) I tlter (1) a 2.1 pints (pt)
1 fluid ounce (fit oz) a 30 milliliters Wl) I titer (I) a 1.06 quarts (qt)
1 cup Cc) 0.24 liter (1) 1 liter (1) a 0.26 gotten (set)
1 pint (pt) a 0.47 Liter (1) 1 cubic moter (sh) . 36 cubic feet (cu ft. ft 3 )
1 cuert Cqt) a 0.96 Liter (1) 1 cubic meter (.3) - 1.3 cubic yards (cu yd. yii)
1 goLton (glt) a 3.8 Liters (1)
1 cubic foot (cu ft, ft 3 ) s 0.03 cubl meter (.3)
1 cubic yard (Cu yd, yv3) - 0.76 cubic moter (w3)
TENPERATURE (EXACT) TEMPERATUE (EXACT)
1(x-32)(S/9)f aF y *C 9(9/5) y * 32) °C a x OF
WICK IUCU-CENT 10111 LOWT CONVERSIONINC=$ 0 1 2 3 4 S 6 7 a 9 10
I I - I - - -I I I - I - 1 - I
CENTIMETERS 1 2 3 4 5 6 8 9 10 11 12 13 14 15 16 17 1l 19 20 21 22 23 24 25125.40
QUICK FANIUNEIT-CELSIUS TEMERATUIME CONVESIION
OF .-4o .220 .40 140 32 50e 61 36 100. 122e 10oo I6 176' 1T4' 2120
For more exact and or other conversion factors, see IS eettansms Publication 2M6. Units of Weights a•dMeasures. Price $2.50. So Catalog Me. C13 10286.
iv

TABLE OF CONTENTS
1.* INTRODUCTION................. .... 1
2, METHOD . . . . . . . . . . . . . . . . . . . . . . . . . 3
3. ROUTINE COMMUNICATIONS PRACTICES . . . . . . . . . .. 5
3.1 Message Complexity ...... *........ 53.2 Message Acknovledgement . . . . . . . ...... 6
3.2.1 Use of Call Signs in Readbacks . . . . . . . 73.2.2 Message Complexity and Incidence of
Readbacks . . . . . . o . . . . . . . . . . 7
3.3 Miscommunications ........ . . . ..... 9
3.3.1 Message Complexity and Readback Errors . . . 93.3.2 Readback Errors and Type of Information . . 123.3.3 Hearback Errors ..... *. . *.... 133.3.4 Message Complexity and Piiot iequests
for Repeats . . . . . . . . . . . . . . . . 133.3.5 Call Sign Discrepancies . . . . . . . o . . 143.3.6 Coincident Factors ...... . . . . ... 15
4. CONCLUSIONS . - o . . . . . . . . . . . . . . . . . . . 17
LIST OF ACRONYMS . . . . . . . . . . . . . . . . . . . . . . 19
REFERENCES ......................... 20
v
LIST OF FIGURES
3-1. Percent of Messages Read Back as a Function of MessageComplexity . . . . . . . . . . . . . . . . . . ..*. ... 8
LIST OF TABLES
3-1. Percentage of Controller Messages as a Function ofComplexity . .. .. .. .. .. .. .. .. .. .... 6
3-2. Pilot Responses to ATC Messages . . . . . . . . . . . . 6
3-3. Percentage of Readbacks and Readback Errors as a Function
of Message Complexity ........... . . . . . . 10
3-4. Distribution of Readback Errors by Type of Information . 12
3-5. Percentage of Transmissions Requiring Full orPartial Repeat Due to Pilot Request . . . . . . . . . . 14
3-6. Call Sign Discrepancies . . . . . . . . . . . . . . . . 15
vi
EXECUTIVE SUMMARY
The sheer volume of communications between pilots and air trafficcontrollers makes human error inevitable. The opportunity formiscommunications is constant and the consequences range fromannoying to potentially dangerous. At the very least,miscommunications result in increased frequency congestion andincreased controller workload, as more communications arenecessary to correct the problem. Depending on the nature ofthe error, miscommunications have the potential of narrowing themargin of safety to an unacceptable level. Information obtainedby sampling controller-pilot voice communications is useful in avariety of ways. Not only does it give insights into thefrequency of occurrence of specific practices that are known toaffect the efficiency of communications, but it also allows us toaddress specific questions that need to be answered to developand evaluate new systems and procedures.
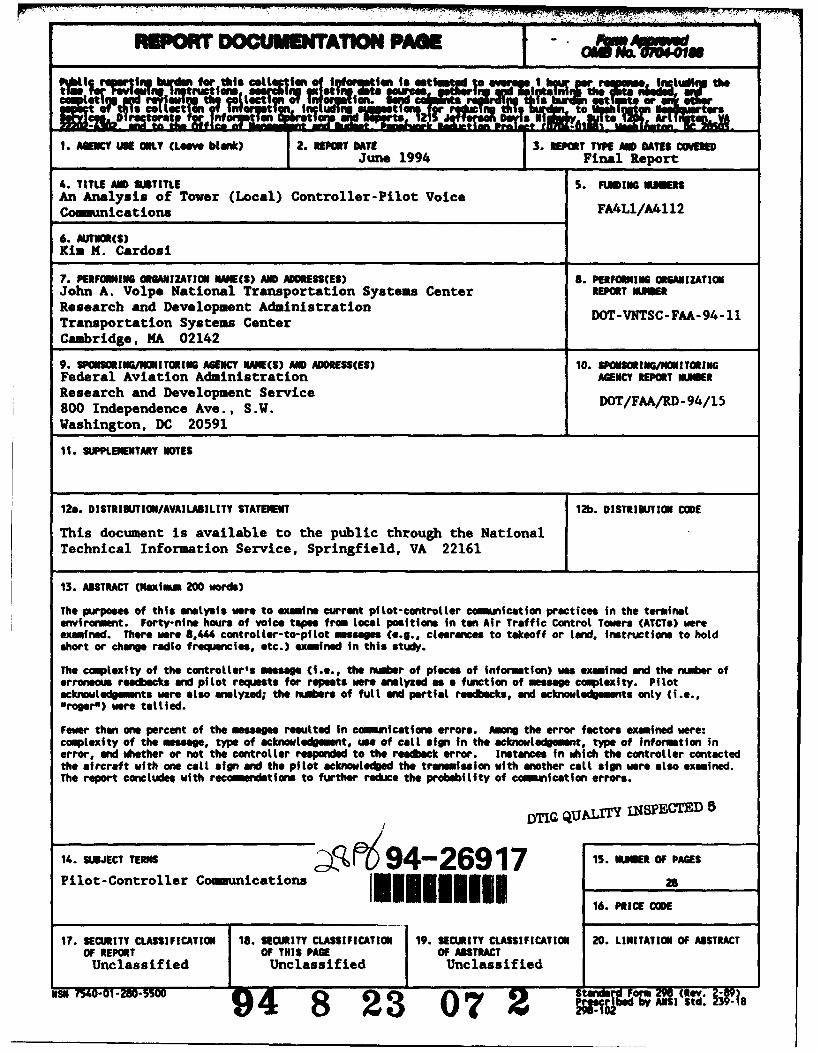
The purposes of this tape analysis were to examine current pilot-controller communication practices in the local control (tower)environment and to analyze the communication errors in detail.Forty-nine hours of voice tapes from ten Air Traffic ControlTowers (ATCTs) were examined. There were 11,234 controller-to-pilot transmissions in this sample. This included 8,444 messagesof substance (e.g., clearance to takeoff or land, instructions tohold short or change radio frequencies, etc.) and 2,790 requestsfor information, salutations, etc.
The majority of these controller messages contained one, two, orthree pieces of information and were acknowledged with a full orpartial readback. Less than one percent of the pilots' readbackscontained an error. There were only seven instances in which acontroller did not notice the error in the pilot's readback.This represents 37% of the readback errors and less than one-tenth of one percent of the total number of controller messages.
The single most common type of readback error involved confusingthe right and left runways of the same number. Such errorsaccounted for 21% of the 19 readback errors found in theanalysis. An additional 32% of the readback errors were due tovarious types of errors associated with taxi instructions.
There were also 81 instances (.9% of the messages) in which thepilots responded to controller transmissions with different callsigns than the controllers used. What was surprising about theseincidents was that less than half of these call signdiscrepancies were corrected.
There were 78 instances (less than 1% of the messages) of pilotsrequesting that a controller repeat all or part of thetransmission. The rate of miscommunications (i.e., readbackerrors and pilot requests for repeats) for messages containingone to five pieces of information was less than 1% at each level
vii
of complexity. The rate for messages containing six and sevenelements was 1.4% and 1.3%, respectively.
Several factors of interest were examined as coincident to thecommunication errors. However, the only factor that was found tobe associated with communication errors was similar call signs onthe same frequency. The absence of evidence of the significanceof other factors was probably due, at least in part, to the smallnumber of errors found and examined.
One of the most striking findings of this analysis was how fewcommunication errors were found. A readback error rate of lessthan one percent is a tribute to the pilots and controllersoperating in the National Airspace System. Still, pilots andcontrollers need to be aware that catching readback errors is adifficult task, particularly when combined with other duties thatneed to be performed simultaneously. Pilots need to beencouraged to ask for clarification, rather than expect thecontroller to catch readback errors. Pilots should also bediligent about using their full call signs to acknowledgecontroller transmissions. Controllers should listen for the callsign, as well as the content, of the pilot's readback.Controllers should also continue to warn pilots when there aresimilar call signs on the same frequency, whenever possible.Such practices and increased awareness can further reduce theprobability of communication problems and further increase themargin of safety.
viii

1. INTRODUCTION
Communication problems between pilots and controllers are oftencited as a major factor that affects system performance. Manyoperational errors, pilot deviations, accident/incident reports,and Aviation Safety Reporting System (ASRS) reports eitherdirectly involve, or reference, a breakdown in the verbaltransfer of information. While some work has been done to helpdefine the nature and causes of communication errors, much morework is needed. The sheer volume of Air Traffic Control (ATC)communications makes human error inevitable. The opportunity formiscommunications is constant and the consequences can range fromannoying to dangerous. At the very least, miscommunicationsresult in increased frequency congestion and increased controllerworkload, as more communications are necessary to correct theproblem. Depending on the nature of the error,miscommunications have the potential of narrowing the margin ofsafety to an unacceptable level.
It is well-known that pilot-controller communications are notrigidly uniform. The exact format and wording of messagesrelayed by controllers and pilots vary as a complex function ofthe airspace environment, controller and pilot workload, andindividual style. For example, while pilots are encouraged (inall but the busiest ATC environments) to readback key information(e.g., altitude) as a matter of good communication practice, itis not uncommon for pilots to acknowledge a transmission with thereply "roger" or "good day", instead of a readback of even partof the controller's message. While this practice deprives thecontroller of the opportunity to catch a readback error, it isoften necessary on congested frequencies during extremely busytraffic periods. Exactly how often this occurs had not yet beenstudied in the terminal environment, nor was it known how oftenthese practices contribute to communication errors. Similarly,it is common for a pilot to request the controller to repeat amessage ("say again"). However, the percentage of alltransmissions that need to be repeated had never been examinedfor tower communications. This additional transaction adds to acontroller's workload and to frequency congestion. Informationobtained by sampling pilot-controller voice communications isuseful in a variety of ways. Not only does it give insights intothe frequency of occurrence of specific practices that are knownto affect the efficiency of communications, but it also allows usto address specific questions that need to be answered to developand evaluate new software and procedures. For example, knowingthe percentage of clearances that need to be repeated bycontrollers would be useful in the evaluation of the efficiencyof sending ATC messages via data-link.
Previous work in ATC voice tape analysis has focussed on TRACONand on en route communications. Morrow, Lee, and Rodvold (1993),examined TRACON communications and found a readback error rate ofless than one percent with only half of these errors "repaired"
1
by controllers. Partial or missing readbacks occurred in 3-13%of acknowledgements (depending on the individual TRACON sampled)with partial readbacks being more common for longer ATC messages.A study of en route communications also found an error rate ofless than one percent (Cardosi, 1993). Most of these errorsinvolved instances in which pilots responded to controllertransmissions with different call signs than the controller hadused, or lengthy controller transmissions that resulted inerroneous pilot readbacks. There was a 1-3% miscommunicationrate (i.e., of readback errors and requests for repeats) forclearances containing one to four pieces of information and a 8%rate for transmissions containing five or more elements.Although clearances containing five or more pieces of informationconstituted only 4% of the messages examined, it accounted for26% of the readback errors found in the sample.
The purpose of this tape analysis were to examine current pilot-controller communication practices in the local control (tower)environment and to analyze the communication errors in detail.While the current analysis focussed on the tower local controlposition, future analyses will examine pilot-controllercommunications with ground control and TRACON positions. Theseanalyses document the incidence (i.e., on what percentage of thecommunications is this noted?) and consequences of the followingpractices:
- pilots acknowledging controller transmissions withcomplete readbacks;
- pilots acknowledging controller transmissions withincomplete readbacks;
- pilots responding to controller transmissions with onlyan acknowledgement (i.e., "roger");
- requests for repeat of controller transmissions;- controllers failing to detect pilot readback errors;
and- controllers relaying multiple instructions in a single
transmission.
An analysis of ASRS reports is currently being conducted toprovide a larger data base suitable for an in-depth study ofmiscommunications that is not practical with tape analysis,alone. While the tape analysis can address the frequency withwhich miscommunications occur, it cannot provide a suitable database for extensive errors analysis, since the frequency of errorsis small relative to the total number of transmissions.
2
2. METHOD
Forty-eight hours of voice tapes from local control positions atten different ATC towers were analyzed. Depending on the qualityof the tapes received, between three and six hours from each ofthe following facilities were included in the analysis:Albuquerque, Atlanta, Boston, Dulles (Washington, DC), LosAngeles, Miami, Philadelphia, Phoenix, Pittsburgh, and Seattle.'These facilities were selected to sample different geographicallocations (i.e., east coast, west coast, central), differentworkload levels, and different traffic mixes (e.g., inclusion oftowers with a relatively high proportion of foreign carriers).Twenty-four hours of tape analyzed were from periods of highworkload (as defined by the facility) and 24 hours were fromperiods of moderate workload. Towers with more than one localposition (e.g., departure and arrival) were asked to sample thedifferent positions. The purpose of these selections was toachieve a representative sample of different local operations(excluding the very low workload periods, e.g., middle of thenigI , which would yield little interesting data).
The tapes were analyzed by three subject matter experts (oneformer controller and two pilots). All communication errors weretranscribed and set asiue for separate analysis.
Part of the analysis examined miscommunications. This includedcommunication errors and pilots' requests for repeat of part orall of the transmission. Miscommunications were examined as afunction of the complexity of the controller's message. Messagecomplexity was measured in terms of the number of separateelements contained in a single transmission. Each word, or setof words, the controller said that contained a new piece ofinformation to the pilot, and was critical to the understandingof the message, was considered to be an element. An elementcould also be considered as an opportunity for error. Forexample, "American 123, cleared to land runway two niner" wasconsidered two elements. However, "American 123 cleared to landrunway two niner left" was counted as three elements, since thereis an opportunity to mistakenly land on two niner right.Usually, the counting is straightforward. Changes in altitude orheading are each considered to be one element as are individualtaxiways, runway numbers, and left, right. Landing and taxiinstructions can contain many elements. Controller transmissionscontaining clearances to takeoff or land can also include trafficand wind advisories, and taxi instructions. Taxi instructions,even the limited instructions that would be issued on a busylocal control frequency can be surprisingly complex. Forexample, "Taxi down the runway, turn left at Dixie, join Novemberand taxi all the way down to Tango. Hold short of Runway two
SThe tapes from each facility were from non-consecutive hours in single
hour increments.
3

seven right as you proceed down November" contains seven piecesof information, but was necessary to get an aircraft with agenerator problem back to the gate. Similarly, "Make a rightturn on alpha-alpha, left turn on sierra to juliet-juliet andhold short of niner left on Bravo" would be a complex set ofinstructions (for a single transmission) for a pilot who wasunfamiliar with those taxiways.
In this study, only the pieces of information that increasememory load were counted as separate elements. The aircraft callsign was not counted as an element, since it serves only toattract the pilot's attention and is not something that must beremembered as a part of the message. It should be noted that anysuch counting scheme is necessarily arbitrary. Whether a radiofrequency such as "123.45" should be counted as a single elementor as four elements (since the one is invariant) is debatable.It is not reasonable to assume that all elements impose the samememory load. It is probably easier to remember to cross aspecific taxiway than it is to remember an unfamiliar radiofrequency. Yet, for counting purposes, each would be consideredas one element. The error analysis does, however, examine errorswith respect to the type of information transmitted.
4

3. ROUTINE COMMUNICATIONS PRACTICES
There were 11,234 controller-to-pilot transmissions on the 48hours of voice tapes analyzed. This included 8,444 messages ofsubstance (e.g., clearances to takeoff or land, instructions tochange radio frequencies or taxi instructions, etc.) that wereincluded in this study. The other 2,790 controller transmissionsconsisted of requests for information, salutations, controlleracknowledgements,, etc., and were tallied,, but not included in theanalysis.
3.1 MESSAGE COMPLEXITY
The length and complexity of messages issued by controllers in asingle transmission is often informally cited by pilots as agreat source of frustration and potential errors. Indeed, astudy of en route communications showed that most of the readbackerrors involved lengthy controller transmissions (i.e., thosethat contained more than four pieces'of information). Also,Morrow, Lee, and Rodvold (1993) found that incorrect readbackswere more frequent for TRACON communications containing two ormore pieces of information than those containing only one. In apart-task simulation study, Morrow (personal communication) foundthat incorrect readbacks and requests for clarification were morefrequent after long messages (i.e., those containing four piecesof information) than for shorter messages.
Table 3-1 shows the distribution of messages by complexity level.The majority of messages contained one, two, or three pieces ofinformation. Twenty percent of the messages contained oneelement (e.g., cleared for take-off) and 38% of the messagescontained two elements (e.g.,position and hold on runway twosix). Sixteen percent of the iaessages contained three elements(e.g., position and hold runway two six right) and almost half(46%) of the messages contained four or more elements. It isimportant to realize that, in this environment, controllers needto convey a certain amount of information in a singletransmission. Consequently, even the simplest of instructionscan have three or more elements. For example, "USAir 123,position and hold runway two two left, departing traffic runwayone four" has five elements.
5
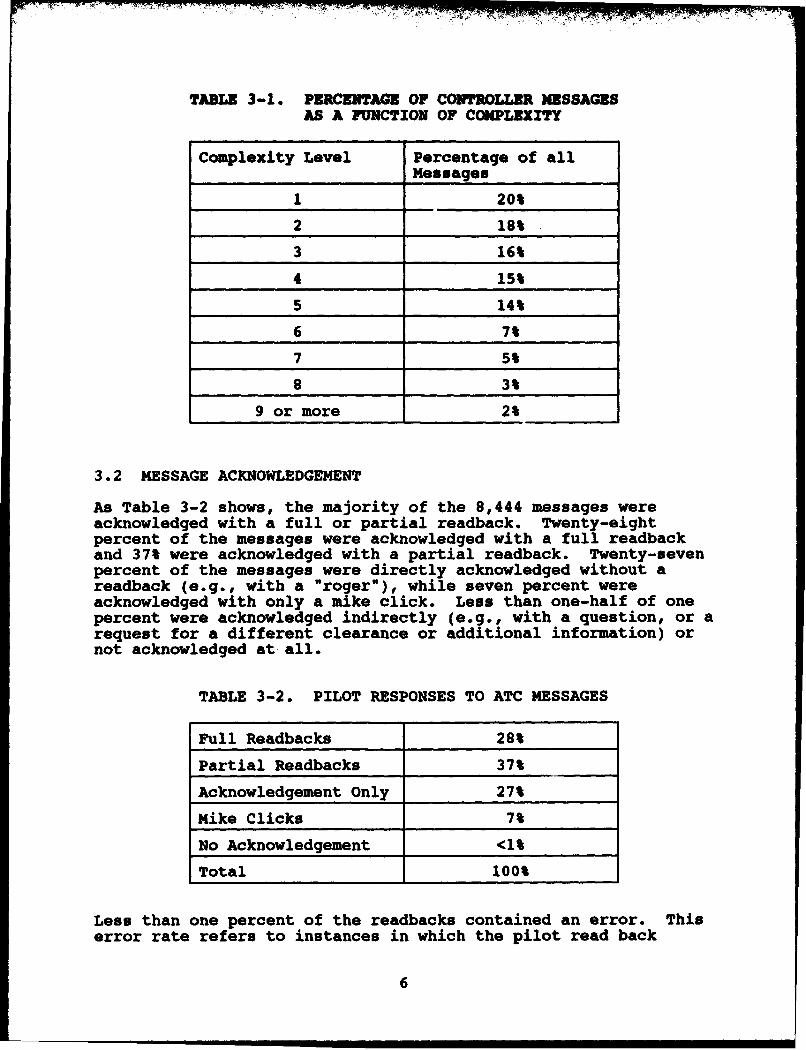
TABLE 3-1. PERCENTAGE OF CONTROLLER MESSAGESAS A FUNCTION OF COMPLEXITY
Complexity Level Percentage of allMessages
1 20%
2 18%
3 16%
4 15%
5 14%
6 7%
7 5%
a 3%
9 or more 2%
3.2 MESSAGE ACKNOWLEDGEMENT
As Table 3-2 shows, the majority of the 8,444 messages wereacknowledged with a full or partial readback. Twenty-eightpercent of the messages were acknowledged with a full readbackand 37% were acknowledged with a partial readback. Twenty-sevenpercent of the messages were directly acknowledged without areadback (e.g., with a "roger"), while seven percent wereacknowledged with only a mike click. Less than one-half of onepercent were acknowledged indirectly (e.g., with a question, or arequest for a different clearance or additional information) ornot acknowledged at all.
TABLE 3-2. PILOT RESPONSES TO ATC MESSAGES
Full Readbacks 28%
Partial Readbacks 37%
Acknowledgement Only 27%
Mike Clicks 7%
No Acknowledgement <1%
Total 100%
Less than one percent of the readbacks contained an error. This
error rate refers to instances in which the pilot read back
6

something (e.g., a runway number, taxivay name or instruction)different from what the controller originally said. Thesereadback errors will be examined in detail in the section onmiscommunications.
3.2.1 Use of Call Sign. in Readbacks
Pilots gave their complete call sign (i.e., airline name andflight number or last three alphanumerics for a general aviationaircraft) in response to 77% of the messages issued and in 61% ofthe readbacks containing an error. A partial call sign (e.g.,airline name alone or flight number alone) was given in anadditional 11% of the readbacks. No call sign was given in 28%of these readback errors. Of the erroneous readbacks givenwithout call signs or with only a partial call sign, 57% werefrom Part 121 or Part 135 air carriers.
The potential hazards inherent in responding with an incompletecall sign are apparent in the following example. The controllerinstructs AirCarrier A 1471 to contact departure. In fact, thecontroller intened to instruct AirCarrier a 1471 to contactdeparture. The pilot responded to this instruction with "1471,good day". In this instance, there was no other aircraft on thefrequency with the call sign of AirCarrier A 1471 and thecontroller had been communicating with the pilot he intended tocontact, so he was easily able to recognize his voice. Still, inthe era of hubs (where many aircraft from the same company areoperating simultaneously) and similar call signs (such asaircraft from different companies having the same or similarflight numbers), pilots need to be particularly diligent aboutusing their complete call sign.
3.2.2 Message ComDlexitv and Incidence of Readbacks
The longer the controller's transmission, the more likely thepilot was to respond with a full or partial readback, rather thanjust an acknowledgement. Figure 3-1 shows the percentage ofreadbacks as a function of message complexity. Controllertransmissions that contained one or two pieces of information,such as "Contact ground" or "Fly heading two one zero, contactdeparture," respectively, were most likely to be responded towith only an acknowledgement. Approximately one-half of thetransmissions containing three pieces of information wereacknowledged with a readback, and 75% of the longer transmissionswere acknowledged with a full or partial readback. (Recall thatpartial readbacks were more common than full readbacks.) Sincetaxi instructions are usually complex and contain criticaldetails that can make the difference between an uneventful taxiand a runway incursion, it is prudent that pilots respond with atleast a partial readback.
It should be noted that each partial or missing readback presentsan opportunity for a communications error, since it does not
7

0
0c
a
0
CV))
E'0
0l
0 ~~ 0
I04
8S
afford the opportunity for a hearback. The consequences of sucherrors are not likely to appear in this type of tape analysis,since the analysis examined the communications from each sectorover the course of an hour and did not follow individual flightsfrom one radio frequency to another (e.g., from tower to ground).
3.3 MISCOMMUNICATIONS
For the purposes of this study, miscommunications consisted ofreadback errors and pilots' requests for a repeat of all or partof the controller's transmission. Many factors can contribute tomiscommunications. One important factor that can lead to bothreadback errors and to hearback errors is expectation. Ashumans, we are predisposed to hear what we expect to hear. Voicetape analysis is not a good vehicle for studying the effects ofexpectation on communication errors. However, the effects ofexpectation can be quite apparent in some of the errors noted.For example, expectation can lead to readback errors, when whatis expected is not what is transmitted. For example, "Maintainminimum approach speed, (pause) change runway, one six left,cleared to land" was read back as, "OK, minimum approach speed,uh, cleared to land one six right". Note how the expectation toland on one six right was stronger than the "change runway"issued by the controller. It is important to note that, in thisinstance, the controller did not stress this part of thetransmission with a change of voice inflection. There was,however, a significant pause before, and a slight pause after,"change runway".
There are many other important factors the can contribute tomiscommunications that cannot be identified in a tape analysis.These factors include pilot and controller workload anddistractions. It is useful, however, to examine the importantfactors that can be studied, such as complexity of controllertransmission and type of information in error.
3.3.1 Messaoe Complexity and Readback Errors
Logically, the more information contained in a singletransmission, the higher the probability of an error. The moreelements in a message, the higher the memory load imposed uponthe pilot. There were only 19 communication errors found in the48 hours of tape analyzed. This represents less than one-fifthof one percent of the 8,444 messages issued. Table 3-3 shows thepercent of pilot readbacks and readback errors as a function ofthe complexity of the controller's original message. Column 1shows the complexity level of the message, that is, the number ofpieces of information contained in the transmission. Column 2shows the percentage of these transmissions that were respondedto with a full or partial readback (as opposed to anacknowledgement only). This was computed by dividing the numberof pilot readbacks at that level by the number of controller
9

transmissions at that level. Column 3 shows the number ofreadback errors at each complexity level. Column 4 shows thepercentage of readback errors at each complexity level. Thesepercentages were obtained by dividing the number of errors madewith messages at that complexity level by the total number ofreadbacks of messages at that level. For example, there werefour readback errors at complexity level five and 1,176 messagesthat contained five elements. This yields a readback error rateof .003 or .3%. The overall error rate is quite low and is lessthan one percent at all complexity levels, except level eight.Messages containing eight pieces of information had a readbackerror rate of almost two percent. Still, there is no reason tosuspect that there is anything unusual about messages with eightpieces of information.
TABLE 3-3. PERCENTAGE OF READBACKS AND READBACK ERRORSAS A FUNCTION OF MESSAGE COMPLEXITY
Complexity Percentage of Number of Percentage ofLevel Full and Readback Readback
Partial Errors ErrorsReadbacks
1 8% 0 0%
2 37% 2 .3%
3 53% 1 .1%
4 68% 4 .4%
5 75% 4 .3%
6 73% 1 .2%
7 73% 3 .8%
8 70% 4 1.8%
9 or more 80% 0 0%
The complexity of the controller's transmission seems to have hadlittle effect on the readback error rate in these communications.This finding stands in sharp contrast to the results of a studyof the en route environment. An analysis of voice tapes from AirRoute Traffic Control Centers (ARTCCs) showed that the readbackerror rate increased significantly with the complexity of thecontroller's transmission (Cardosi, 1993). However, for severalreasons, the number of pieces of information in the localtransmissions studied cannot predict the pilot's memory loadimposed by the transmission as well as it does in the en routeenvironment. First, many of the lengthy transmissions in aterminal environment are predictable, based on standardprocedures (e.g., SIDSs and STARs) and the information availableon the ATIS and via the partyline (i.e., transmissions between
10

the controller and other aircraft); this is not as true en route.(Also, since pilots expect calls from controllers in the terminalenvironment more so than in the en route environment, they may bemore attentive and ready to respond.) Second, the degree towhich the pilot is familiar with the airport and local procedureswill affect the memory load imposed by the transmission. A pilotwho is accustomed to receiving a particular set of instructionsat a particular time (e.g., approach, arrival, or taxiinstructions), is much less likely to make an error in thereadback or execution of those instructions, even though thetransmission may be lengthy, than a pilot who receives a lengthyand unexpected transmission. 2 Third, this analysis, by default,counted each piece of information (e.g., each taxiway) as equaland independent. In reality, many of these pieces of informationcould be logically grouped by the pilot and would not impose thesame memory load as the same number of unrelated pieces ofinformation. Unfortunately, the actual memory load imposed by agiven transmission cannot be evaluated in such a tape analysis,since it depends on factors such as pilot expectations, thepilot's familiarity with the airport, and readiness to write downa clearance.
Support for the fact that something other than the complexity ofthe controller's transmission is contributing to the readbackerrors, comes from the lack of readback errors for transmissionsthat contained nine or more elements. Recall that 80% of thesetransmissions were responded to with a full or partial readback.It is unlikely that these transmissions came as a surprise to thepilot and, by chance, did not lead to any readback errors. It ismore likely that the pilots were prepared, in one way or another,for these lengthy transmissions. It is important to note thattransmissions where the controller warned the pilot of its length(as in asking if the pilot was "ready to copy") were not analyzedseparately, nor were they excluded from the error analysis.'
As previously noted, however, expectation is a double-edged sword.Knowing what message to expect can help the pilot to hear and remember themessage as lona as the expected message is what was transmitted.
3 The number of readback errors was so small that excluding the smallnumber of lengthy, but "prompted* transmissions would have had little effecton the error rate.
11
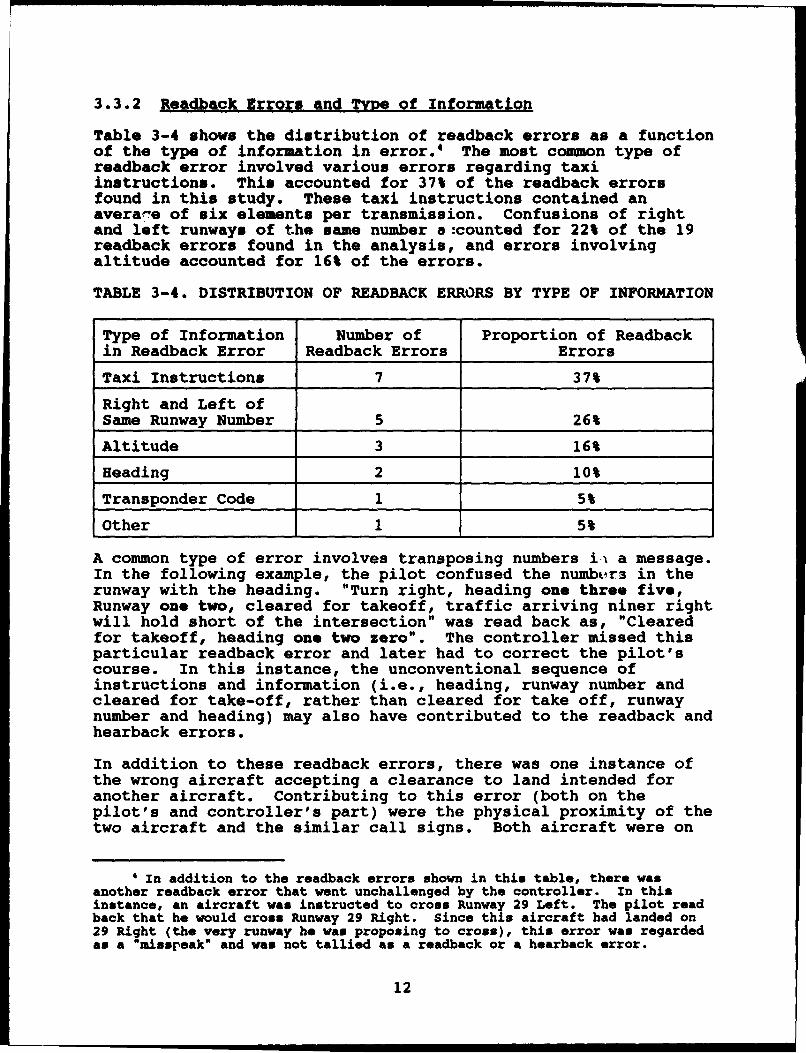
3.3.2 Readback Errors and Type of Information
Table 3-4 shows the distribution of readback errors as a functionof the type of information in error. 4 The most common type ofreadback error involved various errors regarding taxiinstructions. This accounted for 37% of the readback errorsfound in this study. These taxi instructions contained anaverar'e of six elements per transmission. Confusions of rightand left runways of the same number a counted for 22% of the 19readback errors found in the analysis, and errors involvingaltitude accounted for 16% of the errors.
TABLE 3-4. DISTRIBUTION OF READBACK ERRORS BY TYPE OF INFORMATION
Type of Information Number of Proportion of Readback
in Readback Error Readback Errors Errors
Taxi Instructions 7 37%
Right and Left ofSame Runway Number 5 26%
Altitude 3 16%
Heading 2 10%
Transponder Code 1 5%
Other 1 5%
A common type of error involves transposing numbers ii a message.In the following example, the pilot confused the number-3 in therunway with the heading. "Turn right, heading one three five,Runway one two, cleared for takeoff, traffic arriving niner rightwill hold short of the intersection" was read back as, "Clearedfor takeoff, heading one two zero". The controller missed thisparticular readback error and later had to correct the pilot'scourse. In this instance, the unconventional sequence ofinstructions and information (i.e., heading, runway number andcleared for take-off, rather than cleared for take off, runwaynumber and heading) may also have contributed to the readback andhearback errors.
In addition to these readback errors, there was one instance ofthe wrong aircraft accepting a clearance to land intended foranother aircraft. Contributing to this error (both on thepilot's and controller's part) were the physical proximity of thetwo aircraft and the similar call signs. Both aircraft were on
4 in addition to the readback errors shown in this table, there wasanother readback error that went unchallenged by the controller. In thisinstance, an aircraft was instructed to cross Runway 29 Left. The pilot readback that he would cross Runway 29 Right. Since this aircraft had landed on29 Right (the very runway he was proposing to cross), this error was regardedas a "missreak" and was not tallied as a readback or a hearback error.
12
final approach for the same runway and the call signs of the twoaircraft were flights two-eighteen and ten-eighteen of the sameairline. The clearance to land was issued to (and intended for)the aircraft closer to the runway, but was accepted by the otheraircraft. The closer aircraft didn't acknowledge the clearance,(or the transmission was blocked) and landed without incident.The aircraft that accepted the clearance later reported being onfinal approach.
3.3.3 Hearback Errors
There were only seven instances in which the controllers did notnotice an error in the pilot's readback. This represented 37% ofthe 19 readback errors and less than one-tenth of one percent ofthe total number of messages. Most of these hearback errorsfollowed readback errors of taxi instructions. Recall that thecommunications analyzed in this study were from local controlpositions and not ground control. These hearback errors did notoccur while the controller was performing dual duties, since thetapes were from moderate and high workload periods and times inwhich these positions were not likely to be combined. In fact,three of the seven controller transmissions that resulted in ahearback error conclude with the instruction to contact theground control frequency. However, since the number of errors isso small, and since the exact circumstances of the errors (suchas the controller's duties at the time of the error) are unknown,a detailed analysis of these hearback errors is not possible. Aswith the previous study of en route cowmunication, there were toofew readback and hearback errors found in this study tocontribute to our understanding of hearback errors.
3.3.4 Message Complexity and Pilot Requests for Repeats
Pilots who are unsure of all or part of their clearance shouldrequest a repeat of the part in question. Some pilots willreadback what they thought they heard with the hopes that theyare correct and, if not, then the controller will catch theirerror. In this sense, every "say again" and request for a repeatof part of the transmission is a readback and hearback erroraverted. Still, such requests, while necessary, add to thecontroller's workload as additional transmissions are needed tocorrect the problem. There were 78 instances (less than 1% ofthe messages) of pilots requesting that a controller repeat allor part of the transmission. Table 3-5 shows the percentage ofmessages followed by a pilot's request to repeat all or part ofthe transmission. The results are similar to those for pilotreadback errors. Generally, the rate of pilot requests forrepeats increases as message complexity increases, but neverexceeds 2%, even for the most complex transmissions.
13

TABLE 3-5. PERCENTAGE OF TRANSMISSIONS REQUIRING PULLOR PARTIAL REPEAT DUE TO PILOT REQUEST
Numbwrof BlSmbI 1 2 3 4 S 6 7 8 9rcbntillr ar
S of Tummioen .s69 .6% AS .9% .99 13% 1.9% 13% 1iRequiing Ful orPvtial Repea due to
3.3.5 Call Sian Discrepancies
There were 81 instances (approximately one percent of themessages) in which a pilot responded to a transmission with acall sign that was different than the one used by the controller.In only one of these instances was there evidence that the othercall sign was actually another aircraft on the same frequency.(This instance, in which one aircraft accepted a clearance toland intended for another aircraft, was described under thesection on readback errors.) Table 3-6 shows the distributionof these call sign discrepancies. Twenty-eight percent of thesetransmissions contained clearances to land or takeoff, and 20% ofthese transmissions contained instructions to change frequencies.What was most surprising about all of these incidents was thatonly 48% of these call sign discrepancies were corrected. Only26% of the call sign discrepancies that were corrected were doneso with direct pilot questions or statements (e.g., "Was that forAirline 123?"), another three percent were corrected by directcontroller questions or statements. The rest of thediscrepancies were indirectly corrected by either the pilot orcontroller changing the call sign on a subsequent transmission toconform to what the other party used. In the majority (87%) ofthe call sign discrepancies that were corrected in this way, thecontroller changed the call sign used to conform to what thepilot had used. Approximately one-half (52%) of the all of callsign discrepancies went uncorrected as the controller continuedto call the aircraft with one call sign and the pilot respondedto the transmission with another.
14

TABLE 3-6. CALL SIGN DISCREPANCIES (N - 81)
Position Cleared Ckared to Hold Other With Without Frequency Otherand Hol for LAnd Short Maneuver Frequency Frequency Change
Takeoff Change Change
Corrected(47%) 6% 6% 2.5% 1% 5% 2.5% 6% 9-% 9%
Uncorrected 6% 10% 10% 1% 5% 2.5% 5% 6% 7%(53%)
In most cases, such call sign discrepancies do not result in anyill effects, or even ambiguity, since there are other cues thatcontrollers can use to identify aircraft. In addition to thevisual information that the controllers have in front of them onthe flight (e.g., as to the location of the aircraft), they alsohave the pilot's voice. Without a call sign, the pilot's voiceand the content and context of the message are the only cues thatthe controller has that he/she is still talking to the sameaircraft. While this obviously presents an opportunity forerror, it should be noted that none of these instances resultedin a problem. It should also be noted that transmissions of someclearances via datalink would eliminate many of these call signconfusions, but would not eliminate accidentally transmitting aninstruction intended for another aircraft.
3.3.6 Coincident Factors
Pilots and controllers often informally discuss factors that theybelieve contribute to communication errors. In addition tomessage length, pilots often cite high pilot workload, fastcontroller speech rate and similar sounding aircraft call signsas contributing factors to communications problems. Controllersoften cite controller workload, foreign pilots, similar callsigns, and blocked transmissions as contributing factors. Voicetape analysis is not an appropriate method of examining pilot andcontroller workload or cockpit and controller distractions.However, it can offer a glimpse into the other factors. Thefollowing factors were examined as possible coincident events:
- similar sounding call signs on the same frequency;- significant weather conditions;- communications equipment malfunction;- blocked transmissions;- pilot's or controller's use of nonstandard phraseology;- pilot's or controller's fast rate of speech; and- pilot's or controller's accent.
15

Each of the 97 miscommunications (19 readback errors and 78 pilotrequests for repeats) was examined for the coincidence of thesefactors. That is, if any one of these factors was present in anerror, it was noted. This was not meant to imply that thisfactor caused the miscommunication, or even contributed to it.Furthermore, each occurrence of these factors was not counted,only the ones that occurred in conjunction with amiscommunication. Similar call signs on the same frequency was,by far, the most common coincident factor seen. Similar callsigns were coincident with 12% of the miscommunications (butcontributed significantly to only one communications error). Badweather was coincident with 5% of the miscommunications andequipment malfunctions were coincident with 2%. Blockedtransmissions, pilot's or controller's use of nonstandardphraseology, rate of speech, and accent, were not noted ascoincident with any of the miscommunications.
It should be noted that the lack of significant results found inthis portion of the analysis should not be interpreted as proofthat none of the factors examined constitutes an ATCcommunications problem. First, the small sample of errors thatwas found in this study does not allow for an adequateexamination of any single one of these factors. In order toexamine the impact of any one of these factors on communications,the number of total incidence would need to be compared to thenumber of occasions in which it was found to contribute to acommunications problem. For example, in order to study thesimilar call sign problem, the number of instances in whichsimilar sounding call signs were on the same frequency would becompared to the number of instances in which this resulted in acommunications problem. Such a series of studies was beyond thescope of this analysis. Also, the fact that a specific problemwas not observed during the course of this study or the fact thata specific problem is not a common occurrence, does not lessenthe severity of the consequences when it does occur. Forexample, there were no incidents of blocked transmissions thatresulted in a communication error in the 48 hours of tapeexamined. Still, the consequences of a stuck microphone in busyairspace can be very serious. The fact that none of the factorsexamined were found to have significant effects is not meant tosuggest that problems do not exist, nor should it precludefurther study.
16
4. CONCLUSIONS
One of the most striking findings of this analysis was how fewerrors were found. A readback error rate of less than onepercent is a tribute to the pilots and controllers operating inthe National Airspace System. Even the most diligent andconscientious pilots and controllers can be involved in acommunication error. Complacency and poor radio discipline onlycompound the problem of the inevitability of human error. It isnot possible to reduce the number of communication errors bytelling pilots and controllers to "pay attention". However, thisanalysis suggests that simple changes in current practices couldreduce the risk of communication errors. Controllers should beencouraged to keep their transmissions brief and to look forreadback errors. Perhaps, erroneous readbacks should be includedin the traffic scenarios used in controller training, as a recentASRS reporter suggests (ASRS Callback, 1992).
It is not realistic to expect air traffic controllers to catchall readback errors while performing their other duties. We areall set up to hear what we expect to hear. While controllers arenot exempt from this law of human nature, we require a higherstandard of information processing from them. Pilots andcontrollers need to be aware that catching readback errors is adifficult task, particularly when combined with other duties thatneed to be performed simultaneously. Often, during a pilot'sreadback, the controller's attention may already be on the nextmessage that must be issued. This is particularly likely duringhigh workload periods. Pilots need to be encouraged to ask forclarifination, rather than expect the controller to catchreadback errors. Pilots should also be diligent about using fullcall signs to acknowledge controller transmissions and toquestion call sign discrepancies (as in "... Was that for AirCarrier 123?"). Controllers should listen for the call sign, aswell as the content, of the pilot's readback. Controllers shouldalso continue to warn pilots when there are similar call signs onthe same frequency, whenever possible. Unfortunately, it is noteasy to define what constitutes "similar call signs". A list ofpotentially confusable call signs would be too lengthy to beuseful. Clearly, call signs with different airline names, butthe same flight numbers are similar, as are same airline flightnumbers that differ only by one digit, or one syllable, as in thecase of "two" and "ten". Such practices and increased awarenesscan further reduce the probability of communication problems andfurther ilicrease the margin of safety.
17/18
LIST OF ACRONYM
ARTC - Air Route Traffic Control Center
ASRS - Aviation Safety Reporting System
ATC - Air Traffic Control
ATCT - Air Traffic Control Tower
ATIS - Automated Terminal Information Service
SID - Standard Instrument Departure
STAR - Standard Terminal Arrival Route
TRACON - Terminal Radar Approach Control
19
REFERENCES
ASRS Callback Number 163, Readback/hearback - Some fresh ideas,December 1992.
Cardosi, K. 1993. An analysis of an route controller-pilot voicecommunications. DOT/FAA/RD-93 / 11.
Morrow, D., Lee, A., & Rodvold, M. 1993. Analysis of problems inroutine controller-pilot communication. International Journal ofAviation Psychology, 3(4), 285-302.
20