a+ improvement model forsyth county schools. quality learning and superior performance for all our...
TRANSCRIPT

A+ Improvement Model
Forsyth County Schools

Quality Learning and Superior Performance for All
Our Purpose
Model the Process Step-by-Step Guidance Title I Requirements Response to Intervention Team Collaboration Review of Resources Assist Teams

Quality Learning and Superior Performance for All
Quality Learning and Superior Performance
for All
Vision 2010
District Standards
A+ Improvement Model (A.I.M.)
Georgia School Keys (GSK)
Data Profiles/ Class Profiles
Pyramid of Interventions
Focused Choice
Professional Appraisal Cycle
(PAC)
Leadership Appraisal Cycle
(LAC)
Response to Intervention

Quality Learning and Superior Performance for All
A+ Improvement Model (A.I.M.)
Developed 2001 Revised 2006 and 2008 Read the A.I.M. Philosophy What key words and/or phrases stand
out? Does this philosophy align with our vision
and beliefs?

Quality Learning and Superior Performance for All
NEW! Assist Teams
Central support organized to assist schools with school improvement and professional learning

Quality Learning and Superior Performance for All
Step 1: Review Data Profiles and Decision Support Library Student Learning Data Demographic Data School Process Data Perception Data
Data Profiles / Class ProfilesMultiple Measures, Victoria Bernhardt

Quality Learning and Superior Performance for All
Student Learning DataStudent Learning Data
Elementary School Profile:CRCT – grades 1-5Writing – grades 3 and5ITBS / CogAT – grades 3 and 5ACCESS – grades K-5AYP ReportGAAMiddle School Profile:CRCT – grades 6-8Writing – grade 8ITBS – grade 8ACCESS – grades 6-8AYP ReportGAAHigh School Profile:EXPLORE – grade 9PSAT – grade 10 and 11EOCT – grades 9-12GHSGT – grade 11GHSWT – grade 11ACCESS – grades 9-12SAT – grade 12AP Exams – grades 11 - 12ACT – grade 12AYP ReportGAA
Student Learning Data
Additional School Measures:Course pass ratesClassroom / Formative assessment dataRTI dataAIMSWebGKIDSBenchmarks 3-8 and HS EOCT CoursesCRT Gates MacGinitie (9, 10, 12)W-APT

Quality Learning and Superior Performance for All
Demographic DataDemographic Data
DemographicsEnrollmentAttendance – ADA and studentWithdrawal ReasonsDropout ReasonsStudents RetainedGraduate DiplomasPrograms of StudyMobility Rate Free / Reduced Lunch Chronic Illness Discipline:Unsafe School IncidentsCrossroads Program PlacementDiscipline IncidentsDiscipline Events Summary
Demographic Data
Staff Demographics:Faculty/staff demographicsAttrition rate of teachersHighly qualified teachers

Quality Learning and Superior Performance for All
School Process DataSchool Process Data
Programs and ServicesEnrollment in post secondary programsESOL/LEP ProgramEconomically DisadvantagedGifted EducationMigrantSpecial Ed by DisabilitySpecial Program ExitStudent Support Team Data Instructional Support Team Data
Title I – Data must indicate a need for additional / supplemental instruction for at risk students. Students at the greatest need are identified and a priority list is created.

Quality Learning and Superior Performance for All
Perception DataPerception Data
Standards Assessment InventoryTechnology Implementation SurveyGSS Certified Staff SurveyStudent Health SurveySchool created parent/community surveysGSS Staff and Community SurveysESOL Survey Data
Quality Learning and Superior Performance for All
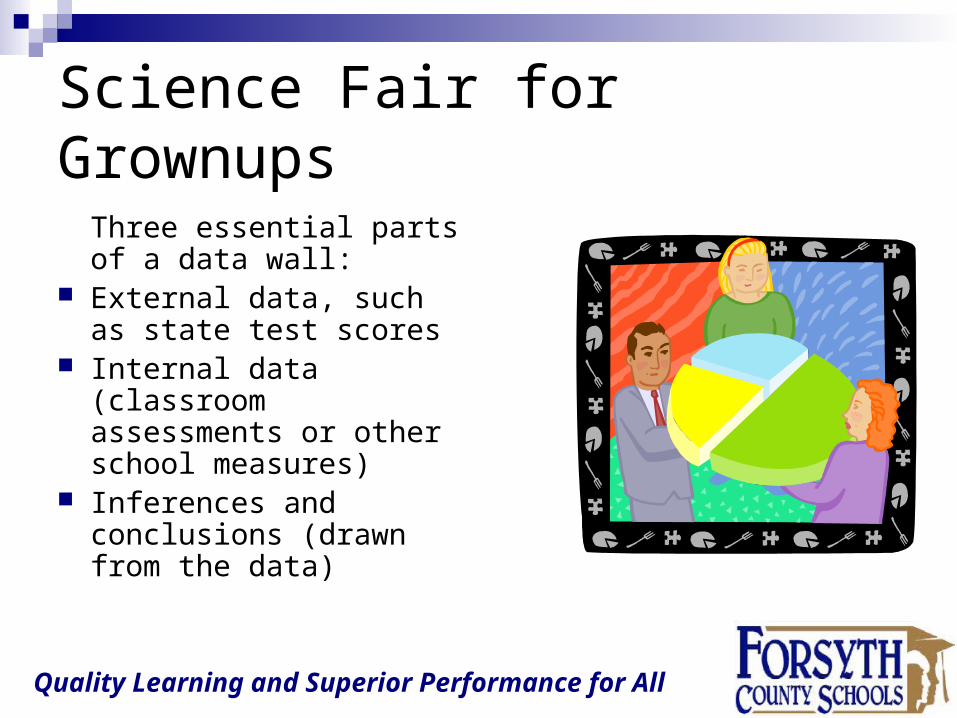
Science Fair for Grownups
Three essential parts of a data wall:
External data, such as state test scores
Internal data (classroom assessments or other school measures)
Inferences and conclusions (drawn from the data)

Quality Learning and Superior Performance for All
Step 2: Analyze student learning dataUsing data from the last three years, what are the trends in: achievement in content areas? achievement in domains? achievement in subgroups?
What are the percentages of students in each performance level by content area, domain, or subgroup?
How does the student data compare to the Absolute Bar for each Annual Measurable Objective (AMO)? What are the implications for meeting future increases in AMO?
What are our overall academic strengths? What are our opportunities for improving teaching and learning?
How will we communicate the findings with faculty members, LSC, PTA/PTO, and other stakeholders?
Resources: Data Profiles, Class Profiles, AYP Report, AMO chart, AIM Rubric
Quality Learning and Superior Performance for All
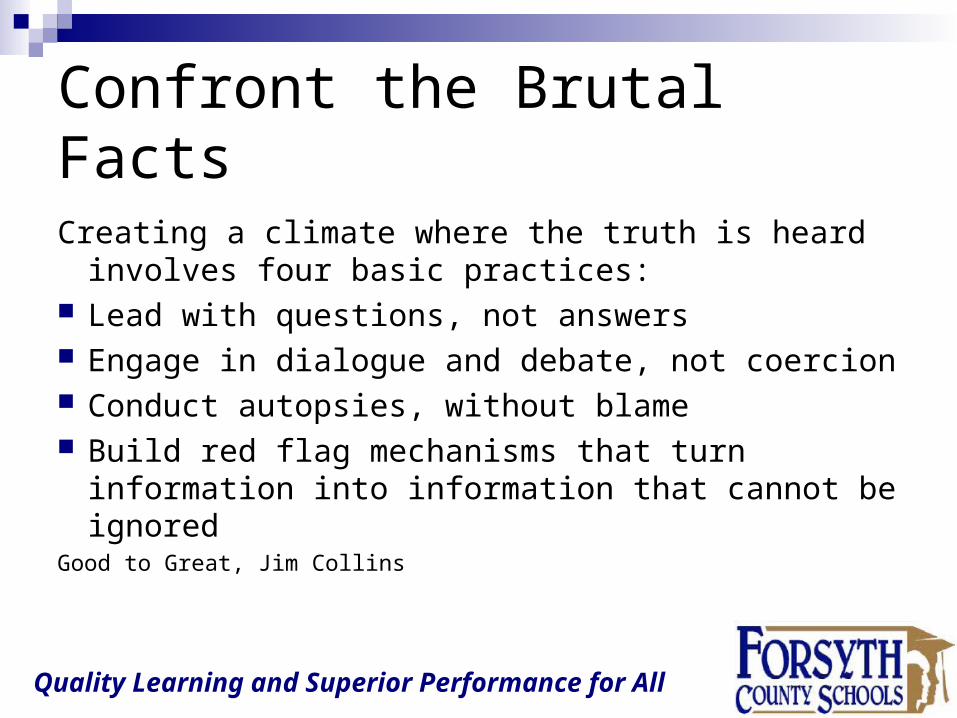
Confront the Brutal Facts
Creating a climate where the truth is heard involves four basic practices:
Lead with questions, not answers Engage in dialogue and debate, not coercion Conduct autopsies, without blame Build red flag mechanisms that turn information
into information that cannot be ignoredGood to Great, Jim Collins

Quality Learning and Superior Performance for All
CRCT Annual Measurable Objectives
Reading & English Language Arts
Mathematics
2003 60.00% 50.00%
2004 60.00% 50.00%
2005 66.70% 58.30%
2006 66.70% 58.30%
2007 66.70% 58.30%
2008 73.30% 59.5%
2009 73.30% 59.5%
2010 73.30% 66.70%
2011 80.00% 75.00%
2012 86.70% 87.40%
2013 93.30% 93.70%
2014 100.00% 100.00%

Quality Learning and Superior Performance for All
GHSGT Annual Measurable Objectives
Reading & English Language Arts
Mathematics
2003 88.00% 81.00%
2004 81.60% 62.30%
2005 81.60% 62.30%
2006 84.70% 68.60%
2007 84.70% 68.60%
2008 87.70% 74.90%
2009 87.70% 74.90%
2010 87.70% 74.90%
2011 90.80% 81.20%
2012 93.90% 83.30%
2013 96.90% 91.70%
2014 100.00% 100.00%

Quality Learning and Superior Performance for All
To view AYP reports for each school and the system:
AYP Reports 2008
Table Conversations:
Review System AYP Data

Quality Learning and Superior Performance for All
CRCT Math

Quality Learning and Superior Performance for All
CRCT Reading/ELA

Quality Learning and Superior Performance for All
GHSGT Math

Quality Learning and Superior Performance for All
GHGST English

Quality Learning and Superior Performance for All
Graduation Rate

Quality Learning and Superior Performance for All
Attendance Rate

Quality Learning and Superior Performance for All
Step 3: Analyze demographic data
How does this data influence: student placement? access to rigorous coursework? school-wide policies and procedures (i.e. discipline plan, schedule)? allocation of resources (i.e. time, space, personnel, funds)?
What are our areas of strength? What are our areas of concern?
Are we satisfied with the graduation rate? What interventions are needed at the secondary level to keep students in school?
Resources: Data Profiles, Class Profiles , AYP Report, Infinite Campus, AIM Rubric

Quality Learning and Superior Performance for All
Step 4: Analyze school process dataWhat does this data reveal about: school-wide processes (e,g. IST / SST)? RTI Process? services for special populations? enrollment by program?
What programs do we offer?
How do these programs and services help maximize student learning?
How do these programs and services hinder or create barriers to student learning?
Are we serving the needs of all students? Are there programs and/or services that need our attention?
Resources: Data Profiles, Class Profiles, Infinite Campus, AIM Rubric

Quality Learning and Superior Performance for All
Step 5: Analyze perception dataDo other data sources align with our perceptions?For example: Does information from Focus Walks align with our perceptions about standards-
based classrooms? Does participation in remediation and extended learning time align with our
perceptions about providing extra help for students? Does our class/course data align with our perceptions about equity and access to
rigorous curriculum?
Are there discrepancies between “perceived” practice and “actual” practice?
Which of the Georgia School Standards should be a focus in determining actions and strategies? (Use GSS Survey or the Engage ME 10 Concepts of Standards-based Classrooms)
What information are we getting from our community? Perception of “school” from community/parents?
Resources: Data Profiles, Class Profiles , Georgia School Keys Survey, Standards Assessment Inventory, School Needs Assessments, ESOL Surveys, AIM Rubric

Quality Learning and Superior Performance for All
Georgia School Keys
Curriculum Instruction Assessment Planning and Organization Student, Family, Community Support Professional Learning Leadership School Culture

Quality Learning and Superior Performance for All
Step 6: Determine Root Causes
Root causes are: underlying causes those that can be reasonably identified those over which teachers and school leaders
have control those for which effective actions and strategies
can be generated
Reference AIM Rubric

Quality Learning and Superior Performance for All
Fishbone Diagram
The Cause and Effect Diagram or Fishbone Diagram is a graphical tool for identifying the relationship between a problem and its potential causes. One of the most effective ways of constructing such a diagram is to brainstorm potential causes in a team environment. For example, a cause and effect diagram might be used to determine possible causes of low achievement in a student subgroup.

Quality Learning and Superior Performance for All
The Fishbone diagram is drawn to resemble the skeleton of a fish, with the issue (problem or process condition) on the right side. The major cause categories are written in the boxes on the left side of Cause and Effect Diagram. Summarize the major causes under the categories.
Subgroups

Quality Learning and Superior Performance for All
Step 7: Pyramid of InterventionsConsider the Forsyth County Schools Pyramid of Interventions and documenting the
necessary actions and strategies in the A.I.M. plan.
Develop RTI strategies and actions that includes the following: Focus - Determine how students will be identified Program – List the research based programs in your school (Consider using the “Inventorying Your
School’s RTI Resources: A Brainstorming Activity” Grouping – Determine how students will be grouped Time – Determine time for Tier II Assessment – Determine WHO, WHEN, WHERE and HOW for Universal Screening (K-2nd grade),
Benchmark Assessments (3rd-8th grade) and Progress Monitoring Interventionist – List all the support available (Consider using the “Inventorying Your School’s RTI
Resources: A Brainstorming Activity”) Setting – Determine WHEN interventions will be conducted Meeting – TIER III - Determine WHO, WHEN, WHERE and HOW your SST will be conducted; TIER II
-Determine if your school will use an Instructional Support Team – WHO, WHEN, WHERE and HOW Decision Points – Determine when students will be moved to another TIER Fidelity – Discuss how fidelity will be monitored Roles and Responsibilities – Determine the roles and responsibilities for TIER II.
Educate stakeholders about the Pyramid of Interventions and RTI process to all staff, parents, students
Discuss WHO, WHEN, WHERE and HOW
Resources: FCS Pyramid of Interventions, School-level template

Quality Learning and Superior Performance for All
Forsyth County Schools
Tiers Interventions
Tier 4:Individually Designed Teaching and Learning
Targeted students are provided following Tier 1, 2, and 3 implementation and evaluation:
Specialized programsAdapted content, methodology, or instructional delivery
GPS access / extension
Tier 3:SST Driven Teaching and Learning
Targeted students are provided following Tier 1 and 2 implementation and data collection:Individualized assessment, evaluation
Tailored interventions to respond to their needs (reference at-risk interventions)Frequent, formative assessments based on individual learning goals
Consideration for specially designed instruction only when data indicates a need (e.g. gifted or special education services)
Tier 2:Needs-Based Teaching and Learning
Targeted students participate in instruction that in addition to Tier I:Uses established Pre-SST Protocol (collaboration with student, parent, colleagues)
Provides enhanced opportunities for extended learning for remediation and enrichmentIncludes more frequent progress monitoring
Addresses developmental needs (cognitive, communication/language, social, behavioral, etc.)
Tier 1: Standards-Based Classroom Teaching and Learning
All students participate in standards-based instruction that is:Differentiated (content, process, and product)
Designed using high leverage strategies and design qualitiesGuided by progress monitoring and balanced assessment
Developmentally appropriate (cognitive, communication/language, social, behavioral, etc.)Supported by collaboration within Professional Learning Communities
Pyramid of Interventions

Quality Learning and Superior Performance for All
Step 8: A.I.M. Action PlanComplete the following: Write annual, measurable goals Identify actions, strategies, or interventions that directly relate to the goals Identify monitoring of strategies and evidence of impact on student learning Communicate the A.I.M. School Improvement Plan to all staff and stakeholders
Utilize the SMART goal philosophy Specific and Strategic Measurable Attainable Relevant Time Oriented
The action plan template was designed to emphasize development of high leverage actions and determination of how the plan will be monitored and evaluated. It is in the implementation and evaluation phase that school improvement plans falter. To ensure that plans are truly utilized to drive daily practice, the more condensed format will be utilized.
Reference AIM Rubric

Quality Learning and Superior Performance for All
The Virtues of “Ugly” Plans
The Learning Leader Douglas Reeves
PIM Study Planning Implementation Monitoring

Quality Learning and Superior Performance for All
Forsyth County Schools A.I.M. School: _____________________________________________________________ Principal: ___________________________________________ SY2008-2009
Action Plan
Goal Statement(s): Specific academic areas within content and/or subgroup to address: Title I – SMART goals are indicated for Title I students. There is a description of provisions made for serving all eligible children, including economically disadvantaged, disabled, migrant, LEP, and homeless. Goals for subgroups are specific. A statement indicates that highly qualified teachers are employed.
SMART Goals:Specific and Strategic MeasurableAttainableRelevantTime Oriented
Actions / Strategies / InterventionsActions / Strategies / Interventions – Interventions, strategies, and activities for Title I students are described. The description includes grades, subjects to be used, schedule of supplemental instruction and parent involvement. Strategies are included for strengthening parental involvement. The policy, plan, and compact are attached.
Monitoring of Interventions
(Artifacts)
Evidence of Impact(Student Learning
Data)Evidence includes how the Title I program is monitored for effectiveness and student progress.

Quality Learning and Superior Performance for All
GSS Implementation Resource
Evidence Artifacts www.gadoe.org
Quality Learning and Superior Performance for All
Step 9: Professional Learning PlanConsider the following: How can we best design our learning to support our school improvement goals?
How can we design learning for our staff that supports the implementation of the strategies and actions we have outlined?
Can we integrate modeling / coaching of expected classroom practices?
How can we build structures (e.g. collaborative meetings) that maximize professional learning to be used for monitoring student progress, examining student work, and monitoring implementation of the AIM plan?
How can we ensure that the needs of all staff members are met?
Utilize the Designing Professional Learning: A Protocol for Forsyth School Leaders (included) and the School-Based Professional Learning Plan (included)
Title I - Professional Learning Plan – The professional learning plan defines how teachers are more prepared for addressing the needs identified as weaknesses.
Reference AIM Rubric

Quality Learning and Superior Performance for All
Professional Learning Defined
Professional Learning is the means by which teachers, administrators and other school and system employees acquire, enhance, or refine the knowledge, skills and commitment necessary to create and support high levels of learning for all students.
Optimal professional learning is standards-based, results-driven, systemic, ongoing, and embedded into the daily routine of educators.

Quality Learning and Superior Performance for All
Designing Professional Learning
Prewriting Capture key reflections about your staff that may help guide you in
designing work for them. Identify their readiness and unique abilities and challenges. Reflect on the types of tasks that may speak to the motives they bring to work. What are their learning styles and specific interests?
Consider key learning from last year’s professional learning plan. What worked best? Which sessions engaged the staff? What content was transferred to classroom practice?
Thinking of the key reflections above, which Design Qualities should be emphasized and why?

Quality Learning and Superior Performance for All
Stage 1: Desired Results
What do you want them to know and be able to do? Differentiate Content
Target essential knowledge and skills Expect all teachers to work at high levels
Design Qualities Content and Substance Organization of Knowledge

Quality Learning and Superior Performance for All
Stage 2: Assessment Evidence
How do you want them to show you they understand? Differentiate Content
Pre-assess staff readiness Use on-going assessments to chart staff progress Allow staff options for showing what they know
Design Qualities Clear and Compelling Product Standards Protection From Adverse Consequences Affirmation of Performance Choice
Quality Learning and Superior Performance for All
Stage 3: Learning Activities How are they going to experience and learn the
concepts? Differentiate Content
Develop a safe and challenging learning environment Focus teacher tasks Adjust instruction to address staff readiness and learning profile Work to eliminate barriers to learning
Design Qualities Product Focus Affiliation Novelty and Variety Authenticity

Quality Learning and Superior Performance for All
Collaboration Time
Use the protocol within school teams to revisit, refine, or design professional learning for the 08-09 school year.

Quality Learning and Superior Performance for All
Step 10: Implement and Monitor
The School Improvement Team/Leadership Team should: Establish dates and times for school-based team
meetings to ensure all teacher teams understand their roles in implementing the school improvement plan.
Develop and implement a process for monitoring implementation of the school improvement plan that includes creating, adapting, assembling, and organizing all formative assessments for dissemination and discussion with all appropriate groups.
Document ongoing planning and monitoring or progress toward school improvement goals.

Quality Learning and Superior Performance for All
On a routine basis, ask the following key questions: Do all teachers know their limited number of annual
improvement goals? What evidence do you have of this?
When are your monthly improvement meetings scheduled?
Can every teacher, at any point during the school year, tell you precisely which areas of weakness or subgroups their team is currently concentrating on during their regular team meetings (i.e. based on student work, formative assessments, etc.)?
What successful strategies have been generated, refined, and learned to promote improvement in the identified area of weakness?
(adapted from Mike Schmoker, Results, ASCD)

Quality Learning and Superior Performance for All
TEAM Learning Log
Targeted Area for Improvement:
Strategy / Solution (provide a brief description of academic intervention / support):
Results (measurable impact of solution):
Team Members:Date:

Quality Learning and Superior Performance for All
Step 10: Conduct a Summative Evaluation Analyze new data to determine if goals were
met. Use the template provided to record a summary of actions and a reflection on performance.
Determine evidence and artifacts that illustrate progress toward goal attainment.
Reflect on the Georgia School Standards to determine areas of growth and continued focus.
Resources: Implementation Resource Guide

Quality Learning and Superior Performance for All
Forsyth County Schools A.I.M.School: _____________________________________________________________Principal: ___________________________________________ SY2006-2007
Summative Evaluation of A.I.M.Action Plan 1: Goal Attainment ____ Met ____ Did Not Meet
Action Plan 2: Goal Attainment ____ Met ____ Did Not Meet
Action Plan 3: Goal Attainment ____ Met ____ Did Not Meet

Quality Learning and Superior Performance for All
School Improvement Webpages
Data Profiles and School Improvement Plans (connected to school pages as well)
Plans due September 19th (Friday before Labor Day)
AIM Planning Page (guidance, templates, ppt)

Quality Learning and Superior Performance for All
Assist Team Feedback
Please complete the Feedback form as a team prior to leaving today.

Quality Learning and Superior Performance for All
Schools with Greatest Gains in Achievement: Embrace holistic accountability Include consistent nonfiction writing
assessments in every subject Use frequent common assessments Implement immediate and decisive
intervention Use data constructivelyThe Learning Leader, Douglas Reeves

Quality Learning and Superior Performance for All
We must build organizations where people continuously expand their
capacity to create the results they truly desire, where new and expansive
patterns of thinking are nurtured, where collective aspiration is set free, and
where people are continuously learning together.
~ Peter Senge