a institutional effectiveness - university of maryland ... · institutional effectiveness...
TRANSCRIPT
AP
PE
ND
IX A
UNIVERSITY OF MARYLAND EASTERN SHORE
Institutional Effectiveness Management Model (2005 – Updated 2015)
Office of the President
www.umes.edu
oirpa/08/24/2015
Peer Performance
Measures
Student
Learning Outcomes
Managing for Results
Resource
Allocation
Mission
Facilities
Strategic Plan
Dashboards
Institutional
Effectiveness

ii
UNIVERSITY OF MARYLAND EASTERN SHORE
Institutional Effectiveness Management Model
Table of Contents
Acknowledgements .............................................................................................................. 1
Introduction....................................................................................................................... 1
Historical Review ............................................................................................................. 1
From Excellence to Eminence Initiative: Leadership Training and Assessment.......... 1
Revitalization of the UMES Assessment and Accountability System .......................... 2
2011 UMES Strategic Planning Process ....................................................................... 3
The Plan in Action: Strategic and Operations Plan Manual ........................................ 5
The Model Defined ........................................................................................................... 5
Institutional Effectiveness Process................................................................................ 5
Academic Strategic Plan ............................................................................................... 6
UMES Strategic Plan .................................................................................................... 6
Budget Allocation Task Force Recommendations........................................................ 7
Student Learning Assessment Plan ............................................................................... 7
Facilities Management and Technology Plans.............................................................. 8
Assessment of Outcomes .............................................................................................. 8
The Model Operationalized .............................................................................................. 9
Assessment Based on Mission, Goals, and Objectives ................................................. 9
Assessment Timeline and Campus Collaboration ........................................................ 9
Assessment and Data Management ............................................................................ 10
University Resources and Planning ............................................................................ 11
Division Assessment Responsibility ........................................................................... 11
Periodic Assessment Plan Review .............................................................................. 12
Communication Process and Assessment Outcomes .................................................. 13
Assessment Results and University Improvements .................................................... 13
iii
Resource Allocation and University Change .............................................................. 14
Institutional Assessment and Revision of the Strategic Plan ...................................... 15
Summary ......................................................................................................................... 15
List of Appendices
A. 2013-2014 Annual Strategic Operations Plan Objectives......................................... 17
B. Cross-cutting Indicators: Institutional Effectiveness System-wide Reporting ......... 22
C. Strategic Plan Goals: ·Relevant Indicators ............................................................... 28
D. Strategic Plan Implementation Form ........................................................................ 38
Institutional Effectiveness Management Model
1
ACKNOWLEDGEMENTS
The Institutional Effectiveness Management Model originally published in 2005 by the Office of the
President, was updated in 2015 to reflect changes that have taken place at UMES and especially those
pertaining to the planning process including changes in the environment in which the university operates.
The university remains committed to values-based leadership, accountability, and shared governance.
This document has been updated collaboratively by Juliette B. Bell, Ph.D., President and Stanley M.
Nyirenda, Ph.D., Director of Institutional Research, Planning & Assessment. The document summaries
current accountability practices for planning and assessment. It documents the creation and
implementation of university-specific models that currently guide planning, assessment and evaluation of
academic programs and services. It confirms a commitment of the President to transforming the
University from Excellence to Eminence.
INTRODUCTION
The University of Maryland Eastern Shore (UMES) maintains its legacy as an 1890 Land-Grant
institution and continues its advance to become a Doctoral Research University. The profile of the
University has been changing over recent years due to a period of growth in enrollment from 4,130 in fall
2006 to 4,540 in fall 2010, declining to 4,222 in fall 2013. During this period programs have grown at all
levels from 46 in fall 2006 to 60 in fall 2015. This growth in enrollment and programs has defined
UMES as a modern comprehensive university that honors the unique land-grant institutional mission and
respects the urgent need for workforce development on the Eastern Shore of Maryland and beyond. In
order to maintain its commitment to excellence and transformation to eminence, the University maintains
a focus upon effective leadership, management practices, and accountability.
The UMES Institutional Effectiveness Management Model defines a concept for integrating relevant
assessment tools and management practices to effectively monitor University effectiveness.
HISTORICAL REVIEW
UMES' effectiveness as an institution of higher education is monitored on many levels by local, state and
national stakeholders. ·However, it is the accreditation of the University that certifies a commitment to
excellence and sustained quality. Accredited by the Middle States Commission on Higher Education, the
University of Maryland Eastern Shore completed its last Comprehensive Self-Study Evaluation in April
2006. The next Middle States Commission on Higher Education Reaffirmation of Accreditation Site visit
will occur April, 2016. Since the last reaffirmation in 2006, the University has experienced continued
growth and change in the development of accountability practices. Propelled by the vision of the new
Chief Executive Officer, Dr. Juliette B. Bell, the university's success with integrating the strategic
planning process throughout the campus is due largely to the vision and emphasis upon shared-
governance and continuous improvement. Dr. Bell assumed the presidency on July 1, 2012 and
implemented “From Excellence to Eminence – The Journey Continues” as her first initiative to empower
and enable leadership by revitalizing institutional effectiveness protocols for assessment.
From Excellence to Eminence Initiative: Leadership Training and Assessment
The From Excellence to Eminence (FEE) initiative has served to support and enhance the strategic
planning and assessment process by placing increased emphasis on data management, assessment, and
accountability for the six Divisions of the University: Division of Academic Affairs, Division of
Institutional Effectiveness Management Model
2
Administrative Affairs, Division of Research and Economic Development, Division of Institutional
Advancement, Division of Student Affairs and Enrollment Management and the Department of Athletics.
The FEE initiative has as its major focus the strengthening and empowerment of leadership to enhance
planning, assessment and accountability throughout the university. The current 2011-2016 strategic plan
document was developed in 2011 and implemented by the University of Maryland Eastern Shore in AY
2012-2013 to operationalize and measure objectives in a more comprehensive manner and to use the
results of assessment to improve programs.
The following practices helped to ensure an integrated strategic planning process:
Convened Executive Leadership Management Retreats and Workshops to enhance management
and outcomes assessment techniques
Realigned and redesigned Office of Institutional Research, Planning and Assessment to increase
personnel and enhance assessment practices
Revitalized university-wide strategic planning process with dissemination of an annual Strategic
Operations Plan format to guide divisions and operational units.
Organized administrative systems to evaluate outcomes and use results to improve academic
programs and services
The new strategic planning process that resulted in the 2011-2016 Strategic Plan used lessons learned
including ensuring that there was a matrix linking goals and sub-goals with key/responsible people in
divisions/operational units and creating a standing committee—the Strategic Plan and Assessment
Review Committee (SPARC)—to review priority SMART (Specific, Measurable, Achievable, Realistic
and Time-bound) annual operational objectives from divisions/operational units and monitor their
implementation and progress toward achievement of intended outcomes/targets. The process ensures that
annual objectives developed throughout the campus community are tied ·to the plan and that
division/operational unit leaders make use of assessment results to inform change. SPARC whose
membership includes the President’s Cabinet, Chairs of Senate and Faculty Assembly and the president
of the Student Government Association ensures that results are shared throughout the University
community.
Annually, over 100 members of the executive leadership team and academic leadership (deans and
department chairpersons), faculty, and staff participate in management training and professional
development workshops during the academic year and summer. For example, in 2014-2015 on-campus
workshops were offered on Assessment of Student Learning (department chairs, deans, and faculty),
Linking Planning and Budgeting (vice presidents, and operational unit leaders), Leading at the Speed of
Trust (senior leadership—President’s Cabinet), High Impact Leadership (mid management), Challenging
Support Staff to Excellence (Staff). Sessions focused on leadership, accountability, efficiency,
institutional effectiveness and assessment of student learning.
Outcomes from the annual training opportunity are summarized and used to fuel further discussion in the
President's Cabinet meetings (which includes all division vice presidents) and meetings of operational
units. Above all, summaries and reports from workshops are used to strengthen UMES institutional
effectiveness process and support the creation of a culture of assessment and continuous improvement.
Revitalization of the UMES Assessment and Accountability System
The UMES strategic planning process relies heavily upon the capability available in its Office of
Institutional Research, Planning and Assessment (OIRPA). This office has responsibility for providing
technical support and leadership in three critical areas—institutional data, planning (strategic planning),
Institutional Effectiveness Management Model
3
and assessment. The office has a small dedicated staff that has played a critical role in the enhancement
of the quality of institutional data through systematic review of institutional data by the Data Integrity
Group (Data Reconciliation Taskforce), created in 2004. Prior to this date stakeholders, both internal and
external, were uncomfortable to use data from this office that is now a data source of choice as confirmed
by hits on the website. The Office also played a key role in the preparation and implementation of the
2004-2009 and 2011-2016 strategic plans. Finally, the office has played a key role in the design and
implementation of an assessment process for student learning outcomes that has received commendations
from accreditors. OIRPA enables the University to effectively use the assessment outcomes that result
from university goals and objectives to engage in data-based decision-making. As a result, the University
uses assessment results to inform change and improve educational programs and services.
2011 UMES Strategic Planning Process
Following the review and approval of its revised mission in 2010, UMES set up a Strategic Plan Steering
Committee, co-chaired by Dr. Retia Walker (Executive Assistant to the President; Dr. Charles Williams,
Vice President for Academic Affairs; and Dr. Stanley Nyirenda, Director, Institutional Research,
Planning & Assessment in 2011. Since UMES is committed to shared governance, the Steering
Committee membership of 30 represented all divisions and operational units of UMES. Similarly, 16
Taskforces had campus-wide representation (see 2011-2016 Strategic Planning Committee Structure and
Strategic Planning Taskforces in the Appendix). The Steering Committee and its Taskforces reached out
to all stakeholders including the Board of Visitors (BOV), alumni, and the public for their input to the
process. Sources of planning information/data included Alumni Surveys, 2008 and 2011; SWOT
Analysis," 2011; Environmental Scan 2011; Exit Interviews/Surveys, 2009 and 2010; and National
Survey of Student Engagement (NSSE), 2009 and 2010.
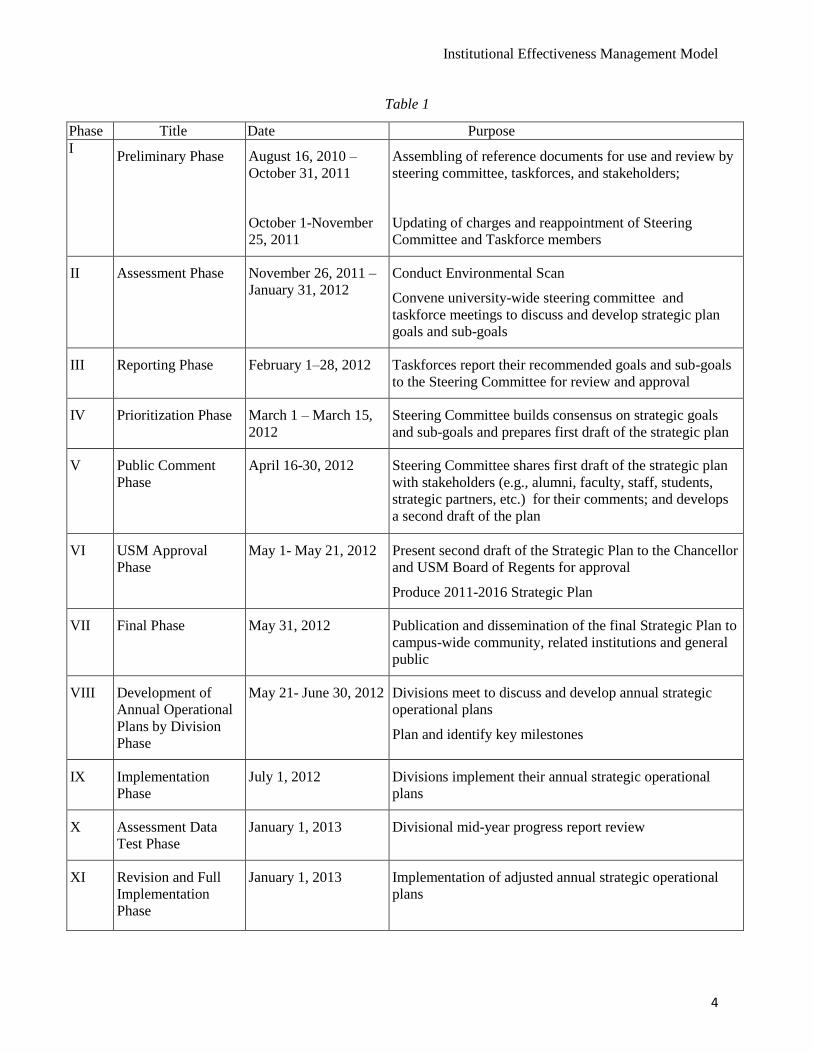
By the end of AY 2011-2012, the planning process was fully developed into 11 phases of planning (Table
1). The format for annual strategic operational plans has been updated to facilitate the design of SMART
operational objectives, baseline, and target outcomes, action steps, and responsible persons. In addition,
modifications have been made for tracking progress and to provide opportunity to make changes in
strategies in the future, especially for continuing objectives, based on lessons learned. The UMES
Strategic Planning Timeline is comprehensive in defining all aspects of the planning process
from pre-planning activities to cross-campus participation and dissemination of planning outcomes to
all · stakeholders. The planning timeline is presented in Table 1 and consists of eleven (11) phases. The
enhanced process has continued to improve planning and has created opportunities for all divisions and
operational units of the University to use assessment outcomes to inform change. By beginning the
planning process with appropriate use of planning documents that present past outcomes, taskforces were
able to move forward with more informed discussion and better understanding to arrive at reasonable and
achievable goals and objectives that improve and support the University's mission and values.
During AY '10-'11, new five-year goals were defined based upon completion of the revised planning
approach and increased cross-campus participation. With these practices in place, the University benefits
from an enhanced process that links planning to decision-making, enrollment management, and
budget/resource allocation.
Institutional Effectiveness Management Model
4
Table 1
Phase Title Date Purpose
I Preliminary Phase August 16, 2010 –
October 31, 2011
October 1-November
25, 2011
Assembling of reference documents for use and review by
steering committee, taskforces, and stakeholders;
Updating of charges and reappointment of Steering
Committee and Taskforce members
II Assessment Phase November 26, 2011 –
January 31, 2012
Conduct Environmental Scan
Convene university-wide steering committee and
taskforce meetings to discuss and develop strategic plan
goals and sub-goals
III Reporting Phase February 1–28, 2012 Taskforces report their recommended goals and sub-goals
to the Steering Committee for review and approval
IV Prioritization Phase March 1 – March 15,
2012
Steering Committee builds consensus on strategic goals
and sub-goals and prepares first draft of the strategic plan
V Public Comment
Phase
April 16-30, 2012 Steering Committee shares first draft of the strategic plan
with stakeholders (e.g., alumni, faculty, staff, students,
strategic partners, etc.) for their comments; and develops
a second draft of the plan
VI USM Approval
Phase
May 1- May 21, 2012 Present second draft of the Strategic Plan to the Chancellor
and USM Board of Regents for approval
Produce 2011-2016 Strategic Plan
VII Final Phase May 31, 2012 Publication and dissemination of the final Strategic Plan to
campus-wide community, related institutions and general
public
VIII Development of
Annual Operational
Plans by Division
Phase
May 21- June 30, 2012 Divisions meet to discuss and develop annual strategic
operational plans
Plan and identify key milestones
IX Implementation
Phase
July 1, 2012 Divisions implement their annual strategic operational
plans
X Assessment Data
Test Phase
January 1, 2013 Divisional mid-year progress report review
XI Revision and Full
Implementation
Phase
January 1, 2013 Implementation of adjusted annual strategic operational
plans
Institutional Effectiveness Management Model
5
The Plan in Action: Strategic and Operations Plan Manual
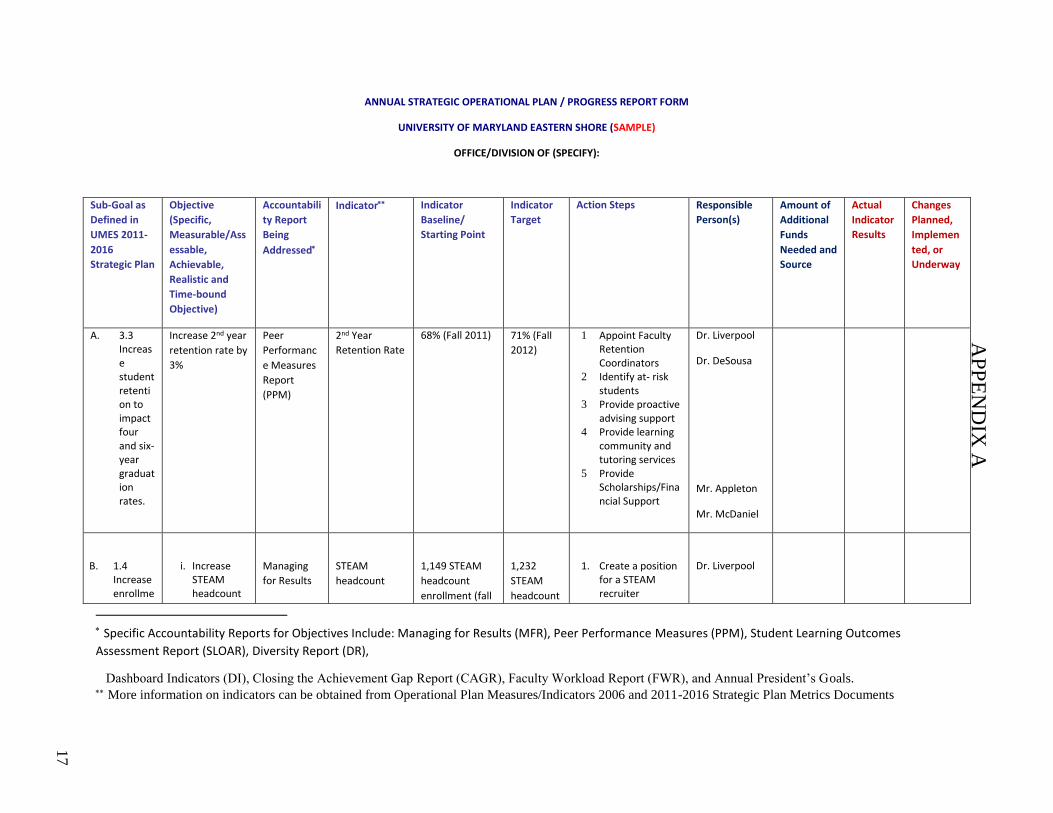
In addition to the new organizational structure for planning, a new annual strategic operational plan form
was introduced, the Annual Strategic Operational Plan/ Progress Form. The form is used by divisions and
operational units to clearly articulate the SMART (Specific, Measureable Achievable Realistic and Time-
bound) objective that will be implemented by a division/operational unit in a given year. Such an
objective must be aligned with a specific UMES goal/sub-goal and it must clearly identify specific
University System of Maryland or Maryland Higher Education Commission accountability report it
addresses. It also provides for baseline and outcome target it hopes to achieve at the end of the year. In
addition, the form requires the identification of key person(s) responsible to ensure effective
implementation and monitoring at the division or operational unit level and, if intended outcomes are not
realized, it provides for the specification of changes in strategies/action steps. In summary, the Form is
designed to enable division/operational unit planners to think carefully about the evaluation/assessment
tools that will be necessary in order to track and monitor outcomes, and the key milestones necessary for
successful achievement of the objective. Key performance indicators from a variety of accountability
reports are used to track progress, and the change process implemented as a result of outcomes (see
examples in the Appendix).
University progress depends upon the success of its accountability practices; therefore, strategic planning,
assessment and evaluation are important to measuring an institution's success. The current planning
process ensures that a systematic process is used to engage in ongoing, dynamic and comprehensive
assessment of the UMES Annual Strategic Operational Plan. The system ensures that goals are carefully
tracked and that reports are regularly disseminated to assist faculty, students and administrators in using
data-based decision-making to map progress. A compilation of objectives across the six divisions and
operational units is carefully reviewed by the Strategic Plan and Assessment Review Committee
(SPARC) and disseminated to the University community.
The current Strategic Plan for the period 2011-2016 has benefited from the strategic thinking that
recognizes the importance of involving the implementers of the process and those that will be impacted
by the change. Improvements have also been made in the development of measurable objectives to
facilitate the monitoring of operational plans by divisions/plan units. In the sections that follow, the
methodology, the process for assessing institutional effectiveness, its implementation, and use of results
for the continuous improvement of programs, operations and/or supporting services by various
divisions/departments/units of the University are considered.
THE MODEL DEFINED
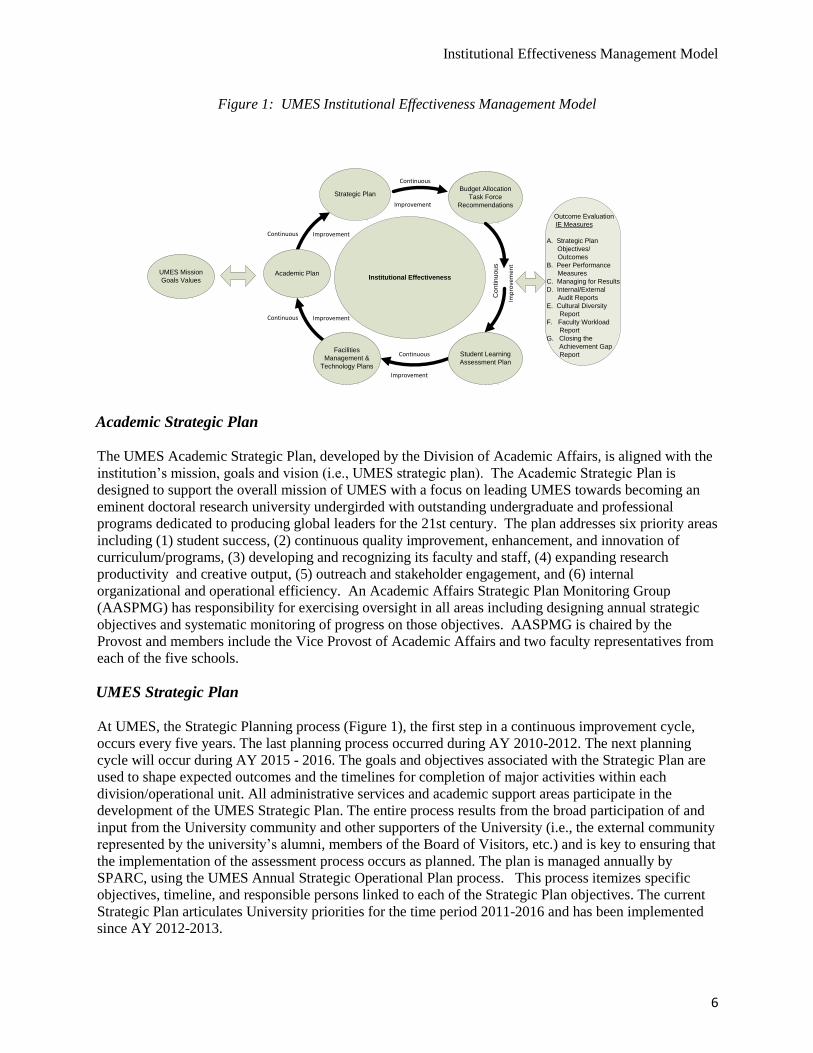
Institutional Effectiveness Process
The process used by UMES to assess institutional effectiveness and all of its administrative services and
academic support areas is the Institutional Effectiveness Management Model (Figure 1). This process
identifies the University's Mission, goals and values as driving forces for all planning and evaluation
activities. Considered in a continuous cycle of planning and evaluation, the model considers five key
components: Academic Plan, Strategic Planning, Budget Allocation Task Force recommendations,
Student Learning Assessment Planning, and Facilities Management and Technology Planning.
Institutional Effectiveness Management Model
6
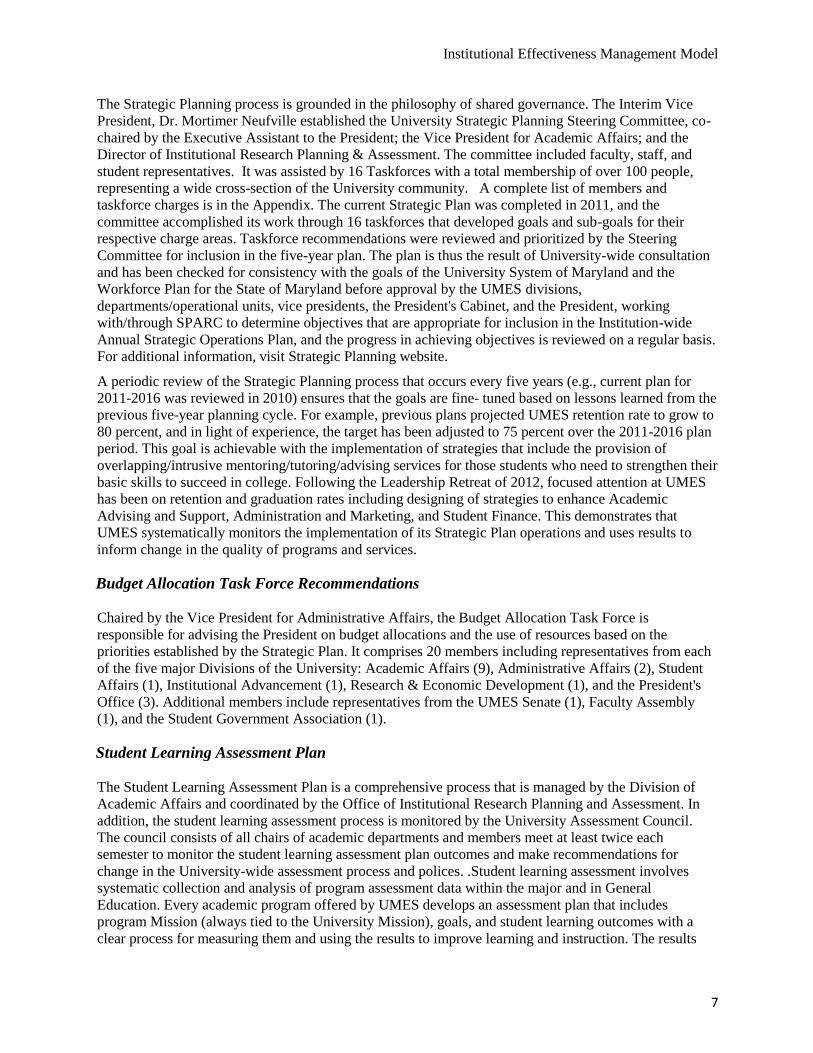
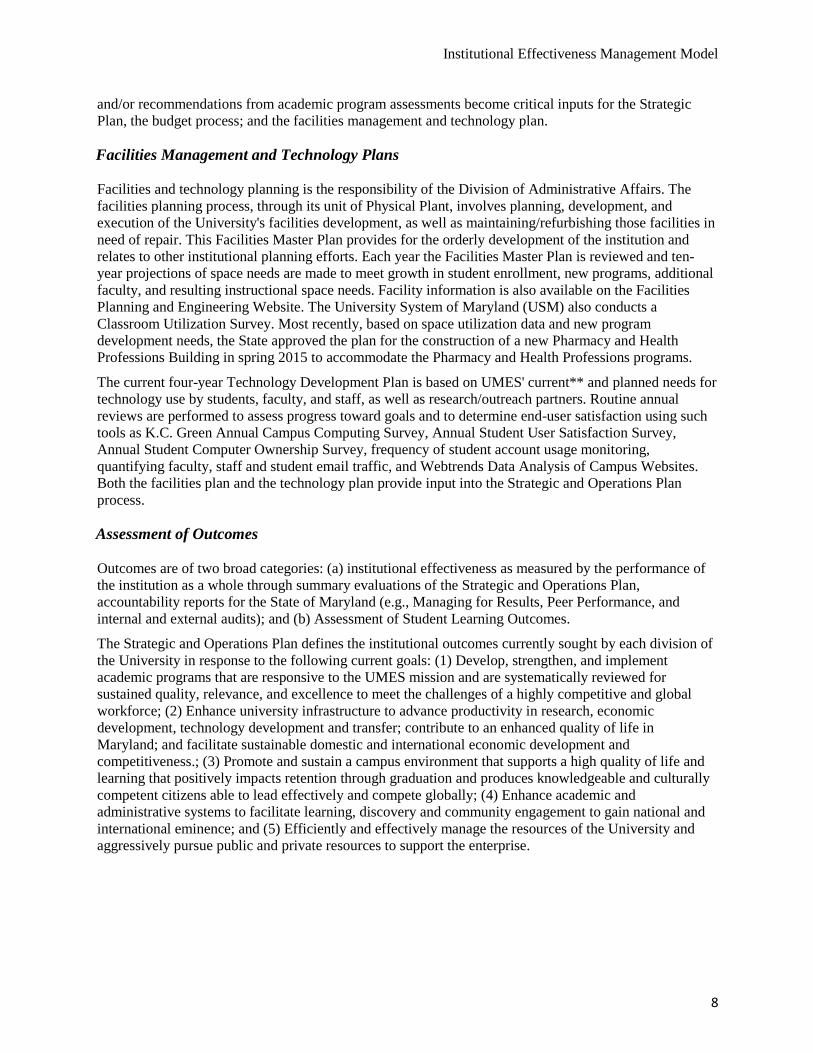
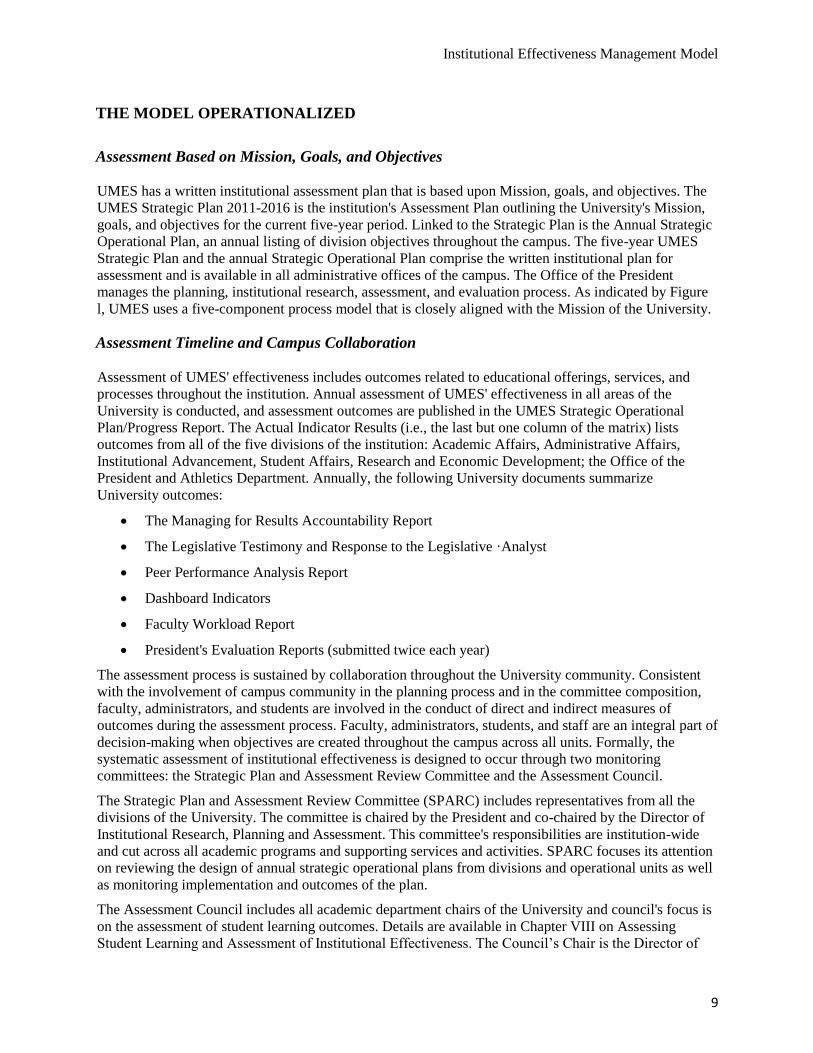
Figure 1: UMES Institutional Effectiveness Management Model
Continuous
Continuous
Improvement
Improvement
Imp
rove
me
nt
Institutional Effectiveness
Strategic Plan
C
on
tin
uo
us
Budget Allocation
Task Force
Recommendations
Facilities
Management &
Technology Plans
Student Learning
Assessment Plan
UMES Mission
Goals Values
Outcome Evaluation
IE Measures
A. Strategic Plan
Objectives/
Outcomes
B. Peer Performance
Measures
C. Managing for Results
D. Internal/External
Audit Reports
E. Cultural Diversity
Report
F. Faculty Workload
Report
G. Closing the
Achievement Gap
Report
Academic Plan
Continuous Improvement
ImprovementContinuous
Academic Strategic Plan
The UMES Academic Strategic Plan, developed by the Division of Academic Affairs, is aligned with the
institution’s mission, goals and vision (i.e., UMES strategic plan). The Academic Strategic Plan is
designed to support the overall mission of UMES with a focus on leading UMES towards becoming an
eminent doctoral research university undergirded with outstanding undergraduate and professional
programs dedicated to producing global leaders for the 21st century. The plan addresses six priority areas
including (1) student success, (2) continuous quality improvement, enhancement, and innovation of
curriculum/programs, (3) developing and recognizing its faculty and staff, (4) expanding research
productivity and creative output, (5) outreach and stakeholder engagement, and (6) internal
organizational and operational efficiency. An Academic Affairs Strategic Plan Monitoring Group
(AASPMG) has responsibility for exercising oversight in all areas including designing annual strategic
objectives and systematic monitoring of progress on those objectives. AASPMG is chaired by the
Provost and members include the Vice Provost of Academic Affairs and two faculty representatives from
each of the five schools.
UMES Strategic Plan
At UMES, the Strategic Planning process (Figure 1), the first step in a continuous improvement cycle,
occurs every five years. The last planning process occurred during AY 2010-2012. The next planning
cycle will occur during AY 2015 - 2016. The goals and objectives associated with the Strategic Plan are
used to shape expected outcomes and the timelines for completion of major activities within each
division/operational unit. All administrative services and academic support areas participate in the
development of the UMES Strategic Plan. The entire process results from the broad participation of and
input from the University community and other supporters of the University (i.e., the external community
represented by the university’s alumni, members of the Board of Visitors, etc.) and is key to ensuring that
the implementation of the assessment process occurs as planned. The plan is managed annually by
SPARC, using the UMES Annual Strategic Operational Plan process. This process itemizes specific
objectives, timeline, and responsible persons linked to each of the Strategic Plan objectives. The current
Strategic Plan articulates University priorities for the time period 2011-2016 and has been implemented
since AY 2012-2013.
Institutional Effectiveness Management Model
7
The Strategic Planning process is grounded in the philosophy of shared governance. The Interim Vice
President, Dr. Mortimer Neufville established the University Strategic Planning Steering Committee, co-
chaired by the Executive Assistant to the President; the Vice President for Academic Affairs; and the
Director of Institutional Research Planning & Assessment. The committee included faculty, staff, and
student representatives. It was assisted by 16 Taskforces with a total membership of over 100 people,
representing a wide cross-section of the University community. A complete list of members and
taskforce charges is in the Appendix. The current Strategic Plan was completed in 2011, and the
committee accomplished its work through 16 taskforces that developed goals and sub-goals for their
respective charge areas. Taskforce recommendations were reviewed and prioritized by the Steering
Committee for inclusion in the five-year plan. The plan is thus the result of University-wide consultation
and has been checked for consistency with the goals of the University System of Maryland and the
Workforce Plan for the State of Maryland before approval by the UMES divisions,
departments/operational units, vice presidents, the President's Cabinet, and the President, working
with/through SPARC to determine objectives that are appropriate for inclusion in the Institution-wide
Annual Strategic Operations Plan, and the progress in achieving objectives is reviewed on a regular basis.
For additional information, visit Strategic Planning website.
A periodic review of the Strategic Planning process that occurs every five years (e.g., current plan for
2011-2016 was reviewed in 2010) ensures that the goals are fine tuned based on lessons learned from the
previous five-year planning cycle. For example, previous plans projected UMES retention rate to grow to
80 percent, and in light of experience, the target has been adjusted to 75 percent over the 2011-2016 plan
period. This goal is achievable with the implementation of strategies that include the provision of
overlapping/intrusive mentoring/tutoring/advising services for those students who need to strengthen their
basic skills to succeed in college. Following the Leadership Retreat of 2012, focused attention at UMES
has been on retention and graduation rates including designing of strategies to enhance Academic
Advising and Support, Administration and Marketing, and Student Finance. This demonstrates that
UMES systematically monitors the implementation of its Strategic Plan operations and uses results to
inform change in the quality of programs and services.
Budget Allocation Task Force Recommendations
Chaired by the Vice President for Administrative Affairs, the Budget Allocation Task Force is
responsible for advising the President on budget allocations and the use of resources based on the
priorities established by the Strategic Plan. It comprises 20 members including representatives from each
of the five major Divisions of the University: Academic Affairs (9), Administrative Affairs (2), Student
Affairs (1), Institutional Advancement (1), Research & Economic Development (1), and the President's
Office (3). Additional members include representatives from the UMES Senate (1), Faculty Assembly
(1), and the Student Government Association (1).
Student Learning Assessment Plan
The Student Learning Assessment Plan is a comprehensive process that is managed by the Division of
Academic Affairs and coordinated by the Office of Institutional Research Planning and Assessment. In
addition, the student learning assessment process is monitored by the University Assessment Council.
The council consists of all chairs of academic departments and members meet at least twice each
semester to monitor the student learning assessment plan outcomes and make recommendations for
change in the University-wide assessment process and polices. .Student learning assessment involves
systematic collection and analysis of program assessment data within the major and in General
Education. Every academic program offered by UMES develops an assessment plan that includes
program Mission (always tied to the University Mission), goals, and student learning outcomes with a
clear process for measuring them and using the results to improve learning and instruction. The results
Institutional Effectiveness Management Model
8
and/or recommendations from academic program assessments become critical inputs for the Strategic
Plan, the budget process; and the facilities management and technology plan.
Facilities Management and Technology Plans
Facilities and technology planning is the responsibility of the Division of Administrative Affairs. The
facilities planning process, through its unit of Physical Plant, involves planning, development, and
execution of the University's facilities development, as well as maintaining/refurbishing those facilities in
need of repair. This Facilities Master Plan provides for the orderly development of the institution and
relates to other institutional planning efforts. Each year the Facilities Master Plan is reviewed and ten
year projections of space needs are made to meet growth in student enrollment, new programs, additional
faculty, and resulting instructional space needs. Facility information is also available on the Facilities
Planning and Engineering Website. The University System of Maryland (USM) also conducts a
Classroom Utilization Survey. Most recently, based on space utilization data and new program
development needs, the State approved the plan for the construction of a new Pharmacy and Health
Professions Building in spring 2015 to accommodate the Pharmacy and Health Professions programs.
The current four-year Technology Development Plan is based on UMES' current** and planned needs for
technology use by students, faculty, and staff, as well as research/outreach partners. Routine annual
reviews are performed to assess progress toward goals and to determine end-user satisfaction using such
tools as K.C. Green Annual Campus Computing Survey, Annual Student User Satisfaction Survey,
Annual Student Computer Ownership Survey, frequency of student account usage monitoring,
quantifying faculty, staff and student email traffic, and Webtrends Data Analysis of Campus Websites.
Both the facilities plan and the technology plan provide input into the Strategic and Operations Plan
process.
Assessment of Outcomes
Outcomes are of two broad categories: (a) institutional effectiveness as measured by the performance of
the institution as a whole through summary evaluations of the Strategic and Operations Plan,
accountability reports for the State of Maryland (e.g., Managing for Results, Peer Performance, and
internal and external audits); and (b) Assessment of Student Learning Outcomes.
The Strategic and Operations Plan defines the institutional outcomes currently sought by each division of
the University in response to the following current goals: (1) Develop, strengthen, and implement
academic programs that are responsive to the UMES mission and are systematically reviewed for
sustained quality, relevance, and excellence to meet the challenges of a highly competitive and global
workforce; (2) Enhance university infrastructure to advance productivity in research, economic
development, technology development and transfer; contribute to an enhanced quality of life in
Maryland; and facilitate sustainable domestic and international economic development and
competitiveness.; (3) Promote and sustain a campus environment that supports a high quality of life and
learning that positively impacts retention through graduation and produces knowledgeable and culturally
competent citizens able to lead effectively and compete globally; (4) Enhance academic and
administrative systems to facilitate learning, discovery and community engagement to gain national and
international eminence; and (5) Efficiently and effectively manage the resources of the University and
aggressively pursue public and private resources to support the enterprise.
Institutional Effectiveness Management Model
9
THE MODEL OPERATIONALIZED
Assessment Based on Mission, Goals, and Objectives
UMES has a written institutional assessment plan that is based upon Mission, goals, and objectives. The
UMES Strategic Plan 2011-2016 is the institution's Assessment Plan outlining the University's Mission,
goals, and objectives for the current five-year period. Linked to the Strategic Plan is the Annual Strategic
Operational Plan, an annual listing of division objectives throughout the campus. The five-year UMES
Strategic Plan and the annual Strategic Operational Plan comprise the written institutional plan for
assessment and is available in all administrative offices of the campus. The Office of the President
manages the planning, institutional research, assessment, and evaluation process. As indicated by Figure
l, UMES uses a five-component process model that is closely aligned with the Mission of the University.
Assessment Timeline and Campus Collaboration
Assessment of UMES' effectiveness includes outcomes related to educational offerings, services, and
processes throughout the institution. Annual assessment of UMES' effectiveness in all areas of the
University is conducted, and assessment outcomes are published in the UMES Strategic Operational
Plan/Progress Report. The Actual Indicator Results (i.e., the last but one column of the matrix) lists
outcomes from all of the five divisions of the institution: Academic Affairs, Administrative Affairs,
Institutional Advancement, Student Affairs, Research and Economic Development; the Office of the
President and Athletics Department. Annually, the following University documents summarize
University outcomes:
The Managing for Results Accountability Report
The Legislative Testimony and Response to the Legislative ·Analyst
Peer Performance Analysis Report
Dashboard Indicators
Faculty Workload Report
President's Evaluation Reports (submitted twice each year)
The assessment process is sustained by collaboration throughout the University community. Consistent
with the involvement of campus community in the planning process and in the committee composition,
faculty, administrators, and students are involved in the conduct of direct and indirect measures of
outcomes during the assessment process. Faculty, administrators, students, and staff are an integral part of
decision-making when objectives are created throughout the campus across all units. Formally, the
systematic assessment of institutional effectiveness is designed to occur through two monitoring
committees: the Strategic Plan and Assessment Review Committee and the Assessment Council.
The Strategic Plan and Assessment Review Committee (SPARC) includes representatives from all the
divisions of the University. The committee is chaired by the President and co-chaired by the Director of
Institutional Research, Planning and Assessment. This committee's responsibilities are institution-wide
and cut across all academic programs and supporting services and activities. SPARC focuses its attention
on reviewing the design of annual strategic operational plans from divisions and operational units as well
as monitoring implementation and outcomes of the plan.
The Assessment Council includes all academic department chairs of the University and council's focus is
on the assessment of student learning outcomes. Details are available in Chapter VIII on Assessing
Student Learning and Assessment of Institutional Effectiveness. The Council’s Chair is the Director of
Institutional Effectiveness Management Model
10
Institutional Research, Planning and Assessment, and the Co-Chair is the Vice Provost for Academic
Affairs. Both the Strategic Plan and Annual Strategic Operational Plan and Student Learning Outcomes
Plan Assessment processes are a clear manifestation of shared governance since they reflect shared
values, understanding, opinions, and interests of the entire institution.
Assessment and Data Management
The Assessment Plan uses qualitative and quantitative measures to describe and interpret assessment
outcomes in all Divisions. The use of such measures is systematized through the development of the
Annual Strategic Operational Plan. The Annual Strategic Operational Plan/Progress Report Form ensures
that each objective clearly identifies assessment measures, action steps, and anticipated outcomes. In
order for the institutional assessment process to be effective, both process and outcome measures are
important. The assessment plan uses a variety of quantitative and qualitative measures as presented in the
evaluation outcomes component of Figure 1. First, every division/department/reporting unit reports its
accomplishments and/or progress on objectives listed in the Annual Strategic Operational Plan in June of
each year. UMES' performance is measured against its peers at both state and national levels. The
University's peers were selected based on the institution's size, program mix, and budget resources.
Examples of the effective use of existing data and information for institutional planning, resource
allocation, and renewal include the Managing for Results (MFR) Accountability Report, the Student
Satisfaction Survey, and the Organizational Climate Survey.
The MFR Report is an accountability report mandated by the State of Maryland and includes indicators
determined by the University System of Maryland and UMES. There is an overlap of indicators between
the Peer Performance Measures and the MFR reports. For example, both reports track retention and
graduation rates as well as pass rates in teacher certification exams. In addition, the MFR is a planning
tool, and, as such, it is reviewed every five years. It also provides two-year projections of data for the
indicators during each reporting cycle. In addition, the MFR includes the efficiency goal of efficiently
and effectively managing University resources and pursuing public/private funds to support the
enterprise. One objective for this goal is increasing the endowment fund from $11 million in 2004 to
$15 million in 2009 (see MFR 2009). Another objective under this goal is to maintain a minimum of one
percent efficiency on operating budget savings through 2016 that has been maintained (see MFR 2014).
Both Managing for Results (MFR) and Peer Performance Measures (PPM) reports track retention and
graduation rates. The MFR provides five years of data including two years of projected data. The PPM
provides cross-sectional data that facilitate a comparative performance analysis with peer institutions.
Based on PPM reports the number of full-time faculty with terminal degrees increased from 64% in 2008
to 77% in 2013 and was higher than the average for its 10 peers while it was lower than the average for
its peers (75%) in 2008. Also UMES’ average annual % growth in Federal Research & Development
Expenditure declined by 5.9% in 2008 but grew by 23.2% in 2013, compared to 17.3% average annual
growth for its 10 peers.
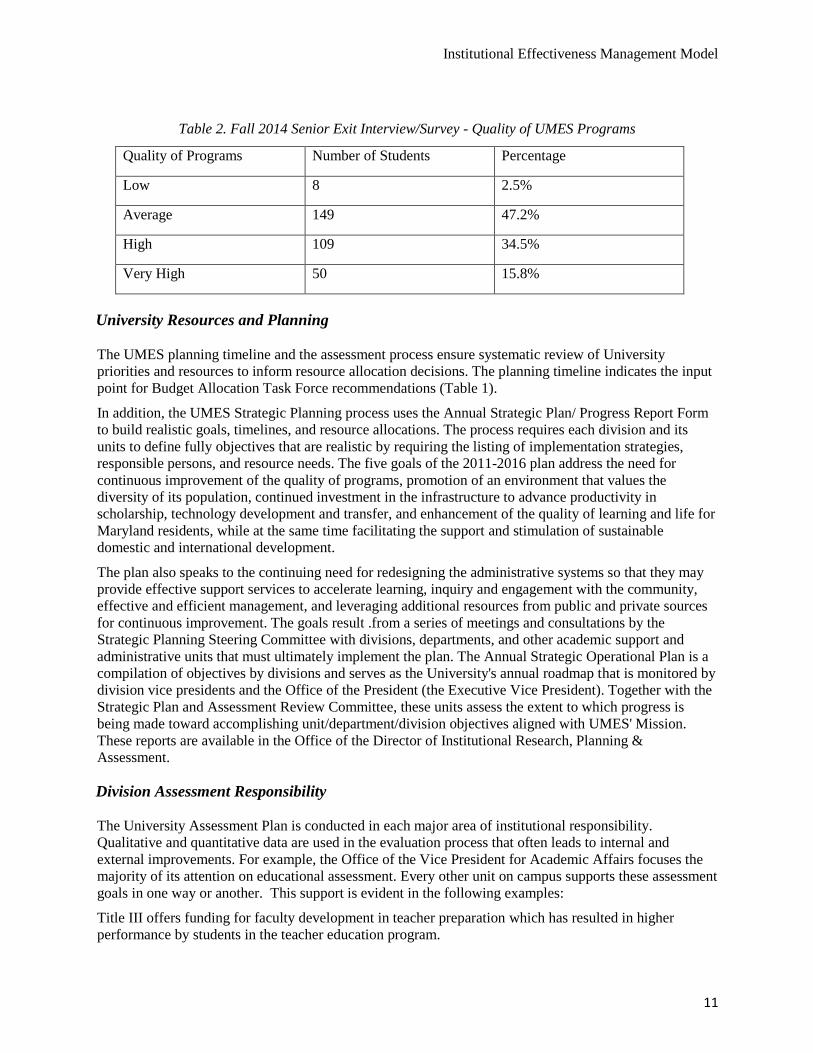
Surveys, such as the Senior Exit Interview/Survey (Table 2) and the Organizational Climate Survey of
faculty and staff, provide indirect measures of students' perceptions of programs and supporting services,
as well as faculty and staff opinions concerning the environment in which they work. These surveys
provide critical feedback from the University's "clients" for supporting its initiatives for continuous
improvement.
Institutional Effectiveness Management Model
11
Table 2. Fall 2014 Senior Exit Interview/Survey - Quality of UMES Programs
Quality of Programs Number of Students Percentage
Low 8 2.5%
Average 149 47.2%
High 109 34.5%
Very High 50 15.8%
University Resources and Planning
The UMES planning timeline and the assessment process ensure systematic review of University
priorities and resources to inform resource allocation decisions. The planning timeline indicates the input
point for Budget Allocation Task Force recommendations (Table 1).
In addition, the UMES Strategic Planning process uses the Annual Strategic Plan/ Progress Report Form
to build realistic goals, timelines, and resource allocations. The process requires each division and its
units to define fully objectives that are realistic by requiring the listing of implementation strategies,
responsible persons, and resource needs. The five goals of the 2011-2016 plan address the need for
continuous improvement of the quality of programs, promotion of an environment that values the
diversity of its population, continued investment in the infrastructure to advance productivity in
scholarship, technology development and transfer, and enhancement of the quality of learning and life for
Maryland residents, while at the same time facilitating the support and stimulation of sustainable
domestic and international development.
The plan also speaks to the continuing need for redesigning the administrative systems so that they may
provide effective support services to accelerate learning, inquiry and engagement with the community,
effective and efficient management, and leveraging additional resources from public and private sources
for continuous improvement. The goals result .from a series of meetings and consultations by the
Strategic Planning Steering Committee with divisions, departments, and other academic support and
administrative units that must ultimately implement the plan. The Annual Strategic Operational Plan is a
compilation of objectives by divisions and serves as the University's annual roadmap that is monitored by
division vice presidents and the Office of the President (the Executive Vice President). Together with the
Strategic Plan and Assessment Review Committee, these units assess the extent to which progress is
being made toward accomplishing unit/department/division objectives aligned with UMES' Mission.
These reports are available in the Office of the Director of Institutional Research, Planning &
Assessment.
Division Assessment Responsibility
The University Assessment Plan is conducted in each major area of institutional responsibility.
Qualitative and quantitative data are used in the evaluation process that often leads to internal and
external improvements. For example, the Office of the Vice President for Academic Affairs focuses the
majority of its attention on educational assessment. Every other unit on campus supports these assessment
goals in one way or another. This support is evident in the following examples:
Title III offers funding for faculty development in teacher preparation which has resulted in higher
performance by students in the teacher education program.
Institutional Effectiveness Management Model
12
The Office of Institutional Research, Planning & Assessment administers and provides analysis on
student evaluation of instruction on behalf of the Office of Academic Affairs. This information is used by
academic departments to improve their service delivery of instruction (e.g., redesign of course syllabi,
curriculum revision, and faculty development initiatives).
The Office of Academic Computing monitors computer lab use and acquisition of student/faculty
computers according to the Technology Plan. The result has ben the acquisition of additional computers.
As a result of assessment, the Division of Student Affairs implemented a new enrollment process,
Enrollment 101, it continues to use to assist advising and increasing opportunities for new students to
adjust to the registration and course selection process.
The Division of Institutional Advancement continues to assist with needs assessment in collaboration
with the Office of Financial Aid for the distribution of student need-based scholarships to students who
experience a financial aid and tuition gap in funding.
Ultimately, all units of the University engage in ongoing assessment in order to support academic
programs and student success.
Periodic Assessment Plan Review
The University Strategic Plan is assessed annually at two levels: at the University level and the division
level by both external and internal constituencies. At the University level, internal and external reviews
occur prior to the beginning of a new five year planning cycle. This ensures that lessons learned in
designing the previous cycle are utilized to improve the design of the new cycle. A major lesson learned
from the previous Strategic Planning initiatives was that by using a top-down systems approach to
planning, the University was not using fully one of its most important resources - its human resources,
thus, bringing about a more participatory interactive approach.
The University's 2011-2016 Strategic Plan embraced the principle of shared governance and included
University-wide representation on its Strategic Planning Steering Committee. In addition, taskforces were
created to broaden representation even further. This participatory process ensures shared understanding
and shared ownership of the planning process and, it is hoped, has galvanized the commitment of
different stakeholders that will ultimately implement the plan goals and objectives. In addition,
assessment of the Plan is monitored and reviewed by the Office of the President, President's Cabinet, the
Strategic Plan and Assessment Review Committee, UMES Assessment Council, and provided technical
support by the Office of Institutional Research, Planning and Assessment.
At the operational level, the Plan objectives are reviewed by internal and external agencies at regular
intervals to ensure ·that they continue to measure meaningfully the important outcomes of the plan.
Externally, both State and federal reviews are conducted to · monitor University effectiveness. For
example, at the State level, the Managing for Results (MFR) indicators are reviewed every five years.
Those measures that provide less compelling evidence for progress are reviewed for relevance and
possibly replaced. One such review by the University System of Maryland (USM) and the Maryland
Higher Education Commission (MHEC) occurred in 2010, and this review led to a change in the in
university objectives to include Science, Technology, Engineering and Mathematics (STEM) degree
awards. Internally, as an additional example of individual division review, the externally funded,
Title III Program requires all activity directors to submit quarterly progress reports and annual reports
and document any changes in strategies for accomplishing the objectives of their projects.
Institutional Effectiveness Management Model
13
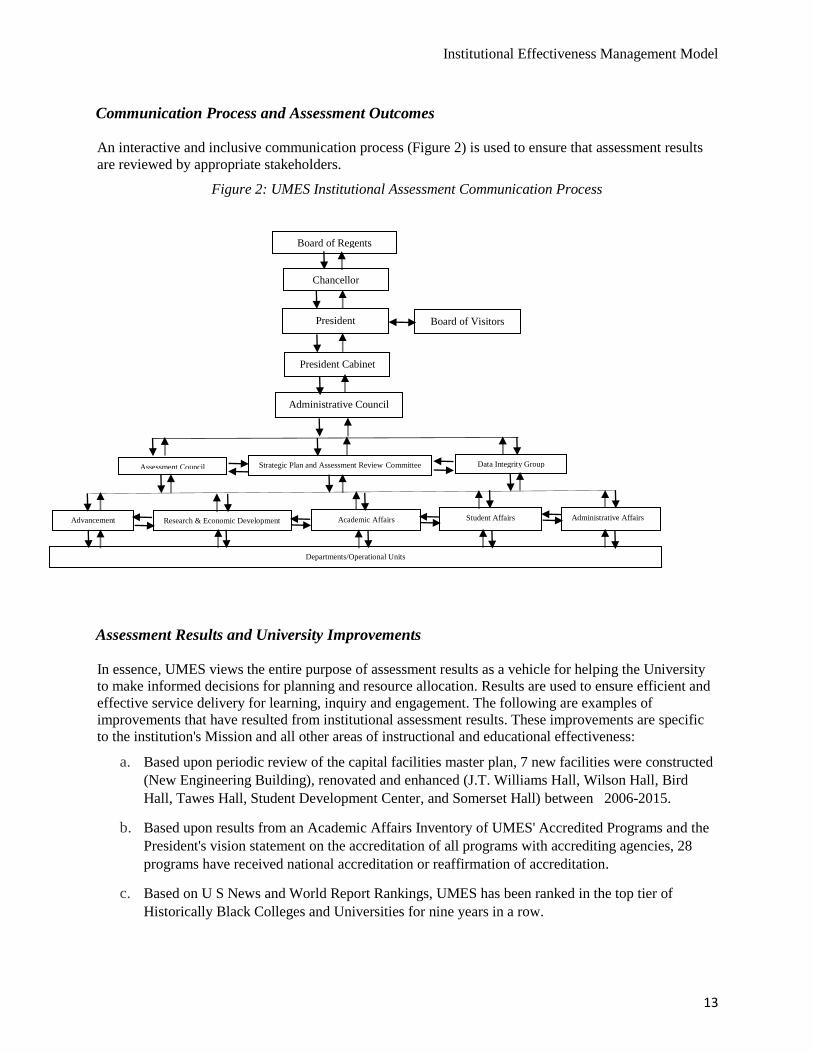
Communication Process and Assessment Outcomes
An interactive and inclusive communication process (Figure 2) is used to ensure that assessment results
are reviewed by appropriate stakeholders.
Figure 2: UMES Institutional Assessment Communication Process
Assessment Results and University Improvements
In essence, UMES views the entire purpose of assessment results as a vehicle for helping the University
to make informed decisions for planning and resource allocation. Results are used to ensure efficient and
effective service delivery for learning, inquiry and engagement. The following are examples of
improvements that have resulted from institutional assessment results. These improvements are specific
to the institution's Mission and all other areas of instructional and educational effectiveness:
a. Based upon periodic review of the capital facilities master plan, 7 new facilities were constructed
(New Engineering Building), renovated and enhanced (J.T. Williams Hall, Wilson Hall, Bird
Hall, Tawes Hall, Student Development Center, and Somerset Hall) between 2006-2015.
b. Based upon results from an Academic Affairs Inventory of UMES' Accredited Programs and the
President's vision statement on the accreditation of all programs with accrediting agencies, 28
programs have received national accreditation or reaffirmation of accreditation.
c. Based on U S News and World Report Rankings, UMES has been ranked in the top tier of
Historically Black Colleges and Universities for nine years in a row.
Board of Regents
President
Chancellor
President Cabinet
Administrative Council
Board of Visitors
Data Integrity Group Assessment Council Strategic Plan and Assessment Review Committee
Advancement Research & Economic Development Academic Affairs Student Affairs Administrative Affairs
Departments/Operational Units
Institutional Effectiveness Management Model
14
d. Based on IPEDS data, UMES offered institutional grants to a significantly larger percentage of
undergraduate students than its ten peers for three years (i.e., 27% [AY 2009-10)], 30%[AY
2010-11], and 43% [2012-2013], compared to 25%, 20%, and 31% for the average of its ten
peers, respectively, indicating its commitment to supporting its students.
e. Based on the 2014 Faculty Workload Report, UMES raised the highest amount ($17.6 million) in
grants and contracts compared to six other comprehensive universities of the University System
of Maryland. The second highest was Towson University ($14.4 million), and the lowest was
Frostburg State University ($3.6 million).
f. Based on the National Science Foundation Research and Development (R&D) Expenditures
Report, UMES’ R&D expenditures have increased from $4.1 million in FY 2008 to $8.7 million
in FY 2013, confirming UMES’ increased research productivity.
g. Based on Facts and Figures, UMES’ bachelor’s degree awards have increased from 448 in AY
2007-2008 to 585 in AY 2013-2014, confirming UMES’ significant contribution to Maryland’s
goal of 55% of Marylander’s having a college degree by 2025. In addition, UMES’ awards of
research/scholarship degrees have increased from 7 in AY 2008-2009 to 27 in AY 2011-2012 and
holding steady at 20 in 2013-2014, and thus meeting the threshold for obtaining the Doctoral
Research University Carnegie Classification. UMES is currently classified as Master’s Small
Programs.
Resource Allocation and University Change
The University incorporates assessment results in decision-making for prioritizing activities and resource
allocation. The President's Cabinet and the Budget Allocation Task Force review the annual Strategic
Plan Summary of Outcomes Report and the Student Learning Outcomes Assessment Plan Report. These
reports document the status of each division's key objectives and resource needs. Appropriations for
future funding priorities are made based upon the following inputs: UMES Strategic Plan priorities,
operational expenditure requirements, and University System of Maryland priorities (including unfunded
mandates).
UMES has utilized results from assessments to improve the quality and effectiveness of its academic
programs and services. There are numerous examples of changes directly linked to the assessment
process. A few examples are listed below:
The Division of Academic Affairs has used assessment results pertaining to faculty workload as
measured by average course units taught by tenured and tenure track faculty. Although overall average
course units taught by this category of faculty fell within the expected standard of 7.50 to 8 course units
per academic year, the average course units for full-time tenured / tenure track faculty for Physician
Assistant for AY 2007-2008 was zero. This result was unacceptable to the professional accreditors and
led to the creation of 2 tenure track positions for Physician Assistant Program in AY 2010-2011.
A review of UMES trend data on retention and graduation rate outcomes in the Closing the Achievement
Gap, Managing for Results, Dashboard Indicators, and Peer Performance Measures reports, Integrated
Postsecondary Education Data System (IPEDS) and Senior Exit surveys, all provide analyses that
confirm the need for continuing to track these two indicators as a priority in the area of student success
(Table 3) across all divisions and operational areas.
Institutional Effectiveness Management Model
15
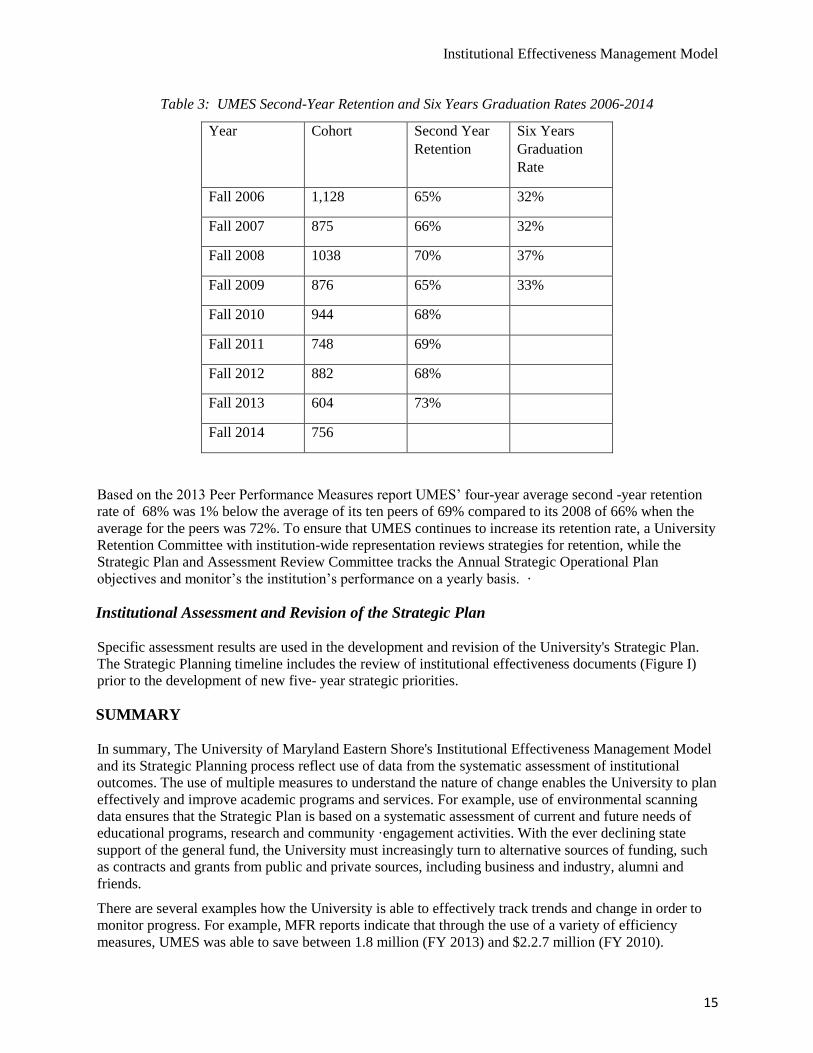
Table 3: UMES Second-Year Retention and Six Years Graduation Rates 2006-2014
Year Cohort Second Year
Retention
Six Years
Graduation
Rate
Fall 2006 1,128 65% 32%
Fall 2007 875 66% 32%
Fall 2008 1038 70% 37%
Fall 2009 876 65% 33%
Fall 2010 944 68%
Fall 2011 748 69%
Fall 2012 882 68%
Fall 2013 604 73%
Fall 2014 756
Based on the 2013 Peer Performance Measures report UMES’ four-year average second -year retention
rate of 68% was 1% below the average of its ten peers of 69% compared to its 2008 of 66% when the
average for the peers was 72%. To ensure that UMES continues to increase its retention rate, a University
Retention Committee with institution-wide representation reviews strategies for retention, while the
Strategic Plan and Assessment Review Committee tracks the Annual Strategic Operational Plan
objectives and monitor’s the institution’s performance on a yearly basis. ·
Institutional Assessment and Revision of the Strategic Plan
Specific assessment results are used in the development and revision of the University's Strategic Plan.
The Strategic Planning timeline includes the review of institutional effectiveness documents (Figure I)
prior to the development of new five year strategic priorities.
SUMMARY
In summary, The University of Maryland Eastern Shore's Institutional Effectiveness Management Model
and its Strategic Planning process reflect use of data from the systematic assessment of institutional
outcomes. The use of multiple measures to understand the nature of change enables the University to plan
effectively and improve academic programs and services. For example, use of environmental scanning
data ensures that the Strategic Plan is based on a systematic assessment of current and future needs of
educational programs, research and community ·engagement activities. With the ever declining state
support of the general fund, the University must increasingly turn to alternative sources of funding, such
as contracts and grants from public and private sources, including business and industry, alumni and
friends.
There are several examples how the University is able to effectively track trends and change in order to
monitor progress. For example, MFR reports indicate that through the use of a variety of efficiency
measures, UMES was able to save between 1.8 million (FY 2013) and $2.2.7 million (FY 2010).
Institutional Effectiveness Management Model
16
Therefore, not only is UMES diversifying its sources of funding but also utilizing efficiency measures
that extend the quality and quantity of services. Finally, the University's academic and professional
programs are designed to produce quality scholars and professionals by providing a strong academic
foundation for continuous improvement and success. UMES graduates (alumni) are successful in
academic, social, political, and other spheres of life. An assessment of follow-up surveys of UMES
alumni reveals that students have graduated to successful careers and to further graduate study. For
example Based on Title III Performance reports over 20% of bachelor’s degree graduates attend graduate
schools (i.e., 21.8% of AY 2008, and 25.5% of AY 2011 undergraduate degree recipients).
The UMES Institutional Effectiveness Management Model directs planning, assessment, evaluation,
resource allocation, use of outcomes, and change within the University. The model ties all activities to the
University Mission and ensures interaction among the President, executive leadership, faculty, staff,
students, and the University System of Maryland to monitor outcomes and progress. Using the model,
the University is able to identify expected outcomes, assess achievement of goals and objectives, and
provide evidence of improvement based on an analysis of results. Ultimately, UMES transition and
change is the direct result of Institutional Assessment
APPENDICES

17
AP
PE
ND
IX A
ANNUAL STRATEGIC OPERATIONAL PLAN / PROGRESS REPORT FORM
UNIVERSITY OF MARYLAND EASTERN SHORE (SAMPLE)
OFFICE/DIVISION OF (SPECIFY):
Specific Accountability Reports for Objectives Include: Managing for Results (MFR), Peer Performance Measures (PPM), Student Learning Outcomes
Assessment Report (SLOAR), Diversity Report (DR),
Dashboard Indicators (DI), Closing the Achievement Gap Report (CAGR), Faculty Workload Report (FWR), and Annual President’s Goals. More information on indicators can be obtained from Operational Plan Measures/Indicators 2006 and 2011-2016 Strategic Plan Metrics Documents
Sub-Goal as
Defined in
UMES 2011-
2016
Strategic Plan
Objective
(Specific,
Measurable/Ass
essable,
Achievable,
Realistic and
Time-bound
Objective)
Accountabili
ty Report
Being
Addressed
Indicator Indicator
Baseline/
Starting Point
Indicator
Target
Action Steps Responsible
Person(s)
Amount of
Additional
Funds
Needed and
Source
Actual
Indicator
Results
Changes
Planned,
Implemen
ted, or
Underway
A. 3.3 Increase student retention to impact four and six-year graduation rates.
Increase 2nd year
retention rate by
3%
Peer
Performanc
e Measures
Report
(PPM)
2nd Year
Retention Rate
68% (Fall 2011) 71% (Fall
2012)
1 Appoint Faculty Retention Coordinators
2 Identify at- risk students
3 Provide proactive advising support
4 Provide learning community and tutoring services
5 Provide Scholarships/Financial Support
Dr. Liverpool
Dr. DeSousa
Mr. Appleton
Mr. McDaniel
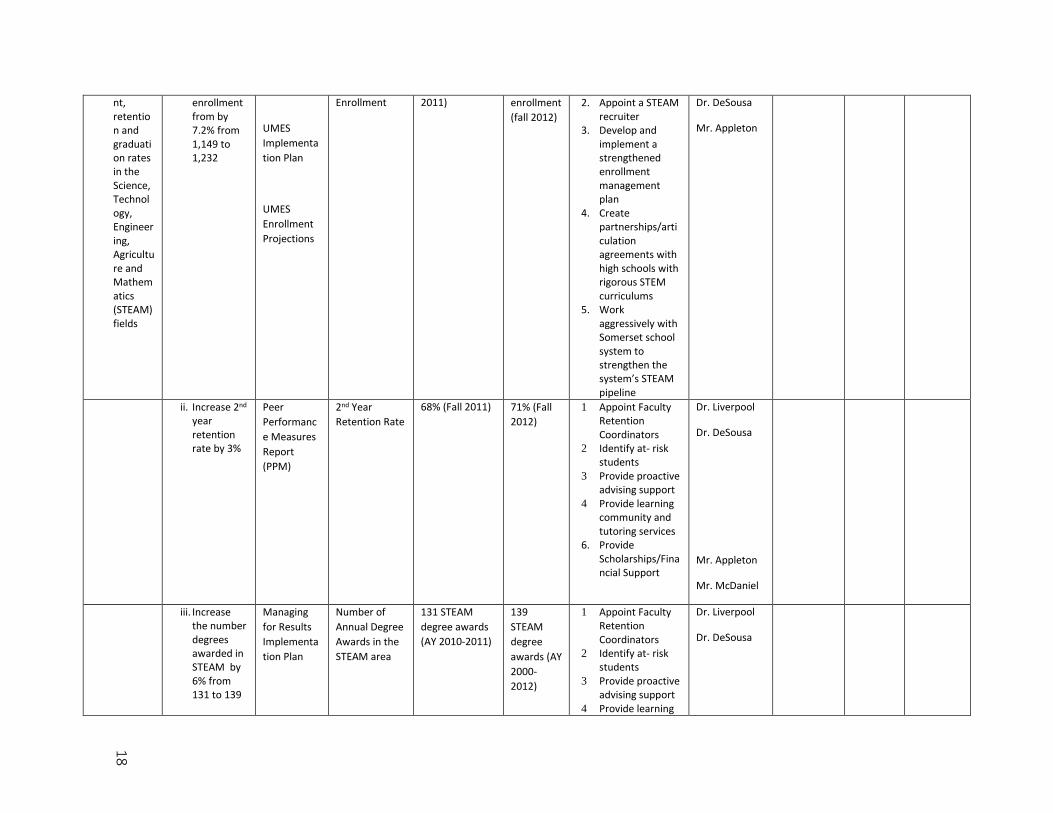
B. 1.4 Increase enrollme
i. Increase STEAM headcount
Managing
for Results
STEAM
headcount
1,149 STEAM
headcount
enrollment (fall
1,232
STEAM
headcount
1. Create a position for a STEAM recruiter
Dr. Liverpool
18
nt, retention and graduation rates in the Science, Technology, Engineering, Agriculture and Mathematics (STEAM) fields
enrollment from by 7.2% from 1,149 to 1,232
UMES
Implementa
tion Plan
UMES
Enrollment
Projections
Enrollment 2011) enrollment
(fall 2012)
2. Appoint a STEAM recruiter
3. Develop and implement a strengthened enrollment management plan
4. Create partnerships/articulation agreements with high schools with rigorous STEM curriculums
5. Work aggressively with Somerset school system to strengthen the system’s STEAM pipeline
Dr. DeSousa
Mr. Appleton
ii. Increase 2nd year retention rate by 3%
Peer
Performanc
e Measures
Report
(PPM)
2nd Year
Retention Rate
68% (Fall 2011) 71% (Fall
2012)
1 Appoint Faculty Retention Coordinators
2 Identify at- risk students
3 Provide proactive advising support
4 Provide learning community and tutoring services
6. Provide Scholarships/Financial Support
Dr. Liverpool
Dr. DeSousa
Mr. Appleton
Mr. McDaniel
iii. Increase the number degrees awarded in STEAM by 6% from 131 to 139
Managing
for Results
Implementa
tion Plan
Number of
Annual Degree
Awards in the
STEAM area
131 STEAM
degree awards
(AY 2010-2011)
139
STEAM
degree
awards (AY
2000-
2012)
1 Appoint Faculty Retention Coordinators
2 Identify at- risk students
3 Provide proactive advising support
4 Provide learning
Dr. Liverpool
Dr. DeSousa
19
community and tutoring services
5. Provide Scholarships/Financial Support
Mr. Appleton
Mr. McDaniel
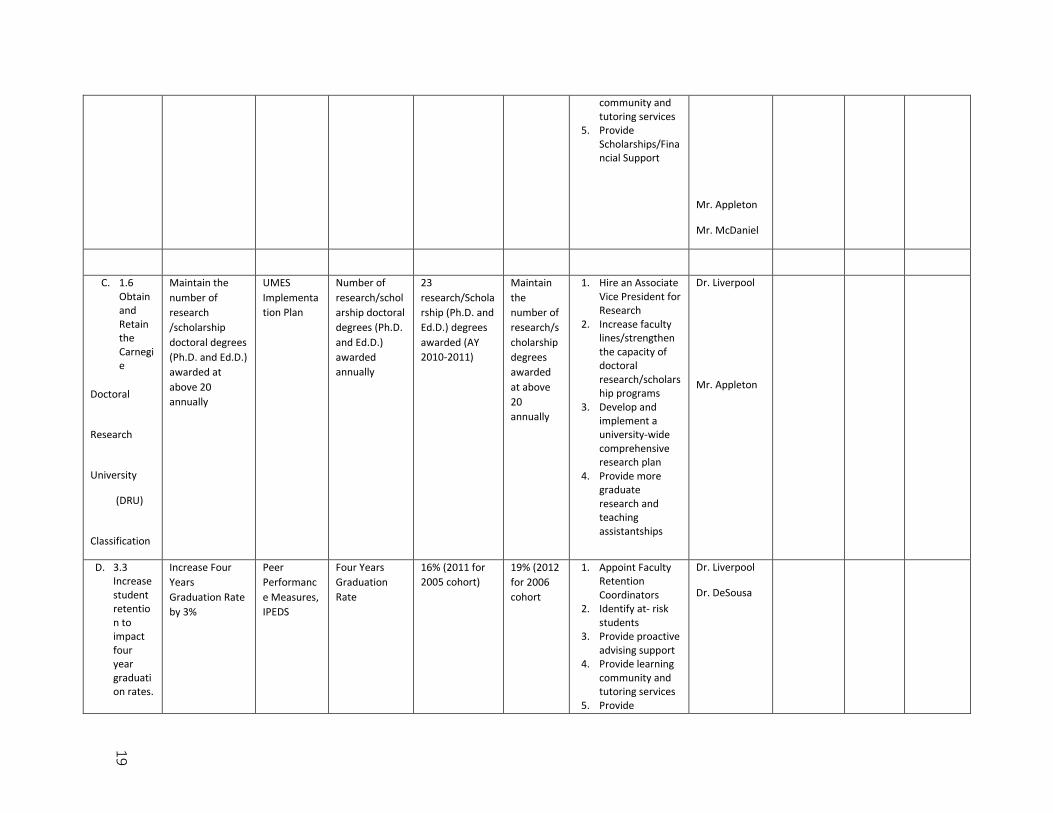
C. 1.6 Obtain and Retain the Carnegie
Doctoral
Research
University
(DRU)
Classification
Maintain the
number of
research
/scholarship
doctoral degrees
(Ph.D. and Ed.D.)
awarded at
above 20
annually
UMES
Implementa
tion Plan
Number of
research/schol
arship doctoral
degrees (Ph.D.
and Ed.D.)
awarded
annually
23
research/Schola
rship (Ph.D. and
Ed.D.) degrees
awarded (AY
2010-2011)
Maintain
the
number of
research/s
cholarship
degrees
awarded
at above
20
annually
1. Hire an Associate Vice President for Research
2. Increase faculty lines/strengthen the capacity of doctoral research/scholarship programs
3. Develop and implement a university-wide comprehensive research plan
4. Provide more graduate research and teaching assistantships
Dr. Liverpool
Mr. Appleton
D. 3.3 Increase student retention to impact four year graduation rates.
Increase Four
Years
Graduation Rate
by 3%
Peer
Performanc
e Measures,
IPEDS
Four Years
Graduation
Rate
16% (2011 for
2005 cohort)
19% (2012
for 2006
cohort
1. Appoint Faculty Retention Coordinators
2. Identify at- risk students
3. Provide proactive advising support
4. Provide learning community and tutoring services
5. Provide
Dr. Liverpool
Dr. DeSousa
20
Scholarships/Financial Support
Mr. Appleton
Mr. McDaniel
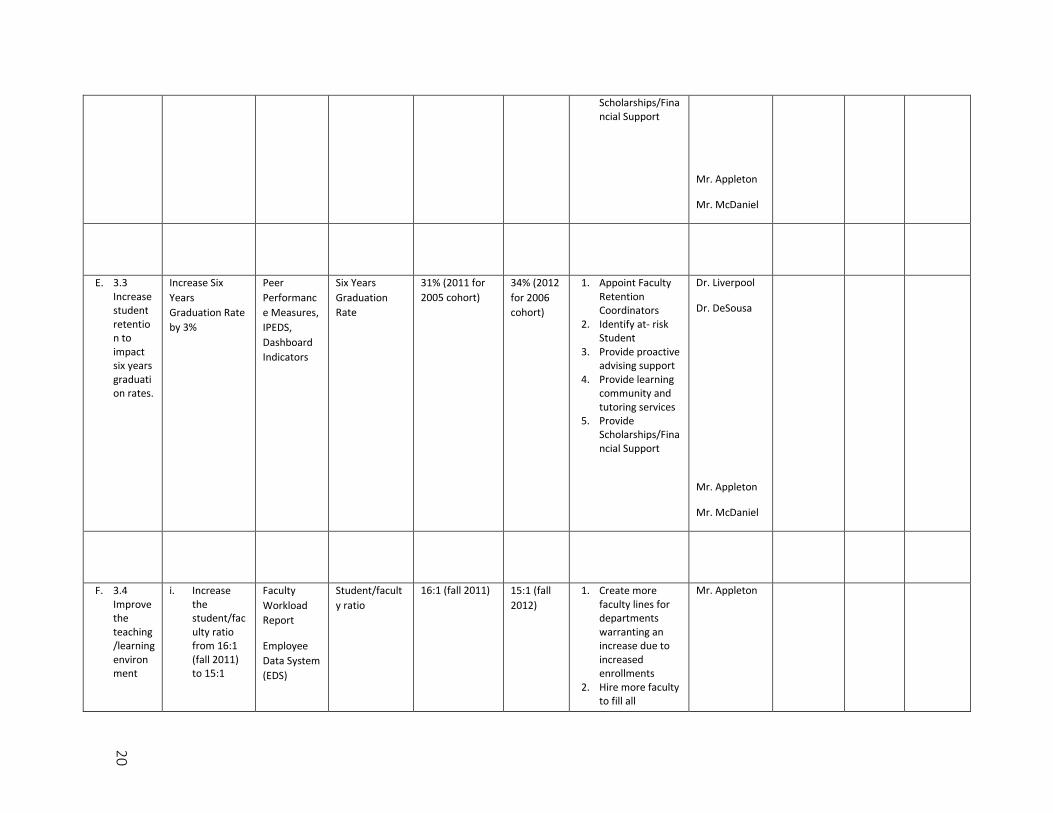
E. 3.3 Increase student retention to impact six years graduation rates.
Increase Six
Years
Graduation Rate
by 3%
Peer
Performanc
e Measures,
IPEDS,
Dashboard
Indicators
Six Years
Graduation
Rate
31% (2011 for
2005 cohort)
34% (2012
for 2006
cohort)
1. Appoint Faculty Retention Coordinators
2. Identify at- risk Student
3. Provide proactive advising support
4. Provide learning community and tutoring services
5. Provide Scholarships/Financial Support
Dr. Liverpool
Dr. DeSousa
Mr. Appleton
Mr. McDaniel
F. 3.4 Improve the teaching/learning environment
i. Increase the student/faculty ratio from 16:1 (fall 2011) to 15:1
Faculty
Workload
Report
Employee
Data System
(EDS)
Student/facult
y ratio
16:1 (fall 2011) 15:1 (fall
2012)
1. Create more faculty lines for departments warranting an increase due to increased enrollments
2. Hire more faculty to fill all
Mr. Appleton
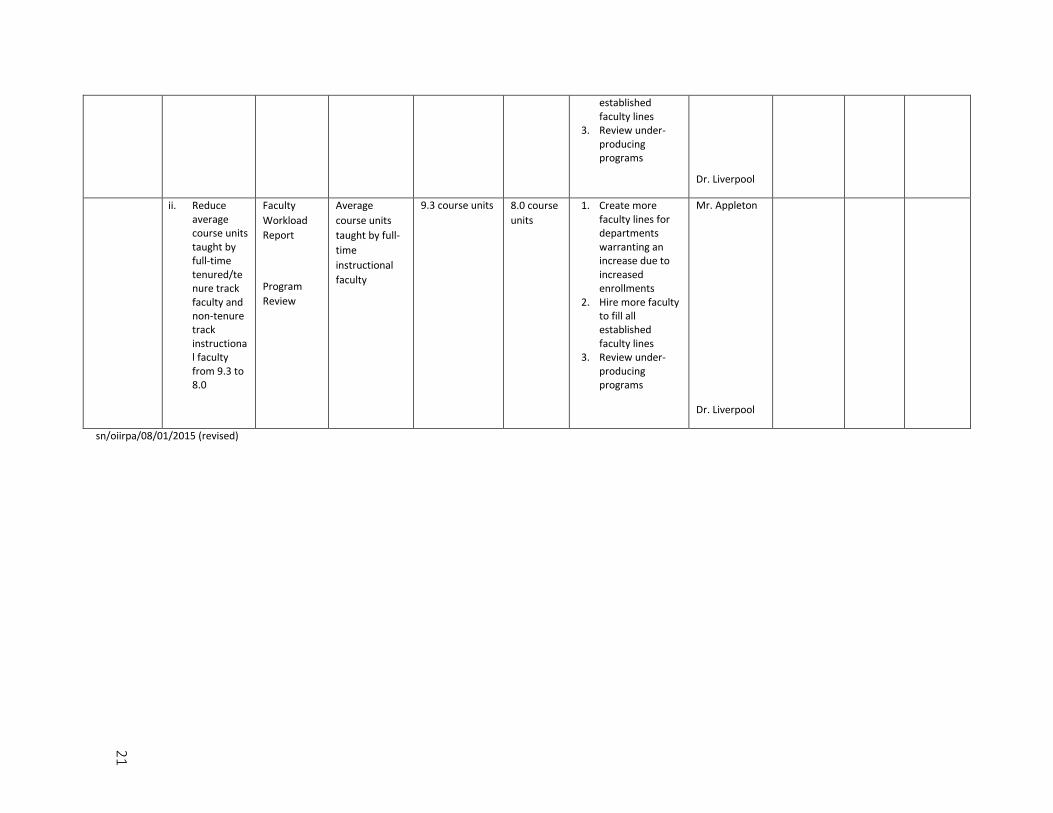
21
sn/oiirpa/08/01/2015 (revised)
established faculty lines
3. Review under-producing programs
Dr. Liverpool
ii. Reduce average course units taught by full-time tenured/tenure track faculty and non-tenure track instructional faculty from 9.3 to 8.0
Faculty
Workload
Report
Program
Review
Average
course units
taught by full-
time
instructional
faculty
9.3 course units 8.0 course
units
1. Create more faculty lines for departments warranting an increase due to increased enrollments
2. Hire more faculty to fill all established faculty lines
3. Review under-producing programs
Mr. Appleton
Dr. Liverpool
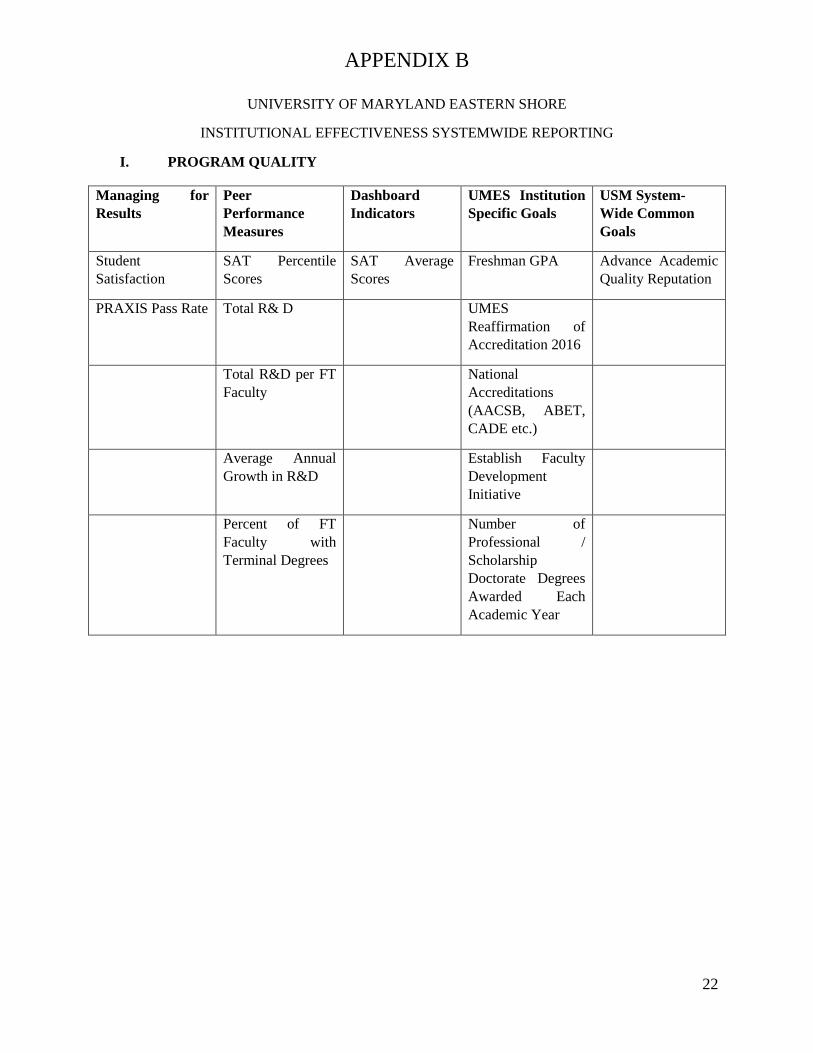
APPENDIX B
22
UNIVERSITY OF MARYLAND EASTERN SHORE
INSTITUTIONAL EFFECTIVENESS SYSTEMWIDE REPORTING
I. PROGRAM QUALITY
Managing for
Results
Peer
Performance
Measures
Dashboard
Indicators
UMES Institution
Specific Goals
USM System-
Wide Common
Goals
Student
Satisfaction
SAT Percentile
Scores
SAT Average
Scores
Freshman GPA Advance Academic
Quality Reputation
PRAXIS Pass Rate Total R& D UMES
Reaffirmation of
Accreditation 2016
Total R&D per FT
Faculty
National
Accreditations
(AACSB, ABET,
CADE etc.)
Average Annual
Growth in R&D
Establish Faculty
Development
Initiative
Percent of FT
Faculty with
Terminal Degrees
Number of
Professional /
Scholarship
Doctorate Degrees
Awarded Each
Academic Year
23
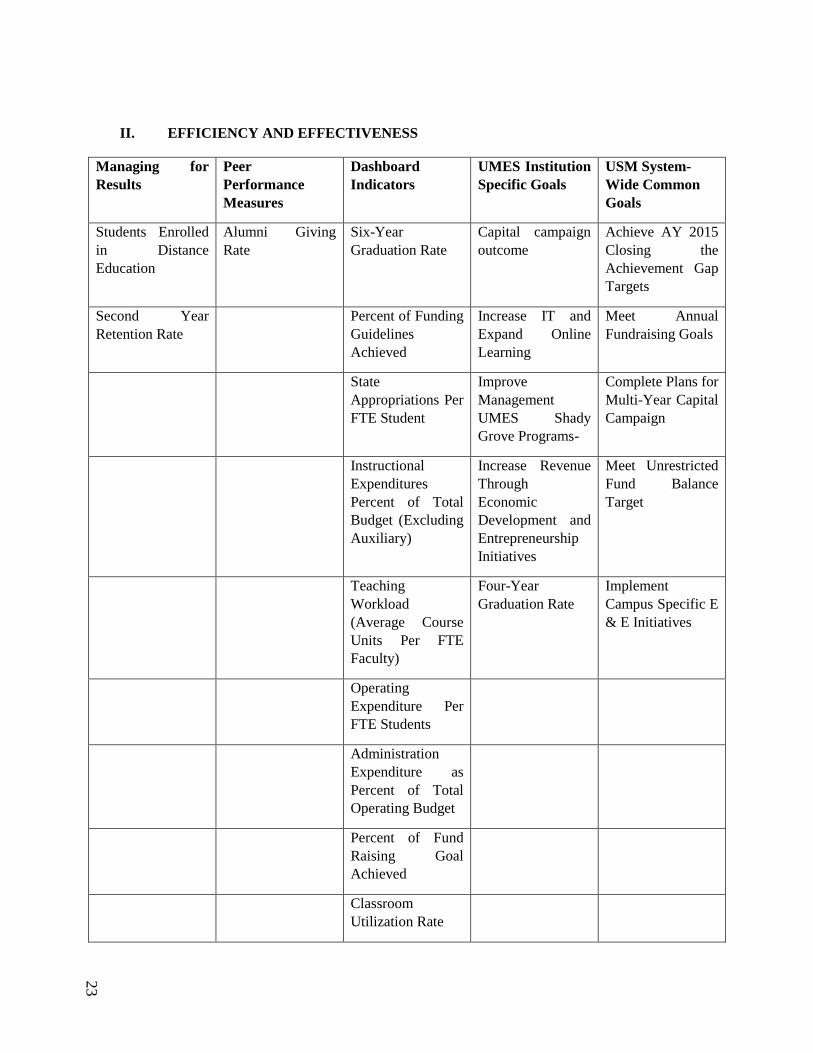
II. EFFICIENCY AND EFFECTIVENESS
Managing for
Results
Peer
Performance
Measures
Dashboard
Indicators
UMES Institution
Specific Goals
USM System-
Wide Common
Goals
Students Enrolled
in Distance
Education
Alumni Giving
Rate
Six-Year
Graduation Rate
Capital campaign
outcome
Achieve AY 2015
Closing the
Achievement Gap
Targets
Second Year
Retention Rate
Percent of Funding
Guidelines
Achieved
Increase IT and
Expand Online
Learning
Meet Annual
Fundraising Goals
State
Appropriations Per
FTE Student
Improve
Management
UMES Shady
Grove Programs-
Complete Plans for
Multi-Year Capital
Campaign
Instructional
Expenditures
Percent of Total
Budget (Excluding
Auxiliary)
Increase Revenue
Through
Economic
Development and
Entrepreneurship
Initiatives
Meet Unrestricted
Fund Balance
Target
Teaching
Workload
(Average Course
Units Per FTE
Faculty)
Four-Year
Graduation Rate
Implement
Campus Specific E
& E Initiatives
Operating
Expenditure Per
FTE Students
Administration
Expenditure as
Percent of Total
Operating Budget
Percent of Fund
Raising Goal
Achieved
Classroom
Utilization Rate
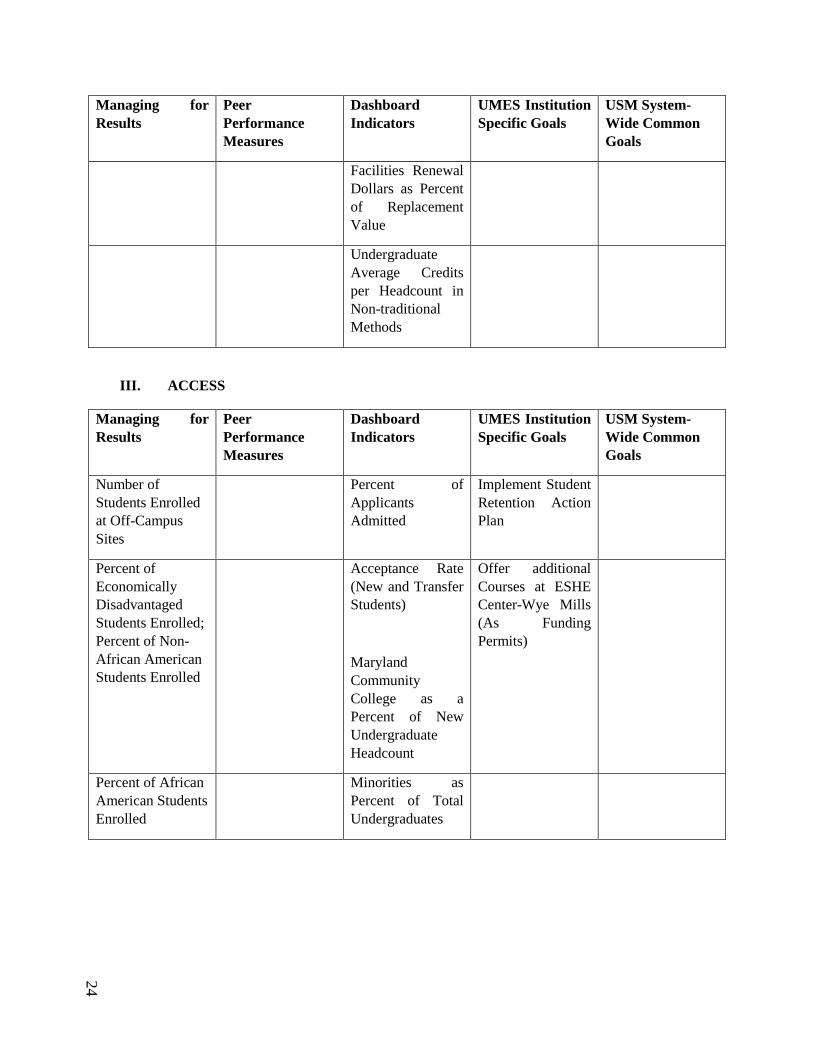
24
Managing for
Results
Peer
Performance
Measures
Dashboard
Indicators
UMES Institution
Specific Goals
USM System-
Wide Common
Goals
Facilities Renewal
Dollars as Percent
of Replacement
Value
Undergraduate
Average Credits
per Headcount in
Non-traditional
Methods
III. ACCESS
Managing for
Results
Peer
Performance
Measures
Dashboard
Indicators
UMES Institution
Specific Goals
USM System-
Wide Common
Goals
Number of
Students Enrolled
at Off-Campus
Sites
Percent of
Applicants
Admitted
Implement Student
Retention Action
Plan
Percent of
Economically
Disadvantaged
Students Enrolled;
Percent of Non-
African American
Students Enrolled
Acceptance Rate
(New and Transfer
Students)
Maryland
Community
College as a
Percent of New
Undergraduate
Headcount
Offer additional
Courses at ESHE
Center-Wye Mills
(As Funding
Permits)
Percent of African
American Students
Enrolled
Minorities as
Percent of Total
Undergraduates
25
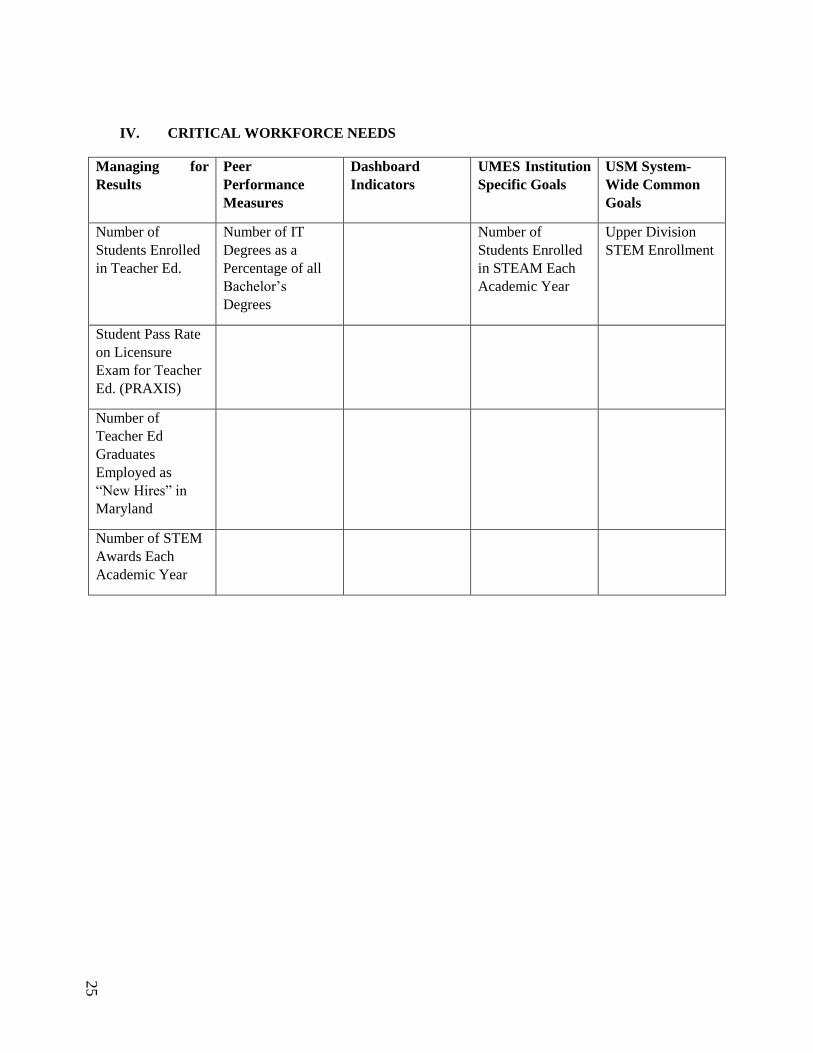
IV. CRITICAL WORKFORCE NEEDS
Managing for
Results
Peer
Performance
Measures
Dashboard
Indicators
UMES Institution
Specific Goals
USM System-
Wide Common
Goals
Number of
Students Enrolled
in Teacher Ed.
Number of IT
Degrees as a
Percentage of all
Bachelor’s
Degrees
Number of
Students Enrolled
in STEAM Each
Academic Year
Upper Division
STEM Enrollment
Student Pass Rate
on Licensure
Exam for Teacher
Ed. (PRAXIS)
Number of
Teacher Ed
Graduates
Employed as
“New Hires” in
Maryland
Number of STEM
Awards Each
Academic Year
26
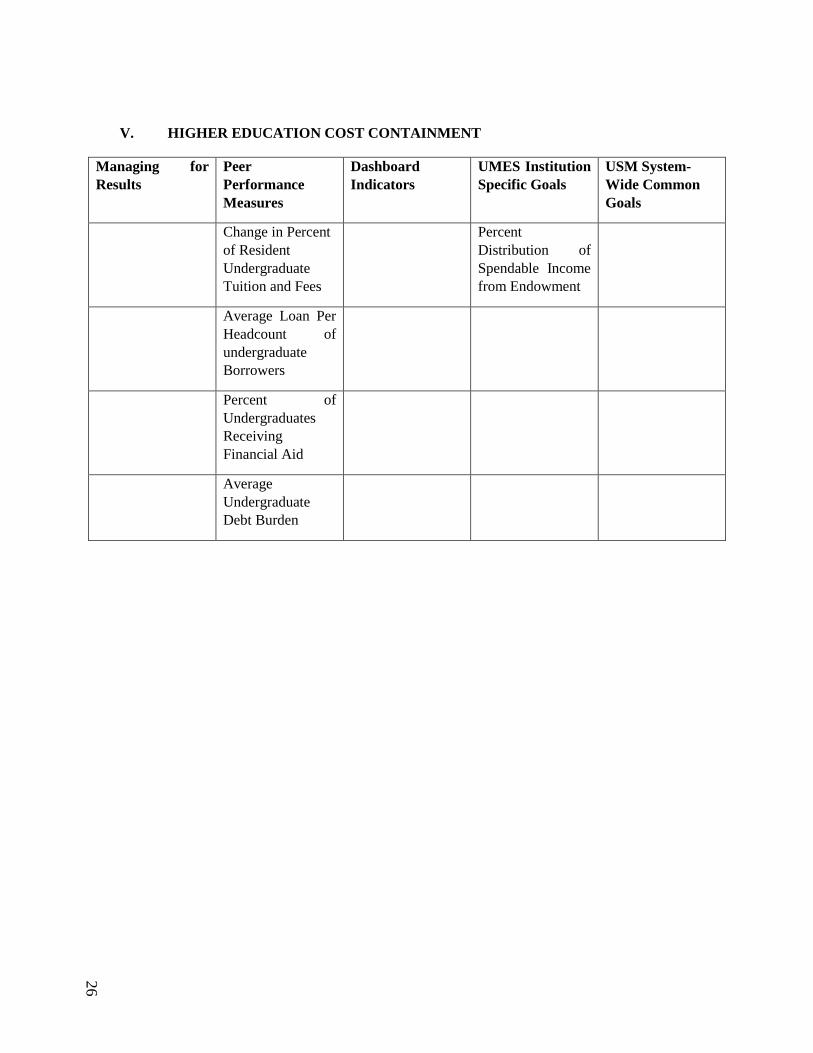
V. HIGHER EDUCATION COST CONTAINMENT
Managing for
Results
Peer
Performance
Measures
Dashboard
Indicators
UMES Institution
Specific Goals
USM System-
Wide Common
Goals
Change in Percent
of Resident
Undergraduate
Tuition and Fees
Percent
Distribution of
Spendable Income
from Endowment
Average Loan Per
Headcount of
undergraduate
Borrowers
Percent of
Undergraduates
Receiving
Financial Aid
Average
Undergraduate
Debt Burden
27
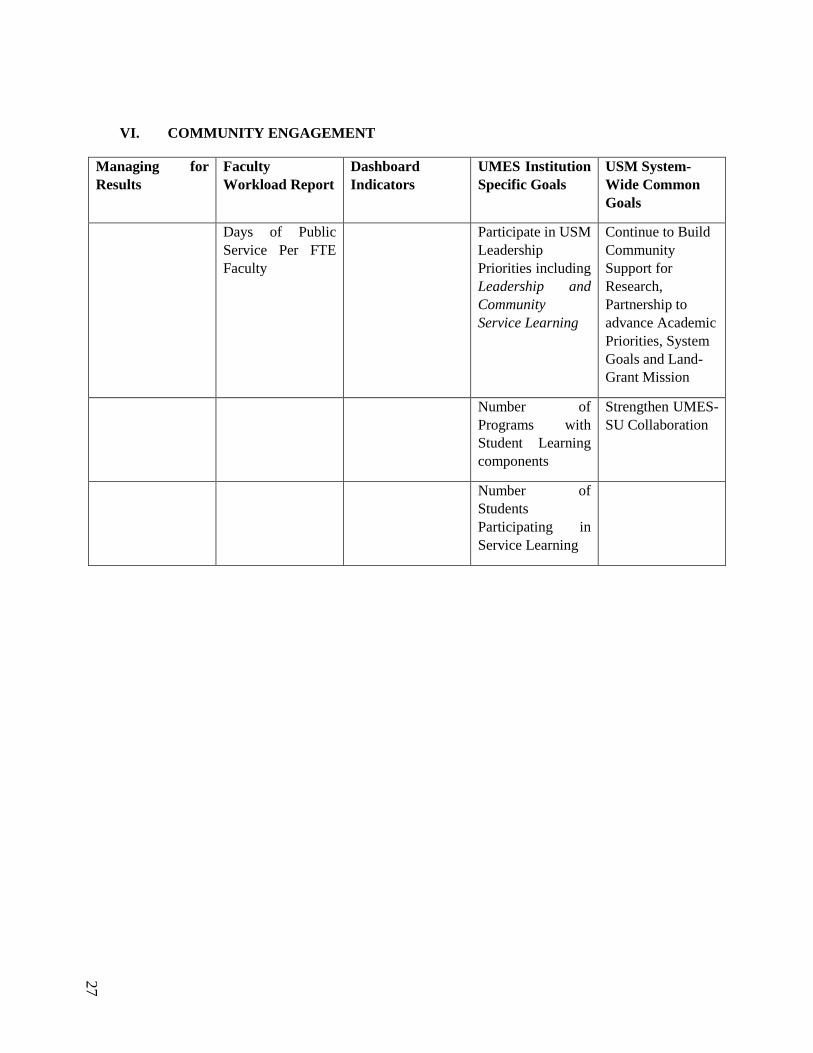
VI. COMMUNITY ENGAGEMENT
Managing for
Results
Faculty
Workload Report
Dashboard
Indicators
UMES Institution
Specific Goals
USM System-
Wide Common
Goals
Days of Public
Service Per FTE
Faculty
Participate in USM
Leadership
Priorities including
Leadership and
Community
Service Learning
Continue to Build
Community
Support for
Research,
Partnership to
advance Academic
Priorities, System
Goals and Land-
Grant Mission
Number of
Programs with
Student Learning
components
Strengthen UMES-
SU Collaboration
Number of
Students
Participating in
Service Learning
28
AP
PE
ND
IX C
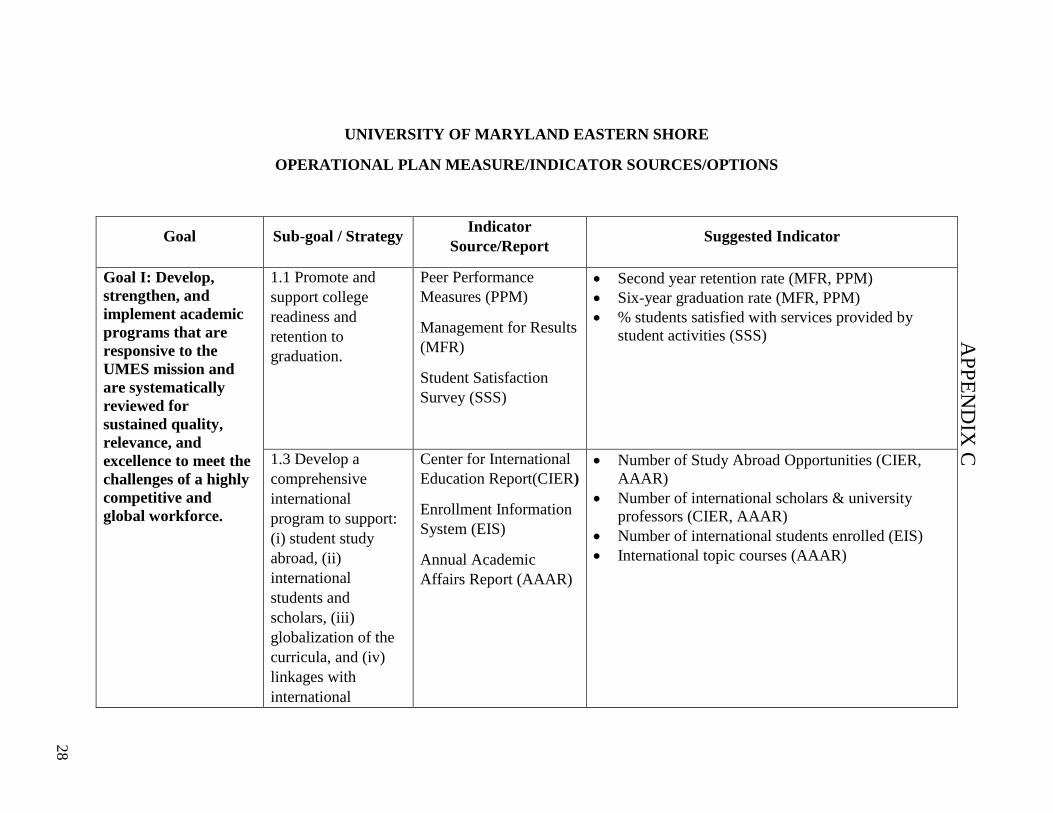
UNIVERSITY OF MARYLAND EASTERN SHORE
OPERATIONAL PLAN MEASURE/INDICATOR SOURCES/OPTIONS
Goal Sub-goal / Strategy Indicator
Source/Report Suggested Indicator
Goal I: Develop,
strengthen, and
implement academic
programs that are
responsive to the
UMES mission and
are systematically
reviewed for
sustained quality,
relevance, and
excellence to meet the
challenges of a highly
competitive and
global workforce.
1.1 Promote and
support college
readiness and
retention to
graduation.
Peer Performance
Measures (PPM)
Management for Results
(MFR)
Student Satisfaction
Survey (SSS)
Second year retention rate (MFR, PPM)
Six-year graduation rate (MFR, PPM)
% students satisfied with services provided by
student activities (SSS)
1.3 Develop a
comprehensive
international
program to support:
(i) student study
abroad, (ii)
international
students and
scholars, (iii)
globalization of the
curricula, and (iv)
linkages with
international
Center for International
Education Report(CIER)
Enrollment Information
System (EIS)
Annual Academic
Affairs Report (AAAR)
Number of Study Abroad Opportunities (CIER,
AAAR)
Number of international scholars & university
professors (CIER, AAAR)
Number of international students enrolled (EIS)
International topic courses (AAAR)
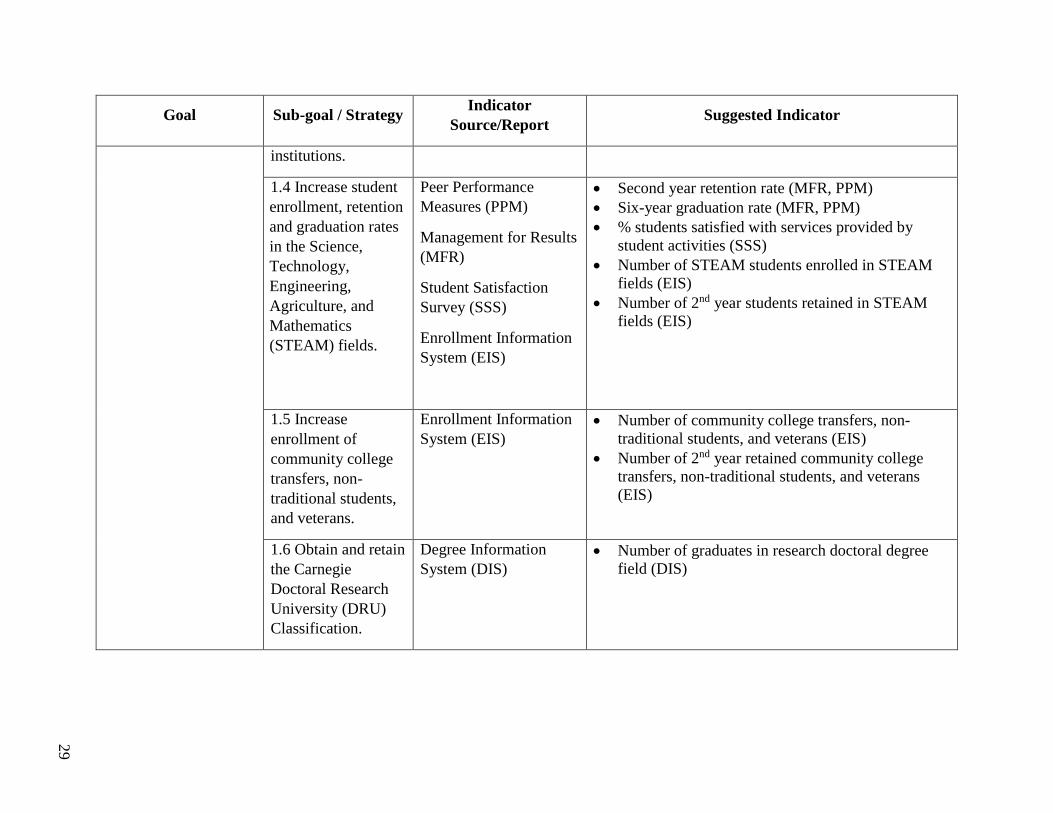
29
Goal Sub-goal / Strategy Indicator
Source/Report Suggested Indicator
institutions.
1.4 Increase student
enrollment, retention
and graduation rates
in the Science,
Technology,
Engineering,
Agriculture, and
Mathematics
(STEAM) fields.
Peer Performance
Measures (PPM)
Management for Results
(MFR)
Student Satisfaction
Survey (SSS)
Enrollment Information
System (EIS)
Second year retention rate (MFR, PPM)
Six-year graduation rate (MFR, PPM)
% students satisfied with services provided by
student activities (SSS)
Number of STEAM students enrolled in STEAM
fields (EIS)
Number of 2nd year students retained in STEAM
fields (EIS)
1.5 Increase
enrollment of
community college
transfers, non-
traditional students,
and veterans.
Enrollment Information
System (EIS)
Number of community college transfers, non-
traditional students, and veterans (EIS)
Number of 2nd year retained community college
transfers, non-traditional students, and veterans
(EIS)
1.6 Obtain and retain
the Carnegie
Doctoral Research
University (DRU)
Classification.
Degree Information
System (DIS)
Number of graduates in research doctoral degree
field (DIS)
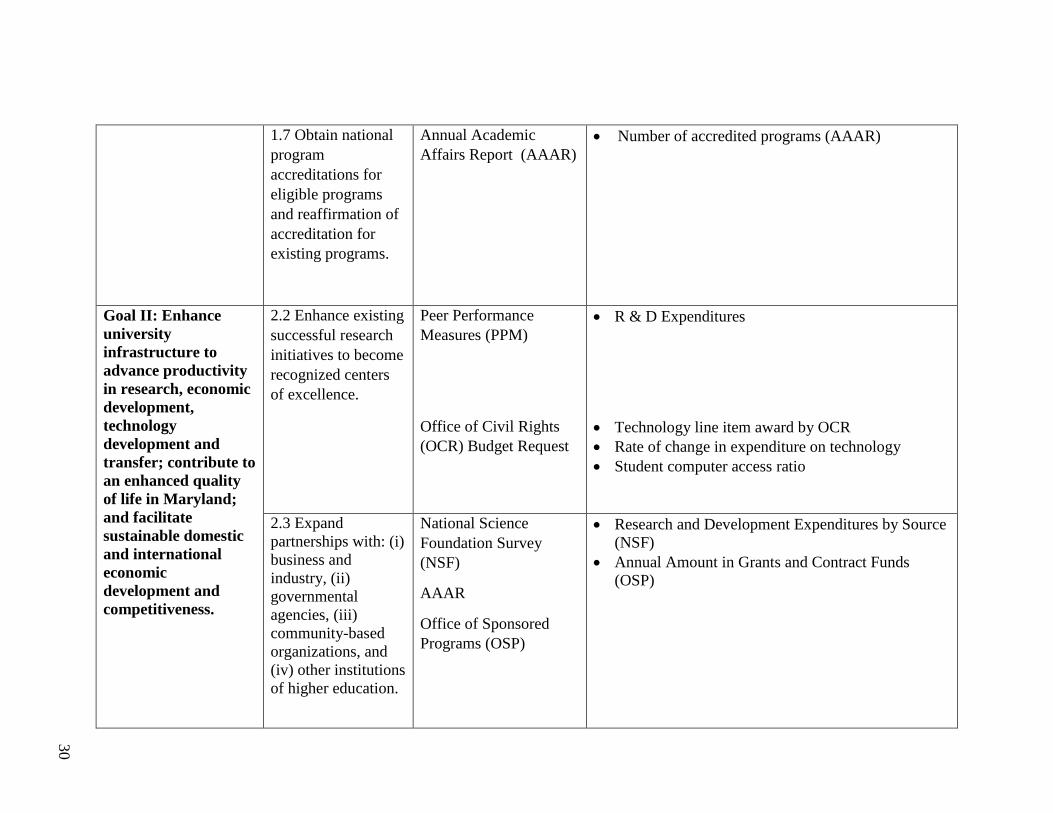
30
1.7 Obtain national
program
accreditations for
eligible programs
and reaffirmation of
accreditation for
existing programs.
Annual Academic
Affairs Report (AAAR)
Number of accredited programs (AAAR)
Goal II: Enhance
university
infrastructure to
advance productivity
in research, economic
development,
technology
development and
transfer; contribute to
an enhanced quality
of life in Maryland;
and facilitate
sustainable domestic
and international
economic
development and
competitiveness.
2.2 Enhance existing
successful research
initiatives to become
recognized centers
of excellence.
Peer Performance
Measures (PPM)
Office of Civil Rights
(OCR) Budget Request
R & D Expenditures
Technology line item award by OCR
Rate of change in expenditure on technology
Student computer access ratio
2.3 Expand
partnerships with: (i)
business and
industry, (ii)
governmental
agencies, (iii)
community-based
organizations, and
(iv) other institutions
of higher education.
National Science
Foundation Survey
(NSF)
AAAR
Office of Sponsored
Programs (OSP)
Research and Development Expenditures by Source
(NSF)
Annual Amount in Grants and Contract Funds
(OSP)
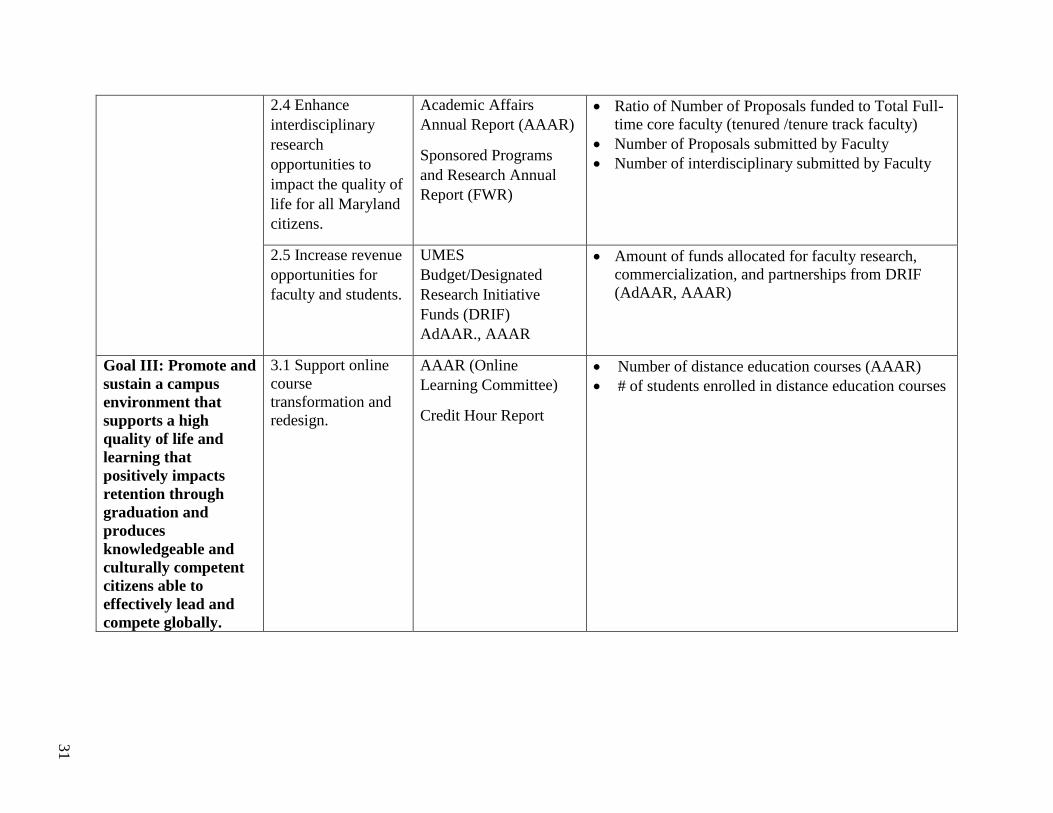
31
2.4 Enhance
interdisciplinary
research
opportunities to
impact the quality of
life for all Maryland
citizens.
Academic Affairs
Annual Report (AAAR)
Sponsored Programs
and Research Annual
Report (FWR)
Ratio of Number of Proposals funded to Total Full-
time core faculty (tenured /tenure track faculty)
Number of Proposals submitted by Faculty
Number of interdisciplinary submitted by Faculty
2.5 Increase revenue
opportunities for
faculty and students.
UMES
Budget/Designated
Research Initiative
Funds (DRIF)
AdAAR., AAAR
Amount of funds allocated for faculty research,
commercialization, and partnerships from DRIF
(AdAAR, AAAR)
Goal III: Promote and
sustain a campus
environment that
supports a high
quality of life and
learning that
positively impacts
retention through
graduation and
produces
knowledgeable and
culturally competent
citizens able to
effectively lead and
compete globally.
3.1 Support online
course
transformation and
redesign.
AAAR (Online
Learning Committee)
Credit Hour Report
Number of distance education courses (AAAR)
# of students enrolled in distance education courses
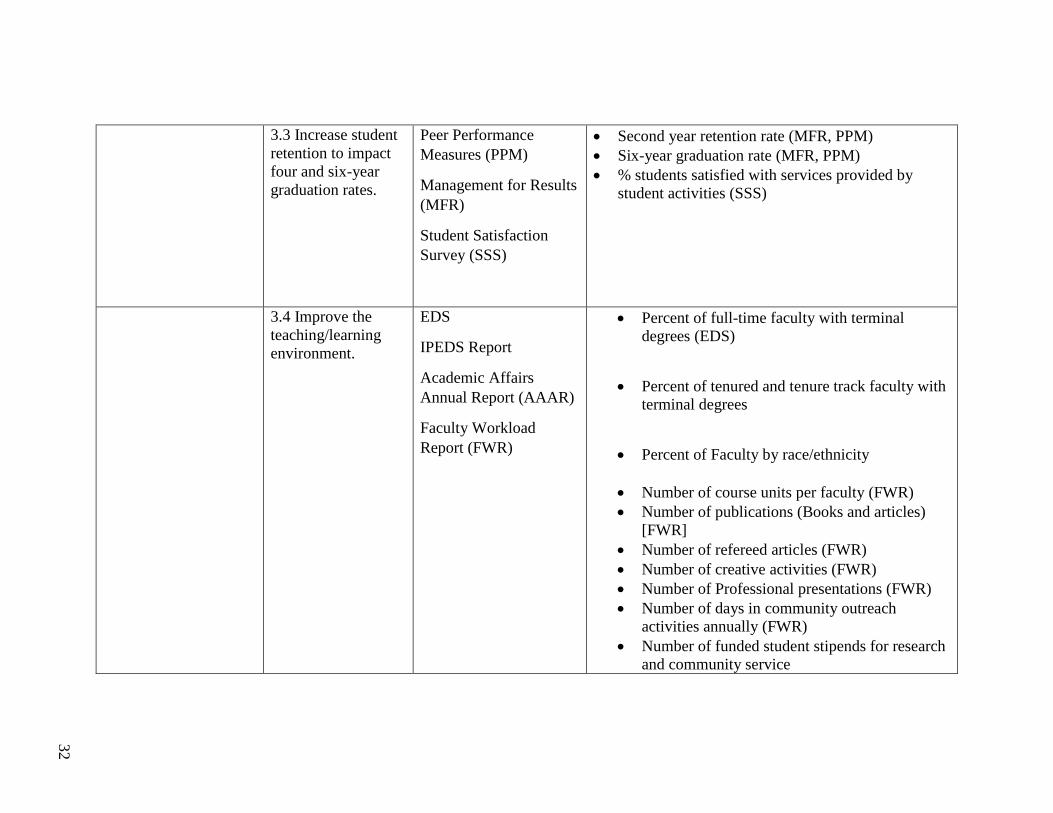
32
3.3 Increase student
retention to impact
four and six-year
graduation rates.
Peer Performance
Measures (PPM)
Management for Results
(MFR)
Student Satisfaction
Survey (SSS)
Second year retention rate (MFR, PPM)
Six-year graduation rate (MFR, PPM)
% students satisfied with services provided by
student activities (SSS)
3.4 Improve the
teaching/learning
environment.
EDS
IPEDS Report
Academic Affairs
Annual Report (AAAR)
Faculty Workload
Report (FWR)
Percent of full-time faculty with terminal
degrees (EDS)
Percent of tenured and tenure track faculty with
terminal degrees
Percent of Faculty by race/ethnicity
Number of course units per faculty (FWR)
Number of publications (Books and articles)
[FWR]
Number of refereed articles (FWR)
Number of creative activities (FWR)
Number of Professional presentations (FWR)
Number of days in community outreach
activities annually (FWR)
Number of funded student stipends for research
and community service
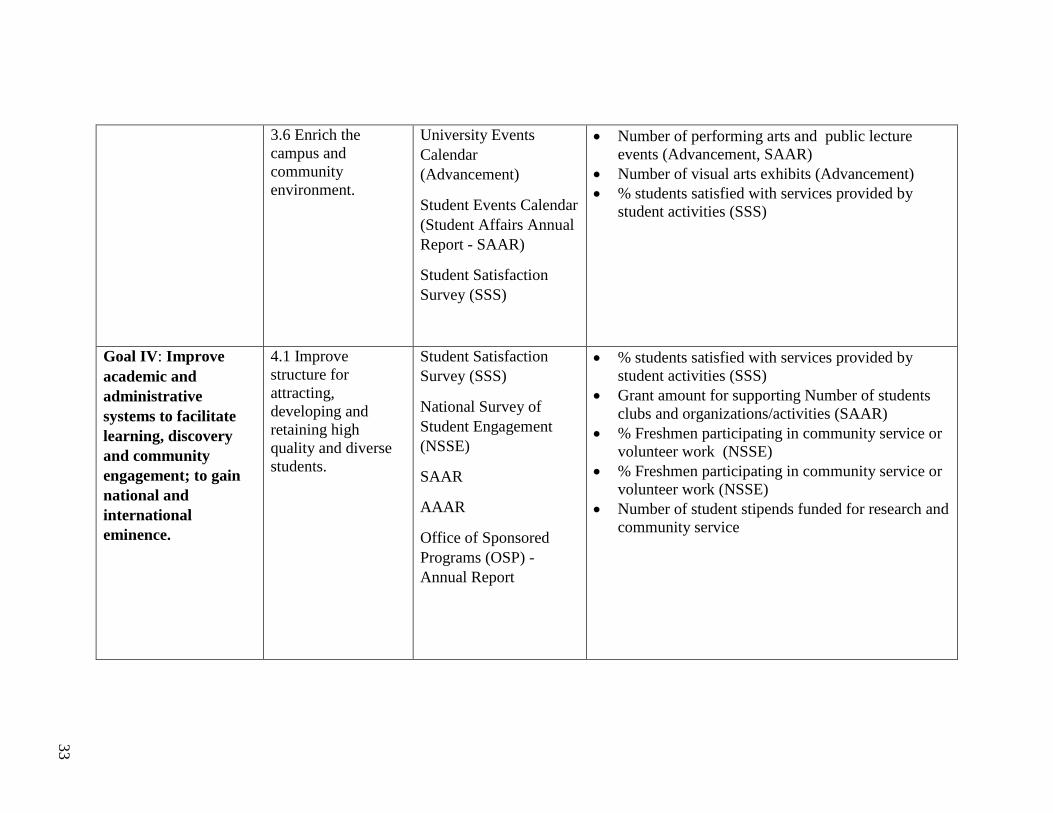
33
3.6 Enrich the
campus and
community
environment.
University Events
Calendar
(Advancement)
Student Events Calendar
(Student Affairs Annual
Report - SAAR)
Student Satisfaction
Survey (SSS)
Number of performing arts and public lecture
events (Advancement, SAAR)
Number of visual arts exhibits (Advancement)
% students satisfied with services provided by
student activities (SSS)
Goal IV: Improve
academic and
administrative
systems to facilitate
learning, discovery
and community
engagement; to gain
national and
international
eminence.
4.1 Improve
structure for
attracting,
developing and
retaining high
quality and diverse
students.
Student Satisfaction
Survey (SSS)
National Survey of
Student Engagement
(NSSE)
SAAR
AAAR
Office of Sponsored
Programs (OSP) -
Annual Report
% students satisfied with services provided by
student activities (SSS)
Grant amount for supporting Number of students
clubs and organizations/activities (SAAR)
% Freshmen participating in community service or
volunteer work (NSSE)
% Freshmen participating in community service or
volunteer work (NSSE)
Number of student stipends funded for research and
community service
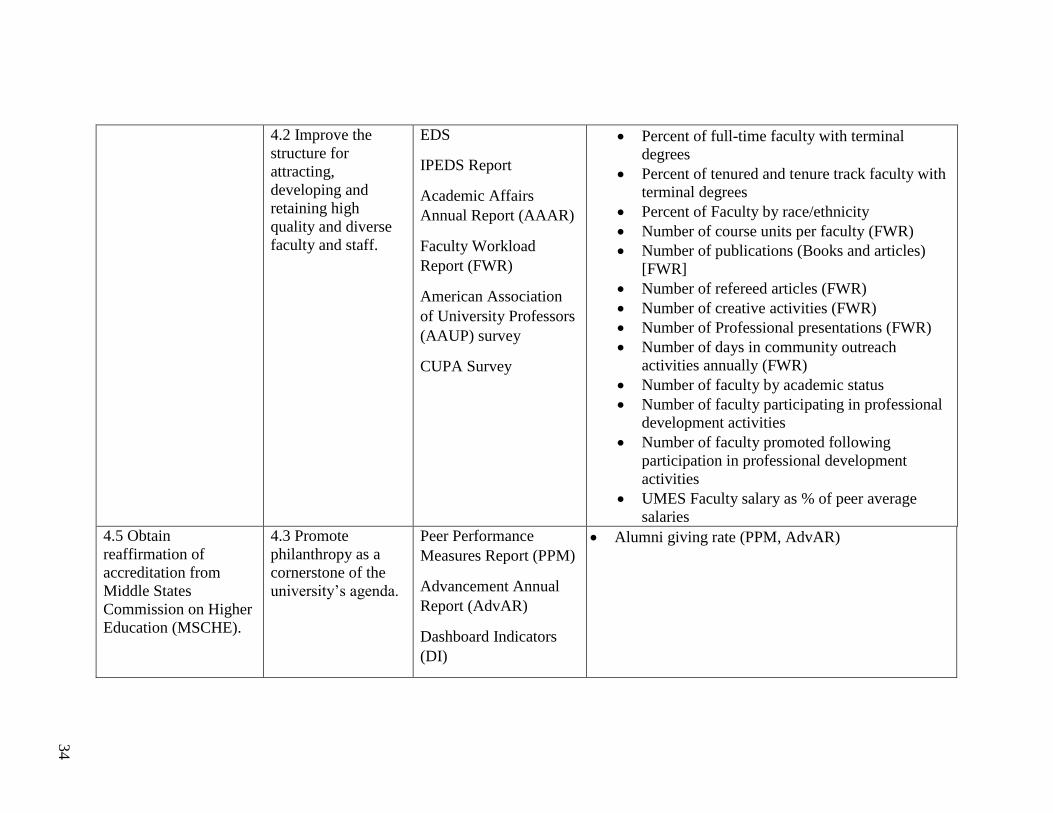
34
4.2 Improve the
structure for
attracting,
developing and
retaining high
quality and diverse
faculty and staff.
EDS
IPEDS Report
Academic Affairs
Annual Report (AAAR)
Faculty Workload
Report (FWR)
American Association
of University Professors
(AAUP) survey
CUPA Survey
Percent of full-time faculty with terminal
degrees
Percent of tenured and tenure track faculty with
terminal degrees
Percent of Faculty by race/ethnicity
Number of course units per faculty (FWR)
Number of publications (Books and articles)
[FWR]
Number of refereed articles (FWR)
Number of creative activities (FWR)
Number of Professional presentations (FWR)
Number of days in community outreach
activities annually (FWR)
Number of faculty by academic status
Number of faculty participating in professional
development activities
Number of faculty promoted following
participation in professional development
activities
UMES Faculty salary as % of peer average
salaries
4.5 Obtain
reaffirmation of
accreditation from
Middle States
Commission on Higher
Education (MSCHE).
4.3 Promote
philanthropy as a
cornerstone of the
university’s agenda.
Peer Performance
Measures Report (PPM)
Advancement Annual
Report (AdvAR)
Dashboard Indicators
(DI)
Alumni giving rate (PPM, AdvAR)
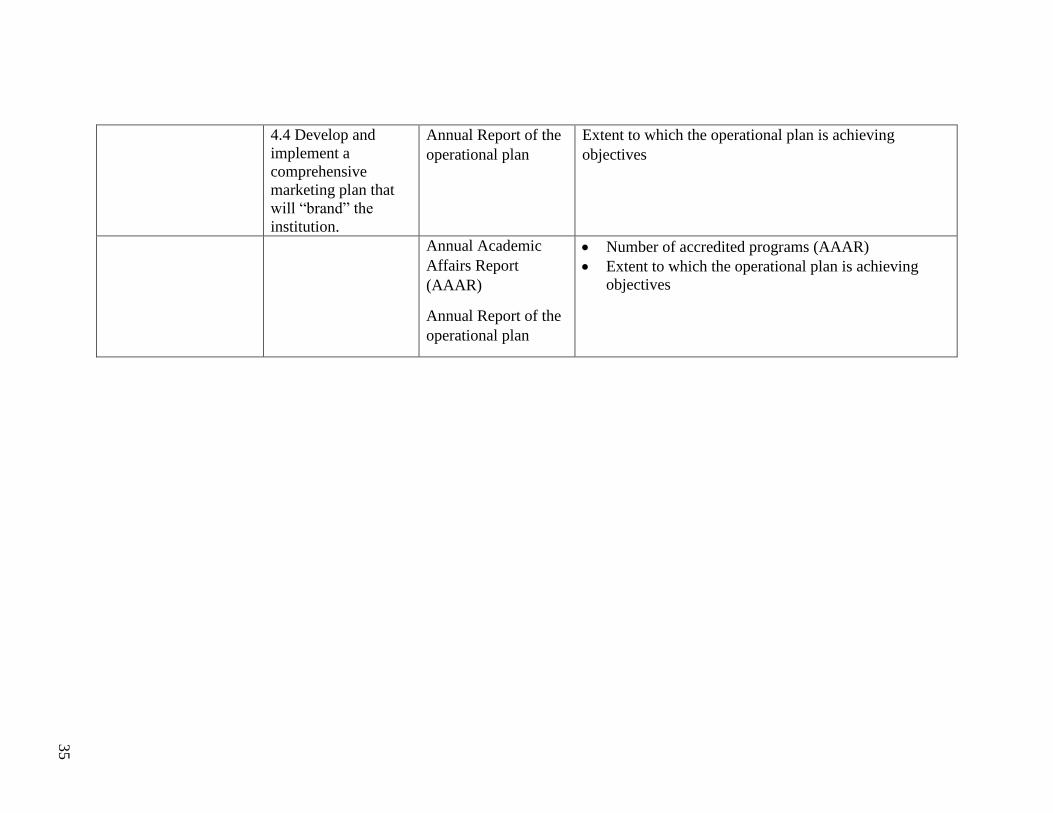
35
4.4 Develop and
implement a
comprehensive
marketing plan that
will “brand” the
institution.
Annual Report of the
operational plan
Extent to which the operational plan is achieving
objectives
Annual Academic
Affairs Report
(AAAR)
Annual Report of the
operational plan
Number of accredited programs (AAAR)
Extent to which the operational plan is achieving
objectives
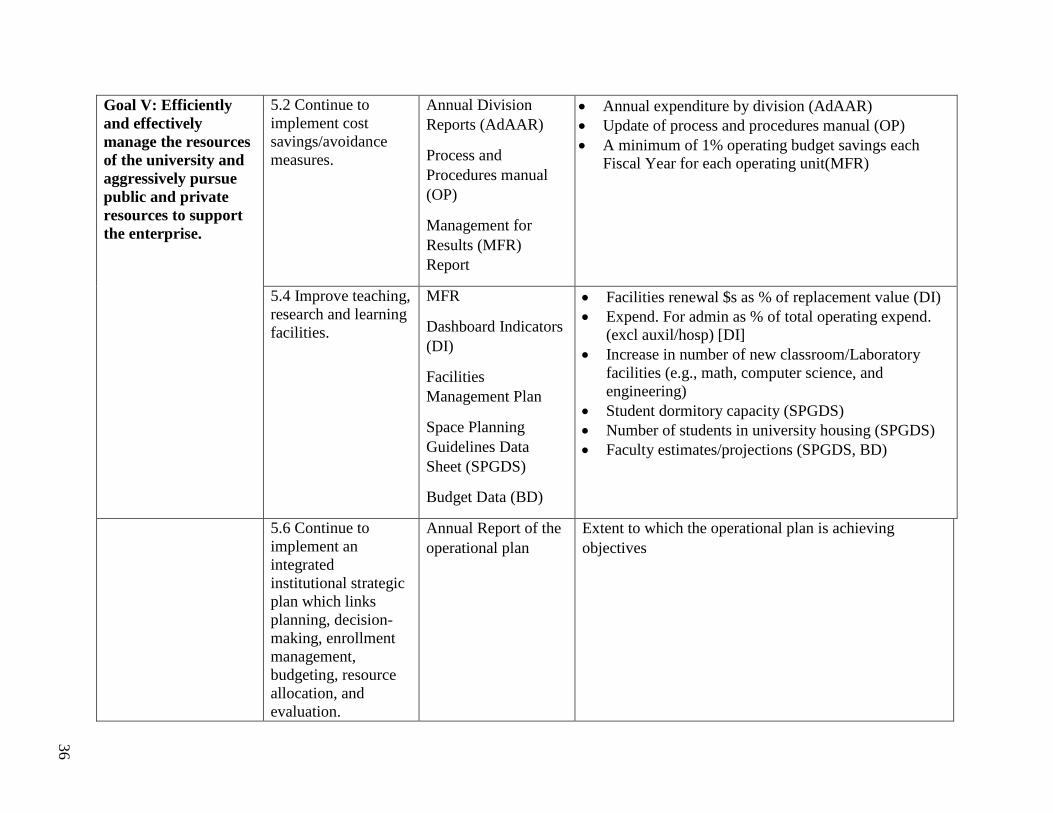
36
Goal V: Efficiently
and effectively
manage the resources
of the university and
aggressively pursue
public and private
resources to support
the enterprise.
5.2 Continue to
implement cost
savings/avoidance
measures.
Annual Division
Reports (AdAAR)
Process and
Procedures manual
(OP)
Management for
Results (MFR)
Report
Annual expenditure by division (AdAAR)
Update of process and procedures manual (OP)
A minimum of 1% operating budget savings each
Fiscal Year for each operating unit(MFR)
5.4 Improve teaching,
research and learning
facilities.
MFR
Dashboard Indicators
(DI)
Facilities
Management Plan
Space Planning
Guidelines Data
Sheet (SPGDS)
Budget Data (BD)
Facilities renewal $s as % of replacement value (DI)
Expend. For admin as % of total operating expend.
(excl auxil/hosp) [DI]
Increase in number of new classroom/Laboratory
facilities (e.g., math, computer science, and
engineering)
Student dormitory capacity (SPGDS)
Number of students in university housing (SPGDS)
Faculty estimates/projections (SPGDS, BD)
5.6 Continue to
implement an
integrated
institutional strategic
plan which links
planning, decision-
making, enrollment
management,
budgeting, resource
allocation, and
evaluation.
Annual Report of the
operational plan
Extent to which the operational plan is achieving
objectives
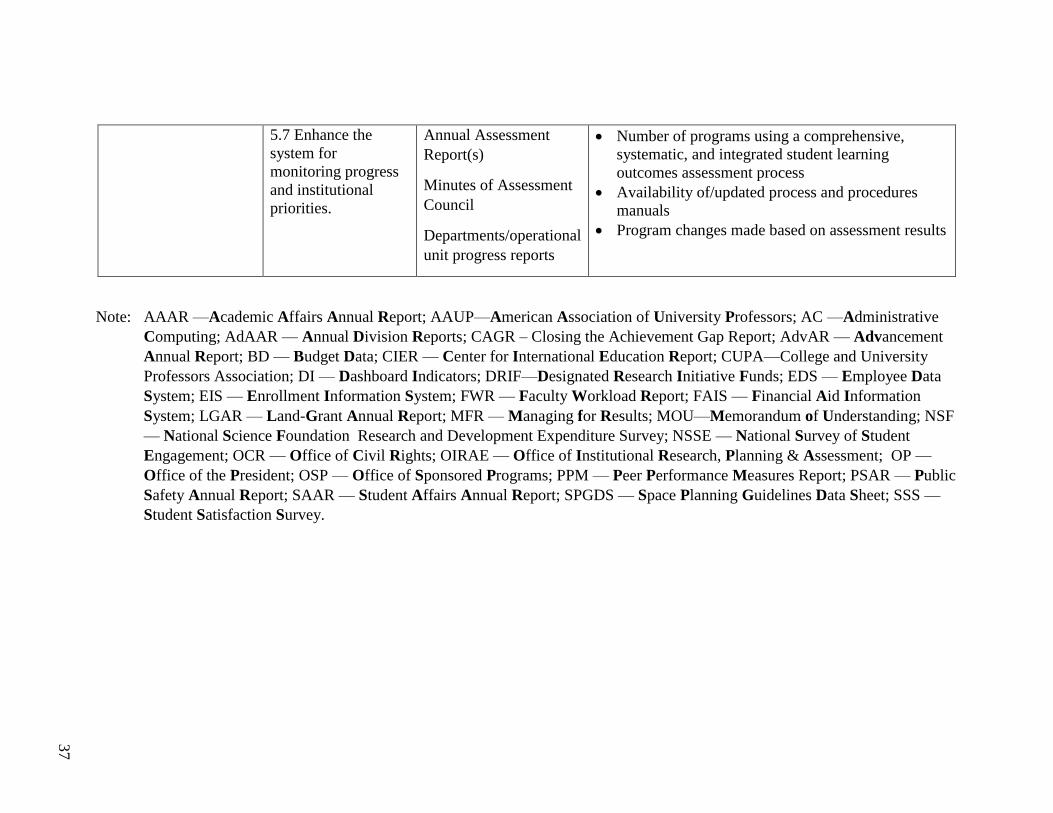
37
5.7 Enhance the
system for
monitoring progress
and institutional
priorities.
Annual Assessment
Report(s)
Minutes of Assessment
Council
Departments/operational
unit progress reports
Number of programs using a comprehensive,
systematic, and integrated student learning
outcomes assessment process
Availability of/updated process and procedures
manuals
Program changes made based on assessment results
Note: AAAR —Academic Affairs Annual Report; AAUP—American Association of University Professors; AC —Administrative
Computing; AdAAR — Annual Division Reports; CAGR – Closing the Achievement Gap Report; AdvAR — Advancement
Annual Report; BD — Budget Data; CIER — Center for International Education Report; CUPA—College and University
Professors Association; DI — Dashboard Indicators; DRIF—Designated Research Initiative Funds; EDS — Employee Data
System; EIS — Enrollment Information System; FWR — Faculty Workload Report; FAIS — Financial Aid Information
System; LGAR — Land-Grant Annual Report; MFR — Managing for Results; MOU—Memorandum of Understanding; NSF
— National Science Foundation Research and Development Expenditure Survey; NSSE — National Survey of Student
Engagement; OCR — Office of Civil Rights; OIRAE — Office of Institutional Research, Planning & Assessment; OP —
Office of the President; OSP — Office of Sponsored Programs; PPM — Peer Performance Measures Report; PSAR — Public
Safety Annual Report; SAAR — Student Affairs Annual Report; SPGDS — Space Planning Guidelines Data Sheet; SSS —
Student Satisfaction Survey.
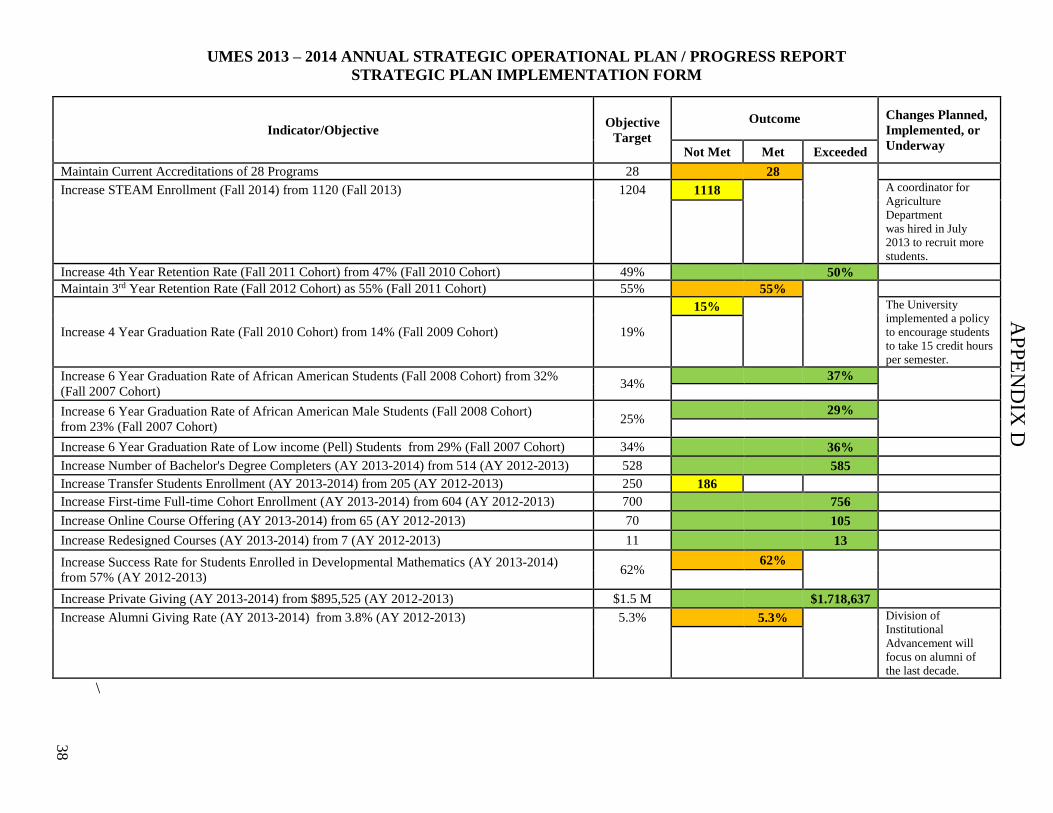
UMES 2013 – 2014 ANNUAL STRATEGIC OPERATIONAL PLAN / PROGRESS REPORT
STRATEGIC PLAN IMPLEMENTATION FORM
AP
PE
ND
IX D
38
\
Indicator/Objective Objective
Target
Outcome Changes Planned,
Implemented, or
Underway Not Met Met Exceeded
Maintain Current Accreditations of 28 Programs 28 28
Increase STEAM Enrollment (Fall 2014) from 1120 (Fall 2013) 1204 1118
A coordinator for
Agriculture
Department
was hired in July
2013 to recruit more
students.
Increase 4th Year Retention Rate (Fall 2011 Cohort) from 47% (Fall 2010 Cohort) 49% 50%
Maintain 3rd Year Retention Rate (Fall 2012 Cohort) as 55% (Fall 2011 Cohort) 55% 55%
Increase 4 Year Graduation Rate (Fall 2010 Cohort) from 14% (Fall 2009 Cohort) 19%
15%
The University
implemented a policy
to encourage students
to take 15 credit hours
per semester.
Increase 6 Year Graduation Rate of African American Students (Fall 2008 Cohort) from 32%
(Fall 2007 Cohort) 34%
37%
Increase 6 Year Graduation Rate of African American Male Students (Fall 2008 Cohort)
from 23% (Fall 2007 Cohort) 25%
29%
Increase 6 Year Graduation Rate of Low income (Pell) Students from 29% (Fall 2007 Cohort) 34% 36%
Increase Number of Bachelor's Degree Completers (AY 2013-2014) from 514 (AY 2012-2013) 528 585
Increase Transfer Students Enrollment (AY 2013-2014) from 205 (AY 2012-2013) 250 186
Increase First-time Full-time Cohort Enrollment (AY 2013-2014) from 604 (AY 2012-2013) 700 756
Increase Online Course Offering (AY 2013-2014) from 65 (AY 2012-2013) 70 105
Increase Redesigned Courses (AY 2013-2014) from 7 (AY 2012-2013) 11 13
Increase Success Rate for Students Enrolled in Developmental Mathematics (AY 2013-2014)
from 57% (AY 2012-2013) 62%
62%
Increase Private Giving (AY 2013-2014) from $895,525 (AY 2012-2013) $1.5 M $1.718,637
Increase Alumni Giving Rate (AY 2013-2014) from 3.8% (AY 2012-2013) 5.3% 5.3% Division of
Institutional
Advancement will
focus on alumni of
the last decade.