a integrated tool for monitoring water quality of streams ... · abstract the pristine rivers and...
TRANSCRIPT
An Integrated Device for Monitoring Water Quality of Streams Used for
Hydroelectric Power
AbstractThe pristine rivers and streams of the Sierra Nevada Mountains are a significant source of clean, renewable hydroelectric power. For each new hydroelectric facility introduced into these Sierran water systems, it is critical to include a water quality monitoring and assessment program to ensure preservation of the quality of the effected riparian ecosystems. This monitoring covers many data parameters, each requiring specialized and typically expensive sampling devices. These devices have to be carried into and through the streams and creeks by water quality specialists and local citizen volunteers resulting in a time-consuming and expensive operation. This proposal describes a design for integrating a large portion of the various sensor devices and data collection tools into a single low-cost, hand-held device that is easy to carry and use in the field. The device leverages the pole and D-net normally used for collection of benthic macroinvertebrate (BMI) samples and integrates onto it all the other necessary, but currently separate, monitoring sensors for water flow and depth, temperature, dissolved oxygen, conductivity, pH, turbidity, and other assessment parameters. This device is intended to be low-cost, lightweight, and adaptable to local water project monitoring objectives and budgets. This tool will be tested in the field on local watershed projects which include local Native American tribal participation, and is intended to be further developed and tested in collaboration with other existing Native American tribal hydroelectric and water quality projects.

Background
Need to balance dual national objectives
on energy and the environment
• Leverage and expand on hydro-electic
power as a significant source of clean,
renewable energy – DOE (1)
• Monitor and maintain the quality of water
in streams, creeks, and other surface
water systems – EPA (2)
Support the increasing number of Native
American renewable energy and clean
water projects on tribal lands. (3,4)
Problem Statement 1
• Hydroelectric facilities alter the natural flow of water
systems, via dams, canals, etc.
• Changes in water flow effect local riparian ecosystems. (5,
6)
• A key goal is to design hydroelectric systems to minimize
effects on riparian ecosystems. (7)
• Requires monitoring of water systems to ensure
environmental objectives are also met
Problem Statement 2
• EPA recently expanded scope of streams, creeks, etc to
be monitored (8)
• Comprehensive monitoring of every individual water
system will be a significant effort:
• People and time including training, sampling, identifying, data entry
and analysis
• Equipment and resources for each assessment parameter
Local Relevance
• The local Bear River Watershed (where I live) has been historically impacted by numerous water use facilities including those for hydroelectric power.
• A new dam is proposed to be added on the Bear River for hydroelectric and other beneficial purposes.
• The new dam will change water flows and effect the local riparian environment.
• New water monitoring and analysis will be done throughout the Bear River watershed to evaluate the impact of existing and new hydroelectric facilities.
• This work is being done in cooperation with local NisenenTribe, and can serve as a model for other Native American water use and quality efforts.
Typical Water Monitoring Parameters to
be Assayed - per EPA/SWAMP (9)
There a many important data parameters that need to be
obtained and correlated in a typical water quality analysis:
• Physical/Ambient
• Geology, Water Flow, Temperature, Turbidity
• Chemical
• Oxygen, Nitrogen, Phosphorus, Phosphates, pH
• Biotics
• Benthic Macroinvertebrates, Algae, Fish, Amphibians, Birds
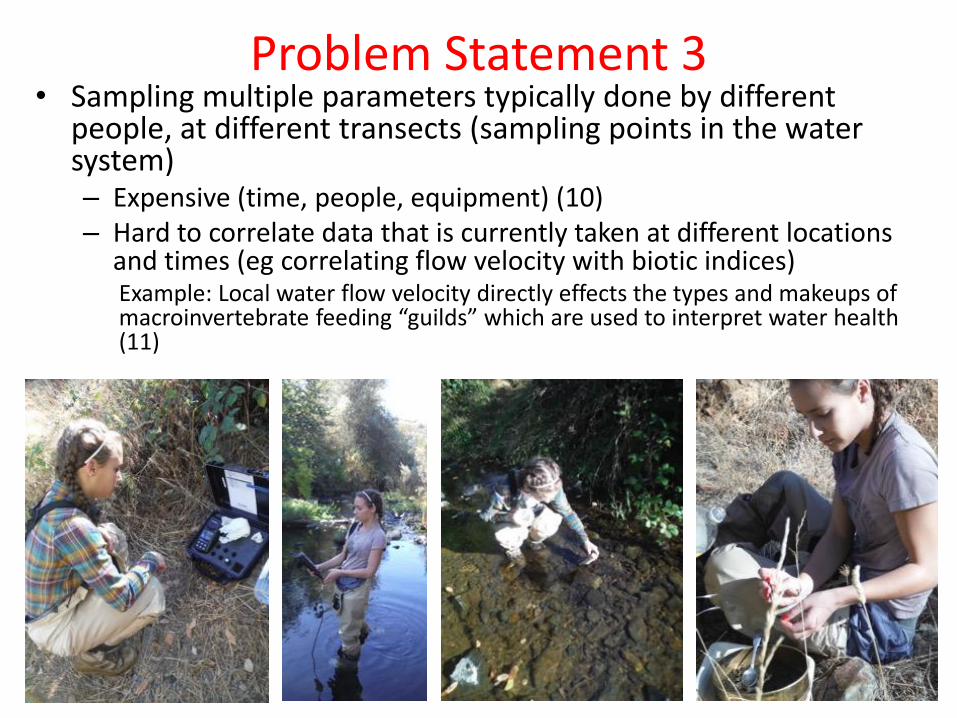
Problem Statement 3• Sampling multiple parameters typically done by different
people, at different transects (sampling points in the water system)– Expensive (time, people, equipment) (10)– Hard to correlate data that is currently taken at different locations
and times (eg correlating flow velocity with biotic indices)Example: Local water flow velocity directly effects the types and makeups of macroinvertebrate feeding “guilds” which are used to interpret water health (11)
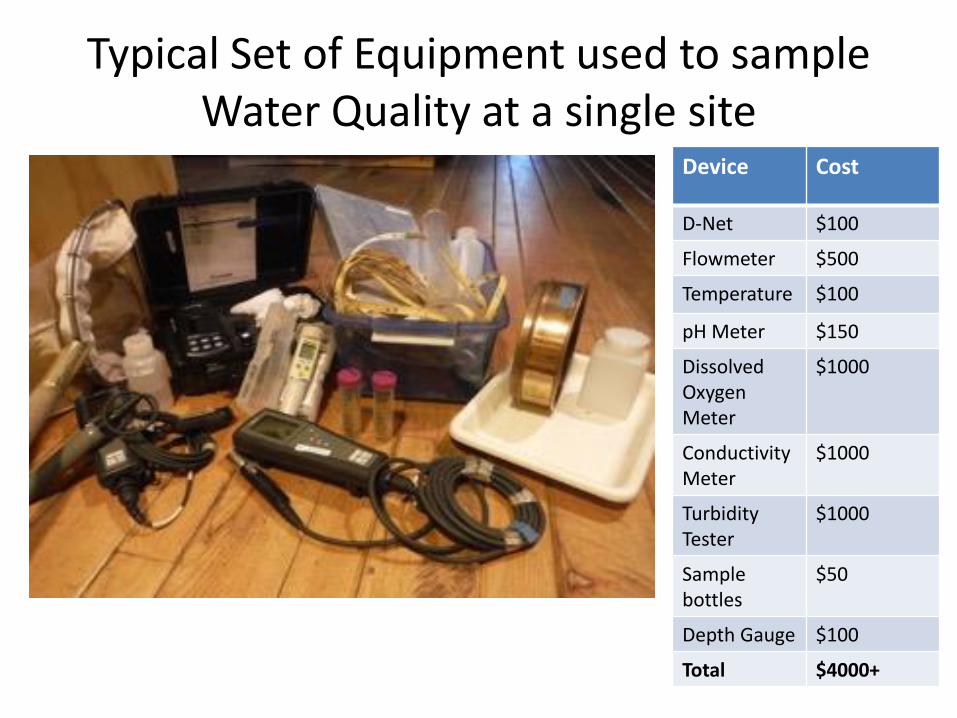
Typical Set of Equipment used to sample Water Quality at a single site
Device Cost
D-Net $100
Flowmeter $500
Temperature $100
pH Meter $150
Dissolved Oxygen Meter
$1000
Conductivity Meter
$1000
TurbidityTester
$1000
Samplebottles
$50
Depth Gauge $100
Total $4000+
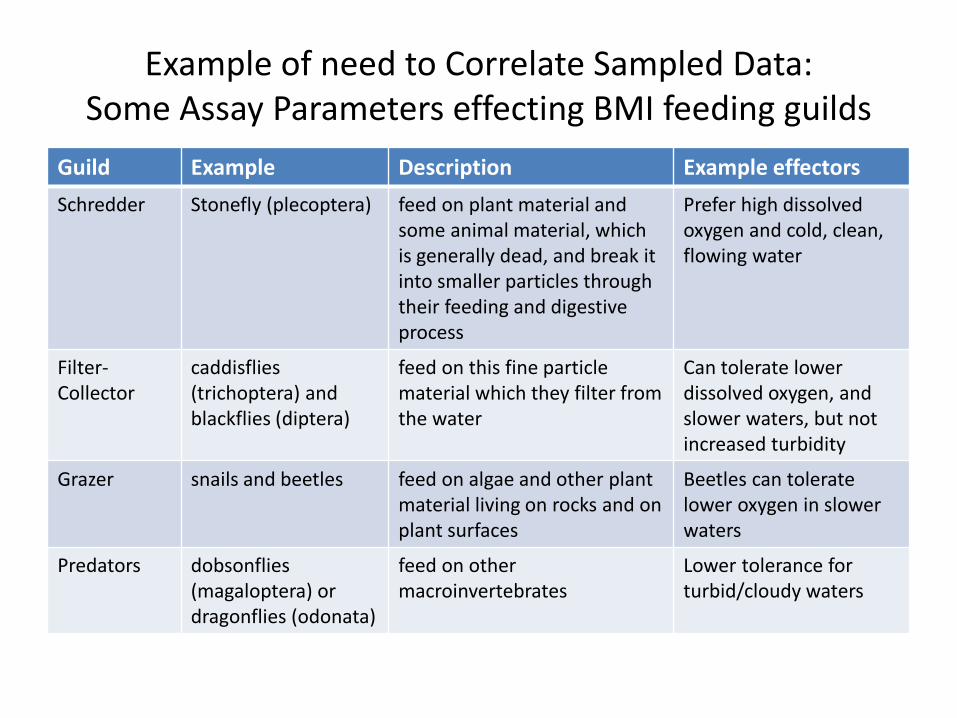
Example of need to Correlate Sampled Data:Some Assay Parameters effecting BMI feeding guilds
Guild Example Description Example effectors
Schredder Stonefly (plecoptera) feed on plant material and some animal material, which is generally dead, and break it into smaller particles through their feeding and digestive process
Prefer high dissolved oxygen and cold, clean, flowing water
Filter-Collector
caddisflies(trichoptera) and blackflies (diptera)
feed on this fine particle material which they filter from the water
Can tolerate lower dissolved oxygen, and slower waters, but not increased turbidity
Grazer snails and beetles feed on algae and other plant material living on rocks and on plant surfaces
Beetles can tolerate lower oxygen in slower waters
Predators dobsonflies (magaloptera) or dragonflies (odonata)
feed on other macroinvertebrates
Lower tolerance for turbid/cloudy waters
Design Proposal
• Integrate multiple sensors and sampling tools into single
monitoring device which can be easily carried and used
by an individual to collect and record data for multiple
stream assay parameters.
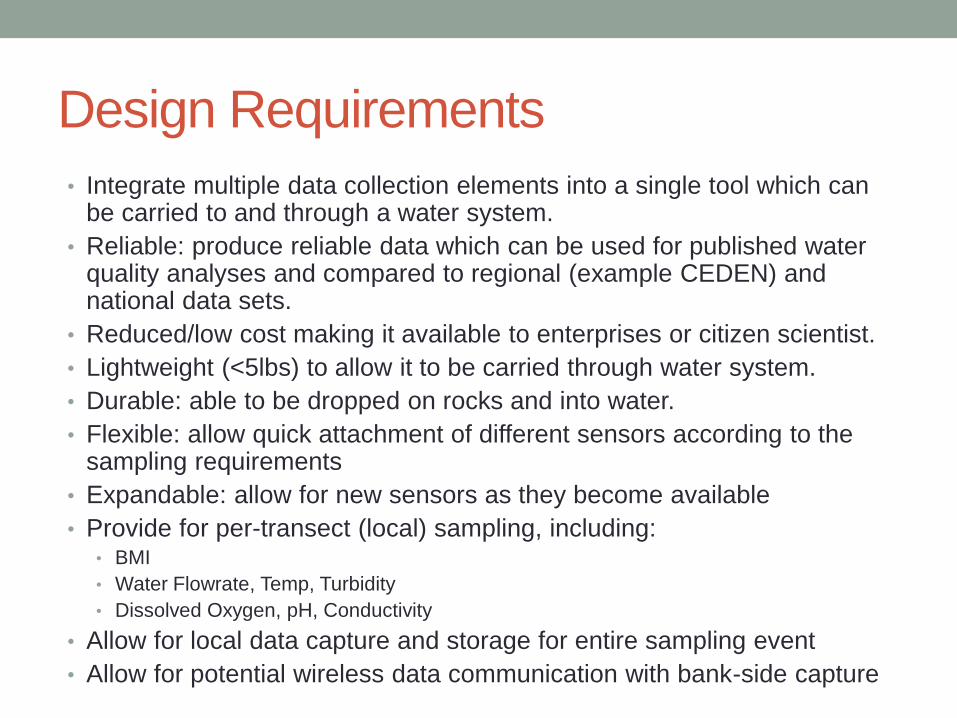
Design Requirements
• Integrate multiple data collection elements into a single tool which can be carried to and through a water system.
• Reliable: produce reliable data which can be used for published water quality analyses and compared to regional (example CEDEN) and national data sets.
• Reduced/low cost making it available to enterprises or citizen scientist.
• Lightweight (<5lbs) to allow it to be carried through water system.
• Durable: able to be dropped on rocks and into water.
• Flexible: allow quick attachment of different sensors according to the sampling requirements
• Expandable: allow for new sensors as they become available
• Provide for per-transect (local) sampling, including:• BMI
• Water Flowrate, Temp, Turbidity
• Dissolved Oxygen, pH, Conductivity
• Allow for local data capture and storage for entire sampling event
• Allow for potential wireless data communication with bank-side capture

Design
Diagram
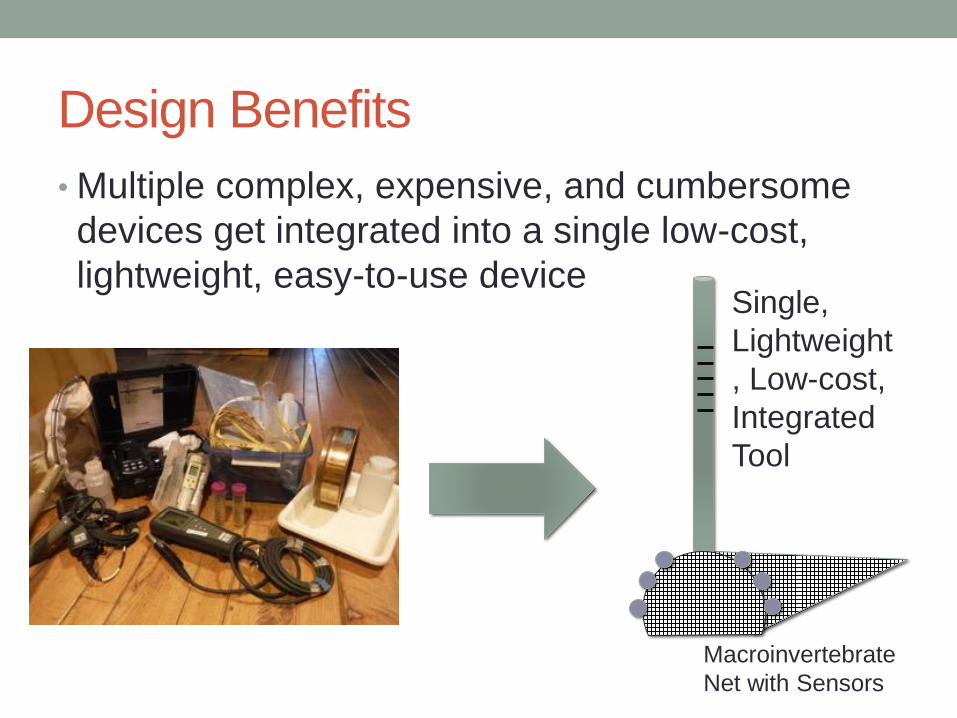
Design Benefits
• Multiple complex, expensive, and cumbersome
devices get integrated into a single low-cost,
lightweight, easy-to-use deviceSingle,
Lightweight
, Low-cost,
Integrated
Tool
Macroinvertebrate
Net with Sensors
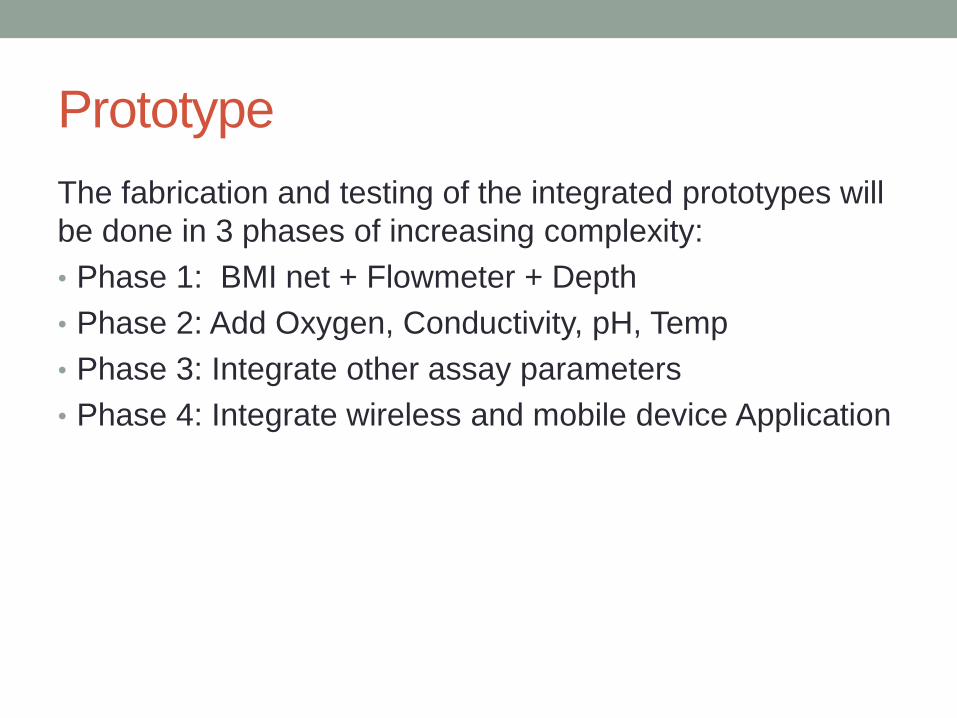
Prototype
The fabrication and testing of the integrated prototypes will
be done in 3 phases of increasing complexity:
• Phase 1: BMI net + Flowmeter + Depth
• Phase 2: Add Oxygen, Conductivity, pH, Temp
• Phase 3: Integrate other assay parameters
• Phase 4: Integrate wireless and mobile device Application
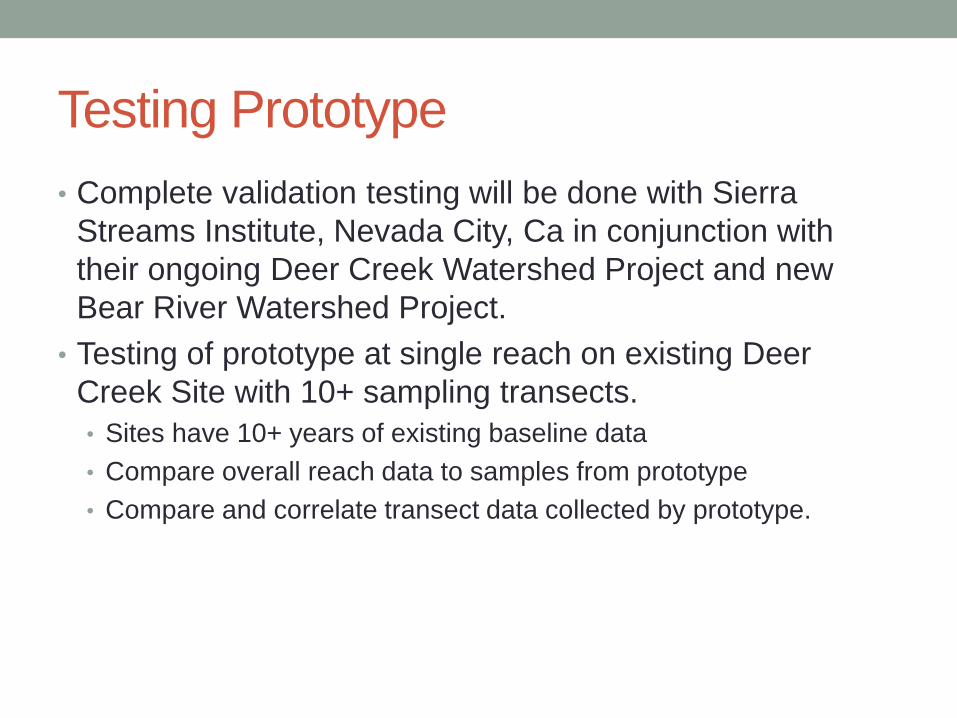
Testing Prototype
• Complete validation testing will be done with Sierra
Streams Institute, Nevada City, Ca in conjunction with
their ongoing Deer Creek Watershed Project and new
Bear River Watershed Project.
• Testing of prototype at single reach on existing Deer
Creek Site with 10+ sampling transects.
• Sites have 10+ years of existing baseline data
• Compare overall reach data to samples from prototype
• Compare and correlate transect data collected by prototype.
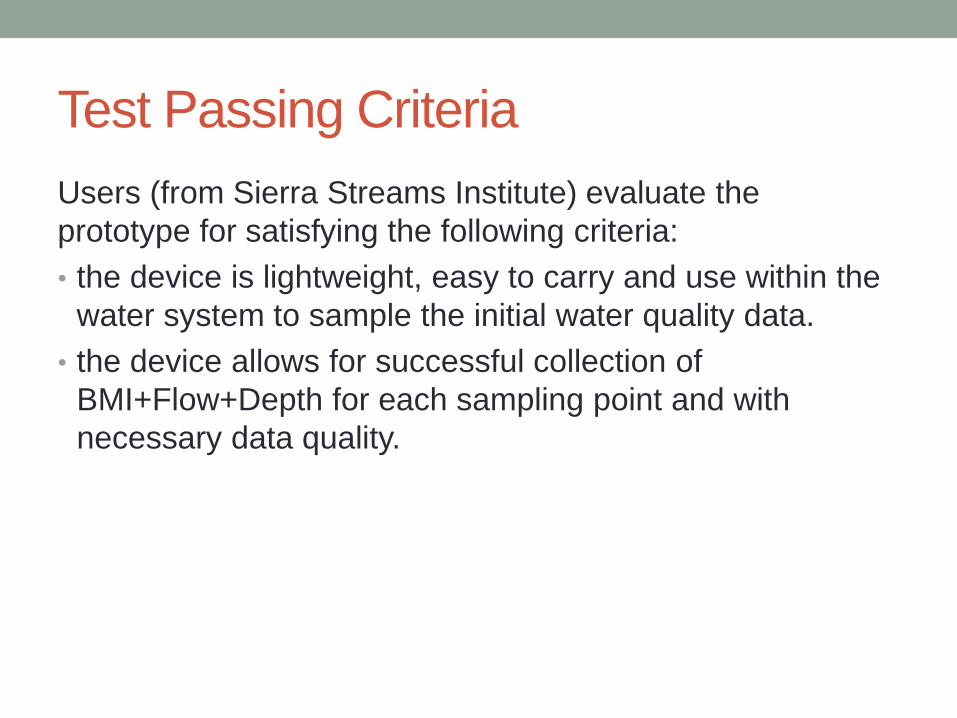
Test Passing Criteria
Users (from Sierra Streams Institute) evaluate the
prototype for satisfying the following criteria:
• the device is lightweight, easy to carry and use within the
water system to sample the initial water quality data.
• the device allows for successful collection of
BMI+Flow+Depth for each sampling point and with
necessary data quality.
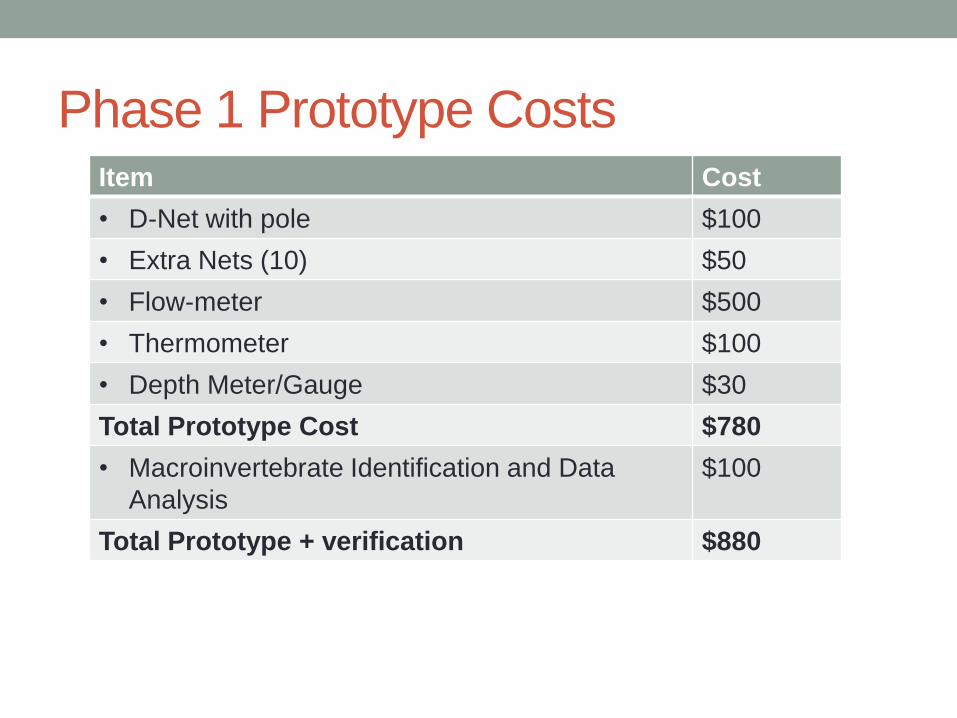
Phase 1 Prototype CostsItem Cost
• D-Net with pole $100
• Extra Nets (10) $50
• Flow-meter $500
• Thermometer $100
• Depth Meter/Gauge $30
Total Prototype Cost $780
• Macroinvertebrate Identification and Data
Analysis
$100
Total Prototype + verification $880
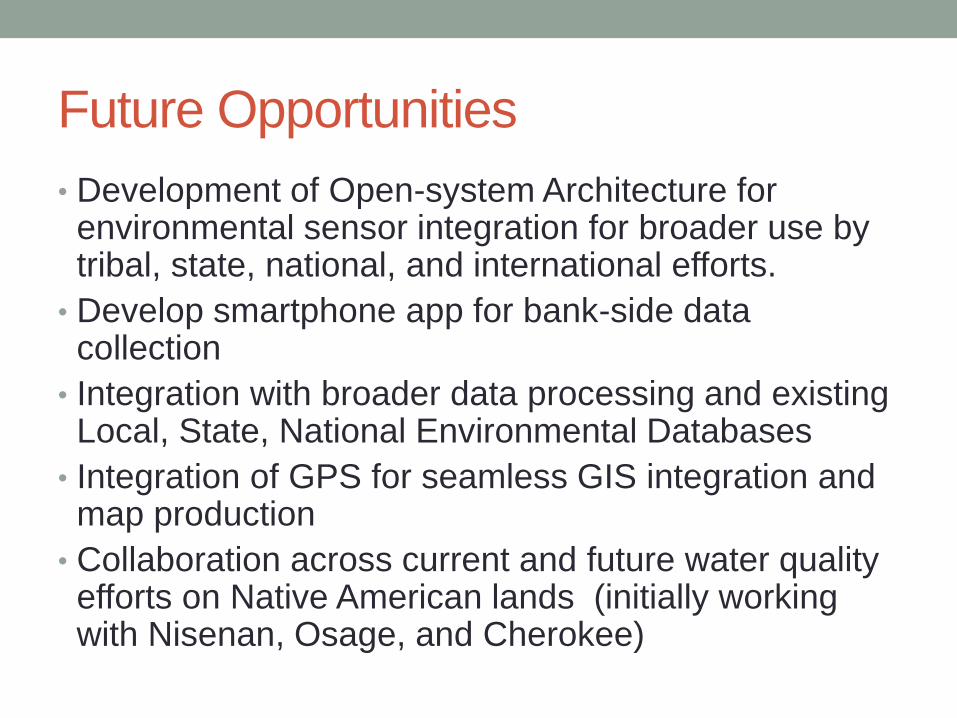
Future Opportunities
• Development of Open-system Architecture for environmental sensor integration for broader use by tribal, state, national, and international efforts.
• Develop smartphone app for bank-side data collection
• Integration with broader data processing and existing Local, State, National Environmental Databases
• Integration of GPS for seamless GIS integration and map production
• Collaboration across current and future water quality efforts on Native American lands (initially working with Nisenan, Osage, and Cherokee)
References1. http://energy.gov/science-innovation/energy-sources/renewable-energy
2. http://www2.epa.gov/planandbudget/strategicplan
3. http://apps1.eere.energy.gov/tribalenergy/
4. http://www2.epa.gov/wqs-tech/epa-approvals-tribal-water-quality-standards
5. Niels H. TroelstrupJr., Garv L. Hergenrader Effect of hydropower peaking flow fluctuations on community structure
and feeding guilds of invertebrates colonizing artificial substrates in a large impounded river. Hydrobiologia July 1990,
Volume 199, Issue 3, pp 217-228
6. Harris, Richard R., Carl A. Fox, and Roland Risser. "Impacts of Hydroelectric Development on Riparian Vegetation in
the Sierra Nevada Region, California, USA.
7. Knopf, Fritz L., R. Roy Johnson, Terrell Rich, Fred B. Samson, and Robert C. Szaro. "Conservation of Riparian
Ecosystems in the United States." The Wilson Bulletin 100.2 (1998): 272-84. JSTOR. Wilson Ornithological Society.
Web. 2 June 2010. <http://www.jstor.org/stable/4162566>.
8. http://www2.epa.gov/cleanwaterrule/documents-related-clean-water-rule
9. http://www.waterboards.ca.gov/water_issues/programs/swamp/docs/reports/2010_swamp_strat_full_rpt_append.pdf
10. http://www.waterboards.ca.gov/water_issues/programs/swamp/docs/reports/2010_swamp_strat_full_rpt_append.pdf
11. Armitage PD. 1984. Environmental changes induced by stream regulation and their effect on lotic
macroinvertebrate communities. In Regulated Rivers, Lillehammer A, Saltveit SJ (eds). Oslo University Press: Oslo,
Norway; 139–165.
Thank You