a journal of social sciences
TRANSCRIPT


A Journal of Social SciencesNo. 2/2015, Volume-VI
July 2015Editorial Board
Editor-in-Chief
Editor
Executive Editor
Managing Editor
Consulting Editors
Review Editors
Dr. Vandana YadavArchana Yadav
Dr. Rachna Yadav
Dr. B S Yadav
Dr. Subhash Anand
Co-EditorDr. Humayun Masood
Dr. Krishan K Yadav
Dr. Priyanka Sharma
Dr. Nandini Sharma
Dr. Phool ChandDr. Sachi RanaAsheref Illiyan
Dr.
Shodh evam Shaikshnik Samiti (regd.)Gulaothi, (Bulandshahr), Uttar Pradesh, India
SUBSCRIPTION RATES:Three Years : 2500.00Two Years : 1800.00One Year : 1000.00
Period of Publication:Half Yearly
Towards light
ISSN-0975-5535

Advisory BoardProf. N.K. Taneja, V.C., C.C.S. University, Meerut.Prof. Sushma Yadav, Pro-V.C., IGNOU, New Delhi.Prof. H. S. Singh, Pro-V.C., C.C.S. University, Meerut.Prof. R.B. Singh, Delhi School of Economics, University of Delhi, Delhi.Prof. N. Nagabhushanam, S.V. University, Tirupati.Prof. K. V. Bhanumurthy, Delhi School of Economics, University of Delhi, Delhi.Prof. M.A. Khan, Jamia Millia Islamia University, New Delhi.Prof. S.K. Yadav, NCERT, New Delhi.Prof. Prahlad Kumar, Allahabad University, Allahabad.Prof. Anjali Bahuguna, H.N.B. Garhwal University, Srinagar, Garhwal, Uttrakhand.Prof. S.C. Rai, Delhi School of Economics, University of Delhi, Delhi.Prof. B.S. Mann, Panjabi University, Patiala.Prof. Saroj Yadav, NCERT, New Delhi.Prof. S. B. Dahiya, M.D. University, Rohtak.Prof. A. K. Mittal, Aligarh Muslim University, Aligarh.Prof. R. K. Mittal, IPGGS University, New Delhi.Prof. S. S. Chahar, M.D. University, Rohtak.Dr. K. D. Gaur, ICSSR, New DelhiProf. Atveer Singh, C.C.S. University, Meerut.Dr. Paramjit, Delhi School of Economics, University of Delhi, DelhiDr. P.K. Singla, Panjabi University, Patiala.Dr. D. Saharia, University of Guwahati, Assam.Dr. Manju Goyal, S.D. College, Ghaziabad.Dr. Kishor H. Nehete, A.D.P.M.'s Women College, Jalgaon, Maharashtra.Dr. Jitendra Kumar Sharma, GGDSD (PG) College, Palwal, HaryanaDr. K.K. Sharma, M.M.P.G. College, Modinagar (U.P.)Dr. Kamalvir Tyagi, M.M.H. College, GhaziabadDr. Shivkant Yadav, D.A.V. (PG) College, Bulandshahr.Dr. Dushyant Kumar, A.S.P.G. College, Lakhaoti, Bulandshahr.Dr. K.C. Arya, Hindu College, Moradabad. (U.P.).Dr. Vipin Jain, TMU, Moradabad (U.P.).Dr. Rakesh Yadav, I.F.T.M. University, Moradabad (U.P.).Dr. Ajay Kumar Tyagi, IAMR, Ghaziabad (U.P.).Mrs. Poonam Goyal, Reliable Group of Institutions, Ghaziabad (U.P.)Dr. U.C. Aggarwal, RIMT, Ghaziabad.Dr. Rosy Mishra, M.M.H. College, Ghaziabad (U.P.).Dr. Vineet Kumar Singhal, RIMT, Ghaziabad (U.P.)Dr. Suman Chauhan, H.L.M. Group of Institutions, Ghaziabad, U.P.Dr.. Anju Saxena Sunderdeep Group of Institutions, Ghaziabad, U.P.Dr. D.N. Sharma, D.N. P.G. College, Gulaothi (Bulandshahr), U.P.Dr. Anjali Rajora, Saudi Electronic University, Riyadh, Saudi Arabia.Mr. Dheeraj Garg, RIMT, Ghaziabad (U.P.)Mrs. Menaka Biswal, RIMT, Ghaziabad (U.P.)Dr. Kush Kumar, RIMT, Ghaziabad (U.P.)

Shodh Evam Shaikshanik Samiti (Regd.)Gulaothi - 245408 (Bulandshahr), Uttar Pradesh, India
Subscription FormName : ..............................................................................................................
Address : ..............................................................................................................
................................................................................................................
.................................................................PIN.........................................
Phone : ..............................................................................................................
E-mail : ..............................................................................................................
Institution : ..............................................................................................................
................................................................................................................
.................................................................PIN.........................................
Send this form with payment to :Dr. B.S. Yadav
H.No. 363, Niti Khand-IIIIndrapuram, Ghaziabad, U.P.
Mob.: 09412471964, 09818465104
The subscribers will receive hard copy of every issue of the journal, for the subscribed period.
Amount subscribed ............................................. for a period of 1 / 2 / 3 Year(s)
vide Cheque / D.D. No. ..................................................Dated.................................
drawn on...................................................................................................................
.................................................................................................................................
(Name & address of Bank) in favour of 'Shodh evam Shaikshnik Samiti' payable at Gulaothi, Distt. Bulandshahr, Uttar Pradesh.
Note : Use Xerox Copy of the Form.
(Signature of Subscriber)Dated.................................

Contents
1. Incorporating a Macroeconomic K.V. Bhanu Murthy 1-17
Framework into the General
Theory of FDI
2. Role of Religion in the Private and Sabista Anjum 18-33
Public Life of Educated Muslim J.K. Pundir
Women in a Religious Town Anjula Gupta
3. Role of Micro Finance in Financial Priyanka Sharma 34-51
Inclusion & Poverty Alleviation
in India
4. Growth of India's Agricultural and K.V. Bhanu Murthy 52-68
Non-Agricultural Trade Balance: A Phool Chand
Policy Period Analysis
5. A Study of Pros and Cons of Rural Pooja Jaising 69-75
Retailing in India
6. A Study of Compositional Changes in Shivangi 76-90
India's Foreign Trade During The
Economic Reforms Period
7. Emerging Issue of Electronic Waste Asheref Illiyan 91-95
(E-Waste) and Policy Response
in India
8. Mahatma Gandhi National Rural Danish Masoud 96-101
Employment Guarantee Act: An Anjali Bahuguna
Overview
9. Communication and Rural Development Sudhir Kumar 102-108
Programmes in Meerut in the Era of
Globalization
10. Role of Micro Financing in the Financial Satyavrat Singh Rawat 109-119
Inclusion and the Process of Capacity
Building in the Bulandshahr District of
Uttar Pradesh
S.No. Title Authors Page No.

11. Trends and Patterns of Foreign Direct Geeta Rani 120-132
Investment (FDI) in India in the Post
Reforms Period
12. Book Review Neha Nainwal 133-144
13. Book Review Phool Chand 135-136
14. Some Aspects on Prevailing Trends of Om Jee Ranjan 137-148
Borrowing Money with Special Reference B.W. Pandey
to an Remote Rural area in Arunachal Subhash Anand
Pradesh
15. Assessment of Spatio-Temporal Expansion Subhash Anand 149-158
of Delhi Metro Rail Pankaj Kumar Azad
Ashwajeet Chaudhary
16. Status and Role of Women in District Naresh Yadav 159-170
Politics
S.No. Title Authors Page No.

The Horizon - A Journal of Social SciencesNo.-II/2015, Volume-VI, July 2015, pp. 1-17ISSN-0975-5535
I. INTRODUCTION
The existing approach to the MNE theory treats the decision of a firm to go international as an extension of the firm theory. The general theory of FDI as given by Buckley and Casson (1976) works on two principles:(a) firms internalize missing or imperfect external markets until the costs of further internalization outweigh the benefits and (b) firms choose locations for their constituent activities that minimize the overall costs of their operations. Dunning’s eclectic paradigm (Dunning, 1977, 1993) of ownership, location and internalization (OLI) advantages focuses on the sources of competitive advantage that allow a firm to compete abroad, the locational choices that firms make, and the mode of entry into foreign markets.
Conventionally, location theory has been viewed as an integral part of the eclectic paradigm (Dunning, 1988, Dunning 1998). In this paper, we wish to emphasize the need for broadening the framework of the general theory of FDI to take account of three dimensions and it is through such a new framework that we wish to augment Dunning’s eclectic approach.
The four dimensions of the proposed new framework consist of:
1. the new international business environment;
2. the macroeconomic framework;
3. tax incentives; and
4. endogenous and exogenous Macro-economic factors
The intention of the paper is to augment and refine our understanding of the general theory of FDI in this new context. All of the above have not been considered in FDI theory, hitherto. This new framework could completely change the outlook on explaining the new patterns in global FDI.
Layout
The structure of the paper is as follows. Section II deals with the theoretical
INCORPORATING A MACROECONOMIC FRAMEWORK INTO THE GENERAL THEORY OF FDI
K. V. Bhanu MurthyProfessor
Department of CommerceDelhi School of Economics
University of Delhi

2
framework which sets the context for revisiting the general theory of FDI. Section III reviews the existing literature. Section IV gives the conclusions.
II. THEORETICAL FRAMEWORK
The extant general theory of FDI is based on firm theory, managerial and organizational theory, and location theory. In the ordinary case, a firm evolves by virtue of substitution of the market by internal processes (Williamson, 1975; Arrow, 1969). In the case of a potential MNE which is involved in international business a similar question arises. The firm, then, has to choose whether it would continue to rely on external processes through the market or internalize the processes through the formation of a MNE (Dunning 1980, 1988). Hence, in such a case, this decision immediately leads to two things: internalization as well as internationalization (Hymer, 1960). Dunning (1993) suggests three primary motives behind undertaking FDI: resource-seeking (including strategic-asset seeking), market-seeking and efficiency-seeking. The location-specific determinants are included in the eclectic paradigm of Dunning (1980).
The rationale for revisiting general theory of FDI is based on four perspectives: first that emphasizes the significance of a macroeconomic framework as opposed to a firm-centric framework; second that is based on some radical changes in the global economy; and third, international taxation and fourth that exogenous and endogenous macro-economic factors affect FDI inflows and outflows in developing countries all of which have consequences for FDI theory.
The critical basis for revisiting general theory of FDI can be summed up as follows:
i. FDI theory which has been primarily established with developed countries being viewed as the home country is no longer true. Developing countries have also now become important sources of FDI ;
ii. FDI decisions can no longer be viewed as a singular investment decision. It needs to be understood as a switching decision between investment in the home country vis-à-vis the host country;
iii. FDI decisions do not arise out of production theory but depend upon investment theory and expectations.
iv. Outward and inward FDI may be jointly governed by exogenous and endogenous macro-economic factors.
(a) The New International Business Environment
There is an existing thinking about the need to incorporate changes in the general theory of FDI on account of “the changing world economic scenario for international
K. V. Bhanu Murthy

3
business activity” (Dunning, 1998). Thus, Dunning’s statement lends support to our new framework of FDI theory. FDI theory has been driven by a developed country perspective because most of the FDI flows have originally been amongst developed countries save the case of colonial period (resource-seeking). Today FDI flows to developing countries have been increasing in other avenues of investment.
In the new context, there is greater openness as a consequence of liberalization and globalization. The internal markets of developing countries (host country) have become more attractive for investing and in turn, they have themselves become more capable of deploying the flow of FDI resources into other host countries, which leads to optimal allocation of global resources and consequent economic activity leading to global economic welfare .
(b) Macro Economic Framework
In the following analysis, we would be considering two aspects of the macroeconomic framework: (i) nature of investment decisions, and (ii) expectational variables.
Our approach to incorporating the macroeconomic framework into MNE theory arises out of a critical examination of Dunning (1998) wherein the author refers to ‘macroeconomic aspects of the changing international allocation of economic activity’. Dunning’s paper argues that the general understanding of literature, as per trade theory, is that ‘the changes in geography of FDI over the last two decades have been broadly in line with the capital expenditure of all firms (sic) - MNE or otherwise’.
He points out that: ‘this could mean that ownership or multinationality of firms was not a significant variable in explaining such changes and that …..internalized and controlled by MNEs, is no differently determined than trade between independent firms…’ (Dunning, 1998, pp. 55).
As per Dunning FDI would in fact have a differential impact on the geography of investment and economic activity.
Thus, MNE theory believes that FDI decisions are firm-centric and not influenced by the general theory of trade and investment. We wish to emphasize that while trade theory may not be an adequate explanation for international allocation of economic activity in the context of FDI, macroeconomics needs to be revisited for obtaining a better understanding of such investment decisions. This brings us to a debate on the nature of investment decisions of multinational enterprises.
(i) Nature of Investment Decisions
We wish to reiterate that multinational enterprise theory is based on a firm-centric approach. Firm theory states that firms exist because it benefits them to internalize
Incorporating a Macroeconomic Framework into The General Theory Of FDI

4
transactions which otherwise would have been carried out through the market mechanism. MNE theory is hence an extension of basic firm theory in the sense that the internalization process is extended beyond borders. A crucial distinction that needs to be made, to enhance our understanding of MNE theory as a theory of FDI, is the distinction between production decisions and investment decisions. The essential argument of internalization rests upon considerations of current production and cost, which in turn, have implications for current profits but do not explain long-term profits. Therefore, it appears that there is a need to look into a possible gap in our understanding arising out of the difference between the nature of production decisions and investment decisions.
While acknowledging the plethora of theories that explain investment demand, our attempt is to restrict the analysis to the theory of long-term profits and the accelerator theory while attempting to explain FDI theory. Here again, there is a need to revisit the essential argument that MNE theory rests upon. It appears as though once the firm has decided to go abroad the actual FDI flow is immediate and automatic. This notion perhaps arises out of equating the nature of production decisions and investment decisions. Although both decisions are essentially ex-ante, production decision remains so only for the market period while supply is unable to adjust to demand. Unlike production decisions, investment decisions remain ex-ante for a longer period because they take a longer time to be implemented. Actual investment occurs due to a combination of ex-ante and ex-post factors. Therefore, the actual investment (FDI) would not be forthcoming unless other conditions are satisfied.
Another aspect of the nature of investment decisions that distinguishes them from production decisions is the choices involved in the decision-making process. As for production decisions, the choices are in respect of factor substitution and production plan for the short-run. Such a choice, however, does not involve an ex-ante comparison between alternative lines of production or different projects. Essentially, investment decisions are based on the relative criterion of return on alternative investment projects. This principle of investment decisions cannot be restricted to the framework of decision-making within the home country but must be extended to investment decisions in the host country as well. This brings us to an essential framework of decision-making in the case of FDI that is based on the macro-theoretic conceptualization of FDI theory as is being proposed in this work.
In the light of the above enunciation, unlike production decisions, these are the other factors which influence investment decisions:
1. Long-term profits
2. Derived demand – Accelerator theory
3. Avenues of investment
4. Inducement to invest
K. V. Bhanu Murthy

5
5. Conditions of the capital goods industry
Long-term Profits: Production decisions are based on current profits while investment decisions are based on future profits or long-term profits. The process of internalization affects current costs and hence shall influence current profits and not long-term profits. On the other hand, actual FDI emanating from any ex-ante decision to internalize through horizontal or vertical integration abroad would be dependent on long-term profits. It also is circumscribed by the supply conditions in the capital goods producing sector of the home country, which shall be considered in the further discussion. It is obvious that investment decisions arise out of future profits which particularly in the case of FDI relate to investments carried out abroad. It has also been pointed out that investment spending will be undertaken only with the expectation of profit, that is, future profits but such an explanation of investment cannot account for the actual volume of investment (ex-post) and the time at which such investment would be forthcoming.
Derived Demand: The accelerator theory points out that first, ex-ante investment demand is derived demand; second, the incentive to acquire more capital goods arises not because current profit record is favorable but because increase in output puts a pressure on the firm’s existing productive capacity. To take advantage of new demand, firms are forced to acquire new productive capacity. Especially in the case of FDI, such new demand has to arise out of the host country. Also, in any case, excess capacity in the home country cannot be used for meeting ‘host country demand’ for goods. Such an understanding of investment decisions help in shifting the focus of FDI theory from being firm-centric to country-centric. The apparent shortcoming of existing FDI theory is that it treats internalization and the consequent cost saving as a sufficient condition to result in the actual flow of FDI. The extant MNE theory does not consider the other conditions which govern the emergence of an ex-ante investment decision. There are three necessary conditions for prompting an ex-ante investment decision. The accelerator theory lays down the primary condition which is the existence of derived demand. The second is the avenues of investment available in the host country, while the third necessary condition is the inducement to invest.
Avenues of Investment: The general theory of FDI rests upon a central principle of internalization. This could happen either through vertical integration or horizontal integration. In either case, the implication is that the nature of industry of the parent firm remains the same. The moment we consider FDI as an independent proposition driven by future profits, such investment decisions would depend upon the avenue of investment. In this sense, while a firm may be having high current profits in the present industry, it would not ensure that future profits in any potential investment, not necessarily in the same industry, would also be high. The general theory of FDI emphasizes ownership as one of the factors which results in an advantage to the home
Incorporating a Macroeconomic Framework into The General Theory Of FDI

6
country firm due to the experience, efficiency, and managerial talent in a particular industry. Second, location pertains to host country which implies that FDI in the host country is governed by the investment environment of the host country. This, amongst other things such as policy, depends upon the avenue of investment in the host country. FDI could flow to any diversified industry in the host country, not necessarily arising out of a firm in the home country whose advantage lies in a particular industry.
In as much as ex-ante investment decisions are in the nature of project investment decisions, the specific avenue of investment is a major determinant of such a decision. Particularly in the case of ‘greenfield’ investments, the potential for a new investment project of the kind being envisaged by the home country MNE should exist in the host country. Further, not all avenues (industries) would yield the same rate of long-term profit. Therefore, this consideration has to be supplemented by the required expectation of return being met. This brings us to the notion of inducement to invest.
Inducement to Invest: The general theory of FDI is based on supply side economics – supply of capital. In other words, it focuses on firm theory and behavior which explains what causes the supply of FDI outflows from the home countries , which is usually seen to be developed markets. So, it has a home country perspective as well as firm perspective. The actual FDI flows from the home country to the host country would be a summation of the individual investment decisions of all those firms who from the home country would decide to invest abroad (the host country).
The macroeconomic perspective, therefore, would require us to look at the inducement to invest from the point of view of the host country economy and not just the firm perspective. The inducement to invest arises on account of derived demand. Demand for products leads to demand for capital stock which, in other words, is the ex-ante demand for investment. If we look at FDI as investment in a project, then it is the inducement to invest or marginal efficiency of capital (MEC) which determines the demand for investment. While this demand is potential demand, it gets translated into actual demand only if ex-post investment actually takes place.
Conditions of the capital goods industry: Whether investment actually takes place or not would depend on two things:
(1) Do the supply conditions of capital goods market support the actualization of potential demand?
(2) Is the expected rate of return realizable by the potential investor?
In respect of the first factor, it needs to be mentioned that the capital goods producing sector operates under two constraints. Firstly, there is an overall constraint on the productive capacity and secondly, as demand for capital goods increases, the price of
K. V. Bhanu Murthy

7
capital goods rises. This results in an increase in the initial capital cost (K0). Consequently, the IRR (internal rate of return) would fall and hence only such projects would be viable whose IRR is greater than the market rate of interest. In such an eventuality, the expected rate of return may not be realizable. This is on account of the second factor stated above. In the net, the two factors would determine the volume of ex-post investment by virtue of an interaction between the ex-ante demand conditions and the ex-post supply conditions.
In the case of FDI outflow, there is a separation between the demand and supply side. While the ex-ante demand for investment comes from the host country, the ex-post volume of investment is governed by supply conditions in the capital goods producing sector in the home country. It could be realistically assumed that ‘greenfield’ investments are prompted by the prospect of MNEs promoting investment through transfer of own technology. This would clearly imply that the ex-post supply conditions of the capital goods producing sector in the home country would dominate the ex-ante investment demand arising from the host country, in determining the ex-post volume of investment, namely, the actual flow of FDI to the host country. The supply conditions depend on savings from personal disposable income per capita income) and the cost and production constraints in the capital goods producing sector in the home country.
(ii) Expectational Variables
The theory of investment rests upon ‘inducement to invest’, which in turn, is determined by the ‘accelerator theory and long-term profits’. The explicit macroeconomic variables are derived investment demand and long-term profits. The two characteristics of these variables are that they are expectational variables and are in the form of rates. Derived investment demand, depends upon the rate of GDP growth. With a higher growth rate of GDP, the expectations of businesses of earning higher long-term profits are higher. Future profits depend upon expectations.
The theoretical formulation regarding the treatment of these macroeconomic variables while analyzing investment in general and FDI in particular, rests upon the fundamental basis as laid out in Chapter 12 of Keynes’ ‘The General Theory of Employment, Interest and Money: The State of Long Term Expectation’. Keynes defines the state of long-term expectation as ‘the state of psychological expectation which covers … future changes in the type and quantity of the stock of capital-assets and in the tastes of the consumer, the strength of effective demand from time to time during the life of the investment under consideration, and the changes in the wage-unit in terms of money which may occur during its life’ (Keynes, 1936, 147–8).
Long-term expectations do not solely depend upon the most probable forecast we can make — they also depend on the confidence with which we can make this forecast. The state of confidence is a matter to which practical men always pay the closest and
Incorporating a Macroeconomic Framework into The General Theory Of FDI

8
most anxious attention. Confidence depends upon the perception and assessment of the trend in the economy and the market. The trend is always assessed on the basis of the rate of change of any macroeconomic variable, particularly interest rate, national income, or stock prices.
There is a need to revisit MNE theory in the light of the various strands of arguments enlisted above. It is evident that the existing MNE theory is not comprehensive enough and ignores two aspects – the relative framework of FDI decisions and the larger macroeconomic framework including the open economy framework. The implications of our proposed theoretical formulation are dual.
(i) The first dimension which relates to the basis on which investment decisions are taken, has two aspects - the expectational variables and the relative framework of decision-making. Here, the extant notion of MNE theory emphasizes the absolute size of the market in terms of GDP, as a measure of current demand. It neither rests upon relative market size of home country to host country nor does it depend upon future demand for goods. The decision to go abroad is essentially an investment decision. Such decisions are only, in part, firm-centric. In such a context, ‘the decision to go abroad’ depends upon the choice between investing in the home country versus the host country, assuming that there is a natural limit on investible funds. It therefore becomes evident that the ex-ante demand for investment arises out of the ‘accelerator principle’ coupled with the relative return between the home and host country. In as much as expectations and future profits are determinants of such investment decisions, an appropriate variable which captures both while it rests upon market size (GDP) needs to be developed, which is measured as an expectational variable. The appropriate variable that represents the ‘accelerator’ in the relative form would be the log of the ratio of GDP of the home country to the GDP of the host country. Hence, if the growth in GDP of the home country as measured by log GDP (home) is high vis-à-vis the growth in GDP of the host country as measured by log GDP (host), it would discourage capital flows.
(ii) The second dimension rests upon ‘open economy macroeconomics’ whereby the international capital flows depend upon net savings. The supply of capital would depend upon the potential for net savings in the home country. This, in turn, depends upon the expectation of relative incomes (GDP per capita). Correspondingly, there is a need for adequate absorptive capacity in the host country. In the host country, if GDP growth is high, it would lead to higher investment demand. On the other hand, if per capita GDP is low, it would lead to a lower savings potential. This creates the necessary gap between investment demand and domestic supply of savings. The appropriate variable that represents this phenomenon in the relative form would be the log of the ratio of GDP per capita of the home country to the GDP per capita of the host country. Hence, if the
K. V. Bhanu Murthy

9
growth in GDP per capita of the home country as measured by log GDP per capita (home) is high vis-à-vis the growth in GDP per capita of the host country as measured by log GDP per capita (host), it would encourage capital flows.
A Digression on Measurement
If we consider FDI flows to be a dynamic variable, then it is not just based on level variables; rather it would be based on expectational variables (driven by expectations). The measurement, therefore, has to reflect rate of change and the determinants have to be measured in ratio form. Therefore, a double log model consisting of a set of determinants has been used each of which is two variables in ratio form. This captures both the dynamic as well as comparative effects which drive FDI decisions. With such a functional form of the estimating equation, the parameters, namely, the coefficients assume an inherent structure.
The function is measured as:
Log Z = f [Log (X /Y ), Log (X2/Y2),……..]1 1
= f [(Log X – Log Y ), ………….] ………….(1)1 1
The estimated equation is measured as:
Log Z = á + â Log (X /Y ) + ……. ................(2)1 1
Each partial elasticity is measured as:
â= [(ÄLogZ) / Ä (Log X – Log Y )] ………….(3)1 1
where Log Y and Log X represent rates of change, respectively, and are, hence, expectational variables. In difference form, the variable (Log Y - Log X) represents the relative expectations of the two factors (X and Y), and acts as a joint determinant of FDI. Additional FDI (ÄZ), therefore, is prompted to flow in either direction as a
switching decision. The ex-ante demand for FDI inflows is represented by the log of the ratio of GDP of home country to host country. If the ratio is greater than 1, then it switches in favor of the home country and against the host country. Similarly, the supply of FDI inflows into the host country is represented by the log of the ratio of GDP per capita of home country to host country. Given the fact that the home countries are mostly developed countries their average propensity to consume (APC) would be low. Therefore, there would be more of savings to allow greater FDI outflow. In this case, if the ratio is greater than 1, then the supply emanates from the home country. Hence, the sign would be positive for this variable. The net FDI inflow is a product of both ex-ante demand and supply.
To revert to our modeling of FDI flows and their determinants, we have also argued for including both log of GDP and log of GDP per capita. However, such an inclusion does not run the risk of loss of interpretation. The purpose of including log of GDP in
Incorporating a Macroeconomic Framework into The General Theory Of FDI

10
ratio form is to measure investment demand while the purpose of including log of GDP per capita in ratio form is to measure supply of capital. It is conceivable that the two factors, supply and demand, may move in different directions if the partial elasticities bear different signs. The net effect on FDI flows would still be appropriately captured.
Henceforth, in as much as investment decisions are a product of a broad spectrum of expectational variables set in a relative decision-making framework, any explanatory framework for determining FDI flows needs to be formulated in the above manner by incorporating a set of such expectational variables.
(c) Tax Incentives
A specific dimension that merits attention in the new framework of FDI theory is the tax advantage. In the era preceding liberalization and globalization, there were other factors which influenced FDI behavior like distance, resources and openness. With globalization and liberalization, openness is a given datum. However, the specific policy environment is a new consideration which is largely incorporated in fiscal policy and taxation. Tax advantages have different implications for the home country and the host country. As for the host country, especially developing countries, the challenge as host countries is to find a suitable balance between receiving a share of revenues from foreign affiliates operating in their territory and maintaining a climate that attracts FDI. In this respect, it is generally assumed that having a smaller share of revenues as a result of tax concessions would, in the long-run, be compensated for by increased inflows of FDI. For capital-exporting home countries, it is an important factor that keeps their firms internationally competitive by allowing them to benefit from tax concessions in a host country.
Here, it is necessary to distinguish between taxation per se and bilateral tax treaties negotiated amongst countries. The extant literature emphasizes taxation as a determinant through the impact of current tax rates. It needs to be pointed out that current tax rates affect current profits. It has been argued in the preceding analysis that FDI is a long-term investment decision and is essentially determined by long-term profits and not current profits. It is in this sense that bilateral tax treaties would play a greater role in determining FDI decisions rather than current tax rates. Bilateral tax treaties have two main aspects: (i) avoidance of international double taxation, and (ii) creation of a favorable investment climate through the absence of both fiscal and legal policy uncertainty.
Such treaties are negotiated and remain in vogue for a long time horizon thereby influencing the long-term return in two ways: First, by raising the return on investment through net profit because a sustained avoidance of double taxation over a long period of time would have the effect of a year to year increase in the profit rate. Second, the policy certainty would have the impact of creating business confidence and hence would positively influence expectations.
K. V. Bhanu Murthy

11
Ex-ante investment decisions and the consequent ex-post volume of investment depend upon the rate of interest and the level of the investment function. The business environment is the most significant influence on the level of investment function. It influences the confidence and long-term expectations. In addition, the economic calculations of expected long-term profits crucially depend upon net profit which implies the incorporation of tax considerations in the economic calculations.
In this manner, bilateral tax treaties relate to both the dimensions of change in international business environment as well as macroeconomic framework. All of the above compels us to include bilateral tax treaties as a new dimension in the general theory of FDI.
(d) Endogenous and Exogenous Macro-Economic Factors
A major lacuna in FDI theory has been that it has ignored macro-economic analysis. FDI theory as it exists is largely multinational enterprise theory which is exclusively based on firm’s theory. The primary basis of multinational enterprise theory relates to internalization theory. Accordingly, the motives for FDI have been identified as:
vResource seeking
vMarket seeking
vEfficiency seeking
It is obvious that these are motives and not factors that determine the emerging patterns of FDI that to they are capable of explaining the patterns belonging to home country developed economies. It does not stand to reason that large developing countries like India or China would lack in resources, market or in cheap labor. The basic multinational enterprise theory arises out of the question: ‘Why do firms go abroad’ (Hymer, (1960)) ?.
The patterns of FDI during the 20th Century and factors that explained the behavior of MNEs al la Hymer are not relevant for developing countries’ economies which are experiencing a new pattern of growth in inward as well as outward FDI. The developing countries like India and China have large markets, domestic resources are abundant and they have cheap labor which leads to efficiency. This factor endowment leads to outward FDI and not inward FDI, in their case.
Therefore, it is necessary the motives for FDI do not exist at least, not in the same measure as developed economies. Hence, it is necessary to evolve a conceptual framework independent of the perspective from developed home country markets.
Endogenous and Exogenous Factors
There are three sets of factors that influence FDI:
1. Host country endogenous factors
2. Home country endogenous factors
Incorporating a Macroeconomic Framework into The General Theory Of FDI

12
3. Exogenous factors
Host country endogenous factors
The main host country endogenous factor is host country GDP. Here the economic logic is that the growth rate of GDP, in some proportion, leads to ex-ante investment demand due to the accelerator effect. The operation of the accelerator-multiplier principle is as follows.
When investment grows capital stock grows:
It = Kt –Kt-1 ………….(1)
It = New Investment in capital stock
Kt = Current Capital Stock
Kt-1 = Old Capital Stock
As annual investment grows capital stock accumulates.
There is a given K-O ratio (? ). Thus, GDP grows:
? = ? Kt ……………(2)
Where
? = Growth in GDP
? = Capital Output Ratio
Kt = Current Capital Stock
As investment grows through the multiplier effect GDP grows.
It* µ = ? …………….(3)
Where
µ = Multiplier
It = New Investment
? = Growth in GDP
When full capacity production takes place any increase in GDP leads to an ex-ante demand for new investment (It). This is a manifestation of the accelerator principle.
The combined effect of the investment multiplier and the accelerator is that there is continuous growth that is generated endogenously in the host country. This leads to growth in ex-ante FDI.
It = Itd + Itf …………….(4)
K. V. Bhanu Murthy

13
It = New Investment Demand
Itd = Domestic Investment
Itf = FDI
The investment demand that is unfulfilled by domestic sources is made good by foreign investment in the form of FDI. Whether FDI would fulfill the gap or not would also depend of the fact that FDI stock (accumulation of foreign investment over the years) exists in the country concerned. Thus, past FDI inflow would also promote current FDI inflows. Thus, inward FDI flows are generated through a process that is driven by host country macro-economic dynamics. This theory is not based on the traditional theory of internalization and micro-economic firm theory but has its roots in macro-economic analysis.
Home Country Endogenous Factors
In recent times developing countries have acquired the capabilities for making greenfield and brownfield investments in other developing country markets. The result is that such countries like India and China defy the old prototype of developed countries being home countries.
The LLL theory by John Mathew (2006) points out that those developing countries that have had long standing FDI inflows go through three steps:
1. Linkages with MNCs
2. Learning by virtue of relations with the MNCs
3. Leverage to gain the capability of acquiring or investing in foreign markets through OFDI.
Therefore, it stands to reason that OFDI must be driven by inward FDI in the case of developing countries. Thus, there must be an observable link between inward and outward FDI in the case of developing country markets. Most studies only emphasize developing country policies for attracting inward FDI. None of the studies attempt to establish this link between inward and outward FDI, especially in the case of developing market economies.
Exogenous Factors
Apart from the above factors there are a set of exogenous factors which can be simulated as a time variable that is a catch-all variable representing policy factors and other environmental factors. Very often policies are sector specific and environmental variables are difficult to model and measure directly.
III. REVIEW OF LITERATURE
The systematic work on the theory of MNCs was first developed by Hymer (1960) who explained that the imperfect markets across different countries marks the
Incorporating a Macroeconomic Framework into The General Theory Of FDI
14
decision for relocation of production facilities. As a result FDI is carried out to replace excessive transaction costs involved in trade. The theory of MNCs was further developed by Rugman (1986), who gave the ‘Internalization theory’ illustrating FDI as a means to replace markets by internalizing the operations, especially in intermediate product markets across affiliates in various host countries. This kind of FDI was proposed as ‘efficiency seeking’. However, the above theories were insufficient in explaining as to why FDI tended to exploit relevant assets in some countries but not in others. In this perspective, Dunning's OLI approach specifically combined the locational factors with firm-specific advantages and transaction costs elements (Dunning, 1993) for explaining international production. Dunning’s eclectic theory emerged as one of the most comprehensive theories that explained the occurrence of FDI.
In view of the proposed revision to the general theory of FDI where FDI is seen as an investment decision, we discuss some pertinent works below. The complexity of investment decisions and the controversy surrounding them has been pointed out by Meyer and Glauber (1964). There are two dimensions of investment theory. First, that there is no clear cut evidence that higher current profits bear a promise to higher future profits; second, that current profits may influence long-term investment decisions only if it is assumed that investments are financed by current profits. There have been some major studies that deal with the above two issues regarding profits and investment (Grunfeld, 1960; Klien, 1951; Meyer and Kuh, 1957; Roos, 1948; and Tinbergen, 1939).
In recent years, a large body of research has also focused on the effects of taxation on both inbound and outbound FDI. Numerous studies have examined whether and to what extent FDI responds to tax incentives. While the specific results vary, the general consensus is that tax considerations have become an increasingly important factor in investment decisions (Hines, 1992; Altshuler, Newlon, and Randolph, 1995). One of the common methods to remove fiscal impediments to attract FDI (primarily double taxation) is the bilateral tax treaty, which is the focus of this paper. There have been some studies that have gauged the impact of tax treaties on FDI (Dagan, 2000; Blonigen and Davies, 2000; Blonigen and Davies, 2002; Davies, 2003; Di Giovanni, 2005). Most of these studies have been done with respect to FDI emanating from the developed economies and the results on the effects of bilateral tax treaties have been mixed.
In addition to the new dimensions that are being incorporated into our general theory of FDI, an important issue to be addressed is the developed country bias in the existing FDI theory. Some of the prominent works which highlight developing country FDI (Dunning and Narula, 1996; Cantwell and Mudambi, 2001; Rasiah, 2000a, 2000b; and Gammeltoft, 2006) have tried to explain the rise in MNCs from
K. V. Bhanu Murthy

15
developing regions of the world in the light of globalization. Further, this new phenomena of late comer firms rapidly catching up with incumbent global players, was explained by Mathews (2006) who proposed an alternative framework to OLI, which he terms as ‘Linkages, Leverage and Learning (LLL)’ framework. A work that models the determinants of outward FDI from China (Buckley et al., 2007) emphasizes market-seeking investment as one of the dimensions of FDI, although it does not incorporate the implications of investment theory and ‘open economy macroeconomics.’
VI. CONCLUSIONS
In this paper, we have attempted to revisit the general theory of FDI by incorporating four new dimensions.
The four dimensions of the proposed new framework consist of:
1. the new international business environment;
2. the macroeconomic framework;
3. tax incentives; and
4. endogenous and exogenous Macro-economic factors
All of the above have not been considered in FDI theory, hitherto. This new framework could completely change the outlook on explaining the new patterns in global FDI where emerging economies are also growing in terms of outward FDI.
REFERENCES
Altshuler, Rosanne, Newlon, T. Scott & Randolph, William. (1995). Do Repatriation Taxes Matter? Evidence From the Tax Returns of U.S. multinationals. In Martin Feldstein, James Hines Jr., and R. Glenn Hubbard (Eds.), The Effects of Taxation on Multinational Corporations: 253-272. Chicago: University of Chicago Press.
Arrow, Kenneth J. (1969). The Organization of Economic Activity: Issues Pertinent to the Choice of Market Versus Non-Market Allocation. In The Analysis and Evaluation of Public Expenditure: The PPB System. US Joint Economic Committee, 91st Congress, Washington, D.C.: US Government printing office.
Blonigen, Bruce A. and Davies, Ronald B. (2000). The Effects of Bilateral Tax Treaties on U.S. FDI activity”, National Bureau of Economic Research Working Paper No. 7929, October.
___________. (2002). Do Bilateral Tax Treaties Promote Foreign Direct Investment? National Bureau of Economic Research Working Paper No. 8834.
Brainard, S. Lael. (1997). An Empirical Assessment of the Proximity-Concentration Trade-off Between Multinational Sales and Trade. The American Economic Review,
Incorporating a Macroeconomic Framework into The General Theory Of FDI

16
87(4): 520-44.
Buckley, P.J. and Casson, M.C. (1976). The Future of the Multinational Enterprise, London: Homes & Meier.
Buckley, P.J., Clegg, L Jeremy, Cross, Adam R., Liu, Xin, Voss, Hinrich & Zheng, Ping. (2007). The Determinants of Chinese Outward Foreign Direct Investment. Journal of International Business Studies, 38(4): 499-518, July.
Cantwell, J. and Mudambi, R. (2001). MNE Competence-Creating Subsidiary Mandates: An Empirical Investigation. International Investment and Management Discussion Paper No. 285, Reading University, Reading.
Dagan, T. (2000). The Tax Treaties Myth, New York University Journal of International Law and Politics, Summer: 939-996.
Dunning, J.H. (1977). Trade, Iocation of Economic Activity and the MNE: A Search for an Eclectic Approach. In B. Ohlin, P.O. Hesselborn and P.M. Wijkmon (Eds.) The International Location of Economic Activity: 395-418. London: Macmillan.
____________. (1980). Toward an Eclectic theory of International Production: Some Empirical Tests. Journal of International Business Studies, 11(1): 9-31 (Spring/Summer).
___________. (1988). Explaining International Production. London: Unwin Hyman.
___________. (1993). Multinational Enterprises and the Global Economy. Wokingham: Addison- Wesley.
___________. (1994). Re-Evaluating the Benefits of Foreign Direct Investment’ Transnational Corporations, 3(1): 23-51 (February)
_____________. (1998). The Changing Geography of Foreign Direct Investment. In N. Kumar (Ed). Internationalization, Foreign Direct Investment and Technology Transfer: Impact and Prospects for Developing Countries. London and New York: Routledge.
Dunning, J.H. and Narula, R. (1996), “The Investment Development Path Rrevisited: Some Emerging Issues”, in J. H. Dunning and R. Narula (Eds), Foreign Direct Investment and Government: Catalysts for Economic Restructuring. London: Routledge.
Gammeltoft, P. (2006), Internationalization of R&D: Trends, Drivers, and Managerial Challenges. International Journal of Technology and Globalization. 2(1/2): 177-99.
Grubert, Harry & Mutti, John. (1991). Taxes, Tariffs and Transfer Pricing in Multinational Corporate Decision Making. The Review of Economics and Statistics.
K. V. Bhanu Murthy

17
73(2): 285-93.
Grunfeld, Yehuda. (1960). The Determinants of Corporate Investment. In Arnold C. Harberger (Ed.), The Demand for Durable Goods. Chicago: University of Chicago Press.
Hines, James R. Jr. (1992). Credit and Deferral as International Investment Incentives. National Bureau of Economic Research Working Paper No. 4191.
Hymer, S. H. (1960), The International Operations of National Firms: A Study of Direct Investment. Ph.D. Thesis, Massachusetts Institute of Technology, Cambridge, MA. Published in 1976 by MIT Press: Cambridge, MA.
Keynes, John Maynard. (1936). The General Theory of Employment, Interest and Money. London: Palgrave Macmillan.
Klein, L. R. (1951). Studies in Investment Behavior. In Conference on Business Cycles, Universities – National Bureau Committee for Economic Research.
Mathews, J.A. (2006). Dragon multinationals: New Players in 21st Century Globalization”, Asia Pacific Journal of Management. 23: 5–27.
Meyer, John R., & Glauber, Robert R. (1964). Investment Decisions, Economic Forecasting, and Public Policy. Boston: Harvard University, Graduate School of Business Administration, Division of Research.
Meyer, John R., & Kuh, Edwin. (1957). The Investment Decision. Cambridge, Mass.: Harvard University Press.
Rasiah, R. (2000a). Globalization and International Private Capital Movements. Third World Quarterly. 21(6): 917-29.
Rasiah, R. (2000b). International Portfolio Equity Flows and the Malaysian Financial Crisis. Journal of Contemporary Asia. 30(3): 369-401.
Roos, C. F. (1948). The Demand for Investment Goods. American Economic Review, Papers and Proceedings, May: 311-20
Rugman, Alan M. (1986). New Theories of the Multinational Enterprise: An Assessment of International Theory, Journal of Economic Research. 38: 101-118.
Tinbergen, J. (1939). A Method and Its Application to Investment Activity. League of Nations.
Williamson, Oliver. (1975). Markets and Hierarchies: Analysis and Anti-trust Implications. New York: Free Press.
Incorporating a Macroeconomic Framework into The General Theory Of FDI

INTRODUCTION:
1. The Problem
There are several studies on Muslim women which highlight various dimensions of traditional practices and the changes taking place in their status and interaction patterns. Anne-Sofie Roald (2001:95-100) states that in the Muslim world, social changes have altered traditional gender and family patterns. Muslims in the diaspora faced with new social structures which are challenging the foundations of traditional faith and practices as well. Malavika Karlekar (1984:362-382) has highlighted influence on a women’s self perception. She suggests that most Indian women accept a world view constructed by men and often reinforced by women not because they are necessarily convinced of its validity but because the costs involved in attempting any changes are too great. The increasing involvement of Indian women in the domain of paid work brings with it a series of dilemmas and conflicts due to certain deeply internalized stereotypes. Sushila Jain (1998:XV) in her study Muslim Women in a City, throws some light upon the perceptions of Muslims women themselves regarding such key issues as employment, education and control of household finances. She further says, “Muslim Women in India today are potential catalyst.” Their emancipation could be a special step in the modernization of the Community. Madeline Bunting (2001:http//www.guardian.co.ur/archive/article/o, 4273, 4314573, 00 html) speaks of the nature of the liberation of women in Islam. In the modern world, London is the most developed city but the atmosphere of London is also influenced by Islam. Major example is that the some Muslim Women , sitting in a stylish club, all are wearing the scarfs and discussing about the position of women while the Club also shows the Muslim identity because there is no alcohol and downstairs there is a prayer room. This shows that they have some liberty but are bound by religion.Humayun Ansari (2004:294-296) finds that more young Muslim women are moving into higher level and better-paid employment. They may still face discrimination on religious as well as racial grounds, but they have become increasingly confident and able to challenge and combat it. In the public domain, Muslim women are increasingly involved in local politics and voluntary work and
1 2 3Sabista Anjum, J.K.Pundir, Anjula Gupta1Assistant Professor, SCRIET, C.C.S. University, Meerut.
2Professor of Sociology, C.C.S. University, Meerut.3Associate Professor in Sociology, R.G. College, Meerut.
ROLE OF RELIGION IN THE PRIVATE AND PUBLIC LIFE OF EDUCATED MUSLIM WOMEN IN A RELIGIOUS TOWN
The Horizon - A Journal of Social Sciences July 2015, pp. 18-33
ISSN-0975-5535No.-II/2015, Volume-VI,
holding public offices. Their achievements cover a wide range of public arenas: politics, public service, the media, culture and art. It is therefore arguable that despite access to better educational facilities, Muslim women have not fared much better than those of their first generation. The cultural ties and family bonds have proved remarkably firm, and maintained a degree of control, despite the relative wealth and economic independence of the younger generation.Surya Narain (2003:111-113) observes that with the spread of education and process of modernization, a change has occurred in the social position of Muslim women; however, the overall situation is not very satisfactory. It is also true that Muslim women are still among the most backward section of the society. Education, both secular and religious, is the key word to the progress of Muslim women. The positive impact of education on the lives and status of Muslim women has been highlighted in various studies. It is also suggested that media should also play a more constructive role. Instead of projection of the stereotype image of Muslim women, they should focus on successful Muslim women working in different walks of life, who have risen above their situation, without giving up their traditional culture and values. However, more than a change in societal attitude towards women, what is desired is a change in self-perception of Muslim women. The capacity building of Muslim women is a must to escape the destiny of ‘a minority within a minority’ and to emerge as an empowered being, with a well defined status and identity.
Many of such studies of Muslim women have noted several issues like new social structures are challenging the foundations of traditional faith and practices, effect of education on the position of Muslim women like involvement in paid work, efforts to manage public and private life and effect of Islam on women in the western world. But all those indicate that religion affects the life (Public and private) of Muslim women despite higher education, employment in paid jobs even while living in the Western world. But systematic empirical documented studies of such impact and also of the processes how do they get adjusted in new spheres at ground level in day today life are rare. Thus, the issue needs new and systematic explorations of emerging social reality.
In the light of the above brief background of understanding of changing scenario of Muslim women the proposed study focuses on the following specific questions:
What is the Religious and Secular Educational background of the Muslim women? How does the educational background affect the behavior of Muslim women in their public life? What is the nature of the impact of religion on educated Muslim women in their public life? What is the perception of Muslim women of their rights in society and at home and how is that determined or influenced by religion? How education is playing an important role in maintaining a noticeable position of Muslim women and how Muslim women are managing their public life under the influence of religion?
Relationships between the variables of socio-economic background and that of
19Role of Religion in the Private and Public Life of Educated Muslim Women in a Religious Town
20
impact of religion have been studied. Variables of socio-economic background like age, religious education, secular education, father’s occupation and mother’s occupation have been taken up, in relation to the aspects of impact of religion in public life i.e. put on veil at work place, management of behaviour before outsider gents at home, management of behaviour while attending a function where gents are also present, going to market and listening to criticism by relatives and neighbors.
2. Area of Study and Methodology
Deoband town has been taken up for the empirical study.It is a part of greatness and honour for Muslims because Asia’s number one Islamic University, Dar-al-Uloom is situated there. Deoband is situated in North India on 29’58º latitude and 77’35º attitude. The Northern Railway line passes through Deoband town. The Deoband railway station is 144 kilometers north of Delhi on the Delhi-Meerut-Saharanpur section. Being a religious seat, Dar-al-uloom of Deoband has fame for ‘fatwa giving’ in legal (Shari’i) matters. The main business of the town is related to the publication work of religious books and literature in Urdu and Arabic languages. These books are supplied throughout the world. Islam is the major religion observed by large segment of the residents of Deoband. Apart from Islam, the other religions followed by citizens are Hinduism, Jainism and Sikhism. Thus, it provides a situation where we can see clearly study impact of Islam on Muslim Women’s life style. The number of literate Muslim women in the town is 11,667 out of a total of 23,588 approximately (i.e. about 65%). Highly educated women are approximately 20% of the literate. Thus, about 2,000 plus highly educated (graduate and above) woman constitute the universe of study. Of these, approximately 10% sample (in round figures 200) has been drawn by a combination of sampling methods. Web approach was also used in identification. For the study, historical facts have been collected from the secondary sources. Case study method has been used for collecting primary data at the first stage for exploring maximum possible aspects, by using observation and informal interviews. Later on, interview guide was prepared. After necessary modifications, this was finalized and data were collected by using this interview guide. The interviews were conducted mostly, at work place and some at the place of living of the respondents. Most of the interviews were held in strict privacy. While starting Interview, purpose of the study was always explained very clearly to the respondents, and a near complete integrity of the interview was maintained. Case studies data collected with the technique of observation, interview (Muslim Women) from respondents, were analyzed quantitatively. Simple statistical techniques like tabulation, percentages, and comparative analysis have been used to analyze quantitative data collected from 200 respondents to look into to the extent of relationship between background variables and the aspects of attitudes of Muslim women and their patterns of adjustment in private and public life.
Sabista Anjum, J.K.Pundir, Anjula Gupta

21
3. Terms / Concepts /Operational Definitions:
Following terms/concepts have been used in the domain of the study. These are operationally defined and clarified here.
3.1. Public and Private Life
Public life is related to the work place of a woman where she needs to interact with a number of people from larger society related to her work and has to maintain professional relations with the people according to the need of time which are must in public life. Public and private spheres consequently lost their definiteness; it varies not only according to space and time, but also at any given moment within the same cultural setting and performed according to certain point of view.
John B. Landes (1988:17-18) states that the personal and patriarchal politics universe tolerated arenas of public speech and performance by women. Indeed, many contemporaries exaggerated their importance still, elite women achieved a public position that had little if anything to do with their domestic roles. (Of course, a woman’s public position was conditioned by her “family interest” in a wider sense that is by her location within a lineage system or a series of kinship relations.) Women’s involvement was in society, in a public life outside of the household and increasingly distinguished from the court as well.
Celia Allison Hahn (Christian Century: http://www.religion-online.org) has focused on the growing division between procreation and dominion and between the private sphere of women and the public sphere of men. The divorce between public and private arenas has multiplied over the centuries. Before the Industrial Revolution, men and women worked at home, and women like men, could be butchers and gunsmiths and shipyard operators. But after industrialization, the world of work became the province of men, and home and family the proper arena for women. Celia says, “I do not mean to deny that there are women who are already powerful leaders in public life, nor that there are men who are wise and affectionate fathers.” In the workplace itself, a women may still be identified with the procreative task. She may find that her talents are discounted. Her female coworkers are found jealous, and that her male coworkers sexually harass her.
Rehana Ghadially (2007:345) has highlighted major group purpose a comprehensive set of laws that would collapse the distinction between the public and the private domains, and de-link personal laws from religion. The major problem with this is that religion and personal laws are seen as occupying separate compartments, whereas, the inter wining of religion, culture and personal law is complex and historically determined. Hence, the disentangling of these strands is a difficult task that cannot be effected by administrative or legal fiat. Besides, religion is a way of life for the vast majority of men and women, comprising a world view that shapes people’s
Role of Religion in the Private and Public Life of Educated Muslim Women in a Religious Town
22
perceptions and influences their life choices. This is something that cannot simply be wished or legislated away. Moreover, there is a more fundamental question before us: does a democratic society presuppose a space where in communities/groups of people can enter in to a dialogue with each other and renegotiate the public/private dichotomy on their own terms i.e. keeping in mind their specific histories, cultures, social structures and specific oppressions.
Linda Wood Head (2002:333) states that in advanced industrial/highly differentiated/Western societies, industrialization was generally accompanied by the drawing of a clear distinction between private and public life. Women’s proper sphere was the former, the family and domestic life. Men dwell in both spheres, but their natural realm is the rationalized, impersonal, secular sphere of public life. Throughout the twentieth century and beyond, women have increasingly won the right to move into the public sphere, but the latter remains masculinized and male dominated. Religion in the nineteenth century was itself pushed in to the private realm, and tended to reinforce women’s domesticization by becoming the guardian of private life and family values. Consequently, religion became a natural environment for the articulation of the lives and desire of women whose lives centered round, home, family, children and husband. Women, who move in to public life by (for example) entering into one of the professions, however, may experience tensions between traditional religious values and the values of their public/professional lives. This tension may be found to be creative or it may lead to an abandonment of traditional religion and/or the creation of new spiritualities.
On the basis of these studies, we have used private life as in the house and, public is the street, market, and workplace and else it is also clear that women are taking active part in the public life and contributing their best in the public life. It is their will power and extra ordinary management that they are managing both public and private life simultaneously. But both of these are influenced by religion.
3.2. Hijaab and Niqaab:
The differentiation between Hijaab and Niqaab is that Hijaab is more usually understood to mean simply covering encompassing the hair and neck, but not the face itself while Niqaab is face veiling.
3.3. Shariah:
Shariah is defined as “Islamic Laws.” On the other hand we can explain those Islamic rules and regulations which are governed under cover of four fundamental universal facts of Islamic religion No.1. Quran 2.Hadith 3. Unanimous decision of Islamic religious intellectuals 4. Thinking based in the light of Hadith and Quran.
3.4. Hadith:
Hadith stands what was transmitted on the authority of the Prophet (PBUH), his
Sabista Anjum, J.K.Pundir, Anjula Gupta

23
deeds, sayings, tacit approval or description of his sifaat (features) meaning his physical appearance.
4. EDUCATIONAL BACKGROUND AND IMPACT OF RELIGION ON PUBLIC LIFE
Differential educational background of people may have differential impact or they may experience different impact of any phenomenon. Thus, the impact of religion on public life of Muslim women may be differentially distributed with different educational background of the respondents. In this section, different walks of the impact of religion on public life of Muslim women have been described in relation to different variables of educational background. These variables are independent variables and the variables of impact of religion are dependent-variables. Variables , namely religious education and secular education have been found more important than other variables. These variables have been described in relation to the aspects (variables) of impact of religion namely putting on veil at work place, meeting outsider gents in functions, going to market and other places, appreciation (criticism) by relatives and neighbors.
Thus, facts on 10 relationships in a bivariate distribution have been described here.
4.1 Religious Education and Impact of Religion on Public Life
Facts of religious education in relation of five variables of impact of religion are described here. These are putting on veil at work place, meeting outsider gents at home, meeting outsider gents in functions, going to market, criticism(appreciation) by relatives and neighbors.
4.1.1 Religious Education and Putting on Veil at Work Place
Facts of this relationship are presented in the following table as distribution of religious education into three categories and putting on veil in three categories at work place as- always, some times and never.
Table-1: Religious Education and Putting on Veil at Work Place
The respondents belong to three categories of religious education: basic Islamic
Always Sometimes Never TotalReligious Education
Putting on Veil at Work Place
Basic Islamic Education 01 - 187 188
Medium Islamic Education 02 - 08 10
Higher Islamic Education 02 - - 02
Total 05 - 195 200
Role of Religion in the Private and Public Life of Educated Muslim Women in a Religious Town

24
education, medium Islamic education and high Islamic education in relation to putting on veil at their work place. In basic Islamic education category, out of 188 respondents only one respondent always puts on veil at her work place and 187 respondents never put on veil at their work place, in medium Islamic education category, out of 10 respondents, only 02 respondents always put on veil at their work place, 08 respondents never put on veil at their work place and in high Islamic educated respondents total 02 respondents always put on veil at their work place.
Thus, the facts show that majority (187out of188) of the respondents in basic Islamic education category never put on veil at their work place whereas, both of the two respondents who have got Islamic education always put on veil at their work place. It indicates that higher the religious education greater is the traditional practice of putting on veil.
4.1.2. Religious Education and Meeting Outsider Gents at HomeFacts of this relationship are presented in the following table.
Table- 2:- Religious Education and Meeting Outsider Gents at Home
The respondents belong to three categories of religious education: basic Islamic education, medium Islamic education and higher Islamic education in relation to meeting outsider gents at home. Out of 188 basic Islamic educated respondents, 12 respondents meet outsider gents behind the veil, 33 respondents meet them according to their parent’s advice and 143 respondents meet them according to their own will as per social requirements. In medium Islamic education category out of 10 respondents, 04 respondents meet outsider gents behind the veil, 02 meet them according to their parent’s advice and 04 meet them according to their own will as per
Meeting Outsider Gents at Home
Religious EducationTotal
Not to Meet
Meet Behind the Veil
Meet According to Parent’s
Advice
Meet According
to Own Will and
Social Requirements
Basic Islamic Education - 12 33 143 188
Medium Islamic Education - 04 02 04 10
High Islamic Education 01 01 - - 02
Total 01 17 35 147 200
Sabista Anjum, J.K.Pundir, Anjula Gupta

25
social requirements. In higher Islamic education category out of 02 respondents 01 respondent does not meet outsider gents and 01 respondent meets them behind the veil.
Thus, the facts show that majority (143 out of 188) and (04 out of 10) of the respondents in both basic and medium Islamic education categories meet outsider gents at home according to their own will as per social requirements while of higher Islamic education category none of the respondents meet outsider gents according to their own will as per social requirements.
Thus higher the Islamic education lesser becomes the freedom to meet outsider gents, lesser it is greater is the freedom.
4.3. Religious Education and Meeting outsider Gents in Function
Facts of this relationship are presented in the following table.
Table-3: Religious Education and Meeting outsider Gents in Functions etc.
The respondents belong to three categories of religious education: basic Islamic education, medium Islamic education and higher Islamic education in relation to meeting outsider gents in function. Out of 188 basic Islamic educated respondents 33 respondents meet outsider gents in a function behind the veil, 11 respondents meet them according to their parent’s advice and 139 respondents meet them according to their own will as per social requirements. In medium Islamic education category, out of 10 respondents 03 respondents meet outsider gents in a function behind the veil, 02 respondents meet to outsider gents in a function according to their parent’s advice and 05 respondents meet to outsider gents in a function according to their own will as per social requirements. In high Islamic education category out of 02 respondents 01
Meeting Outsider Gents at Home
Religious EducationTotal
Not to Meet
Meet Behind the Veil
Meet According to Parent’s
Advice
Meet According
to Own Will and
Social Requirements
Basic Islamic Education - 33 46 109 188
Medium Islamic Education - 4 2 04 10
High Islamic Education 01 01 - - 02
Total 01 38 48 113 200
Role of Religion in the Private and Public Life of Educated Muslim Women in a Religious Town

26
respondent do not meet outsider gents in a function and 01 respondent meet behind the veil.
Thus, the facts show that majority (109out of 188 and 04 out of 10) of the respondents in both basic and medium Islamic education categories meet outsider gents in a function according to their own will as per social requirements, while in high Islamic education category none of the respondents meet outsider gents even in a function according to their own will as per social requirements.
4.4. Religious Education and Going to Market
Facts of this relationship are presented in the following table.
Table-4: Religious Education and Going to Market
The respondents belong to three categories of religious education. In basic Islamic education category, out of 188 respondents 05 go to market alone, 84 go with their parents or husbands and 99 go to market with any other youngster or friend. In medium Islamic education category, out of 10 respondents 02 respondents go to market alone, 02 respondents go to market with their parents or husbands and 06 respondents go to market with any other youngster or friend. In high Islamic education category, out of 02 respondents 01 respondent goes to market with her parents or husband and 01 respondent goes to market with any other youngster or friend.
Thus, the facts show that majority (99 out of 188, 06 out of 10,and 01 out of 02) of the respondents in all categories of Islamic education, , go to market and other places with any other youngster or friend, rarely any one goes alone.
4.5. Religious Education and Criticism by Relatives and Neighbours
Facts of this relationship are presented in the following table.
Going to Market
Religious Education Total
Basic Islamic Education 05 84 99 188
Medium Islamic Education 02 02 06 10
High Islamic Education - 01 01 02
Total 07 87 106 200
Going Alone
Going with
Parent’s or
Husband
Going with
Any Other
Youngster
or Friend
Sabista Anjum, J.K.Pundir, Anjula Gupta
27
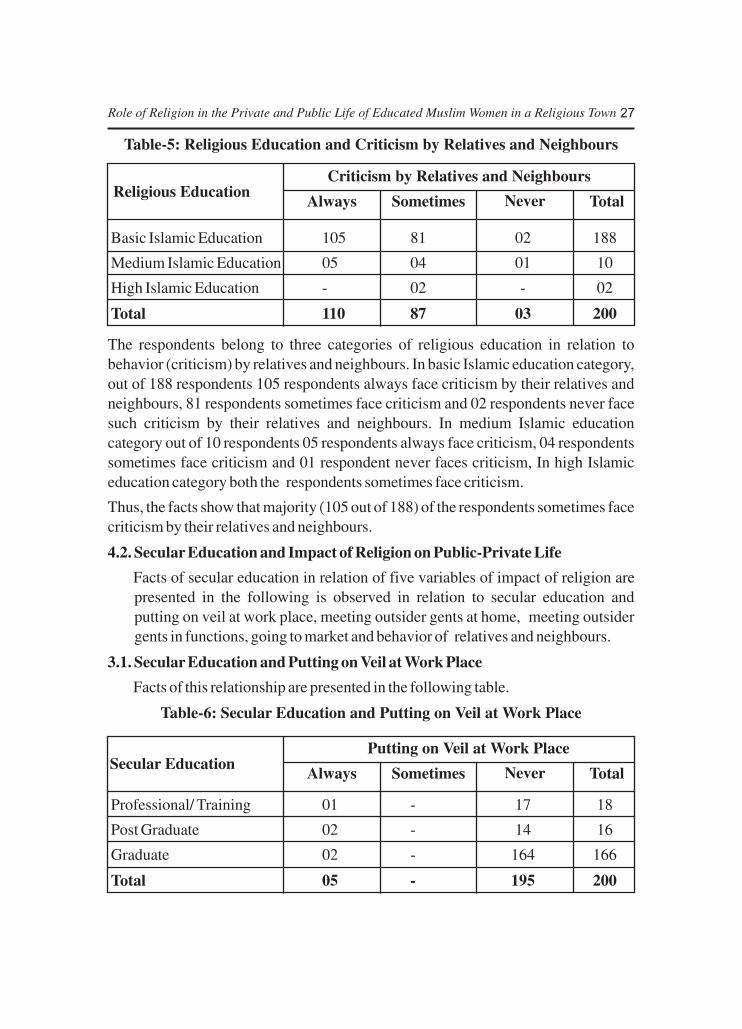
Table-5: Religious Education and Criticism by Relatives and Neighbours
The respondents belong to three categories of religious education in relation to behavior (criticism) by relatives and neighbours. In basic Islamic education category, out of 188 respondents 105 respondents always face criticism by their relatives and neighbours, 81 respondents sometimes face criticism and 02 respondents never face such criticism by their relatives and neighbours. In medium Islamic education category out of 10 respondents 05 respondents always face criticism, 04 respondents sometimes face criticism and 01 respondent never faces criticism, In high Islamic education category both the respondents sometimes face criticism.
Thus, the facts show that majority (105 out of 188) of the respondents sometimes face criticism by their relatives and neighbours.
4.2. Secular Education and Impact of Religion on Public-Private Life
Facts of secular education in relation of five variables of impact of religion are presented in the following is observed in relation to secular education and putting on veil at work place, meeting outsider gents at home, meeting outsider gents in functions, going to market and behavior of relatives and neighbours.
3.1. Secular Education and Putting on Veil at Work Place
Facts of this relationship are presented in the following table.
Table-6: Secular Education and Putting on Veil at Work Place
Always Sometimes Never
Basic Islamic Education 105 81 02 188
Medium Islamic Education 05 04 01 10
High Islamic Education - 02 - 02
Total 110 87 03 200
Religious EducationTotal
Criticism by Relatives and Neighbours
Always Sometimes Never
Professional/ Training 01 - 17 18
Post Graduate 02 - 14 16
Graduate 02 - 164 166
Total 05 - 195 200
Secular EducationTotal
Putting on Veil at Work Place
Role of Religion in the Private and Public Life of Educated Muslim Women in a Religious Town

28
The respondents belong to three categories of secular education: professional/training, post graduate and graduate in relation to putting on veil at their work place. In professional/training category out of 18 respondents 01 respondent always puts on veil at her work place and 17 respondents never put on veil at their work place. In post graduate category out of 16 respondents 02 respondents always put on veil at their work place and 14 respondents never put on veil at their work place. In graduate category out of 166 respondents 02 respondents always put on veil at their work place and 164 respondents never put on veil at their work place.
The facts show that majority (17out of 18, 14 out of 16, and 164 out of 166) of the respondents never put on veil at their work place.Thus secular education appears to have brought freedom from putting on veil at work place.
3.2. Secular Education and Meeting Outsider Gents at Home
Facts of this relationship are presented in the following table.
Table-7: Secular Education and Meeting Outsider Gents at Home
The respondents belong to three categories of secular education: professional/training, post graduate and graduate in relation to respondents’ management of behaviour when outsider gents come at home. In professional /training category out of 18 respondents 01 respondent meets to outsider gent at home behind the veil, 01 respondent meet outsider gents according to their parent’s advice and 16 respondents meet outsider gents according to their own will as per social requirements. In post graduate category out of 16 respondents 04 respondents meet outsider gents at home behind the veil, 04 respondents meet them according to their parent’s advice and 08 respondents meet them according to their own will as per social requirements. In graduate category out of 166 respondents 01 respondent do not to meet outsider gents at home, 17 respondents meet outsider gents at home
Sabista Anjum, J.K.Pundir, Anjula Gupta
Meeting Outsider Gents at Home
Secular EducationTotal
Not to Meet
Meet Behind the Veil
Meet According to Parent’s
Advice
Meet According
to Own Will and
Social Requirements
Professional/ Training - 01 01 16 18
Post Graduate - 4 4 08 16
Graduate 01 12 30 123 166
Total 01 17 35 147 200

29
behind the veil, 35 respondents meet outsider gents at home according to parent’s advice and 147 respondents meet to outsider gents at home according to their own will as per social requirements.
The above facts show that majority (16 out of 18, 08 out of 16, and 123 out of 166) of the respondents in all categories (Professional/Training, Post graduate, Graduate) meet outsider gents at home according to their own will as per social requirements.
Thus secular education appears to have given freedom to majority of Muslim women in meeting the gents at home.
3.3. Secular Education and Meeting outsider Gents in Function
Facts of this relationship are presented in the following table.
Table-8: Secular Education and Meeting Outsider Gents in Function
The respondents belong to three categories of secular education: professional/training, post graduate and graduate in relation to management of behaviour with outsider gents in a function. In professional/training category, out of 18 respondents 01 respondent meet to outsider gents in a function behind the veil, 01 respondent meet to outsider gents in a function according to parent’s advice and 16 respondents meet to outsider gents in a function according to their own will and social requirements. In post graduate category, out of 16 respondents 05 respondents meet to outsider gents in a function behind the veil, 03 respondents meet to outsider gents in a function according to parent’s advice and 08 respondents meet to outsider gents in a function according to their own will and social requirements. In graduate category, out of 166 respondents 01 respondent\ do not meet to outsider gents in a function 32 respondents meet to outsider gents in a function behind the veil 44 respondents meet to outsider gents in a function according to their parent’s advice
Meeting Outsider Gents at Function
Secular EducationTotal
Not to Meet
Meet Behind the Veil
Meet According to Parent’s
Advice
Meet According
to Own Will and
Social Requirements
Professional/ Training - 01 01 16 18
Post Graduate - 5 3 08 16
Graduate 01 32 44 89 166
Total 01 38 48 113 200
Role of Religion in the Private and Public Life of Educated Muslim Women in a Religious Town

30
and 89 respondents meet to outsider gents in a function according to their own will and social requirements.
The above facts show that majority (16 out of 18, 08 out of 16, and 89 out of 166) of the respondents of all categories of education (Professional/Training, Post graduate, Graduate) meet outsider gents in functions according to their own will as per social requirements.
Thus the secular education has facilitated freedom of Muslim women in meeting gents in public functions.
3.4. Secular Education and Going to Market etc
Facts of this relationship are presented in the following table as distribution of secular education into three categories and going to market as- going alone, going with parents or husband and going with any youngster or friend.
Table-9: Secular Education and Going to Market etc
The above table shows that respondents belong to three categories of secular education: professional/training, post graduate and graduate in relation to going to market. In professional/training category out of 18 respondents 05 respondents go to market alone, 02 respondents go to market with their parents or husband and 11 respondents go to market with any other youngster or friend. In post graduate category out of 16 respondents, 01 respondent go to market alone, 09 respondents go to market with their parents or husband and 06 respondents go to market with any other youngster or friend. In graduate category out of 166 respondents 01 respondent go to market alone, 76 respondents go to market with their parents or husband and 89 respondents go to market with any other youngster or friend.
Thus, the facts show that majority (11 out of 18, 06 out of 16, and 89 out of 166) of the respondents in all categories of education (Professional/Training, Post graduate, Graduate)go to market with any other youngster or friend.
Sabista Anjum, J.K.Pundir, Anjula Gupta
Going to Market
Secular Education Total
Professional/ Training 05 02 11 18
Post Graduate 01 09 06 16
Graduate 01 76 89 166
Total 07 87 106 200
Going Alone
Going with
Parent’s or
Husband
Going with
Any Other
Youngster
or Friend

31
3.5. Secular Education and Criticism by Relatives and Neighbours
Facts of this relationship are presented in the following table as distribution of secular education into three categories and criticism by relatives and neighbours as- always, some times and never.
Table-10: Secular Education and Criticism by Relatives and Neighbours
The above table shows that respondents belong to three categories of secular education: professional/training, post graduate and graduate in relation to criticism by relatives and neighbours. In professional/training category out of 18 respondents, 10 respondents always face criticism by their relatives and neighbours, 06 respondents sometimes face criticism by their relatives and neighbours and 02 respondents never face criticism by their relatives and neighbours. In post graduate category out of 16 respondents 05 respondents always face criticism by their relatives and neighbours, 10 respondents somewhat face criticism by their relatives and neighbors and 01 respondent never face criticism by her relatives and neighbours. In graduate category out of 166 respondents, 95 respondents always face criticism by their relatives and neighbours, 70 respondents sometimes face criticism by their relatives and neighbours and 01 respondent never face criticism by her relatives and neighbours.
Thus, the facts show that majority of the respondents in all categories (Professional/Training, Post graduate, Graduate) always face criticism by their relatives and neighbours.
FINDINGS
Religious Education and Impact of Religion on Public Life.
(1) Majority (184 out of 188) of the respondents in basic Islamic education category never put on veil at their work place. Whereas, both the respondents who have got high Islamic education always put on veil. So, it indicates that higher the religious education greater is the traditional practice of putting on veil.
Always Sometimes Never
Professional/ Training 10 06 02 18
Post Graduate 05 10 01 16
Graduate 95 70 01 166
Total 110 86 04 200
Secular EducationTotal
Criticism by Relatives and Neighbours
Role of Religion in the Private and Public Life of Educated Muslim Women in a Religious Town

32
(2) Majority (143 out of 188, 04 out of 10) of the respondents in both Islamic and medium Islamic education category meet to outsider gents at home according to their own will and social requirements while in high Islamic education category none of the respondent meet to outsider gents according to her own will and social requirements.
(3) Majority (109 out 188, 04 out of 10) of the respondents in both basic Islamic and medium Islamic education category meet to outsider gents in functions according to their own will and social requirements, while in high Islamic education category none of the respondent meet to outsider gents in functions according to her own will and social requirements.
(4) Majority (105 out of 188, 05 out of 10) of the respondents in both basic Islamic and medium Islamic education categories sometimes face criticism by their relatives and neighbours.
(5) Majority (99 out of 188, 06 out of 10, and01 out of 02) of the respondents in all categories of education (Basic Islamic, Medium Islamic,and High Islamic) go to marker with any other youngster or friend.
Secular Education and Impact of Religion on Public Life
(1) Majority (14 out of 18, 16 out of 14, and 164 out of 166) of the respondents in all categories (Professional/Training, Post Graduate, and Graduate) never put on veil at their work place.
(2) Majority (16 out of 18, 08 out of 16, and 123 out of 166) of the respondents in all categories of education (Professional/Training, Post Graduate, and Graduate) meet to outsider gents at home according to their own will and social requirements.
(3) Majority (16 out of 18, 08 out of 16, and 89 out of 166) of the respondents in all categories of education (Professional/Training, Post Graduate, and Graduate) meet to outsider gents in a function according to their own will and social requirements.
(4) Majority (11 out of 18, 06 out of 16, and 89 out of 166) of the respondents in all categories of education (Professional/Training, Post Graduate, and Graduate) go to market with any other youngster or friend.
(5) Majority (95 out of 166) of the respondents always face criticism by their relatives and neighbours.
REFERENCES
Ansari, Humayun 2004: The Infidel Within:Muslims in Britain Since 1800,C.Hurst and co. Publishers, pp: 294-296
Sabista Anjum, J.K.Pundir, Anjula Gupta

33
Bunting, Madeleine 2001: “Can Islam Liberate Women? Muslim Women and Scholars Think it Does”, Guardian Unlimited,Sat- 8 (Dec.) (Website.http:www. guardian Co. UR / Archive /Article/O,4273,4314513,oohtml.)
Ghadially, Rehana 2007: Urban Women in Contemporary India:A Reader,India Sage Publications, pp:3-4
Hahn, Allison Celia (n.b.): “Men, Women and the Remarriage of Public and Private Spheres”, Chrstian Century, June (4-11),(http://www.religion-online.org/show article.asp? title=1041)
Jain, Sushila 1998: Status of Women,Jaipur Printwell Publishers,pp: xv
Karlekar, Malvika 1984: “Perceptions of the Women as Earner”, Social Action, Vol.34, No.4, pp:368-382
Landes, B.Joan 1998: “Woman’s Voice in the Old Regime”, Women and the Public Sphere In the Age of French Revolution, London,Cornell University press,pp:17-18
Marayati, Laila-Al 2002: “An Identity Reduced to a Burka”, Muslim Women’s League, January (20), LA Times, (Website: http://www.mwlusa. org/topics/ dress/ burka.html)
Roald, Anne Sofie 2001: “Women in Islam”, The Western Experience, London, Routledge, pp: 95-100
Singh Surya Narain, 2003: Muslims in India, Anmol Publications, pp:111-113
Wood Head,Linda 2002: Modern Religions in the World: Traditions and Transformations, Routledge, pp333
Role of Religion in the Private and Public Life of Educated Muslim Women in a Religious Town

ROLE OF MICRO FINANCE IN FINANCIAL INCLUSION & POVERTY ALLEVIATION IN INDIA
The Horizon - A Journal of Social Sciences July 2015, pp. 34-51
ISSN-0975-5535No.-II/2015, Volume-VI,
Priyanka SharmaAssociate Prof., Dept. of MBA
Global Institute of Management & Technology Greater Noida
INTRODUCTION
Microfinance is an enabling, empowering, and bottoms-up tool to poverty alleviation that has provided considerable economic and non-economic externalities to low-income households in developing countries. Microfinance is being hailed as a sustainable tool to combat poverty, combining a for-profit approach that is self-sustaining, and a poverty alleviation focus that empowers low-income households. Microfinance is increasingly becoming a tool to exercise developmental priorities for governments in developing countries. In order to ensure that the poorest benefit from this growth, and also contribute to it, the expansion and improvement of the microfinance sector should be a national priority. Micro-finance programmes have, in the recent past, become one of the more promising ways to use scarce development funds to achieve the objectives of poverty alleviation. Furthermore, certain micro-finance programmes have gained prominence in the development field and beyond. The basic idea of micro-finance is simple: if poor people are provided access to financial services, including credit, they may very well be able to start or expand a micro-enterprise that will allow them to break out of poverty.
"Nearly forty years after nationalization of banks, 60% of the country's population do not have bank accounts and nearly 90% do not get loans," India has been currently the second-highest number of financially excluded households in the world. While, 40% of India's population have bank accounts, and about 10% have life insurance cover, a meagre 0.6% has non-life insurance cover.
Financial services actively contribute to the humane & economic development of the society. These lead to social safety net & protect the people from economic shocks. Hence, each & every individual should be provided with affordable institutional
financial products/services popularly called “Financial Inclusion”.
Financial inclusion may be defined as the process of ensuring access to financial
services and timely and adequate credit where needed by vulnerable groups

35
such as weaker sections and low income groups at an affordable cost.
Financial products & services are identified as basic banking services like deposit accounts, institutional loans, access to payment, remittance facilities & also life & non life insurance services. The following are the denotation & connotation of financial inclusion in India.
1. Affordable credit
2. Savings bank accounts
3. Payments & Remittance
4. Financial advice
5. Credit/debit cards
6. Insurance facility
7. Empowering SHGs (Self Help Groups)
In fact, in order to address the issues of financial inclusion, the Government of India constituted a “Committee on Financial Inclusion” under the Chairmanship of Dr. C. Rangarajan. Not only in India, but financial inclusion has become an issue of worldwide concern, relevant equally in economies of the underdeveloped, developing and developed nations. Building an inclusive financial sector has gained growing global recognition bringing to the fore the need for development strategies that touch all lives instead of a select few.
Micro Finance: Meaning and Issues
Microfinance programmes are intended to reach poor segments of society as they lack access to financial services. It, therefore, holds greater promise to further the agenda of financial inclusion as it seeks to reach out to the excluded category of population from the banking system. The predominant micro finance programme namely SHG bank linkage programme has demonstrated across the country its effectiveness in linking banks with excluded category of poor segments of population. In this process, the role of development NGOs is quite pronounced in providing the last mile connectivity as enablers and catalyst between the SHGs / Village level co-operatives and the banks. This is also supplemented by the MFIs delivering credit.
Since 1992, another popular movement i.e. Self Help Groups is being implemented. The SHG movement is a popular one thereby financial inclusion is achieved to a considerable extent. The following table will explain the success of the programme. RBI wanted banks to extend credit card facilities to farmers to carry out their agricultural operations uninterruptedly. For this, during 1998-99 a scheme called „Kissan Credit Cards? was launched and as on 31st March 2008- 76 million cards
Role of Micro Finance in Financial Inclusion & Poverty Alleviation in India

36
were issued (Source: CMIE publication 2007-08).
Progress of SHG Bank Linkage Program in India:
Source: NABARD
The success of few Non Governmental Organisations (NGOs) like Mysore Resettlement and Development Agency (MYRADA) in-group lending, made the government in shifting the strategy of women development and empowerment. The linkage between “self help groups” and banks has been highly successful in furthering financial inclusion.
MFIs Consist of Refinance
Institutions, Banks, Non Government Organisations and Self Help Groups dealing with small loans and deposits in rural, semiurban or urban areas enabling people to raise savings, productive investments and thereby their standard of living.
National Bank for Agriculture and Rural Development has played a very significant role in supporting group formation, linking them with banks as also promoting best practices. The SHG is given loan against guarantee of group members. The recovery experience has been very good. Banks provide credit to such groups at reasonable rates of interest. However, the size of loans is quite small and used mostly for consumption smoothening or very small businesses. In some SHGs, credit is provided for agricultural activities and other livelihoods and could be several times the deposits made by the SHG.
The SHG-Bank Linkage Programme launched by NABARD in 1992 continues to be the predominant Micro-Finance (MF) model in the country. It represents the union of the banking system comprising the public and private sector commercial banks, Regional Rural banks (RRB), and Co-operative Banks with several organizations in
AS ON
PARAMETER March 1993 March 1996 March 2006 March 2007
SHG Linked 255 4757 2238525 2924973
% of Women Groups 70 74 90 90
Families Assisted (Million) 0.005 0.08 32.98 40.95
Banks Participating 14 95 501 498
SHG Promoting Partners 32 127 4323 4896
Districts Covered 26 157 572 587
Cumulative Bank Loan 2.58 53.32 113974.01 180407(Rs. In Million)
Priyanka Sharma

37
the formal and semiformal sectors to facilitate the provision of financial services to a large number of poor clients. It is a proven method of financial inclusion, providing un-banked rural clientele with access to formal financial services from the existing banking infrastructure.
Micro finance still plays a modest role in India. At the All India Level less than 5 per cent of poor rural households have access to micro finance (as compared to 65 per cent in Bangladesh) with significant variation exists across the states (Basu and Srivastava, 2005). Financial inclusion is not just credit dispensation, its about connecting the people with the banking system for availing bouquet of financial services including access to payment system. The critical issue, in the first place, is to connect and the SHG bank linkage programme since the 90s ranks, by far, the major programme initiative without parallel in any parts of the world for the financial inclusion. The uniqueness of the SHG Bank Linkage programme lies in the fact that it is not mere delivery of financial services but has an inherent design for promoting financial literacy. As the financial literacy increases, the financial inclusion gets more sustainability and stability in terms of being inclusive on a long haul.
History of Micro Finance in India
The Micro finance activity is the result of NABARD’s work in the micro finance sector, which started in 1992 through a pilot project for promoting 500 Self Help Groups (SHGs). As the idea gained acceptance from the banking system and the results were promising, the Reserve Bank of India (RBI) encouraged this positive initiative by issuing instructions to banks in 1996 to cover SHG financing as a mainstream activity under their priority sector–lending portfolio. From 1999 onwards, the Government of India (GOI) made linking SHGs with banks a national priority through its periodic policy and budget announcements. Today, the programme is growing at a pace of about 2.5 million households annually. It is the largest and fastest growing microfinance programme in the world in terms of its outreach and sustainability.
Micro Finance and Financial Inclusion
Since formal credit institutions rarely lend to the poor, special institutional arrangements become necessary to extend credit to those who have no collateral to offer. Microfinance, by providing small loans and savings facilities to those who have been excluded from commercial financial services, has been promoted as a key strategy for reducing poverty in all its forms by agencies all over the world. Microcredit has been defined as “programmes that provide credit for self- employment and other financial and business services (including savings and technical assistance) to very poor persons” (Micro Credit Summit, 1997). Nowadays, microfinance represents something more than microcredit - it also refers
Role of Micro Finance in Financial Inclusion & Poverty Alleviation in India

38
to savings, insurance, pawns and remittances, in sum to a much wider range of financial services (Tankha, 1999). In most cases, microcredit programmes offer a combination of services and resources to their clients in addition to usual credit for self-employment. Also, this is an effort to provide a bridge between formal financial markets and the informal groups in the formal microfinance initiatives.
The basic idea of microfinance is that poor people are ready and are willing to pull themselves out of poverty if given access to economic inputs. The need for informality in credit delivery and easy access is demonstrated by the fact that Self Help Groups (SHGs) and Microfinance Institutions (MFIs) constitute the fastest growing segment in recent years in reaching out to small borrowers. Micro-finance is a new development in which Indian institutions have acquired considerable expertise and where up-scaling holds great promise both to expand the nature of financial services offered to micro enterprises and to make these the springboard for entrepreneurial development. (Planning Commission, 2006).
The SHG movement is bringing about a profound transformation in rural areas of India. MFIs play a significant role in facilitating inclusion, as they are uniquely positioned in reaching out to the rural poor. Many of them operate in a limited geographical area, have a greater understanding of the issues specific to the rural poor, enjoy greater acceptability amongst the rural poor and have flexibility in operations providing a level of comfort to their clientele. It is roughly estimated that there are about 1,000 NGO-MFIs and more than 20 Company facilitating the activities in all over India. There are today over 22 lakh such groups linked with banks. The objective of the country is to enrol at least 50% of all rural women in India as members of SHGs over the next five years and link these SHGs to banks.
Who are the Excluded?
The financially excluded sections largely comprise of:
vMarginal farmers
vLandless labourers
vSelf employed and unorganized sector enterprises
vUrban slum dwellers
vMigrants
vEthnic minorities and socially excluded groups
vSenior citizens and women, etc.
vLarge pockets of population in North East, Eastern, and central regions of India
The Extent of Financial Exclusion in Rural India
Priyanka Sharma

39
Based on the All Indian Debt Investment Survey 2002, 111.5 million households had no access to formal credit. It also showed that 17 million households were indebted to moneylenders. The Arjun Sengupta Report on Financing Enterprises in the Unorganized Sector has pointed out that only 2.4 million out of 58 million units in this sector (with investment of less than Rs 25000) have got credit from commercial banks. The AIDIS 2002 also showed that lower the asset class or income, higher the degree of exclusion. These findings are corroborated by Invest India Incomes and Savings Survey (2007). The survey showed that 32.8% of households had borrowed from institutional sources and 67.2 % had borrowed from non-institutional sources.
The surveyalso found that 70 per cent of earners in the annual income bracket of more than Rs.400,000 borrowed from institutional sources as compared with only 27.5 per cent in the case of earners in the income bracket of less than Rs.50,000.
Of the underprivileged sections of the society - farmers, small venders, agriculture or industrial laborers, people engaged in unorganized sector, unemployed people, women, children, old people and the physically challenged - only 40 per cent of the people have a check in account, 20 per cent have taken life insurance products, 0.6 per cent have taken non-life insurance products, only 2 per cent have access to credit cards. Geographically, only 5.2 per cent of the country?s villages have a bank
branch. (Kochhar, 2009).
Despite the vast network of rural branches, only 27 per cent of the total farm households are indebted to formal sources; of them, one third also borrow from informal sources. There are parts of the country where more than 95 per cent of the farm households do not get any credit from institutional or non-institutional sources. Apart from the fast that exclusion itself is large, it also varies widely across regions, social groups and assets holdings. The poorer the group, the greater is the exclusion. There is evidence that farm debt is increasing much faster than farm incomes and the larger issue of the overhanging debt stock, as distinct from credit flow, has not even been on the agenda except of a few State governments. (Planning Commission, 2006). According to NSSO data in the situation assessment survey on “Indebtedness of Farmer households” (2003), 45.9 million farmer households in the country (51.4%), out of a total of 89.3 million households do not access credit, either from institutional or non- institutional sources. Further, only 27% of total farm households are indebted to formal sources. (RBI, 2009).
Benefits of Financial Inclusion:-
Financial inclusion has many benefits. Following are some of the benefits
summed up.
vIt paves the way for establishment of an account relationship which helps the
Role of Micro Finance in Financial Inclusion & Poverty Alleviation in India

40
poor to avail a variety of savings products and loan products for housing , consumption, etc.
vAn inclusive financial system facilitates efficient allocation of productive resources and thus can potentially reduce the cost of capital.
vThis also enables the customer to remit funds at low cost. The government can utilize such bank accounts for social security services like health and calamity insurance under various schemes for disadvantaged. From the bank?s point of
view, having such social security cover makes the financing of such persons less risky. Reduced risk means more flow of funds at better rates.
vAccess to appropriate financial services can significantly improve the day-today management of finances. For example, bills for daily utilities (municipality, water, electricity, telephone) can be more easily paid by using cheques or through internet banking, rather than standing in the queue in the offices of the service.
vTransfer of money can be done more safely and easily by using the cheque, demand draft or through internet banking.
vA bank account also provides a passport to a range of other financial products and services such as short term credit facilities, overdraft facilities and credit card. Further, a number of other financial products, such as insurance and pension products, necessarily require the access to a bank account.
vLastly, the Employment Guarantee Scheme of the Government which is being rolled out in 200 districts in the country would bring in large number of people through their savings accounts into the banking system.
Approaches of Financial Inclusion:
According to C. Rangarajan, there are six approaches in the system of Financial Inclusion, they are, as follows.
vFirst, credit to the farmer households is one of the important elements of financial inclusion among them providing credit to the marginal and sub marginal farmers as well as other small borrowers is crucial to the need of he hour.
vSecond, rural branches must go beyond providing credit and extend a helping hand interms of advice on a wide variety of matters relating to agriculture.
vThird, in district where population per branch is much higher than the national average commercial banks may be encouraged to open the branches.
vFourth, there is need for the simplification of the procedures in relation to granting of loans to small borrowers.
vFifth, the further strengthening the SHG-Bank Linkage Programme (BLP), as it has proved to be an effective way of providing credit to very small borrowers.
Priyanka Sharma

41
vSixth, the business facilitator and correspondent model needs to be effectively implemented.
SHG and Bank Linkage
SHG bank linkage by far is an effective instrument for financial inclusion.
Considering the importance of linkage the bank accounts of SHGs provide the first link for the members of SHG for graduation to individual family accounts in due course. This process need to be respected and encouraged to facilitate informed inclusion process.
vThat opening of bank accounts (Savings) is the beginning of beginning of the financial inclusion process, that is means to achieve larger end of financial inclusion.
vThat the federation of SHG as an apex body play a an effective complemental role to spread the financial inclusion
vTo achieve faster spread of financial inclusion, it is vital that the stake holders and it particular commercial bank recognize the need to take the banking services with the technological support to the people rather than waiting for the people to reach out to the banks
A Profile of Rural India
v9350 million below Poverty Line.
v95 % have no access to microfinance.
v 56 % people still borrow from informal sources.
v70 % don't have any deposit account.
v87 % no access to credit from formal sources.
vAnnual credit demand is about Rs.70,000 crores.
v95 % of the households are without any kind of insurance.
vInformally Microfinance has been in practice for ages.
Rural India and Microfinance
Micro financing has become important since the possibility of a sub-Rs 1,000 mobile handset has been ruled out in the near future. Rural India can generally afford handsets in the price range of Rs 1,500-2,000.
To succeed in India, agribusiness must empower the farmer by making agriculture profitable, not by expropriating him foe this particular purpose the farmer should be funded for their basic and small needs.
Micro finance is expected to play a significant role in poverty alleviation and development. The need, therefore, is to share experiences and materials which will
Role of Micro Finance in Financial Inclusion & Poverty Alleviation in India

42
help not only in understanding successes and failures but also provide knowledge and guidelines to strengthen and expand micro finance programmes.
The development process through a typical micro-finance intervention can be understood with the help of the following Chart-:
Key Factors of Micro-Finance in Rural India
Over the last ten years, successful experiences in providing finance to small entrepreneur and producers demonstrate that poor people, when given access to responsive and timely financial services at market rates, repay their loans and use the proceeds to increase their income and assets. This is not surprising since the only
Priyanka Sharma

43
realistic alternative for them is to borrow from informal market at an interest much higher than market rates. Community banks, NGOs and grass root savings and credit groups around the world have shown that these micro enterprise loans can be profitable for borrowers and for the lenders, making microfinance one of the most effective poverty reducing strategies
A. For NGOs
The field of development itself expands and shifts emphasis with the pull of ideas, and NGOs perhaps more readily adopt new ideas, especially if the resources required are small, entry and exit are easy, tasks are (perceived to be) simple and people’s acceptance is high – all characteristics (real or presumed) of microfinance.
Canvassing by various actors, including the National Bank for Agriculture and Rural development (NABARD), Small Industries Development Bank of India (SIDBI), Friends of Women’s World Banking (FWWB), Rashtriya Mahila Kosh (RMK), Council for Advancement of People’s Action and Rural Technologies (CAPART), Rashtriya Gramin Vikas Nidhi (RGVN), various donor funded programmes especially by the International Fund for Agricultural Development (IFAD), United Nations Development Programme (UNDP), World Bank and Department for International Development, UK (DFID)], and lately commercial banks, has greatly added to the idea pull. Induced by the worldwide focus on microfinance, donor NGOs too have been funding microfinance projects. One might call it the supply push.
All kinds of things from khadi spinning to Nadep compost to balwadis do not produce such concrete results and sustained interest among beneficiaries as microfinance. Most NGO-led microfinance is with poor women, for whom access to small loans to meet dire emergencies is a valued outcome. Thus, quick and high ‘customer satisfaction’ is the USP that has attracted NGOs to this trade.
B. For Financial Institutions and Banks
Microfinance has been attractive to the lending agencies because of demonstrated sustainability and of low costs of operation. Institutions like SIDBI and NABARD are hard nosed bankers and would not work with the idea if they did not see a long term engagement – which only comes out of sustainability (that is economic attractiveness).On the supply side, it is also true that it has all the trappings of a business enterprise, its output is tangible and it is easily understood by the mainstream. This also seems to sound nice to the government, which in the post liberalisation era is trying to explain the logic of every rupee spent. That is the reason why microfinance has attracted mainstream institutions like no other developmental project.Perhaps the most important factor that got banks involved is what one might call the policy push.Given that most of our banks are in the public sector, public policy does have some influence on what they will or will not do. In this case, policy
Role of Micro Finance in Financial Inclusion & Poverty Alleviation in India

44
was followed by diligent, if meandering, promotional work by NABARD. The policy change about a decade ago by RBI to allow banks to lend to SHGs was initially followed by a seven-page memo by NABARD to all bank chairmen, and later by sensitisation and training programmes for bank staff across the country. Several hundred such programmes were conducted by NGOs alone, each involving 15 to 20 bank staff, all paid for by NABARD. The policy push was sweetened by the NABARD refinance scheme that offers much more favourable terms (100% refinance, wider spread) than for other rural lending by banks. NABARD also did some system setting work and banks lately have been given targets. The canvassing, training, refinance and close follow up by NABARD has resulted in widespread bank involvement.
Role of Microfinancial Institutions:-
To ensure the people’s participation, the Government intensified banking activities by opening large number of cooperatives in rural areas to provide credit inputs and marketing facilities to farmers. The micro finance paradigm also fitted well with the adage of ‘Growth with Equity’, which is integral to the neo-liberal agenda for linkages with the market. It also aimed at the reassertion of the basic principle that the magic of market succeed where the Governmental intervention failed.
Economic development of our country can be achieved with the upliftment of village folk. Rural credit delivery system of India has many diversities and peculiarities. People in general and rural people in particular are largely illiterate, unaware and lack enough courage to approach the formal credit institutions for their credit needs. Again financial sector reform has brought a sea change in the attitude and objectivity of the banks. In this context, there has been an imperative need for supporting rural sector development through provision of credit to rural poor through micro credit. India has been experiencing micro credit in the form of Self Help Groups (SHGs) as a part of formal credit delivery. Government of India and the Reserve Bank, realizing the importance of micro credit in the development programmes have taken up many steps for the linkage of SHGs with formal financial institutions. The basic purpose of the linkage is to strengthen the financial health of SHGs by ensuring adequate flow of bank credit to these institutions. The ongoing economic and financial sector reforms have raised issues challenging the traditional thinking on role of Governments as employment provider to that of a facilitator for enhancing opportunities through conducive policy environment enabling greater reliance on private initiatives. The lessons learnt in implementation of credit linked poverty alleviation and employment programmes call for qualitative redesigning the packages through participation of the targeted people.
Financial services of micro finance institutions generally include savings and credit. However, some micro finance institutions also provide insurance and payments
Priyanka Sharma

45
services. In addition to financial intermediation, many micro finance institutions provide social intermediation services such as group formations, creating self confidence among the rural folks, training programmes on financial literacy and marketing skills. There is an urgent need for micro credit providers to shift from a minimalist approach to an integrated approach to poverty alleviation taking more holistic view of the client including provision of enterprise development services like marketing infrastructure, introduction of technology and design development.
Leading Microfinance Institutions Working in India :
vSharada's Women's Association for Weaker Section
vAssociation for Sarva Seva Farms (ASSEFA)
vUjjivan Microfinance
vBandhan Microfinance
vMitrabharati - The Indian Microfinance Information Hub Mysore Resettlement and development Agency (MYRADA)
vSADHAN - The Association of Community Development Finance Institutions
vSEWA- Self-help Women’s Association
vSKS India - Swayam Krishi Sangam
vStreedhan - Banking with Rural Women
vWorking Women's Forum, Madras, India
vMicrocredit Foundation of India
vSaadhana Microfin Society
vGrameen Koota
vAsmitha Microfin Ltd.
Analysis of MFI Penetration and Spread of Banking Services in India
India has a strong network of public sector banks but availability of banking services in different parts of the country is non-uniform. In places where there is inadequate availability of banking services, the supply side barriers to financial inclusion are particularly high, making availability of MFI services particularly useful. Even though banks often themselves do not provide service tailor made for low income groups, they often partner with Non Government organization (NGOs) through the self help group bank linkage program promoted by the National Bank for Agriculture and Rural Development (NABARD). Hence low income groups in areas with bank branches are often able to access financial services through this route. In this section, we seek to assess if MFIs fill in spatial gaps in banking services by showing high levels of penetration in areas neglected by the banking sector.
To assess the availability of microfinance in a state, the state-wise Microfinance Penetration Indices (MPI) computed by Srinivasan (2009), which indicate a state’s
Role of Micro Finance in Financial Inclusion & Poverty Alleviation in India

46
share in microfinance relative to its share in the country’s population were usedix. States with MPI greater than 0.5 have microfinance shares which are at least half their population share. Such states are classified as having “high microfinance coverage”. Regions with MPI equal to or lower than 0.5 are considered as having “low microfinance coverage”. As the MPI by definition should be around 1.0 for the state to be represented in the proportion of its population, a ratio of 0.5 indicates that 50 percent progress has been made.
For banking penetration, the average population served per bank branch in each state is used. This is a frequently used measure of financial inclusion with regard to banking services. The national average for the population per bank branch is 15,000 and hence regions having higher than 15,000 are considered as having “low banking coverage” while those having lower than 15,000 are considered as having “high banking coverage”.
Key Strategic Requirements for MFIs
Once MFIs have figured out the opportunities and potential impact that BC operations may have on their core operations, the next step is for MFIs to explore the key strategic requirements that BC operations entail. Some of the broad areas that must be considered include:
v Cashflow Profile. What are the upfront investments that they need to make in order to function as BCs? What is the time horizon that will be required to break even? What will be the funding sources to cover these investments?
vKey Partners. What are the criteria to be used to select the partner bank and TSP? To what extent does the MFI want to retain the various channel management roles (as BC, ANM and CSP) itself, or to delegate it to third parties? What are the key roles and responsibilities between the various partners? We address this set of questions further in the next two sections.
vCustomer Acceptance. What is the level of client literacy and their ability to understand the new BC-based services? What are the marketing messages and use cases that will most inspire customers to try the service?
vTechnology and Operational Readiness. What is the current state of technology that is available for BCs? Are the MFIs’ back-office systems ready to handle real-time transaction accounting? Does the MFI have sufficiently robust processes to handle account openings in conjunction with banks?
vStaffing and Training Requirements. What will be the additional staff requirement for BC operations? This will be particularly important for NBFCs that cannot use their existing staff members for BC operations. Moreover, what will be the training requirements for their staff to be able to offer BC services to clients? While most of the staff will have prior experience in cash management,
Priyanka Sharma
47
many might have very little experience with technology or savings services.
Government Initiatives for Promotion of Micro Finance to Alleviate Proverty
As part of the poverty alleviation measures, the Government of India (GOI) launched the Swarnjayanti Gram Swarozgar Yojana (SGSY) in 1999 where the major emphasis is on self-help group (SHG) formation, social mobilisation and economic activation through micro-credit finance. Up to March 2003, 13.38 lakh groups were constituted in 33 States and Union Territories, of which 33,436 SHGs only could take up economic activities for their economic sustenance. Simultaneously, the Government supports the NABARD to take up activities such as group formation, micro-finance and economic activation.
vBesides this, the Rashtriya Mahila Kosh (National Credit Fund for Women) and the Department of Women and Child Development have their own programmes under which micro credit is being provided for economic empowerment of the rural poor.
vThe year 2001-02 marked a decade of self-help group-bank linkage programme in India. With the growing importance of the micro-credit through SHG-bank linkage in India, the Reserve Bank of India (RBI) in 1996 included financing to SHGs as a mainstream activity of banks under their priority sector lending.
vThe Government bestowed national priority to the programme through its recognition in the 1999 Budget. While the GOI tries to widen the micro-credit reach for the million poor in India through the self-employment scheme, namely, SGSY, the NABARD envisages reaching banking services to one-third of the very poor in India, that is, a population of about 100 million rural poor through one million SHGs by 2007-08.
vAn internal group of the Reserve Bank on Rural Credit and Micro- Finance (Chairman: Mr. H. R. Khan) was set up to examine the issues relating to micro-finance. The Government of India has taken several steps to create a supportive regulatory environment and sustain the momentum of growth within the sector. To encourage foreign participation in micro finance projects, foreign direct investment (FDI) was allowed in micro and rural credit in 2001. Micro-credit has been a thrust area with Reserve Bank of India (RBI) though the vehicles of credit extension have been evolving over a period of time. RBI’s initiatives indicate that it places a high importance to a supportive regulatory environment. It recognizes that it is imperative to promote linkage and integration of micro-credit providers with the formal financial system so that a continuum of institutions providing microfinance can flourish.
Challenges Ahead:-
The challenges of the organizations of micro finance provision and of capacity building for it become all the more acute in the context of developmental goals and changing
Role of Micro Finance in Financial Inclusion & Poverty Alleviation in India

48
paradigms of development. Micro Finance institutions face the following challenges.
a. The main constraint with regard to flow of credit to poor borrowers seems to be the comparatively high transaction cost to the banks in financing a large number of small borrowers who require credit frequently and in small quantities. The same holds true of the costs involved in providing savings facilities to the small, scattered savers in the rural areas. Besides, the perceptions of risk in financing small borrowers who are unable to offer physical collaterals, the urban orientation of field staff, inflexibility in their operations in terms of producer and policies.
b. Non-Governmental Organizations are committed to their work they are by and large poor professionals. Many NGOs lack clear vision, mission and strategies and hence, their interventions become a journey without a destination. In many cases NGOs are badly affected by political and religious leaders and in a few cases by certain extremists.
c. The mounting over dues under these programmes, the proportion of those assisted crossing the poverty line, a high proportion of assets getting mismanaged or disbanded and continuing high proportion of indebtedness from informal sources forced NABARD to look into the very premise of these programmes more seriously.
d. The credit needs of the rural poor are very peculiar and there is no clear cut distinction between the requirements for production and consumption purposes. The credit worthiness of rural poor according to experts is much above the normal requirement as they are very much accustomed to a system of payment of a very high interest rate.
e. Most of the formal credit agencies participating in the credit delivery system suffered from financial difficulties such as erosion of capital, accumulation of losses, mounting over dues and organizational weaknesses, etc.
f. It is difficult to assess the effect of interest rates on the demand for rural credit; evidence indicates that it is not so much the interest rates as inadequate supply of credit that affects the performance of this sector.
g. The serious problem of viability as the margin between their lending rates and cost of funds was not enough to cover their non-financial transaction cost. The mandatory lending rates of interest and rising cost of establishment etc have a far reaching impact on the micro finance.
h. The Non-Governmental Organizations lack adequate capital base to sustain and promote micro economic enterprises. The Self Help Groups strategy for promotion of micro finance in India has been targeted but due to lack of proper entrepreneurship and skills to ensure proper management of micro enterprises
Priyanka Sharma

49
has bearing upon the micro finance.
i. In spite of vast expansion of formal credit institutions, the rural poor at time of emergency approach the informal credit system. The borrowings from such institutions are very much convenient but with very hard terms and conditions. Over the years, due to the existence of competitors and due to less business, these informal credit groups tightened their conditionality and tried to fully exploit the poor people as and when a situation arises.
j. Micro finance products are of low quality and do not offer value (i.e., effective costs are too high). The majorities of micro finance institutions suffers from severely constrained effectiveness of efficiency of their procedures, structures and staffing and are thus neither profitable nor sustainable.
k. The increasing amount of savings mobilization by MFIs has to take place within a regulatory framework. In the absence of the same, the relative laxity given scope for unscrupulous elements to enter the sector and exploit the hard earned savings of the poor.
Suggestions:-
The credit both for introducing Self Help Groups as financial intermediaries for poor as well as for the result achieved so far under the linkage programme in major way goes to the NGOs in the country. Non Governmental Organizations have emerged as the major Self Help Promoting Institutions. While some have taken up Self Help Promoting Institutions role as an add-on ctivity under NABARD’s initiative, may have been pursuing the role on their own even before the programme had been initiated.
The following suggestions are made for making the micro finance as effective tool for alleviation of rural poverty.
a. Rural credit in general and micro credit in particular is running through its transition period. Micro finance institutions in the state are yet to be grown so that the benefit will reach to the poor. Banks are required to participate in large scale in promoting the MFIs to ensure the flow of adequate and timely credit to the rural sector.
b. There is a need for the development of a symbiotic relationship between NGOs and banks with the former efficiency utilizing their strength in social engineering and the latter focusing on pure financial intermediation.
c. The commercial banks must provide a greater linkage to Self Help Groups in providing them higher amount of bank loans. The Non-Governmental Organizations and banks officials as well as primary school teachers should be engaged in formation and development of groups in rural areas.
Role of Micro Finance in Financial Inclusion & Poverty Alleviation in India

50
d. Micro credit loans are too small to make a dent in poverty alleviation and growth. Micro credit has to do with accumulations of assets physical, financial and human.
e. NGOs have to become accountable to an appropriate forum. Accountability norms have to be laid down properly. The financial loss of the NGOs is not adequate. There is need for broad design and improving it.
f. Banks approach towards NGOs should be positive and NGOs should develop an action plan for strengthening entrepreneurship development programme. Government should monitor and assist the NGOs through financial and moral support.
g. More effective steps should be taken by the Government in the training of Self Help Group members to make micro financing more meaningful.
h. A proper mechanism should be evolved to prepare database on Self Help Groups, Self Help Promoting Institutions, Micro Finance Institutions etc., while emphasis should be given on formulation of Women Self Help Groups, ensuring homogeneity and bank linkages.
i. Though the banking sector has played a significant role for making the provision of finance to the rural masses, but they should also give due weightage for equipping the poor with the necessary skills to become efficient money managers and successful entrepreneurs so as to avoid more and more people falling into debt traps and subsequently the death traps.
j. The increasing amount of savings mobilisation by MFIs has to take place within a regulatory framework. In the absence of the same, the relative laxity given scope for unscrupulous elements to enter the sector and exploit the hard earned savings of the poor.
REFERENCES:-
Agarwal, Amol, 2008, The Need for Financial Inclusion With an Indian Perspective,IDBI GILTS
Bock, T.A. Demirguc-Kunt and R. Levine (2007) “Reaching out: Access to and Use Banking Services Across Countries” Journal of Financial Economics 85, 234-66.
Machi raju, Indian Financial System
NABARD, Annual Reports.
Rangarajan Committee (2008) “ Report of the Committee on Financial Inclusion” Government of India.
RBI Circulars on Financial Inclusion
Thorat(2007) “ Financial Inclusion- The Indian Experience”, Reserve Bank of India
Priyanka Sharma

51
Bulletin, July, pp.1165-71
V. Leeladhar: “Taking Banking Services to the Common Man- Financial Inclusion”, Fedbank Hormis Memorial Foundation Commermorative Lecture, Ernakulam.
Asher Mukul, G and Shankar Savita (2007): “Reconsider NABARD as the Micro Finance Regulator”
Sanyal Kaushiki: “Microfinance Bill”
Shankar Savita (2007): “Pluses and Minuses of Micro Finance Bill”
Srinivasan, R and Sriram, M.S.: “Micro Finance: An Introduction.
Reflections on the Microfinance Bill Contributed by Members of Karmayog, Mumbai
Micro Financial Sector Development and Regulation Bill 2007.
Awadhesh, K. V., Singh and Shukla, O. P. (2005). “Micro Finance and Urban Poverty Alleviation in India: Emerging Issues and Challenges”. ‘Sustainable Development Opportunities and Challenges”, ‘Serials Publications’, New Delhi, pp. 282-295.
Cirappa and Nirmala, M. (2005). “Micro Finance Institutions and Credit Accessibility to the Poor in Karnataka”, ‘Destination India 2020 – Moving Towards Global Equalisation’,pp.12-16.
Das, S. K. and Nanda, B. P. (2008). “Micro Finance and Sustainable Rural Development”, ‘Micro Finance and Rural Development in India’. New Century Publications, New Delhi, pp.1-7.
Gautam Patikar and Komal Singha (2010). ”Scenario of Micro Finance in India: An Overview”, ’Southern Economist’, Vol. 48, No. 17, pp. 5-8.
Geeta Manmohan, Monika Tushir and Sumita Chadha (2005). ”Rural Banking and Micro Finance”, ’Southern Economists’, Vol. 47, No. 2, pp. 9-12.
Mohanan, N. (1998). “Rural Credit and Self Help Groups”, ‘Fifty Years of Rural Development in India’, Retrospect and Prospect, Vol. 1, R. C. Choudary and Rajakutty, S., pp. 137-150.
Patro, B. K., Patnaik and Priyasi Nayak (2004). “MFIs and Reforms in India”, ‘Second Generation Economic Reforms in India’, Deep and Deep Publication Pvt. Ltd., New Delhi, 277-296.
Rajendran, P. and Karthikeyan, K. (2008). ”Impact of NPAs on Micro Banking Variables”, ’Southern Economists’, Vol. 47, No. 2, pp. 5-12.
Saraswathy, A., Porkodi and Bhuvaneshwari, M. (2009). “Micro Finance in Krishnagiri District: A Tool for Poverty Alleviation”, ‘Indian Journal of Marketing’, pp. 47-57.
Srinivas Rao K. (2008). “Micro Finance to the Poor: A Tool for Poverty Alleviation and Women Empowerment”, ‘The Management Accountant’, Vol. 43, No. 2, pp. 86-87.
Role of Micro Finance in Financial Inclusion & Poverty Alleviation in India

1.0 INTRODUCTION
With economic liberalization in the early 1980s in India, one of the major shifts was in the form of switching from a fixed exchange rate regime to flexible exchange rate regime. In fixed exchange rate regime, there is always relative certainty that the prices of exportable and importable items, along with the respective commodities are supposed to behave in a stable and known way, and, therefore they result in stability in the value of merchandise balances. Whereas, the shift from fixed to flexible exchange rate regime, will definitely suggest some heavy and sudden fluctuations in the price and volumes, followed by the value of all transaction taking place on merchandise balances. Moreover, as a consequence of liberalization of exchange rate regime, the quantum of foreign exchange inflow and outflow has surely increased on account of exports and imports respectively. This led us to analyse two aspect of balance of payment, named, growth and impact of different policy period on the performance of agricultural and non-agricultural trade balance, over the period of time.
In addition, certain policy periods have also influenced the trade balance. This study examines the trends in trade balances of agricultural and non-agricultural items along with overall merchandise trade during the study period that begins from 1990-91 to 2012-13. It also reviews the impact of liberalization, W.T.O., economy recovery and global crisis. In the current study two distinct attempts are made. The first attempt is directed to see the net impact of such policy on the improvement and deterioration of agricultural and non-agricultural trade balances by computing its growth and instability. Lastly, the study finds out the significant contribution of agricultural and non-agricultural trade balances on the merchandise trade balance. The remainder of the paper is organised as follows. The section on review of literature is contained in section 2, which talks about the extant studies related to agricultural and non-agricultural trade balances. Section 3 provides rationale of the study, which shows the concern interest of the work undertaken under this study.
The Horizon - A Journal of Social Sciences July 2015, pp. 52-68
ISSN-0975-5535No.-II/2015, Volume-VI,
“GROWTH OF INDIA’S AGRICULTURAL AND NON-AGRICULTURAL TRADE BALANCE: A
POLICY PERIOD ANALYSIS”
1 2K.V. Bhanu Murthy & Phool Chand1Department of Commerce,Delhi School of Economics,Delhi University, Delhi
2PGDAV (M) College, Department of Commerce, Delhi University, Delhi University, Delhi

53
Data and methodology is contained in section 4, which talks about the collection of data first, followed by an attempt to measure the growth during four policy periods. Results and analysis are explained under Section 5. Conclusion and implication of the study is discussed under section 6.
2.0 Review of Literature
We went through the relevant published literature on agriculture trade and found that most of the studies had dealt with some specific aspect of it. In most of the literature, it has been found that the studies are related with the general trend analysis of agriculture export. Hence, we felt the need for making a comprehensive study of all aspects that results growth in agriculture export.
The major works done were in some specific area /areas of agriculture export or for a limited or specified time period, some of which have been listed below.
Babcock et al. (2002) have analyzed the impact of liberalizing agricultural markets. They have used the Food and Agricultural Policy Research Institute (FAPRI) modeling system to analyses the impact of trade and farm policies on world flows, prices, and market equilibrium by considering two scenarios. In the first scenario all distortions directly affecting agriculture (domestic farm programs and border measures, e.g. TRQs and tariffs), are removed; this is referred to as full liberalization. In the second scenario, only trade liberalization (the elimination of border measures) is implemented; this is referred to as trade- only liberalization. For each scenario, policy parameters are changed and a new baseline is computed for the outlook period (2002-2011). The two trajectories are then compared. Results are reported as average annual changes over the outlook period in deviation from the baseline. The world net trade is estimated to increase by 7.9% following the removal of all distortions and by 5% with trade liberalization alone. On account of the removal of the export subsidy, Indian exports are estimated to decrease under the full liberalization scenario. Under this scenario India is projected to become a net importer in 2003/04 and a year later with trade-only liberalization. However, considering the quality and price differences in Indian wheat and large transport costs from major exporting countries such as the US, this projected import may not be realistic. Alagh (1994) in his paper on “Macro Policies for Indian Agriculture” emphasizes that significant structural changes are taking place in the Indian economy and that the eighties have shown a remarkable diversification of India’s agro-based economy in response to substantial acceleration of demand. The analytical work on the economy at a regionally disaggregated level shows that both prices and infrastructural investments are important factors that determine variations in agricultural productivity.
Agricultural Policy in India has so far been guided primarily by domestic concerns, the most important among these being the need to provide food security to the rapidly
“Growth of India’s Agricultural and Non-agricultural Trade Balance: A Policy Period Analysis”

54
rising population through domestic production. A hallmark of the earlier trade policy was that except for a few traditional commercial crops, the entire agricultural sector was insulated from world agricultural markets through controls of exports and imports. The structural adjustment programme undertaken in India, including the reforms in trade policy and the multilateral trading system following the signing of the Dunkel text would have serious implications for the Indian agriculture. Nayyar and Sen (1994) has analyzed the likely implications of trade liberalization on the Indian agriculture by undertaking a detailed comparison of domestic and international prices of 18 commodities. They have also analyzed the likely impact of multilateral trade liberalization, including that of the signing of the Dunkel text, on Indian agriculture. The implication of the Dunkel text, which envisages withdrawal of subsidies on exports, removal of all non- price based restrictions, increase in market access, withdrawal of domestic support to agricultural except in green areas, etc., would influence profoundly world agricultural trade and prices and have far – reaching implication for the agricultural sector in India. They concluded that because of the deterioration in India’s terms of trade, structural rigidities inhibiting supply response, and important deleterious impact of TRIPS on Indian agriculture, on balance, the costs of multilateral trade liberalization may be higher than the benefits. They argued that firstly, tariffs on imports and taxes on exports should be higher than the usual optimum levels; secondly, quantitative restrictions on trade should continue in some commodities like food grains along with retaining buffer stocks for food security reasons; and thirdly, considerations of India’s comparative advantage should be made an integral part of domestic agricultural policies both for investment planning in infrastructure and in setting ‘support price’.
Agricultural price policy is another important area, which is affected by the new economic policy directly. This is because the ‘market- friendly’ approach of the new policy, lifting internal controls on trade in food grains, integration with the world economy consequent on the signing of the Dunkel text etc. are likely to weaken considerably the role and importance of the administered price structure prevalent in India. Vyas (1994) argues that the price policy, which had evolved in the context of the shortages in India, constituted a part of a food management system, that was primarily concerned with providing food security to the population through augmenting domestic production of food grains and protecting the interests of the consumers. While the price policy aimed at keeping the food prices low, it was also supposed to play a positive role in augmenting production by ensuring remunerative prices to the farmers along with the assurance of minimum support prices. It was, of course, fully recognized that non – price factors like irrigation and rural infrastructure played a much greater role in increasing production.
It is generally claimed that trade policy reforms including devaluation of their
K.V. Bhanu Murthy & Phool Chand

55
currencies by the developing countries and withdrawal of subsidies to their agriculture by the developed countries would give special advantages to the agricultural and agro- industrial exports from developing countries. Hence, agro – industries, besides catering to a burgeoning domestic market, have great export potential. This underlines the need to give high priority to their development in India in the context of the new economic policy. Goyal (1994) in his paper, ‘policies towards development of agro- industries in India’ has discussed the various issues relating to the prospects of agro- industries in India. Goyal points out that in the context of traditional agriculture, the technology of production in agro- industries and post- harvest processing remained primitive and stagnant for a long time. He also outlines the important factors that were responsible for the growth of cottage, small and agro – based industries on modern lines in post- independent India. He suggests a policy mix for the development of agro- industries keeping in view the crucial role of agro- industries.
The role of exports as an engine of economic growth has long been a focus in the trade and development literature. Agriculture’s contribution to total exports is often substantial in developing countries, and it is surprising that there have been few empirical studies on the impact of agricultural exports on GDP.
Dawson (2005) has examined the contribution of agricultural exports to economic growth in LDCs by developing sources- of – growth equation from a dual economy model by using panel data for 62 LDCs for 1974- 1995 and has shown that there are significant structural differences in economic growth between low, lower – middle, and upper income LDCs. Investment in the agricultural export subsector has a statistically identical impact on economic growth as investment in the non- agricultural export subsector. Suggesting that export- promotion policies should be balanced.
Lopez and Dawson (2010) show that long run a relationship exists between GDP and agricultural and non- agricultural exports of developing countries. The relationship between GDP and agricultural and non- agricultural exports were estimated for 42 countries using panel co-integration method. Structural differences exist in the relationship by broad income group. Balanced export – promotion policies are implied for the poorest countries, but for those with higher incomes, higher economic growth is achieved from non- agricultural exports.
Johnston and Mellor (1961) argues that increasing agricultural exports leads to increasing economic growth, and that export- led growth from agriculture may represent optimal resource allocation for those countries which have a comparative advantage in agricultural production.
Regional disparities and instability in agriculture has remained the subject of deep
“Growth of India’s Agricultural and Non-agricultural Trade Balance: A Policy Period Analysis”

56
concern in the area of agricultural economics in India. Instability in agricultural production raises the risk involved in farm production and affects farmers’ income and decisions to adopt high paying technologies and make investments in farming. It also affects price stability and the consumers, and increases vulnerability of low- income households to market. Instability in agricultural and food production is also important for food management and macroeconomic stability (Chand and Raju, 2009). Besides instability, Indian agriculture is also known for sharp variations in agricultural productivity across space which results in various types of disparities in resource endowments, climate and topography and also due to historical, institutional and socio-economic factors.
Potential of green revolution technologies in increasing productivity and production of various crops in India was recognized in the very early stages of adoption of this technology. Along with this, a concern arose whether increase in production, brought about by crop technology, was accompanied by rise in year-to-year variability in production. The first serious attempt to examine the effect of new seed-fertilizer technology, known as green revolution technology, on year-to-year fluctuations in crop output was made by Mehra (1981). The study has compared variability’s in production, across crops and regions in India, during the period 1949-50 to 1964-65 and 1964-65 to 1978-79, to find changes in instability in the period before and after introduction of high yielding technologies. The analysis shows that during the ten-year period since the adoption of innovative technologies, the standard deviation and coefficient of variation of production of all the crops aggregates increased as compared with the period 1949-50 to 1964-65.
Hazell (1982) came out with another study which made use of the same data as used by Mehra (1981), but adopted improved analytical framework to analyses variability. Hazell (1982) confirmed the finding of Mehra (1981), and went a step further in concluding that increase in production instability was an inevitable consequence of rapid agricultural growth and there is little that can be done about it. Both these studies attributed the increase in instability to the new seed-fertilizer technology. Another paper by Ray (1983a) went a little deeper to probe causes of instability in Indian agriculture during the period 1950 to 1980. The paper adopted a very simple but highly robust indicator of fluctuations in output. This was given by standard deviation in annual output growth rates over a specified period. The study found that instability in production increased in the 1960s and rose further during the 1970s for most of the crops and crop aggregates. An interesting finding in this paper was that instability in wheat production, which was experiencing highest coverage under HYV’s among all crops, also increased markedly during the 1960s, but its production increased at a fairly stable rate during the 1970s.
Based on the detailed analysis of various factors affecting growth and instability, Ray
K.V. Bhanu Murthy & Phool Chand

57
(1983a) strongly refuted the assertion made by Hazell (1982) that “production instability is an inevitable consequence of rapid agricultural growth and there is little that can be affectively done about it”. According to Ray (1983a), the magnitude of production instability is essentially a function of the environment which can be considerably molded through human efforts. The author suggested that causes for increase in production instability after adoption of green revolution technology were (i) increase in the variability of rainfall and prices and (ii) increase in sensitivity of production to variation in rainfall, and not the growth in production.
In another similar but more detailed study by Ray and two more authors it was found that amplitude of fluctuations in output for all categories of crops, except wheat, have increased significantly in the post-green revolution period, 1966-1985 or 1968-1985 (Rao et.al. 1988). The study concluded that since wheat benefited to the greatest extent from green revolution technology, the observed increase in variability in foodgrains and all crops output cannot be attributed to green revolution technology as such like Ray (1983a), this study has also attributed rising vulnerability of agricultural output to increase in sensitivity of output to variations in rainfall traceable to the high complementarily of new seed- fertilizer technology with water. Both, Ray (1983a) and Rao et al. (1988) on one hand refute the impact of green revolution technology on variation in output for some crops, and, on the other hand, ascribe it to the increase in sensitivity of output and complementarity of new technology with irrigation- which are indeed a part of the new technology. However, in conclusion, the authors clearly state that the instability in agricultural production has increased in post-green revolution period (Rao et al.)
Larsen et al. (2004) have examined instability in area, yield and production for the major crops in India by dividing the period 1950-51 to 2000-02 into pre-green revolution and post-green revolution periods. The paper has reported that production instability for foodgrains increased by 153 per cent and yield instability increased by 244 per cent between the two sub-periods. Based on this, the authors have concluded that widespread adoption of green revolution technology increased instability in yield and production of foodgrains. There was a serious inconsistency in the results on instability in food grain production reported in this paper. While instability in production of cereals and pulses was reported to decline between pre and post green revolution periods by 10 and 5 per cent, respectively, the instability in the production of food grains, which is sum of cereals and pulses, was reported to have increased by 153 per cent in the same period. Further, this study did not divide post 1968 period into sub-periods.
In contrast to the choices by Larsen to keen entire post green revolution period as one set, Sharma et al. (2006) have estimated variability in production and yield by choosing smaller set of years. The results of the two studies on instability are
“Growth of India’s Agricultural and Non-agricultural Trade Balance: A Policy Period Analysis”

58
somewhat contradictory in the sense that Larson has reported a rise in the instability over time, whereas Sharma have reported a decline in instability over time.
Ray (1983b) developed a very simple measure of instability given by the standard deviation in annual growth rates. This method satisfies the properties like instability based on de-trended data and comparability. Moreover, the methodology does not involve actual estimation of the trend, computation of residuals and de-trending, but all these are taken care in the standard deviation of annual growth rates.
Kumar and Rai (2007) have analyzed the performance and competitiveness of export of tomato and its products from India to find (i) production and export performance of tomatoes in India, (ii) impact of trade liberalization on export of tomato and its products, (iii) major destinations of Indian tomato and tomato products, and (iv) determinants of tomato export. The export performance ratio (EPR) has been estimated to examine the export competitiveness of India in tomato and tomato products. Annual compound growth rate and coefficient of variation for two periods, before (1985-1994) and after (1995- 2004) the commencement of WTO have been estimated to study the impact of trade liberalization on the export performance of India in tomato and its products. Export demand function has been estimated using OLS technique and the factors affecting the export of tomato and its products from India have been identified. The study has revealed that the existence of high instability in export of tomato and its products require the attention of policymakers to retain hold on the international market.
Ramane et al. (2003) conducted an empirical analysis of India’s Agricultural trade performance in an inter-temporal framework. The study used annual compound growth rates and instability index for the eight-year period starting from 1991-92. An exponential regression function was used for computing growth rate and instability index. The study pointed to the decline in share of agriculture and allied exports in India’s overall export basket. The growth trend of agriculture and allied exports followed an uneven trend. High instability of agricultural exports was confined by a large value of the instability index for the period under study.
Tandon (2005) made an attempt to take a closer look at the performance of India’s agricultural exports and imports during pre and post reform periods and to assess the changing growth pattern of trade. The author used log transformed equation for finding out the annual growth rates.
Log Y = á + á * time + e,t 1 2
Where, Y = aggregate export earnings of the agricultural sectort
Time = time variable
á = intercept1
K.V. Bhanu Murthy & Phool Chand

59
a = slope coefficient2
e = random error
For structural break, the author used dummy variable by assigning value 0 for pre-reform period and 1 for post reform period. For this purpose the author used log transformed function form, indicating by
Log Y = a + a *time + a *dummy + a * dummy*time + e,t 1 2 3 4
Besides, the instability index (II) is also computed. The author concluded that the trend of agriculture exports recorded a combination of two types of shifts during the post-reform period. While the agriculture exports increased due to relatively open agriculture economy (effect of intercept dummy), the exports decelerated due to relatively strong emphasis on manufactured exports (effect of slope dummy).
Further, instability of agriculture exports has gone down during the post-reform period. It has been observed that lower rate of growth of aggregate agriculture exports is associated with lesser uncertainty revealed by a decline in instability index for aggregate agriculture exports.
3.0 Rationale of the Study
Most of studies are looking only at the positive aspect of liberalization of the external sector in term of export performance. Whereas we believe that with liberalization, globalization, world recovery, and global crisis, exchange rate is likely to become more volatile. We believe all these policy phases would have a positive as well as negative impact on merchandise balance. The following impact would be as follows:
Liberalization (Positive impact):
With exchange rate liberalization, we may expect better Trade Balance due to depreciation of overvalued currency.
vWe may expect that with opening up and greater competition, India’s exports may become more competitive
Liberalization (Negative impact):-
vWith exchange rate depreciation, imports would become more expensive and since essential imports as petroleum, food, fertilizers etc. have inelastic demand, the total import bill may rise.
vWith liberalization, since foreign competition would be introduced within the economy, it may adversely affect exports
Globalisation (Positive impact):
vWith removal of tariff globally, the export potential would also increase.
vWith globalization since India would face a uniform trading environment, Trade
“Growth of India’s Agricultural and Non-agricultural Trade Balance: A Policy Period Analysis”

60
Balance would improve.
Globalisation (Negative impact):
vWith the import under Open General Licence Trade Balance would be adversely affected.
vWith globalization and a uniform trading environment, the world economy may gain at the cost of developing countries.
World recovery (Positive impact):-
vWith the overall increase in world GDP, there would increase demand for domestic exports because India is integrated with rest of the world (income effect).
vThis may lead to economies of scale and reduction in cost of our exports. Therefore, our exports may become more competitive (substitution effect).
World recovery (Negative impact):
vIf other countries can take advantage then our imports will increase.
Global Crisis (Positive impact):
vSince our markets are insulated compared to developed countries, we would expect some gain in terms of condition (terms of trade), exports, etc.
Global Crisis (Negative impact):-
vSince our exports are largely depends on developed countries and they were hit by recession, we would expect decline in the demand of our exports.
4.0 Objectives and Hypotheses.
Based on the above rationale, the main objectives of this studycan be summed-up as:
vTo measure the general trends in India’s merchandise trade balance;
vTo measure the general trends in India’s agricultural trade balance;
vTo measure the general trends in India’s non-agricultural trade balance;
vTo analysethe performance of India’s merchandisetrade balance, agricultural trade balance and non-agricultural trade balance in four different policy period
4.1Hypotheses
We have formulated various hypotheses based on the above objectives:11. H :- India’s merchandise trade balance does not show any trend.0
22. H :- India’s agriculturaltrade balance does not show any trend0
33. H :- India’s non-agriculturaltrade balance does not show any trend0
K.V. Bhanu Murthy & Phool Chand

61
44. H :- Different policy periods do not have any impact on the growth of 0
merchandisetrade balance, agricultural trade balance and non-agricultural trade balance.
5.0Data and Methodology
5.1 Data Source-The requirement of the study consists of three different sets of variables. One set relates to merchandise balance of payment, while the others relate to agricultural and non-agricultural trade balance. All these three balances are further categorised into their two individual variables – export and import. All sets of data are collected from www.indiastat.com.
5.2 Methodology
In order to analyse the trends in India’s agricultural and non-agricultural trade balance, we have computed the overall as well as policy period’s growth rates. The time span of the study covers a period from 1990-91 to 2012-13.
For analytical purposes to divide the time span of the study into four policy period
1. Policy period I (1990-91 to 1993-94) period of liberalization
2. Policy period II (1994-95 to 2000-01) period of W.T.O.
3. Policy period III (2001-02 to 2006-07) period of world recovery
4. Policy period IV (2007-08 to 2012-13) period of global crisis
In the current study there are two types of analyses that we need to explore.One of them is to find out the growth rate and another is to find out the impact of four different policy periods. First we show how the growth rate of the concerned analysis is estimated and then we will talk about how to capture the impact of policy periods.
We have used semi-log regression equation and for that we have regressed the log of variable with respect the time. Therefore, regression equation can be written as
afollows: Y = e + ßt ……(1)
Taking log of both sides and adding an error term;
Log Y = a + ßt + µt ……. (2)
Where, Log Y = natural log of variable Y
a = intercept term
ß = Growth rate.
t =time (1990-091 to 2012-13)
µt = error term.
5.1.1 Growth in Trade Balance
Our main innovation is in the computation of exponential growth rate of trade
“Growth of India’s Agricultural and Non-agricultural Trade Balance: A Policy Period Analysis”

62
balance. Since trade balance is often negative, it is not possible to take log, without which the growth rate cannot be estimated.
The growth rate of trade balance is found out with the help of following equation:
Growth of Trade Balance (TB) = Growth of exports (-) Growth of imports.
The above written regression equation help us to find out the rate at which the current account value grew with the passage of time. The “ß” give us the rate of growth, from 1990-91 to 2012-13. The two growth rates are estimated with the help of two growth equations: one for imports and one for exports.
5.1.2 Policy Periods Growth Rates
In the above equation the purpose of finding out different growth rate for different policy period will not work since we have not taken into account policy change variable indicator. So on account of this requirement we need to change our regression equation. In order to capture the policy change indicator variable, we need to introduce dummies in the semi-log regression equation. After doing this we would be able to find out different growth rates for different policy periods as well as different intercept term, for different policy periods. So, after introducing dummies variable, the regression equation would be estimated.
The regression equation can be written as follows:
Log Y = a1 +b1t + b2D2 + b3D3 + b4D4 + b5D2t + b6D3t + b7D4t + µt .… (3)
Where in
Log Y = natural log of variable Y
a = intercept at the I policy period 1
b = growth rate in the I policy period1
b = difference in the intercept of II and I policy period2
b = difference in the intercept of III and I policy period3
b = difference in the intercept of IV and I policy period4
b = difference in the growth rate of II and I policy period 5
b = difference in the growth rate of III and I policy period6
b = difference in the growth rate of IV and I policy period7
µt = error term.
D2 = 0 for 1990-91 to 1993-94,
1 for 1994-95 to 2000-01,
0 for 2001-02 to 2006-07.
K.V. Bhanu Murthy & Phool Chand
63
0 for 2007-08 to 2010-11
D3 = 0 for 1990-91 to 1993-94,
0 for 1994-95 to 2000-01,
1 for 2001-02 to 2006-07.
0 for 2007-08 to 2010-11
D4 = 0 for 1990-91 to 1993-94,
0 for 1994-95 to 2000-01,
0 for 2001-02 to 2006-07.
1 for 2007-08 to 2010-11
Therefore, with the help of above written regression equation we can easily find out the intercept as well as growth rate for different policy period as follows:
Policy Period Intercept Slop
I (Liberalisation) a1 b1
II (W.T.O.) a1 + b2 b1 + b5
III (World Recovery) a1 + b3 b1 + b6
IV (Global Crisis) a1+ b4 b1+ b7
There are two forms of dummies:
vIntercept dummy: It is at a point of time.
vSlope dummy:This dummy gives us the difference in slope, which in our case is the growth rate. Therefore, the growth rate in each period is calculated by adding the slope of the slope dummy with the slope of the initial period. The slope dummies are applicable over a period of time while the intercept dummies are applicable at a point of time.
In case the initial period does not display any significant growth rate, the slope dummy for the second and the third period shall be their own slopes as such and they need not be added to the initial slopes. Conversely, if either the intercept or the slopes of the subsequent periods are not significant, they would indicate that there is no structural break, respectively, in the intercept or the slope. That is in the level or the growth rate, compared to the base period.
In this way by introducing dummies, we can find out growth rate and the intercept for different policy periods. For the purpose of finding out the growth rate, as well as, intercept we have taken the level of significance as 0.05 or 5%. Therefore, wherever the level of significance is more than 0.05 we have taken the growth rate as 0%, else it is taken as such. Similarly, for both the level and intercept.
“Growth of India’s Agricultural and Non-agricultural Trade Balance: A Policy Period Analysis”

64
6.0 Results and Analysis
In the following sections we are interpreting the results of post reform policy periods analysis of different three balances – merchandise, agricultural, and non-agricultural. First we estimated the overall growth rates of merchandise trade balance and its components over a period of 23 years. Secondly, we estimated the impact of different policy periods on merchandisetrade balance, agricultural trade balance and non-agricultural trade balance in terms of growth patterns.
6.1 Overall Growth Rates of merchandise balance and its Components
Initially we have estimated the growth rate of two heads given below for the whole period 1991-2013, with the help of a set of semi-log growth equations for each of the head and the overall merchandise trade balance. It becomes clear that all growth rates are significant at 5% level.
Table 6.1 Growth Rate of Merchandise Trade Balance and Its Components
* All are significant at 5%.
Surprisingly, the growth rates of both agricultural and non-agricultural trade balance are significant and negative around 3.5 and 0.6 respectively, on the whole. The growth rate of merchandise trade balance is relatively low and stands at (-) 1.05. This appears to be an unexpected trend because negative trade balance is often associated with the growth of essential imports which are primary products. Given the uncertaintity of weather conditions and the conditions in agricultural it is natural to expect a higher growth rate of agricultural import. In fact, the growth rate of agricultural imports is lowest. The decline in trade balance is the highest in case of agricultural products. This point towards the need for emphasising on agricultural exports. Even the (-) 3.5% rate could be much improved if agricultural exports increased by 1 or 2%. This would be duable if non-agricultural exports are promoted. Under such conditions we may infact arrived at an overall surplus in merchandise trade balance. Given that non-agricultural trade volume is much larger than agricultural trade the apparent low but negative growth rate (-) 0.6% actually does more damage than the (-) 3.5% of agriculture.
The overall growth rates that have been measured tend to ignore the impact of
Variable Export Import Balance(%)
Merchandise 16.77 17.82 -1.05
Agricultural 14.03 17.50 -3.47
Non-agricultural 17.23 17.84 -0.61
K.V. Bhanu Murthy & Phool Chand

65
different policy periods both in terms of growth.Therefore, it is imperative to know the patterns of both agricultural and non-agricultural trade balance during different policy periods.
6.1.2Policy Periods Analysis;
There are four policy periods whose precise occurrence is well-known. A well stabilized estimation procedure for incorporating the impact of known exogenous structure breaks is the use of dummy variable. Since there are four historical global events the issue is not to isolate the timing of these events. The issue, however, is to study whether one or more of these policy periods namely-liberalisation, globalization, world recovery and global crisis had any significant impact on the growth rates of both agricultural and non-agricultural trade balance along with overall merchandise balance. Since there could be two types of effects- one on the level and the other on the slope of the concerned variable, we include both types of dummies. The intercept dummy captures the influence of the policy periods on the level while the slope dummy captures the impact on the growth rates. In the following analysis we have depicted (Table 6.2) the growth rates of merchandise trade balance and its components.
Table 6.2 Policy Periods Growth Rate of Merchandise Trade Balance and Its
Components
All are significant at 5% level
We have estimated a semi-log Equation 3, with four intercept dummies and four slope dummies. On the basis of the above equation we have first estimated the policy period growth indices in Table 6.2.
The most interesting is that growth rates of agricultural balance are not negative in any of four periods. Surprising, the highest single growth rate of that agricultural trade balance is during the W.T.O. A question arising about the overall growth rates of agriculture trade balance being negative while the policy periods are positive. This could be explained by a compound growth rate of 9.2% p.a. during a 17 years period
Policy Period Merchandise Agricultural Non-Agricultural
Balance Balance Balance
Liberalisation 6.055* 2.80* 6.56*
Globalisation -5.78* 16.36* -4.95*
World Recovery 6.055* 6.25* 6.56*
Global Crisis -0.21* 1.62* -0.56*
“Growth of India’s Agricultural and Non-agricultural Trade Balance: A Policy Period Analysis”

66
(1991-2007). Thereafter the growth rate decline during the crisis period. The partial growth rate of 1.62% needs to be understood in two ways. It is in relation to the base period (liberalisation). Two, it is a net growth rate. Therefore, even during crisis agricultural balance maintained a positive growth rate. This speaks for robustness of agricultural exports. The maximum surge between two policy periods (liberalisation and globalisation) is also in the case of agricultural balance which is around 14%. While, the maximum fall is in the case of non-agricultural balance which is around (-) 12%. On the other hand the merchandise balance and non-agricultural balance follow very similar patterns. There is alternation of the sign in the four policy periods. Global crisis has hit non-agricultural balance most around 6%. In the case agricultural balance the decline is less than 4%.
7.0 Conclusion
The growth rate of balance of trade under 3 heads was estimated during 1991-2013. It has been seen that the growth rates of both agricultural and non-agricultural trade balance are significant and negative, and are around 3.5 and 0.6, respectively,during the whole period. The growth rate of merchandise trade balance is relatively low and stands at (-) 1.05. This appears to be an unexpected trend because negative trade balance is often associated with the growth of essential imports which are primary products. With this fact we have rejected the null hypothesis that merchandise balance, agricultural and non-agricultural balance does not show any trend. The study concludes regarding the four policy periods that the high growth rate in the liberalization period appears to be a statistical phenomenon. During WTO other countries could take full advantage of the new multilateralism, lower tariff and the open access. But India could not do the same. Surprising, the highest single growth rate of that agricultural trade balance is during the W.T.O. World recovery gave a fillip to trade and we gained but very soon the crisis period set in. With this fact, we have also rejected the null hypothesis that different policy periods do not have any significant impact on the growth of agricultural, non-agricultural and overall merchandise trade balance.
Bibliography
Alagh, J.K. (1994). Macro Policies for Indian Agriculture, Ed. G.S. Bhalla, Institute for Studies in Industrial Development, New Delhi.
Annual Report 2010-2011, Department of Agriculture & Cooperation, Ministry of
Agriculture, GOI.
Babcock, Bruce A, John C. Beghin, Jacinto F. Fabiosa, Stephane Cara, De, El-obeid Amani; Fang; Cheng, Hart; Chad, E. Isik; Murat , Matthey; Holger, Saak; Alexander, E.; and Kovarik, Karen (2002). “The Doha Round of the World Trade Organization: Appraising Further Liberalisation of Agricultural Markets”, 02- WP 317, FAPRI.
K.V. Bhanu Murthy & Phool Chand

67
Chand, Ramesh and S.S. Raju (2009). “Instability in Indian Agriculture during Different Phases of Technology and Policy”, Indian Journal of Agricultural Economics, 64(2), 283- 285.
Coppock, J.D. (1977), International Trade Instability, Famborough: Saxon House, Teakfield Ltd
CSO (2011). National Accounts Statistics. Central Statistics Organisation. Ministry of Statistics and Programme Implementation
Dawson, P.J. (2005). “Agricultural Exports and Economic Growth in Less Developed Countries”, Agricultural Economics, 33, 145-152. Economic Survey, Various Issues, GOI.
David, Greenaway, Wyn Morgan and Peter Wright (1999). ‘Exports, Export Composition and Growth,’ The Journal of International Trade and Economic Development, 8(1), 41-51.
FAO. FAOSTAT Agriculture Data. Available at http://faostat.fao.org/site/ 342/default.aspx Goyal, S.K. (1994). Policies towards Development of Agro-Industries in India, Ed. G.S. Bhalla, Institute for Studies in Industrial Development, New Delhi.
Gulati, Ashok, and Anil Sharma (1994). “Agriculture under GATT: What it holds for India, Economic and Political Weekly, 29(29): 1857-1863, July 16.
Hazell, Peter B.R. (1982). Instability in Indian Foodgrain Production, Research Report No. 30, International Food Policy Research Institute, Washington, D.C., U.S.A.
Johnston, B.F. and Mellor, J.W. (1961). “The Role of Agriculture in Economic Development’, American Economic Review, 51, 566–593.
Kaundal, R.K. (2005), “Trade Policy Reforms and Indian Exports, Mahamaya Publishing House, New Delhi.
Kumar, Nalini Ranjan, A.B. Rai and Mathura Rai (2008). “Export of Cucumber and Gherkin from India: Performance, Destinations, Competitiveness and Determinants”, Agricultural Economics Research Review, 21, (Jan-June), 130-138.
Kumar, Ranjan Nalini and Mathura Rai (2007). “Performance, Competitiveness and Determinants of Tomato Export from India”, Agricultural Economics Research Review, 20, Conference Issue, 551-562.
Larson, D.W.E. Jones, R.S. Pannu and R.S. Sheokand (2004). “Instability in IndianAgriculture: A Challenge to the Green Revolution Technology”, Food Policy, 29 (3): 257-273.
Mehra, Shakuntala (1981). Instability in Indian Agriculture in the Context of the
“Growth of India’s Agricultural and Non-agricultural Trade Balance: A Policy Period Analysis”

68
New Technology, Research Report No. 25, International Food Policy Research Institute, Washington, D.C., U.S.A.
Nayyar, Deepak and Sen, Abhijit (1994). International Trade and Agricultural Sector in India, Ed. G.S. Bhalla, Institute for Studies in Industrial Development, New Delhi.
Prebisch, R. (I 950). The Economic Development of Latin America and its Principal Problems. UN Doc. E/CN. 12/89/ Rev.1. Lake Success: New York; United Nations.
Ramane, V. Rajda; Rajendran, C. and R. Meera (2003). “An Analysis on the trade performance of Indian Agriculture since Liberalization”, Chapter 12 in Y. K. Alagh (ed.), Globalisation and Agriculture Crisis in India, Deep and Deep Publication (P) Limited, Delhi Rao, C.H. Hanumantha, Susanta K. Ray and K. Subbarao (1988). Unstable Agriculture and Droughts: Implications for Policy, Vikas Publishing House Pvt. Ltd, New Delhi
Ray, S.K. (1983a). An Empirical Investigation of the Nature and Causes for Growth and Instability in Indian Agriculture: 1950-80, Indian Journal of Agricultural Economics, 38(4): 459-474
Ray, S.K. (1983b). Growth and Instability in Indian Agriculture, Institute of Economic Growth, Delhi, Mimeo.
Sharma, H.R., Kamlesh Singh and Shanta Kumari (2006). “Extent and Source of Instability in Foodgrains Production in India”, Indian Journal of Agricultural Economics, 61 (4): 648-666.
Tandon, Anjali (2003). “Growth Performance and Instability of India’s Agriculture Exports a pre post Reform Analysis”, The Indian Economic Journal, 36(3),74-86.
Vyas, V.S. (1994). “Agriculture Price Policy: Need for Reformulation” in Economic Liberalization and Indian Agriculture, Ed. G.S. Bhalla, Institute for Studies in Industrial Development, New Delhi.
K.V. Bhanu Murthy & Phool Chand

India is a developing country and is ranked second in global retail Development Index of 30 developing countries drawn by A.T.Kearney. The index analyses 25 macroeconomic and retail-specific variables to help retailers devise successful global strategies and identify developing market investment opportunities. Tremendous growth is taking place, and in this rural retailing is playing a significant role. Retailing is acting like a safeguard for the economy. It is contributing in different spheres i.e. creating employments, abolishing poverty, centralising resources and many more.
Development of retailing is not just limited to urban areas, it is also infiltrating with rural area. According to the different surveys, retailing is the largest private sector in India and contributing 10% of GDP and 6-7% of employment. With over 15 million retail outlets, India has the highest retail outlets density in the world. The sector witnessed significant development in the past 10 years.The study appreciates and describes the need of promoting rural retailing in the country and elaborating some issues and challenges of rural retailing .
Rural retailing is now a days, two way marketing process. There is inflow of products into rural market for production or consumption, and there is also outflow of products to urban areas. The development of rural market is in changing junction and is developing more than urban market. More than 800 million people live in villages of India .Today’s the big giant Indian companies are following the slogan ‘GO RURAL’, they are trying to tap the rural markets. Many MNCs are foraying into Indian rural market Some companies which are ahead of them are Hindustan Liver, Coca-Cola, L.G Electronics, Britannia, Colgate, Palmolive and foreign investors’ telecom companies. These companies are foreseeing the vast size and demand in the rural market which they cannot afford to ignore. Rural market accounts for half the total market for T.V sets, fans, pressure cookers, bicycles, washing soaps and tooth powders. Fast Moving Consumer Goods (FMCGs) are grooming and growing much faster in rural market than in urban market.
The two major brands Coca Cola and Pepsi are trying to establish themselves in rural market, for this they are trying to adopt various strategies i.e. in distribution strategies companies are providing ice-boxes, refrigerators, credit facilities etc.
Pooja JaisinghProfessor- IIMT, Mall Road
Meerut Cantt, U.P.
A STUDY OF PROS AND CONS OF RURAL RETAILING IN INDIA
The Horizon - A Journal of Social Sciences July 2015, pp. 69-75
ISSN-0975-5535No.-II/2015, Volume-VI,

70
companies have invested in non-electronic chilling equipment’s to ensure availability of chilled products to consumers, and in pricing policies companies have introduced 200 ml packs for just Rs. 5/-. But pricing and convenient packaging are not enough to generate and convince customers. Advertising strategies were adopted to promote the products. A poster of Bollywood star or cricketer would make the customer feel associated with the product. Even outdoor campaigns help in promoting product.
At present urban India accounts for 66% of total FMCG consumption with rural India accounting for remaining 34%, keeping in the mind the above factors FMCG majors Hindustan Lever, has started a project name as “Shakti” for rural marketing of the products in year 2000. This project was established to sell the products through women self- help groups, who operate like a direct-to-home team of sales women in accessible area where HLLs conventional sales system does not reach. The Shakti model trains the women from SHGs to distribute HLLs products of daily consumption such as detergents, toilet soaps and shampoos. The company is creating demand for the products by having Shakti dealers educating consumers on aspects like health and hygiene. Now with this new distribution model, the small markets are now being referred to as Shakti Market. There are almost 65000 entrepreneurs of Shakti who are covering 165000 villages and touching the lives of 100 million rural consumers. Shakti entrepreneurs that it recruits, trains and employs in 2010 were 45000 and till 2015 will reach 75000 (approx.) globally.
PROSPECTS AND CHALLENGES OF RURAL MARKET
Recently many developments are taking place in the rural areas under the five year plans and other such special programmes, are phenomenal. The overall growth of the economy has started providing many fruitful results.
Development programmes in the field of agriculture, health education, communication, rural electrification etc. has increased the standard of living or lifestyle of the rural population. Due to lack of knowledge and proper channel rural market is confused for agricultural marketing. An agricultural product includes a comprehensive range of raw material and finished goods under the classification of plants, animals and other life forms. An approximate 36% of the world workers are engaged in agriculture with India’s, 65% of the population being directly and indirectly employed in this sector.
In agricultural marketing products are transferred to urban consumers or industrial consumers. Rural marketing also involves delivering, manufacturing or processing goods and services to rural consumer. Some services which are provided to rural areas for their development are selling of 55% policies to rural areas till year 2010-2011, the cooperation IRDA also has a “Bema Gram” scheme for the benefit of small
Pooja Jaisingh

71
villages under which LIC extends its financial support to a village to the extent of Rs.25000, provided the LIC gets 100 life insurance proposals from a particular village with a less than 5000 population.Two million BSNL mobile connections, 50% are in small towns and villages, 5.22 lakh public telephone connection are in 6 lakh villages, 41 million Kisan Credit Cards have been issued, 20 million Rediffmail sign-up, 60% are from small towns.
PROSPECTS OF RURAL MARKET
Over the past few years, rural India has witnessed an increase in the purchasing power of the consumers, accompanied by their desire to upgrade their standard of living. Government has taken various steps to develop the rural areas like their standard of living or life style, consumption patterns for FMCG goods, their purchasing style patterns such as cosmetics, beverages, mobile phones etc. Mathma Gandhi National Rural Employment Guarantee Act (MGNREGA) scheme, which has a budget of more than 400000 crores have given more opportunity to meet the daily needs of rural India.
Changing Scenario in Rural Sector
There are various levels in which development has taken place in rural sectors Some of the levels are listed below:-
1) Income level:- There has been increase in working population and the purchasing power has increased by 10% since 1991.The various government employment schemes have raised the income level. Even the use of modern technology in agriculture has also increased the income level of rural population.
2) Literacy Level:- Government has taken steps to increase the literacy level of rural India. The government and corporate sector i.e. in form of Corporate Social Responsibility (CSR) have joined hands for promoting literacy. The result has shown a rise of 23%.
2) Family Size:- It is a group of people who live under one roof, eat food from common chullah, hold income and property in common. Increase in number of nuclear families or ‘Individualized joint’ has increased the demand for branded products.
3) Occupational Pattern:- Rural people are moving towards jobs and retailing professions but their wages and salaries, consumption and investment patterns are different. 3/4 of the rural household heads are either cultivators or wage earners. The cultivator’s disposable income is highly seasonal and more disposable income is available immediately after the harvesting season.
CHALLENGES OF RURAL MARKET
1) Lack of Proper Physical Communication Facilities
A Study of Pros and Cons of Rural Retailing in India

72
The communication pattern in any society is a part of its culture. No communication medium can exist in cultural vacuum. Communicating the message to rural consumers has posed enormous challenges to the rural marketer, because of large number of sprinkled consumers across the country. The problem is further compounded by heterogeneous nature of consumers. Rural communication is not a peripheral bustle; it doesn’t merely involve taking an audio-visual van and assuming that this step is enough to reach out to customers. It requires an entirely different mind-set, where demand gets rid of mental barricades. The problem requires three fold consideration.
a) Identifying the best media to ensure maximum spatial reach.
b) Developing region-specific consumer profile to understand characteristics of the target market.
c) To design the most effective and persuasive communication and promotional strategies to induce the target audience to buy the product.
2) Dispersed Market
As the rural population is scattered over a large geographical area only district fairs and occasions are there to gather them together where manufactures and retailers can have greater visibility to capture the attention of the target audience for larger span of time. Advertisement is heterogeneous in nature and is an expensive process. This is an important challenge which rural market is facing.
3) Lower Capita Income
The earning capacity of the rural people are lower than urban areas, their demand depends upon the agricultural situation, which in turn depends upon the monsoon. Demand for the product cannot be stable because of irregularity of incomes. Low per capita income leads to lower purchasing power. The distribution system is highly skewed because of land holding pattern, which is basic asset for the rural people.
4) Low Level of literacy
The level of literacy rate in rural area is not high. Around two-fifth of the rural population is illiterate and only one-fifth holds a matriculate or high degree. The variation poses a challenge to easy and clear comprehension of message by all sets of rural audience. The limitation of mass media in rural areas and its regional and state variations pose limitations on a universal approach to communication for rural consumers. The manufacturers and retailers cannot provide all the details of the product due to their thinking and understanding levels.
5) Prevalence of Spurious Brands and Seasonal Demand
Branding is one of the important marketing tools for urban areas but this does not
Pooja Jaisingh

73
work with rural areas because the life style is simple and they believe in traditional forms. For many branded products, there are many local variants, which are cheaper and more desirable. Due to illiteracy, people can’t make out the difference between the original and spurious ones. Rural people are more cautious in buying and their decisions are slow, they mostly give trail to the product and after full satisfaction they may buy it again.
6) Transport
Rural areas lack development mostly because of transport problems. Till today, rail-transport have not reached all the villages. The non-surfaced roads, poor transport facilities are major roadblocks in the development process. Rural people are still interested in using their carts for the transports, which takes more time for the work and distribution doesn’t take place properly. Reaching village is physically very taxing and distribution efforts put up by marketer proves to be expensive and ineffective.
7) Deprived People
The people living in rural areas till today are bounded traditionally, they don’t accept the changes frequently, they have more belief in their culture and traditions. Lack of openness, illiteracy, low paying capacity etc. deprives people from the path of development and this is the major stuck in the rural market. India is a multi-cultural country where the same type of regional strategy cannot work in all regions, every region has its own pros and cons, strategy maker needs to consider all its environmental facts and procedure to inaugurate itself in the market.
8) Problems in Sales Force Management
The sales management also is not able to work on one strategy because of different variations in sales, buying habits, incomes, culture, demand, literacy, dependence more on nature.The force cannot focus on one selling strategy because of variations and they have to change it again and again to penetrate in the rural markets. Physical distance between the different consumers also demolish the marketing strategy. Advertisement is expensive, and the lack of qualified sales staff are a major hurdle in rural market. Rural market encompasses of rural staff who have local knowledge but they miss out the pertaining strategies of current scenario. The problem of employee turnover also pertains in rural market.
CONCLUSION
There is huge potential and definitely there is lot of money in rural India but the smart thing would be to weigh in the road blocks as carefully as possible.These roadblocks
A Study of Pros and Cons of Rural Retailing in India

74
can be overcomed by designing and adopting effective strategies and proper usage of resources. Rural market is to be considered for future. The greatest roadblock in the rural market is no set format to understand consumer behaviour. Lots of research and studies are conducted to understand the consumer behaviour. Although rural India need to purchase consumer goods just as their western counterpart does, rural Indian consumers have a different set of needs that must be met by both package and product. Spending time on researching the rural Indian consumer as well as the market before diving in can help preventing unnecessary struggles and failures. Packages need to be designed to withstand more distribution abuse due to poor roads and more primitive modes of transportation. Finally, while creating a package strategy for rural market in India, strategy of small packing have developed the rural market and helps in creating new rural consumers. By applying these facts we have learned that entering the rural Indian market should be promising.
Though the changes have started upcoming, the rural consumers are moving with purely economic concepts of value driven by lower prices, towards a border notion of values that combines price with the utility, aesthetics and features of product and services. Media and telecom services are rapidly changing the rural consumer buying habits.
The green and white revolution combined has substantially help in increasing the purchasing power of the rural communities. Rural marketing denotes blow of goods and services from rural producers to urban consumers at possible time with reasonable prices, and agricultural inputs and consumer goods from urban to rural.
Rural market is currently growing at about 20% every year and companies are spending amount Rs.600 crores per year for promotional budget.There is still much has to be done to effectively exploit the vast untapped market potential in rural India and private initiatives in this regard are note- worthy.
Reference
• www.ijarscce.com• www.dnb.co.in• www.psgim.ac.in• www.saarj.com• www.indiaretailing.com• www.theinternationaljournal.org• www.birminghamfreepress.com/v4/archives/walmart.html• www.brc.org.uk/LatestData.asp?iCat=52&sCat=RETAIL+KEY+FACTS• www.business worldindia.com• www.business-standard.com• www.businessworld.com• www.cacci.org.tw
Pooja Jaisingh
75
• www.corporatelocation.com• www.dipp.nic, in (Population of Industrial Policy and Promotion, Ministry of
Commerce and Industry).• www.dti.gov.uk/sectors• www.economictimes.com• www.economist.com• www.equitymaster.com• www.ers.usda.gov• www.euromonitor.com• www.europa.eu.int• www.gjepc.org• www.goi.nic.in• www.harbornet.com/pna/WalMart/pricing.html• www.ibef.orga• www.indianbudget.ic.in• www.indianbusiness.nic.in• www.indiastats.com• www.kvic.org.in• www.timesofindia.com• www.trade.uktradeinvest.gov.uk• www.usitc.gov• www.ustr.gov• www.wto.org
A Study of Pros and Cons of Rural Retailing in India

INTRODUCTION:
India’s trade regime remained basically inward – looking until export incentives were introduced in the mid – sixties. But the policy of import incentives was far overshadowed by continued prohibition on imports and the controls imposed on investment and the import – substituting policy practically continued till the oil crisis of 1973. In the Seventies, many more exports incentives were introduced and also export obligation was imposed on the industries at the various stages of licensing. This, however, did not help export promotion and trade liberalization under Sixth and Seventh Plans. Quantitative restrictions were replaced by tariff; producers got easy access to imported inputs and many items were placed on Open General License (OGL) list and all this marked a move towards further liberalization of the trades regime. The long-term Fiscal Policy of 1985 suggested that quantitative restrictions should be continued for some more time only in the case of industries which are just establishing themselves and that all capital goods, intermediate goods, raw materials and components should be imported subject to tariff and that the import duty structure must be simplified. But all these attempts towards liberalization did not dismantle the system of controls and therefore this could at best be described as slow and hesitant move towards trade liberalization.
At a time when India was facing economic crisis, the experience of newly industrializing countries and her own experience with limited liberalization in the eighties clearly pointed towards the urgent need for further integration of the Indian economy with the rest of the world as a solution to poor performance of the economy and accordingly some new measures have been initiated since July 1991 as a reform package to revitalize the economy.
Need for International Trade
Need for international trade can never be overemphasized. Different nations of the world have traded to make their lives easier and lavish. International trade is not necessarily a means of fulfillment of demand for goods and services but it raises the economic standard of the people surviving in different nations of the world. Nations
A STUDY OF COMPOSITIONAL CHANGES IN INDIA’S FOREIGN TRADE DURING THE
ECONOMIC REFORMS PERIOD
The Horizon - A Journal of Social SciencesJuly 2015, pp. 76-90
ISSN-0975-5535No.-II/2015, Volume-VI,
ShivangiResearch Scholar in EconomicsShri Venkateshwara University
Gajraula (U.P.)

77
in order to compensate for what they don’t produce, they have to involve in trade with other countries. For instance, not all the countries have oil resources, the rest of the countries import oil from the oil producers. Most of the oil producers on the other hand import finished goods because, they don’t produce enough. So in the modern world no country is completely self-sufficient. Thus international trade is very important for all the countries in the world.
The Indian Scenario of International Trade and Commodity Composition
Before Commencement of Five Year Plans
The big-bulge between imports and exports was not only the result of government’s liberal import policy, but was also due to the impact of partition. Before partition, India used to export raw jute but after Independence, raw jute completely faded out of the export picture and became an important item of import. Faced with an acute food shortage, India had to import a large amount of food grains. Thus, during the period after independence and before the commencement of our First Five Year Plan (August 1946 to March 1951), India faced a paradoxical situation. In spite of being a predominantly agricultural country, an appreciable amount of her foreign exchange resources was utilized for the import of such primary requirements as wheat, rice, raw-cotton and jute.
Turning to the export commodity composition of India’s foreign trade, we find that during the years of 1939-40, foodstuffs and raw materials like tea, raw cotton, oil seeds, spices, tobacco, hides and skins, etc., accounted for exports worth Rs. 396.5 millions. The manufactures accounted for Rs. 760 million about Rs. 650 million were accounted for by jute yarn and manufactures, cotton yarn and manufactures of leather. Modern manufactures of the chemical industries or the engineering industries were nearly absent or underdeveloped.
Liberalization, which started in 1980s, had become intensive by 1991 due to severe balance of payments crisis coupled with changing external economic environment. To get over the crisis, the Government of India enunciated economic reforms and undertook macro stabilization and structural adjustment programme. The basic objective of stabilization and structural adjustment programme was firstly to reduce fiscal deficit, secondly to liberalize the domestic economy by relaxing the restrictions on international flow of goods and services, technology and capital. In the liberalization process, the third aspect, i.e., reforms in trade sector assumed greater significance due to the emergence of WTO and globalization.
Since 1991, India’s trade policy has undergone fundamental shifts to correct the early anti-export bias through the withdrawal of quantitative restrictions (QRs), reduction and rationalization of tariffs, liberalization in trade and payments regime and improved access to export incentives, besides a realistic and market based exchange rate. The focus of these reforms has been on liberalization, openness, transparency
A Study of Compositional Changes in India’s Foreign Trade During the Economic Reforms Period

78
and globalization with a basic thrust on outward-oriented strategy for export promotion and improving competitiveness of Indian industry to meet global market requirements. These internal and external trade policy reforms had far reaching impact on the volume, commodity composition and direction of trade and balance of payments of the country.
An attempt has been made in the present paper to analyze and examine the compositional changes in India’s foreign trade during the economic reforms period. Data and literature have been collected from the various published sources such as various issues of Economic Survey, Annual Reports of RBI, SMIE Reports, Reports published by DGCI&S, WTO Reports and research articles published in journals and newspapers of national and international repute.
Literature Review
There has been a lot of research work on the present area of research; some of the important ones are given as under:
The book of M.M. Sury titled ‘Indian Economy in the 21st Century: Prospects and Challenges’ (2004). This book explains the key reform measures undertaken in various sectors of the Indian economy since 1991. It examines their rationale, contents, and impact. Furthermore, the work puts in perspective the emerging lessons for the future. To provide the necessary backdrop to the new order, appropriate comparisons have been made with the policies pursued prior to reforms period. However, the focus of the study is on current scenario and future prospects in various sectors of the Indian economy. The overall approach to the subject is descriptive, analytical, and at places normative.
Sudhir Kr. Gupta and Vikas Gupta (2006) have analyzed the implications of foreign sector reforms in their work and conclude that associated measures of economic reforms and liberalization have far reaching implications. As the Indian economy has been exposed to more foreign competition, it becomes imperative to have a look at various aspects of economic reforms. The regime of high protection is gradually vanishing. The tariff cuts and other liberalization measures are likely to continue in future. This means that the Indian firms should become competitive if they intend to survive. They have to pay due attention to cost price, quality delivery schedules, after sales services etc. In fact, a buyer’s marketing is emerging in several industries. Another implication of these reforms is that now Indian firms can obtain their raw materials more competitively from abroad as well. This would help to control costs and improve quality and consequently enable the Indian firms to go global and compete rigorously.
Srilata Ayyer (2008) in her research examines the need and importance of Export and Import Policy. She concludes that a very important role of the EXIM policy is to
Shivangi

79
carry on the further globalization of the Indian trade. One important objective of the current policy is to establish a framework for the globalization of the India’s foreign trade. This has been given support by the fourth objective of EXIM policy “to augment India’s exports by facilitating access to raw materials, intermediates, components, consumables and capital goods from the international markets”. Indeed facilitation of global sourcing is the prerequisite for globalization or exports for increasing the competiveness of the exports and for globalization of the business. In the past, India followed indiscriminate import substitution which was coupled with heavy protection. The lowering of protection by import liberalization is an open declaration that undue protection will not be granted any more.
Stefen W. Stoic (2009) in his paper concludes that the increasing competition from abroad and within is providing the firms of India to give an added thrust to exports. Some companies even view exports as the counter competitive strategy, because of the imports which they can make with their foreign exchange earnings, several companies pay special attention to exports. The companies continuously try to upgrade their export potential and this in turn leads to more and more exposure to unexplored markets.
The literature review given above highlights the major issues related to the long-term and immediate effects of the economic reforms pertaining to the foreign trade of India. However, a fresh perspective relating to the compositional changes in the foreign trade of India is required. The present paper is relevant in this sense as it studies the compositional changes in India’s foreign trade during the economic reforms period.
Trade Performance of India During Reforms Period
Table No. 1
Trade Performance: Growth in Value, Volume, Unit value and Terms of
Trade (in Annual Percentage)
Source: Directorate General of Commercial Intelligence and Statistics (DGCI&S), Kolkata 2011-2012 (April-January)
A Study of Compositional Changes in India’s Foreign Trade During the Economic Reforms Period

(Volume and unit value index of exports and imports are with new base (1999-2000= 100)
India’s exports and imports registered a five to seven fold increase in the last decade from US$ 44.6 billion and US$ 50.5 billion respectively in 2000-01 to US$251.1 billion and US$369.8 billion in 2010-11 respectively. While the compound annual growth rates (CAGR) of India’s exports and imports (in US dollar terms) were 8.2 per cent and 8.4 per cent respectively in the 1990s, they increased to 19.5 per cent and 25.1 per cent during 2000-01 to 2008-09. According to Table No. 1, the resilience of India’s trade can be seen from the fact that its export and import growth, which fell to -3.5 per cent and -5 per cent in 2009-10 as a result of the shock from the 2008 global economic crisis, rebounded to 40.5 per cent and 28.2 per cent in 2010-11. India not only reached pre-crisis levels in exports, but surpassed pre-crisis trends in export growth rate unlike many other developing and even developed countries).
Figure No. 1 Monthly Trends in India’s Exports: Values and Growth
Source: Directorate General of Commercial Intelligence and Statistics (DGCI&S), Kolkata
According to Figure No.1, during the first half of 2011-12, India’s exports witnessed a high growth of 40.6 per cent. However, since October 2011 there has been a deceleration in export growth as a result of the crisis originating in the periphery of the euro zone area and spreading to the core economies resulting in a now evident mild recession in the euro area. Exports registered a high growth of 61.1 per cent in July 2011. After that growth decelerated to 41.5 per cent, 25.2 per cent, and 18.1 per cent in August, September, and October 2011 respectively. In November 2011, export growth was negative at -0.5 per cent but in December 2011 and January 2012, it was positive but low at 6.7 per cent and 10.1 per cent respectively.
Figure No. 2 given below shows the export growth and exchange rate changes and Figure No. 3 shows the import growth and exchange rate changes. According to these figures, while export growth in dollar terms decelerated slightly in 2011-12 (April-December) over the corresponding period compared to the growth in 2010-11
80 Shivangi

81
full year, it was stable or decelerated less in rupee terms which is a direct reflection of the depreciation of 3.1 per cent in 2011-12 (April- December). On the other hand import growth in rupee terms accelerated more sharply than in dollar terms (Figure 2 and 3 given below)
Figure No. 2 Export Growth and Exchange Rate Changes
Source: Based on DGCI & S and RBI Data
Figure No. 3 Import Growth and Exchange Rate Changes
Source: Based on DGCI&S and RBI Data
Table No. 2 given below shows the export growth and share in world exports for India and other select countries. According to this table, India’s share in world merchandise exports which had started rising fast since 2004, reached 1.3 per cent in 2009 and 1.5 per cent in 2010. It increased to 1.9 per cent in the first half of 2011, mainly due to the relatively higher Indian export growth of 55 per cent compared to the 23.1 per cent export growth of the world. The increase in China’s share in world exports between 2000 and 2010 at 6.5 percentage points is 48 per cent of the total increase in the share of emerging and developing countries over this period, while India’s rise in share of 0.8 percentage points forms only 6 per cent of the total increase. However, China’s export growth rate at 31.3 per cent in 2010 and 24 per cent in the first half of 2011 was relatively lower than that of India.
A Study of Compositional Changes in India’s Foreign Trade During the Economic Reforms Period

82
Table No. 2Export Growth and Share in World Exports: India and Other Select Countries
Source: Computed from IMF, International Financial Statistics, November 2011.
Note: EDEs stand for Emerging and Developing Economies.
Trade Composition
Export Composition
According to Table No. 3 given below which gives the composition of exports by major markets, great changes in the sectoral composition of India’s export basket seen in the 2000s decade have accelerated in the beginning of this decade. While the share of petroleum crude and products increased by 11.8 percentage points during the 10-year period from 2000-1 to 2009-10, it further increased by 4.8 percentage points from 2009-10 to the first half of 2011-12.
The share of the other two sectors, i.e. manufactures and primary products fell almost proportionately by 11.6 and 1.1 percentage points respectively during 2000-1 to 2009-10 and 1.4 and 2.2 percentage points from 2009-10 to the first half of 2011-12. The inter-sectoral composition changes within manufactures exports have also been great with the biggest losers being labour-intensive manufactures like textiles, leather and leather manufactures, and handicrafts from 23.6, 4.4, and 2.8 per cent respectively in 2000-1 to 8.7, 1.6, and 0.3 per cent in the first half of 2011-12. The biggest gainer is the engineering goods sector with its share increasing from 15.7 per cent in 2000-1 to 22.2 per cent in the first half of 2011-12.
Another sector is electronics, the share of which increased from 2.5 per cent to 3.5 per cent in 2010-11, but fell to 2.9 per cent in the first half of 2011-12. While the share of chemicals and related products increased marginally from 10.4 per cent to 11.6 per cent, that of gems and jewellery fell marginally from 16.6 per cent to 16.1 per cent
Shivangi

83
during 2000-1 to the first half of 2011-12. A point to be noted is that most of the petroleum exports of India are refined exports and qualify for the category of manufactures. Similarly, there are many items in the agricultural and allied sector like marine exports and processed foods which are manufactured items. If these are included under the definition of manufactures, then the share of manufactures in total exports has not fallen.
Table No. 3 Composition of Exports by Major Markets
A Study of Compositional Changes in India’s Foreign Trade During the Economic Reforms Period

84
Source: Computed from DGCI&S Data
Growth Rate in US Dollar Terms
Note: 1. RMG stands for Readymade Garments
2. Share in particular item means share of each country in total exports of India to that country.
3. Totals may not add up mainly due to some unclassified items.
Export growth was high in 2010-11 and the first half of 2011-12 in case of agriculture and allied products due to export growth in cereals, meat preparations, oil meals, and coffee. Among manufactured exports, engineering goods, gems and jewellery, and chemicals and related products registered high growth, while textiles export growth was moderate. Export growth of petroleum, crude, and products was also very high due to the high prices of crude oil and also due to increase in refining capacity. Ores and minerals is the only item with negative growth in the first half of 2011-12 due to a ban on export of iron ore by the state governments of Karnataka and Odisha.
The compositional changes from 2000-1 to the first half of 2011-12 can also be seen in the destination-wise exports of major items. While the gain in share of petroleum, crude and products in India’s export to the EU has been higher than to US with an increase of around 17 percentage points, the decrease in share of manufactured goods in India’s exports to the EU is also high at around 13.7 percentage points. However, there has been a dramatic rise in the share of petroleum, crude and products in India’s exports to China. The share of ores & minerals has started falling in India’s exports to China since 2008-09 reaching 30 per cent in the first half of 2011-12 resulting in rise in share of manufactured goods. Among manufactures, the fall in share of textiles to EU and US and ‘Others’ from 2000-1 to the first half of 2011-12 has been more or less the same at above 10 percentage points.
There has been a rise in share of India’s exports of engineering goods to all the four markets. While there has been a big jump in the share of this item in India's exports to China in 2010-11 and then moderation, in the case of the other three markets, the share is at a uniform 21-22 per cent range in the first half of 2011-12. While the share of gems and jewellery exports to the US and EU markets have fallen, it has increased in the case of ‘Others’. China’s share is insignificant in this item. The share of chemicals and related products in India’s exports registered a near 10 percentage point increase to the US market and around 3.5 percentage point increase to the EU market Similar to 2009, India had a global export share of 1 per cent or more in 48 out of a total of 99 commodities at the two-digit harmonized system (HS) level. However, its share of 5 per cent or more in 12 items in 2009 has declined to 10 items with the categories ‘bird skin, leather, artificial flowers, human hair’ and ‘ores, slag, and ash’ moving out of the list except pearls, precious stones, metals, coins, etc. all
Shivangi

85
the other nine items witnessed an increase in global share in 2010 over 2009, with cotton being at the top of the list. However, most of these 10 items except pearls, precious stones, metals, coins, etc. have a very small share in total world exports.
While India has made major strides in its diversification of export markets, a lot needs to be done to not only diversify the export basket but also have a perceptible share in the top items of world trade.
Table No. 4 given below shows the top four items in India’s manufactured exports which are engineering goods, gems and jewellery, chemicals and related products, and textiles. Since 2007-8, electronic goods have displaced leather and manufactures from fifth place with the share of the former increasing and the latter decreasing. There has been a gradual shift in India’s manufactures exports from labour-intensive sectors like textiles, leather and manufactures, handicrafts, and carpets to capital- and skill intensive sectors. Engineering goods exports has seen an almost steady rise in shares from 1999-2000 to the first half of 2011-12 and high growth rates of 84 per cent and 43.6 per cent in 2010-11 and the first half of 2011-12 respectively mainly due to the high growth rates of two major items machinery & instruments and transport equipments besides residual engineering items with very high
Table No. 4 Performance of Top Four Items in India’s Manufactured Exports
Source: Computed from DCI & S Data
A Study of Compositional Changes in India’s Foreign Trade During the Economic Reforms Period

86
growth rates. The major markets for Indian engineering exports in 2010-11 were China, the USA, the UAE, Singapore, Saudi Arabia, South Africa, Germany, Sri Lanka, and the UK. All these markets showed tremendous export growth with China topping at 409 per cent.
With the highest growth rate among manufactures at 58.4 per cent in the first half of 2011-12, gems and jewellery, the second major export item, has retained its share of around 16-17 per cent since 2000-1. In 2010-11, this sector accounted for 14.7 percent of India’s total merchandise exports. India is the largest cutting and polishing centre for diamonds in the world. Of the global polished diamond market, India’s share is estimated to be 70 per cent in terms of value, 85 per cent in terms of volume, and 92 per cent in terms of pieces. As per the Gems and Jewellery Export Promotion Council (GJEPC), this sector as a whole supports about 34 lakh jobs. The gems and jewellery manufacturing sector consists of large number of small and medium enterprise (SME) units, employing skilled and semi-skilled labour, almost entirely in the unorganized sector.
The share of chemicals and related products has fallen marginally over the years mainly because of the fall in shares of basic chemicals, pharmaceuticals, and cosmetics. The growth in 2010-11 and the first half of 2011-12, however, have been higher by 26.5 per cent and 34.2 per cent respectively. The steady fall in share of the textiles sector to single digits since 2000-1 is mainly due to a fall in shares of ready-made garments and cotton, yarn, fabrics, made-ups, etc. Clearly, India has not been able to utilize the opportunity provided by the phasing out of the Multi Fibre Agreement (MFA) in 2005. The rise of the electronics sector, though long overdue, is a welcome sign. This is due to the recent policies of the government to help this sector like including many electronic items in the Focus Product Scheme and customs duty exemption to many electronic components. The Tsunami in Japan which led to disruption of supply chains in Japan could also have benefitted India at a time when support measures were taken by India for this sector.
Import Composition
Table No. 5 given below shows the commodity composition of India’s imports.
Table No. 5 Commodity Composition of India’s Imports
Shivangi

87
Source: Computed from DCI & S Data
In case of imports, there are no major compositional changes other than the sudden rise in share of gold and silver imports from 9.3 per cent in 2000-1 to 13.3 per cent in the first half of 2011-12 and fall in the share of pearls, precious, and semiprecious stones from 9.6 per cent in 2000-1 to 6.0 per cent in the first half of 2011-12. The share of capital goods imports which increased from 10.5 per cent in 2000-1 to 15.5 per cent in 2008-9 started declining again to reach 11.6 per cent in the first half of 2011-12. The share of POL imports, which fell from 31.3 per cent in 2000-1 to 28.6 per cent in 2010-11 rose again to 31.4 per cent in the first half of 2011-12 due to high prices of crude oil (Table 5)
Thus in sum, we can say that there were no major changes in India’s imports but exports certainly witnessed major changes. A promising area that is emerging in area of exports is project exports. There is a growing realization across Asia and Africa that the experience of Indian companies is more appropriate to their project needs, especially in hydropower, irrigation, transportation and water supply systems. As a result, exports of projects and services including construction and industrial turnkey projects and consultancy services are increasing. In sum, exports during the nineties which saw the ushering in of economic reforms have been a case of failed expectations. At the end of it, all export growth seems to have acquired more of a random character than based on pro-active policy initiatives.
Latest Developments in India’s Exports and Imports
Exports
Exports during January, 2015 were valued at US $ 23883.60 million (Rs.148617.82 crore) which was 11.19 per cent lower in Dollar terms (10.97 per cent lower in Rupee
A Study of Compositional Changes in India’s Foreign Trade During the Economic Reforms Period

88
terms) than the level of US $ 26891.58 million (Rs. 166932.15 crore) during January, 2014. Cumulative value of exports for the period April-January 2014-15 was US $ 265037.38 million (Rs 1613789.24 crore) as against US $ 258721.45 million (Rs 1562119.12 crore) registering a growth of 2.44 per cent in Dollar terms and growth of 3.31 per cent in Rupee terms over the same period last year.
Imports
Imports during January, 2015 were valued at US $ 32205.63 million (Rs.200402.44 crore) which was 11.39 per cent lower in Dollar terms and 11.18 per cent lower in Rupee terms over the level of imports valued at US $ 36346.32 million (Rs. 225623.44 crore) in January, 2014. Cumulative value of imports for the period April-January 2014-15 was US $ 383411.33 million (Rs 2334685.06 crore) as against US $ 375253.67 million (Rs 2253984.83 crore) registering a growth of 2.17 per cent in Dollar terms and growth of 3.58 per cent in Rupee terms over the same period last year.
Crude Oil and Non-Oil Imports
Oil imports during January, 2015 were valued at US $ 8247.65 million which was 37.46 per cent lower than oil imports valued at US $ 13187.76 million in the corresponding period last year. Oil imports during April-January, 2014-15 were valued at US $ 124747.13 million which was 7.87 per cent lower than the oil imports of US $ 135396.32 million in the corresponding period last year.
Non-oil imports during January, 2015 were estimated at US $ 23957.98 million which was 3.45 per cent higher than non-oil imports of US $ 23158.56 million in January, 2014. Non-oil imports during April-January, 2014-15 were valued at US $ 258664.20 million which was 7.84 per cent higher than the level of such imports valued at US $ 239857.35 million in April-January, 2013-14
Trade Balance
The trade deficit for April-January, 2014-15 was estimated at US $ 118373.95 million which was higher than the deficit of US $ 116532.22 million during April-January, 2013-14.
India’s Foreign Trade (Services): December, 2014
A. Exports (Receipts)
Exports during December, 2014 were valued at US $ 14303 Million (Rs. 89755.62 Crore).
B. Imports (Payments)
Imports during December, 2014 were valued at US $ 7240 Million (Rs. 45433.17 Crore).
Shivangi

89
C. Trade Balance
According to the RBI press release the provisional trade balance in Services (i.e. net exports of Services) for December, 2014 was estimated at US $ 7063 Million or Rs. 44322.45 crore.
Conclusion
To sum up, the composition of India’s foreign trade reflects to a great extent, the structural changes as well as compositional changes that the Indian economy has undergone over the period of last five and a half decades. It is no longer an exporter of primary commodities and an importer of manufactured goods. It exports manufactured goods and imports raw materials, intermediate goods and capital goods. However, export intensity of Indian manufacturing sector is still very low. Therefore, Indian manufacturing sector has still a long way to go before its exports truly become an engine of growth.
References:
SIA Newsletter, Various Issues (April 200510), Department of Industrial Policy and
A Study of Compositional Changes in India’s Foreign Trade During the Economic Reforms Period

90
Promotion
A.T. Kearney’s (2007): Global Services Locations Index”, www.atkearney.com Alhijazi, Yahya Z.D (1999): “Developing Countries and Foreign Direct Investment”, digitool.library.mcgill.ca.8881/dtl_publish/7/21670.htm.
Andersen P.S and Hainaut P. (2004): “Foreign Direct Investment and Employment in the Industrial Countries”, http:\\www.bis\pub\work61.pdf.
Balasubramanyam V.N, Sapsford David (2007): “Does India need a lot more FDI”, Economic and Political Weekly, pp.1549-1555.
Basu P., Nayak N.C, Archana (2007): “Foreign Direct Investment in India: Emerging Horizon”, Indian Economic Review, Vol. XXXXII. No.2, pp. 255-266.
Belem Iliana Vasquez Galan (2006): “The effect of Trade Liberalization and Foreign Direct Investment in Mexico”, etheses.bham.ac.uk/89/1/vasquezgalan06phd.pdf.
Bhagwati J.N. (1978), “Anatomy and Consequences of Exchange Control Regime”, Vol 1, Studies in International economies Relations No.10, New York, ideas-repec.org/b/nbr/nberbk/bhag78-1.html.
Chandan Chakraborty, Peter Nunnenkamp (2006): “Economic Reforms, FDI and its Economic Effects in India”, www.iipmthinktank.com/publications/archieve.
Krueger, A. (1998), Why Trade Liberalisation is Good for World? The Economic Journal, Vol. 108, September.
KaushikKrishan K, Lawrence Nil Anang, (2008), “Export Growth, Export Instability, Investment and Economic Growth in India: A time series Analysis”, Journal of Developing Areas, Vol. 41, No. 2, pp. 155-170.
SMIE Reports, Reports published by DGCI&S,
WTO Reports
RBI: Handbook of Statistic on Indian Economy (Various Issues)
GOI, Economic Survey (Various Issues)
CMIE, Foreign Trade and Balance Of Payments.
Annual Reports of RBI, (As per the RBI Press Release dated 13th February, 2015)
Shivangi

INTRODUCTION
The modern lifestyle of people, population growth, coupled with urbanization, and industrialization and increased reliance on information technology at different walks of life has enhanced the consumption of electronic products. This has resulted in the generation of greater amounts of solid wastes in industrializing countries including India which in turn has made electronic waste (e-waste) management an issue of environment and health concern. The stock of e-waste is bound to grow in near future. The problem is further compounded by large scale dumping of e- waste from developed countries. Policy makers are clueless about the potential solutions ( Bhatt et al. 2008). Although we all are producers of e- waste, many of us are unaware of what is the definition and health and environment impact of E- waste?. Hence, next section we discuss definition of e- waste and its health and environment impacts.
Definition of E -waste
There is no generally accepted definition of E- waste. According to the Ministry of Environment and Forests Guidelines (2008): “E-waste comprises of wastes generated from used electronic devices and household appliances which are not fit for their original intended use and are destined for recovery, recycling or disposal. Such wastes encompasses wide range of electrical and electronic devices such as computers, hand held cellular phones, personal stereos, including large household appliances such as refrigerators, air conditioners etc. E-wastes contain over 1000 different substances, many of which are toxic and potentially hazardous to environment and human health”.
Quantum of E- waste at Global and India Level
Huge quantity of e- waste generated worldwide every year. According to UNEP (2009), 40 million tones of e-waste are generated per year world-wide. As per another estimate, the global volume of e- waste generated is expected to reach 93.5 million tones in 2016 from 41.5 million tones in 2011 at a compound annual growth of 17.6% from 2011 to 2016 (Market stand markets, www.marketsstands
The Horizon - A Journal of Social Sciences July 2015, pp. 91-95
ISSN-0975-5535No.-II/2015, Volume-VI,
Asheref IlliyanSenior Asst. Professor (Stage 3)
Department of Economics, Jamia Millia Islamia Central University, New Delhi
EMERGING ISSUE OF ELECTRONIC WASTE (E-WASTE) AND POLICY RESPONSE IN INDIA

92
markets.com). As far as India is concerned, the e- waste inventory for the year 2005 was estimated to 1.46 lakh tones which is expected to exceed 8 lakh tones by 2012.
E- waste and Policy Response
While most of the developed countries had been able pass national e- waste management policy and set-up scientific recycling units in early 2000s, it is ironic that India which has a well developed software and moderate hardware industry in the world does not have a scientific and well-developed recycling industry and a national policy on e- waste management.
Till 2011, India did not had a comprehensive legislation to deal with issue of e-waste. It was mainly dealt under Hazardous Waste Management and Handling Rules 1989 and amended from time to time, Promulgation of E- waste (Management and Handling) Rules 2011, which came into force w.e.f 1st May 2012 was a milestone in the history of legislation for E-waste management in India and surely a comprehensive legislation for management of e-waste in the country. The new Rules have clearly defined E-waste and fixed responsibilities of various stakeholders. These rules shall apply to every producer(s), distributer(s), collection centre(s), refurbisher (s), dismantler(s), recycler(s), consumer(s) or bulk consumer(s) involved in the manufacture, sale, and purchase and processing of electrical and electronic equipment or components of IT and telecommunication equipment and Consumer electrical and electronics. (Ministry of Environment and Forests, GOI, 2011)
Under the rule (4), the producer is responsible to collect the product at the `end of life’ and ensure that it has to reach the registered refurbisher or dismantler or recycler; they have to establish a collection centre either individually or collectively; to meet the cost, they have to make provisions for financing and organizing a system either individually or collectively; they have to provide a contact details of distributers and authorized collection centers to consumer and they have to distribute e-waste awareness information along with the equipment.
Under the rule (5), the collection centres are responsible to store e waste collected by them in a secured manner till it is sent to registered dismantlers or recyclers as the case may
Under the rule (6), Consumer’s responsibility is to ensure that the ewaste deposited with the distributor or collection centers. The bulk consumer responsibility is to make sure that the e-waste is deposited with the distributor or authorized collection centers or refurbisher or registered dismantler or recyclers.
Under the rule (7), dismantler responsibility is to ensure that environment and health should not be affected and they have to ensure that the dismantling facility comply with scientific standards. Further, they have to ensure that dismantled e-waste are
Asheref Illiyan

93
segregated and sent to the registered recycling facilities for recovery of materials and the non-recyclable/non- recoverable components are sent to authorized treatment storage and disposal facilities.
Under the Rule (8), recyclers are responsible for obtaining authorization and registration from state pollution control board. Ensure that residue generated is disposed of in a hazardous waste treatment facility.
In nutshell, the E-waste (Management and Handling) Rules, 2011 regulates not only the producers but also recyclers and other intermediaries viz., distributors, refurbisher, bulk consumers and dismantlers.
The new rules also introduce EPR (Extended Producer Responsibility) which requires producers of electronics products completely responsible for the environmentally sound management of e-waste (Ministry of Environment and Forests, GOI, 2011)
Despite these advantages, the new rules are not free from criticism. Just like any other piece of legislation, the success of the E- waste (Management and Handling) Rules 2011 depends on its implementation. It is said that we are good at passing laws but poor at implementation. Some of the problems at implementation face are:
1. Lack of awareness among various stakeholders.
2. Non fixation of target at the time of enforcement is another problem. Producer is not bound by any collection target. Therefore, there is an uncertainty in the quantity of E-waste channelized to the registered recycler. This gap will not be able to control leakage of E-waste to informal sector.
3. There is no quantitative basis for monitoring of E-waste management at the time of enforcement as there are uncertainty as quantity of E-waste from twenty two items mentioned in Schedule-I at the end of year 2012 is not known.
4. The financial instruments and incentive mechanism not worked out well.
Conclusion
Thus, E-waste has been emerging as an issue of health and environmental concern. The policy response to this emerging issue has been sluggish as we did not had a comprehensive legislation to deal with this vital issue till 2011. Although we have been able to enact a comprehensive legislation entitled “E- waste (Management and Handling) Rules, 2011”, it is fraught with some limitations. How far the new rule is able to tackle the emerging issue of E- waste will depend on its successful implementation and creation of awareness among various stake holders.
References
Bandyopadhyay, Amitava (2010) ̀ Electronics Waste Management: Indian Practices
Emerging Issue of Electronic Waste (e-waste) and Policy Response In India

94
and Guidelines’ International Journal of Energy and Environment, Volume 1, Issue 5, 2010 pp.793-804.
Bhatt M.S., Ashraf Shahid and Illiyan, Ashref (2008), “Problems and Prospects of Environmental Policy-Indian Perspective”, Aakar Books, New Delhi.
Central Pollution Control Board “Guidelines for Environmentally Sound Management of E- waste 2008”, www.cpcb.nic.in
Greenpeace (2007a), “A Guide to Greener Electronics” The Hindu, Wednesday, August 15, 2007 p. 4.
Iles, Alastair T (2004), “Mapping Environmental Justice in Technology Flows: Computer Waste Impacts in Asia” Global Environmental Politics, Vol.4, No 4, pp. 76-107.
Jain, A. (2006,), “Perspective of Electronic Waste Management in South Asia: Current Status, Issues and Application of 3Rs” Synthesis Report of the 3R South Asia Expert Workshop, Kathmandu, Nepal, 30 August- 1 September.
Joseph, Kurian (2007), “Electronic Waste Management in India – Issues and Strategies’ Proceedings Sardinia 2007”, Eleventh International Waste Management and Landfill Symposium S. Margherita di Pula, Cagliari, Italy; 1 - 5 October 2007.
Lakshmi Raghupathy, “E-Waste Management in India’ Ministry of Environment& Forests”, New Delhi (INDIA) available at http://www.env.go.jp/recycle/ 3r/en/asia/ 02_03-4/11.pdf
Ministry of Environment and Forests (2006), “The Environment (Protection) Act, 1986”, GoI, Delhi
Ministry of Environment and Forests (1989), “Hazardous Wastes (Management and Handling) Rules, 1989’ , GoI, Delhi
Ministry of Environment and Forests (2000), ‘Hazardous Wastes (Management and Handling) Rules, 1989” (Amended in 2000), GoI, Delhi
Ministry of Environment and Forests (2002), “Hazardous Wastes (Management and Handling) Amendment Rules, 2002”,GoI, Delhi
Ministry of Environment and Forests (2008), “The Hazardous Wastes (Management, Handling and Transboundary Movement) Rules, 2008” , GOI,Delhi
Ministry of Environment and Forests 2011, “E-waste Management and Handling Rules 2010”, published in the Gazatte of India May 2011, GOI, Delhi
Ministry of Environment & Forests and Central Pollution Control Board (2008), “Guidelines for Environmentally Sound Management of E-waste” . GoI, Delhi
Schmidt, Charles W (2002), “e-Junk Explosion”, Environmental Health
Asheref Illiyan

95
Perspectives, Vol. 110, No. 4, pp. A188-A194
“The Hazardous Wastes (Management, Handling and Transboundary Movement) Fourth Amendment Rules, 2010”
United Nations Environment Programme (UNEP 2009), “Recycling- From E-waste To Resources, July 2009.
Violet N. Pinto (2008), `E-waste Hazard: The Impending Challenge’ Indian Journal of Occupational and Environmental Medicine. 12(2): 65–70.
Emerging Issue of Electronic Waste (e-waste) and Policy Response In India

INTRODUCTION:
MGNREGA has been implemented by the Ministry of Rural Development (MORD). Mahatma Gandhi National Rural Employment Act came into force on Feb2, 2006.The main aim of this Act is to enhance living standard of rural area of the country. Mahatma Gandhi NREGA is the first ever law internationally that guarantee wage employment at an unprecedented scale. This programme has a great potential for generating new job opportunities among the rural areas of India. It helps to enhance the purchasing power of rural India. The main aim of this programme is enhancing livelihood security of households in the rural area of the country by providing at least 100 days of gua ranteed wage employment in a financial year to every household whose adult members volunteer to do unskilled manual work. In 2009, NREGA was renamed as Mahatma Gandhi National Rural Guarantee Act (MNREGA).
Source: Compiled from Various Reports of MNREGA.
Objectives of the Study:
vTo explain the concept & current status of MGNREGA.
vTo highlight the main objectives and salient features of the MGNREGA.
vTo explain performance of MGNREGA from 2007 to 2014.
MAHATMA GANDHI NATIONAL RURAL EMPLOYMENT GUARANTEE ACT: AN OVERVIEW
The Horizon - A Journal of Social Sciences July 2015, pp. 96-101
ISSN-0975-5535No.-II/2015, Volume-VI,
1 2 Danish Masoud & Anjali Bahuguna
1Research Scholar, Department of Economics, School of Humanities &Social Science, HNB Garhwal University(A Central University),Srinagar(Garhwal), Uttarakhand.
2Head, Department of Economics, School of Humanities &Social Science, HNB Garhwal University( A Central University), Srinagar(Garhwal), Uttarakhand.
DF
RR DC
D

97
vTo highlight the achievements of MGNREGA.
Research Methodology:
The present study is based on the secondary data. The secondary data have been collected from various websites, different Reports of MGNREGA, journals, books, Gazettes and research papers.
Objectives of the MGNREGA
(a) To provide, on demand, not less than one hundred days of unskilled manual work in a financial year to every household in rural areas.
(b) To create productive assets of prescribed quality and durability through wage employment.
(c) To strengthen the livelihood resource base of the rural poor.
(d) To proactively ensure social inclusion.
(e) To strengthen Panchayat Raj Institutions.
Salient Features of the Act:
i. Registration:
At the village level, the adult member residing in the rural area has to do registration of household to the local Gram Panchayat.
ii. Job Card:
A Job Card is issued within 15 days of the registration. This card will be valid for at least 5 years. After due verification of address and age of the adult member, the registered household is issued a job card.
iii. Application for work:
The Gram Panchayat /authorised person will issue a dated receipt of application for employment against which the guarantee of providing employment within 15 days.
iv. Unemployment allowance:
As per the Act, unemployment allowance shall be paid automatically by the MIS (Management Information System).
v. Work and Wages:
vWork is provided within the range of 5 kms of the village.
vExtra wages of 10 percent are payable to meet additional transportation and living expenses. In case, work is provided beyond 5 kms.
vContractors and use of labour displacing machinery are prohibited.
vPayment of wages has to be done on a weekly basis.
Mahatma Gandhi National Rural Employment Guarantee Act: An Overview

98
vAs per the Act, payment of wages has to be made as per the State Government of India.
vMGNREGA wages payments should be made through banks/ post office accounts of the worker unless exempted the Ministry of Rural Development.
vi. Social Audits:
Social audit has to be done by the Gram Sabha at least once in every six months. It has to be done for all works as per the Act.
vii. Grievance Redressal:
This Mechanism has to be taken place for ensuring a responsive implementation process.
viii. Public Disclosure:
All accounts and records are to be made available for public scrutiny free of cost.
Table 1.2 Performance of the Mahatma Gandhi NREGA
Persondays (in Crore)
D P
C
Danish Masoud & Anjali Bahuguna
PT
D
PH
C

99
Source: Official website of MGNREGA (http://mgnrega.nic.in)
Achievements of MGNREGA:
vMGNREGA has generated 1575 crore person days of employment up to December 2013.
vThe average wage earned by per beneficiary has risen from Rs. 65 per person day in 2006 to Rs. 124 by 2013.
vThe scheme has also contributed to ensure food security and savings.
vIt has also increased the level of rural consumption.
vNearly 9.3 crore bank/ post office accounts of rural people have been opened under MGNREGA.
vIt is also helpful in connecting rural people to banks, around 80% percent MGNREGA payments are through this route.
vThe women participation rate has ranged between 40-51 %of the total person-days generated, much above the statutory minimum requirement of 33% from 2006-07 up to 2013-14.
vThe NSSO 66th round indicated that Mahatama Gandhi NREGA has reduced traditional wages discrimination in public works.
vIn the financial year 2013-14 (up to December, 2013) 3.8 crore households
Mahatma Gandhi National Rural Employment Guarantee Act: An Overview
IFA
W
LTW
C
L
C

100
(Table 1.2) were provided employment and 135 crore person days of employment were generated.
vRs. 17832 crore has been on wages in the financial year of 2013-14.
vAround 111.64 lakhs work was undertaken by this Act. (fig 1.3)
Figure 1.3: Works Taken Up in FY 2013-14 (Upto December 2013)
Source: Official Website of MGNREGA.
Conclusion:
The works undertaken through MGNREGA give priority to activities related to water harvesting, groundwater recharge and flood protection. It is one of the few experiments in the world to provide alternative source of livelihood. MGNREGA becomes the major employment assuring initiative during non- agriculture season. MGNREGA's should be used as an instrument to enhance the agricultural productivity and to improve the living standard of the unemployed and unskilled rural people/ farmers. MGNREGA works focused on to generating employment in rural and creating rural infrastructure which directly supports to sustainable livelihood.
References:
v Singh, Ajay Kumar, Sunny, Niti Lama, (2012), “MGNREGA: A Critical Assessment of Issues and Challenges”, The Indian Journal of Commerce, Vol. 65, No.2, April-June 2012, pp.151-164.
vBiswas, Debasis (2012), “Performance of Mahatma Gandhi National Rural
Danish Masoud & Anjali Bahuguna

101
Employment Guarantee Scheme with Special Reference to Jalpaiguri District of West Bengal”, National Monthly Refereed Journal of Research in Commerce & Management, Vol. 1, No. 3, March 2012, pp. 94-102.
vM. Vilas Kadrolkar (2012), An Impact Assessment Study of Mahatma Gandhi National Rural Employment Guarantees Act’ (Mgnrega) In Karnataka, Global Research Analysis, Vol.1, Issue 4, sep 2012, pp -21-22, ISSN- 2277-8160.
ISSN No 2277 - 8160
vSingh, Harsimran (2012), “Mahatma Gandhi National Rural Employment Guarantee Act (MGNREGA): Issues and Challenges”, International Journal of Research in Commerce, Economics & Management, Vol. 2, No. 1, Jan, 2012, pp 136-140.
vIAMR (2007) –‘All-India Report on Evaluation of MGNREGA: Survey of 20 Districts’, Institute o Applied Manpower Research, Delhi, pp.1-76.
vJ.Dreze (2008), Employment Gurantee:Beyond Propaganda,The Hindu,January, 2011.
vChaarlas, L.J., Velmurugan, J.M. (2012), “Mahatma Gandhi National Rural Employment Guarantee Act, 2005 (MGNREGA): Issues and Challenges”, International Journal of Physical and Social Sciences, Vol. 2, Issue 6, June, 2012, pp. 253-261.
v“MGNREGA (2014), Report to the People”, Ministry of Rural Development, Department of Rural Development, Government of India, New Delhi, 2nd February, 2014.
v Shah, Miher, MGNREGA Sameeksha , An Anthology of Research Studies on MGNREGA, 2005 (2006-12), MORD, 2012.
vAmbasta, Pramathesh, (2010), “MGNREGA and Rural Governance Reform- Growth with Inclusive Through Panchayats”, International Conference on Dynamics of Rural Transformation in Emerging Economies, New Delhi, India, April 14-16, 2012.
vSingh, Ranjit & Dua, Perminder Kaur (2008) –‘MGNREGA and Rural Employment in Punjab: An Evaluation Study of Hoshiarpur District’, Paper presented at the conference on Employment Opportunities and Public Employment Policy in Globalising India’ organised by CDS during April, 3-5.
vRTBI (2009) - ‘Evaluation of National Rural Employment Guarantee Act (MGNREGA) in Tamil Nadu’, IITM’s, Rural Technology & Business Incubator (RTBI), Indian Institute of Technology, Madras, Pp-1-115.
Mahatma Gandhi National Rural Employment Guarantee Act: An Overview

INTRODUCTION:
Communication is essential prerequisite for any kind of planned efforts of development. Community Development Programme (CDP) was the first planned for rural development. The term Community Development emerged out of the concept of mass education which the British Colonial Office had used to cover various activities connected with the improvement of the community (Dak, 2004:60). The Community Development movement was not an accident in our history but it has been a continuous process, in various shapes and forms, spread over many decades prior to the launching of the official programmes after independence achieved. It is true that these earlier attempts were not called Community Development Programmes as such. But their aim was essentially the same i.e. helping people to help themselves (Haldipur, 1974:30). Community Development method has evolved out of attempts to extend the contribution of science to the masses and to combine these with the efforts of organised local groups to improve their way of life. In earlier stages, attempts were made to disseminate to the rural people, knowledge of many innovations intended to improve their living conditions (Haldipur, 1974:38). Later, Rural Development evolved as a multifunctional perception of social and economic overhead capital, large food grains stocks, rural employment and income generation, food security, reducing poverty, improving the quality of life and unlimited supply of labour (Alexander, 2000:184-327).
A characteristic feature of the Third World countries is that they are still predominantly rural in character and their economy is agrarian and largely subsistence–oriented. The transformation of these countries by structural changes in the total society has been the major emphasis in all models of development. Since the society is predominantly rural and agricultural, primary emphasis has been on modernization of their agricultural sector through large scale extension, i.e., in carrying the message of modern technology to the doorsteps of rural folk, which has been realised only quite recently. The printed world has been the major and
COMMUNICATION AND RURAL DEVELOPMENT PROGRAMMES IN MEERUT IN THE ERA
OF GLOBALIZATION
The Horizon - A Journal of Social Sciences July 2015, pp. 102-108
ISSN-0975-5535No.-II/2015, Volume-VI,
Sudhir KumarTeaching Assistant
Department of SociologyC.C.S.University, Meerut

103
sometimes only means of mass communication and this had little use among the majority of the Third World countries where people are largely illiterate (Joseph,1997:10).
In the modern age, the latest technology and scientific knowledge have become imperative for maximizing social welfare of the people (Joshi, 2005:4). Information and communication have been playing an increasingly important role in economic and social development of nations. Information technology forms the basic background for sound organizational system and public information utility. Communication on the platform of existing network in the rural areas is vital in terms of its application and information sharing. It provides skill like group working, better communication, proper supervision and management of the available resources (Pargunan, 2007:59).
In a country like India, mass communication plays an important role in creating awareness among people about national policies and programmes by providing information so that people may utilize these schemes. Thus, it helps people to become active partners in the endeavor of nation-building and national development.
Since long, some social scientists have studied the economic aspects and issues such as awareness, development and utilization of rural development programmers. Proper awareness is key to utilization of any development programme. This aspect in the developmental process has been found to weak and differentially distributed (Pundir, 1998). Thus, is still need to study the awareness and utilization of rural development programmes as every now and then new programmes are initiated by the state and the present context of globalization is marked by newer and wider spread means of mass communication.
The Problem and Method:
In this context, the present study focuses upon three specific questions.
First, how far the respondents (villages) are aware of recent rural development programmes? Second, how far the respondents have utilized the recent rural development programmes after gaining awareness? The third, what is the socio-economic background of the respondents who have become aware about the recent rural development programmes and utilized those? And lastly, how the socio-economic background is associated/related to awareness and utilization of the rural development programmes?
All the above issues have been studied in the 10 villages of district Meerut in Western U.P. All the villages have been purposively selected keeping in view the urban proximity, differential distance and social-structural features. Twenty respondents have been selected from each village. Thus, two hundred respondents have been purposively selected for the study from the 10 villages.
A Study of Directional Changes in India’s Foreign Trade During The Economic Reforms Period

104
The data have been collected with the help of a team of students, largely coming from these villages and nearby areas. The team had twenty members. The information was collected through an interview guide prepared after long discussions among the team members with exploratory experiences and the team leader. Observation and case study methods were also used to explore the possible aspects at the initial stage as gaining exploratory experiences. On the basis of these explorations, the interview guide was evolved. The fieldwork has been done during the early half of the year 2010.
Results and Discussion:
Awareness of the Recent Rural Development Programmes:
Awareness has been studied in terms of the awareness of the recent rural development programmes among the respondent village folk, knowledge about the number of programmes and sources of information were added. Findings are summarized as follows.
1. 75.5% of the respondents are aware about the recent rural development programmes run by the government and 24.5% of the respondents are not. Thus, larger majority is aware that some programmes of development are going on.
2. 41.5% of the respondents know about one programme, 22.5% of the respondents know about the two programmes and only 11.5% know about the three programmes. Thus, only a small segment of the rural folk know of more than one programme of development
3. 41.5% of the respondents have got the information from the Village Pradhan, 18.5% of the respondents have got the information from Village Panchayat Secretary and 15.5% of the respondents have got the information through the neighbors. Thus, the village Pradhan, president of statutory village panchayat are the important source of awareness in the rural area.
4. 29% of the respondents have the formal relationship and 46.5% of the respondents have the informal relationship with the persons who act as sources of information namely village Pradhan, Panchayat secretary and local leading persons. Thus, it means that even in the era of globalization, informal relations (i.e. upto 75%) play an important role for larger part in filtering the information upto the grass roots.
Utilization of the Recent Rural Development Programmes:
Utilization has been studied in terms of utilization of the rural development programmes and choice of programmes used. The findings are as follows.
1. Of those who are aware (i.e.75.5%), 49% of the respondents have utilized and
Sudhir Kumar

105
26.5% of the respondents have not utilized the recent rural development programmes. Thus, majority of those aware have utilized the programmes.
2. 11.5% of the respondents have been benefitted from the Old Age Pension, Widow Pension and benefits for Physically Challenged, 24.5% of the respondents have benefitted from the Indra Awas Yojana and only 14% of the respondents have been benefitted from the NREGA. Thus, IAY appears to have been utilized more than any other programmes.
Causes of Non-utilization of the Recent Rural Development Programmes:
Causes of not utilizing the recent rural development programmes have been studied in terms of why the respondents have not utilized.
7.5% of the respondents have not utilized programme due to lack of awareness, 11.5 of the respondents have not utilized due to corruption and 7.5% of the respondents have not utilized due to others reasons. Thus, corruption in the process of utilization appears to be the more important cause than others in non utilization.
Socio-Economic Background of the Respondents:
Socio-economic backgrounds of the respondents have been studied in terms of the sex, age, religion, caste, education, type of family and occupation.
1. 70.5% of the respondents are male and 29.5% of the respondents are female. Thus, large majority of the respondents are male.
2. 23.5% of the respondents belong to younger age (i.e. upto 25), 49.5% of the respondents belong to middle age (26 to 50) and 27% of the respondents belong to old age (above 50). Thus, largest segment (about half) of the respondents belong to the middle age group.
3. 52.5% of the respondents belong to the Hindu religion and 47.5% of the respondents belong the Muslim religion. Thus, majority of the respondents are Hindu.
4. 51% of the respondents belong the Other Backward Castes and 49% of the respondents belong the Scheduled Castes. All the respondents belong to OBC and SC categories and both are almost half.
5. 48% of the respondents live in nuclear families and 52% of the respondents live in the joint families. Thus, majority of rural folk still live in joint families.
6. 60.5% respondents are illiterate, 23.5% are primary level educated and 16% studied upto secondary level and above. Thus, majority of respondents are illiterate.
7. 91.5% of the respondents are engaged in labour work, 4% of the respondents are
Communication and Rural Development Programmes in Meerut in the Era of Globalization

106
engaged in service and 4.5% of the respondents are engaged in agriculture activities. Thus larger majority of respondents are labourers.
Socio-Economic Background and Awareness of Recent Rural Development
Programmes:
More important attributes from the socio-economic background of the respondents appear to be sex, education and occupation. Likewise, the recent rural development programms also has various parameters. These are categorized into four specific categories like- awareness, utilization and causes of non utilization. The relationship between the select variables of socio-economic background, namely sex, education and occupation, and aspects of recent rural development programmes i.e. awareness, utilization and causes of non utilization have been described here.
1. 53% of the male respondents and 22.5% of the female respondents are fully aware about the recent rural development programmes introduced by the state, 17.5% of the male respondents and 7% of the female respondents are not aware. Thus, majority of males are aware whereas the females are less aware.
2. 45.5% of the illiterate, 17.5% of the primary educated and 12.5% of the secondary educated are aware about the recent rural development programmes run by the state and 15% of the illiterate, 6% of the primary educated and 3.5% of the secondary educated are not aware. Thus, awareness cuts across the educational levels of village folk.
3. 69% of the labour workers, 3% of the service men and 3.5% of the agriculturists are aware about the recent rural development programmes and 22.5% of the labour workers, only 1% of the service-men and only 1% of the agriculturists are not. Thus, majority of labour workers and other occupational categories are aware of the progammes meant for their development.
Socio-Economic Background and Sources of Awareness of Recent Rural
Development Programmes:
1. Of those who are aware (i.e.75.5%), 28.5% of the male respondents and 12% of the female respondents have got the information from the Village Pradhan, 13% of the male respondents and 5.5% of the female respondents have got the information from Village Panchayat Secretary and 20.5% of the male respondents and 5% of the female respondents have got the information from the neighbors. Thus, both males and females have become aware through all the three categories of sources of awareness.
2. 25% of the illiterate respondents, 10% of the primary educated respondents and 6.5% of the upto secondary educated respondents have got the information from the Village Pradhan, 11% of the illiterate respondents, 4.5% of the primary
Sudhir Kumar

107
educated respondents and 3% of the upto secondary educated respondents have got the information from Village Panchayat Secretary and 9.5% of the illiterate respondents, 3.5% of the primary educated respondents and 2.5% of the upto secondary educated respondents have got the information from the neighbors. Thus, the village leader namely the Pradhan has been found to be the more important source for creating awareness among the different categories of people. Of course, village level official and neighbors have also been relevant.
3. 38% of the labour worker, 1.5% of the service man and 2% of the agriculturists have got the information from the Village Pradhan, 17% of the labour worker, 2% of the service man and only 1% of the agriculturists have got the information from Village Panchayat Secretary and 22.5% of the labour worker, only 1% of the service man and only 1% of the agriculturists have got the information from the neighbors. Thus the rural folk of various occupational categories become aware through village leaders, of course other sources other source also found working.
Socio-Economic Background and Utilization of the Recent Rural Development
Programmes:
1. Of those who are aware (i.e.75.5%), 34.5% of the male respondents and 14.5% of the female respondents have utilized the programmes and 19% of the male respondents and 7.5% of the female respondents have not utilized the recent rural development programmes. Thus, more of males utilized the programmes than that of the females.
2. Of those who are aware (i.e.75.5%), 29.5% of the illiterate respondents, 21.5% of the primary level educated respondents and 8% of the upto secondary educated have utilized and 16% of the illiterate respondents, 6% of the primary level educated respondents and 4.5% of the upto secondary educated have not utilized the recent rural development programmes. Thus, majority the respondents cutting across educational background have utilized the recent rural development programmes.
3. Of those who are aware (i.e.75.5%), 45% of the labourer respondents, 2% of the service respondents and 2% of the agriculturists respondents have utilized and 24% of the labour respondents, 2% of the service respondents and 21.5% of the agriculturists respondents have not utilized the recent rural development programmes. Thus, larger segment of the labour workers have utilized the programmes than the people from other occupational categories.
Thus, the present study indicates that rural development programmes during the era
Communication and Rural Development Programmes in Meerut in the Era of Globalization

108
of globalization are reaching the rural folk of Other Backward Castes and the Scheduled Castes; the illiterate, literate and more educated as well; among males and females but more being used by males; of different age categories but more of middle age; the village chief (President of statutory village Panchayat), village level official and neighbours cutting across castes are found to be the important sources of awareness, village chief greater source than others, despite all modern means of communication which are not found to percolate communication of development programmes among the rural folk. Thus, it is an important to note the fact that communication about development programmes, which have been initiated by the state for the benefit of the rural folk particularly the poor, the landless, the small peasants, is not reaching. It negates to a larger extent the claims are made and resources being used. This also indicates the earlier findings that new means of communication are playing important role in development. The present study has been limited to general observation, interview and case studies with a small number of respondents in few villages in district-therefore; the findings are limited, provisional and suggestive.
References
Alexender, K.C. 2000:“Rural Development Studies in The Eighties”, in M.S.Gore (ed.), Third Survey of Research in Sociology and Social Anthropology, Vol-2, New Delhi, ICSSR, pp: 184-327.
Dak, T.M. 2004:“Rural Development in India: Changing Concerns, Strategies and Programmers” in Yogesh Atal and Rajesh Misra (eds.) Understanding the social sphere: The Village and Beyond, Jaipur, Rawat Publications, pp: 54-88.
Haldipur, R. N. 1974: “Sociology of Community Development and Panchayati Raj (Part I) : A Trend Report” in ICSSR’S, A Survey of Research in Sociology and Social Anthropology, Vol.1, Bombay, Popular Prakashan, pp: 30-68.
Joshi, N.C. 2005: “Technology: The Route to Rural Uplift”, Kurukshetra, Vol. 53, No. 5, pp: 4-6.
Joseph, Joni C. 1997: Mass Media and Rural Development, Jaipur, Rawat Publications.
Pargunan, M. 2007: “Rural Upliftment through Information Technology”, Kurukshetra, Vol. 55, No. 12, pp: 59-63 .
Pundir, J.K. 1998: Banking, Bureaucracy and Social Networks, New Delhi, Sarup and Sons.
Sudhir Kumar

Inclusive and integrated policy and strategy for economic and social development of poor had been adopted in the Eleventh Five Year Plan (2007-2012). The Government of India made a special effort to increase its support to socio-economic sectors and started a number of schemes aimed at the poor, particularly poor women, and women in the informal sector. These programmes have addressed various sectors like poverty, employment, capacity building, health, education and welfare etc. Financial Inclusion of the poorer section of the society is essential for the purpose of the inclusive growth but mere financial inclusion alone cannot break the vicious circle of poverty in the rural India. The Committee on the Financial Inclusion under the chairmanship of the RBI former Governor Dr C.Rangrajan (2012) has defined as the process of ensuring access to financial services and adequate credit to the vulnerable groups and low income section of the society at an affordable cost.
The UNDP (2012) has defined capacity as “the ability to perform functions, solve problems and achieve objectives” and it has three levels; individual, institutional and societal. WHO (2012) has defined as the development and strengthening of human and institutional resources. The Declaration of the Microcredit Summit held in Washington DC in 1997 defined microcredit programmes as those “extending small loans to poor people for selfemployment project that generate income, allowing them to care for themselves and their families”(Swaminathan,M.,2007). NABARD(2000) has defined micro credit as “Provision of thrift, credit and other financial services and products of very small amounts to the poor in rural, semi-urban or urban areas for enabling them to raise their income levels and improve living standards”. In India bank linked SHGs programme has been very effective in the process of the financial inclusion and poverty elevation. The financial inclusion must be supported by the capacity building processes in the rural community. Ahmad (1999) maintained that the processes of the SHGs are very influential in promoting the rural development and the women empowerment in the following ways:
vSHGs have played valuable roles in reducing the vulnerability of the poor.
ROLE OF MICRO FINANCING IN THE FINANCIAL INCLUSION AND THE PROCESS OF CAPACITY BUILDING IN THE BULANDSHAHR DISTRICT OF UTTAR PRADESH
The Horizon - A Journal of Social Sciences July 2015, pp. 109-119
ISSN-0975-5535No.-II/2015, Volume-VI,
Satyavrat Singh RawatAssitant Professor, Department of Economics
NREC College, Khurja (U.P.)

110
vThe poor section of the society especially the women asset based, income generation and consumption are enhanced through the formation of the SHGs.
vBy the provision of emergency assistance, SHGs have been reducing the vulnerability of the poor’s.
vSHGs have been playing crucial role through empowering and emboldening women by giving them control over assets and the resources.
Dasgupta (2005) in his paper on informal journey through self help groups observed that micro financing through informal group approach has affected quite a few benefits viz.:
vSavings mobilized by the poor. Access to the required amount of appropriate credit by the poor.
vMatching the demand and supply of credit structure and opening new market for FI’s. Reduction in transaction cost for both lenders and borrowers.
vTremendous improvement in recovery. Heralding new realization of subsidy less and corruption less credit.
Manimekalai (2004) in his article commented that to run income generating activities successfully the SHGs must get the help of NGOs. In his study he gave some striking conclusions:
vThe formation of the SHG’s has boosted the self confidence and selfimage of the rural women.
vThe SHGs have emerged as the most vital instrument in the process of participatory development and women empowerment.
vSHGs can be helpful in the process of poverty eradication.
vFormation of SHGs can enhance women’s contribution in the growth of the regional as well as national economy.
vProblem of rural unemployment can be tackled with the help of the micro credit.
The above review of literature has been presented with a view that SHGs can be an effective means of the financial inclusion and the capacity building in particularly in the rural areas. After the reviewing the various literature there is need to develop financial inclusion and capacity related indices of the SHGs members at the District and Block levels and examine the relationship with the functioning of the SHGs. With the help of questionnaire and schedule data have been collected from the selected women members of the self help groups. In this paper, only those self help groups have been studied which are linked with bank. Out of the fifteen blocks, only
Satyavrat Singh Rawat

111
nine blocks have been chosen in this study. One block has been selected from the each Tehsil of the district Bulandshahr i.e. from the seven tehsils and the remaining two blocks have been selected from the bigger tehsils of the district like Bulandshahr and khurja. In every blocks forty women member of the various self help group have been selected randomly from the twenty SHGs for the purpose of the detailed survey. Maximum two women have been selected from any particular group. The time period of the study has been fixed in between 2007-2012.
Evaluation of a Group: An SHG is a small group of about 10-20 persons from a homogeneous class, who come together voluntarily to attain certain collective goals, social or economic. The group is democratically formed and elects its own leaders. The concept of SHGs is predominantly used in the case of economically poor people, generally women, who come together to pool their small savings and then use it among themselves. The group members meet regularly (once in a week) and carry out their financial transactions. The group mobilizes savings among its members only and provides need based loans to the members only (Chadha and Gautam2005).
Evaluation of the self-help groups should be based upon the objective parameters. A table has been constructed for the evaluation of a group by making some amendments in the method given by the Chadha and Gautam (2005). These all parameters for measuring the performance of the self-help groups in the District Bulandshahr are given in a table as below:
Table Number 1.1
Participation of the members in the in the meetings of the group
Sr. No. Evaluation Factor Good
Score ‘3’Satisfactory
Score ‘2’Unsatisfactory
Score ‘1’
1 Size (Members) 15 - 20 10 - 15 Below 10
2 Level of a Members Similar and Poor
Not Very Similar and Few are not Poor
Not Similar and Maximum Non Poor
3 Meetings (Month) Four Two Less Than Two
4 Attendance More Than 90% (good)
70% - 90% (Average) Less Than 70%(Less Than Average)
5 Active Average Less Than Average
6 Saving Collection in a Month
Four Times Two to Three Times
Less Than Two Times
Role of Micro Financing in the Financial Inclusion and the Process of Capacity Building in the Bulandshahr District of Uttar Pradesh

112
Decision Making in a Group
Always by Consensus
Some times by Consensus
Never by Consensus
Age of a Group More than Three Year
One to Three Year Less than One Year
Member’s Awareness Regarding the Rules and Regulations of the Group
Good Average Low
7 Monthly Amount of Savings for a Group in Rs
More Than 8000
4000 to 8000 Less than 4000
8 Interest Rate on the Borrowings for the Members
Depends on the Objective of the Borrowing
Two to Three Percent Per Month
More than Three Percent Per Month
9 A l l o c a t i o n o f Savings Collected by Group
Fully Allocated as Debt Among the Members
Partly Allocated as Debt Among the Members
Less Amount is Allocated as Debt Among the Members
10 Recovery of Debt from the Members
More than 90%
70% to 90% Below than 70%
11 All the Registered are Regularly Maintained and Fully Updated
Not Maintained and Update Properly
12
Maintenance of the Record’s Book
Only Necessary are Like Minutes and Debt Accounts are Maintained and Updated
Leadership of a Group
Active Average Passive
13
14
15
16 Working of the Group Fully Democratc and Transparent
Partly Democratic and Transparent
Less Democratic and Transparent
17 Members Participation in the Decision Making of a Group
Active Average Passive
Satyavrat Singh Rawat

113
Table 1.2
Block Wise Scoring of the Self Help Group
Average Poor
18 Educational Level of the Members of the Group
More than 50% can Read and Write
30% to 60% can Read and Write
Less than 30%can Read and Write
19 Group’s grading Good
20 Access to credit to the member
Easy Normal Poor
21 Promotion to the Micro Entrepreneur Activities by Group
Active Average Less than average
22 Interest burden on the member
Low Normal More
23 Self Confidence after Becoming the Member of the Group
Radically Increase
Normally Increase Remain Same
Score of the SHGs N Mean Std. Std. Minimum MaximumDeviation Error
Bulandshahr 20 32.38 5.75 0.54 24 72
Khurja 20 34.70 4.66 0.48 24 72
Shikarpur 20 31.45 4.24 0.42 24 72
Siyana 20 32.13 4.56 0.46 24 72
Anupshahr 20 33.08 6.33 0.62 24 72
Debai 20 32.40 3.19 0.38 24 72
Gulawati 20 30.30 7.06 0.66 24 72
Arniya 20 29.68 4.48 0.44 24 72
Sikandrabad 20 32.75 6.67 0.64 24 72
Total 180 32.09 5.22 0.52 24 72
Role of Micro Financing in the Financial Inclusion and the Process of Capacity Building in the Bulandshahr District of Uttar Pradesh

114
Financial Inclusion and Control over Resources: Construction of Index Number at the individual level means that Index is prepared for the SHGs members. The control over resources is used here to measure the capacity building of the SHGs members. This index will be constructed by the questions asked from the Self Help Group members through Questionnaire/Schedule. Twelve set of variables has been selected in this study for the construction of the sub indices. These variables are mentioned as below:
vControl over own Saving. vParticipation in minor decision like purchase of consumable goods.vParticipation in major decision like investment in purchase of land, like
jewellery, etc.vManagement of the family budget and family finance, vAccess to the facilities like ATM, vAccess to the insurance cover, vAccess to the loan facility, vAccess to the bank account,vEasy management of interest burden vDecision making in the expenditure regarding family health care and nutrition vUse of MobilevAccess to the source of income
Calculation of Score:
For the calculation of scores, twelve set of question have been is being asked to the respondent for each index. Values from each answer’s from the every question vary from ‘0’ to ‘3’. Maximum total for each index is ‘36’and the minimum will be the ‘0’.
Satyavrat Singh Rawat

115
Score for the each index has been obtained for every selected member before and after the joining of the Self Help Group. In this paper, various statistical techniques have been used to empirically analyze the relationship between the predictor and response variables. The statistical methods have been analysed by the statistical computer programme as Microsoft Excel and the Statistical Programme for the Social Science (SPSS-18).
Table Number 1.3
Table Number 1.4
Mean and Standard Deviation of the Inclusion and Capacity Index
Table Number 1.5
Significance of the Mean Difference of the Index
Testing of the Hypothesis: Whether the SHGs are contributing significantly in
Score Answer
0 Never
1 Some Times
2 Quite Often
3 Regular/Always
15.67 360 4.36 0.23
Sr. No. Index
Paired Samples Statistics
Mean NumberStd.
Deviation
Std.ErrorMean
Inclusion and Capacity Index (Before Joining SHG)
13.00 360 3.34 0.18
Inclusion and capacity Index (After Joining SHG)
Std. Error Mean
t-Value Sig. (2-
tailed)
-2.66 1.74 0.09 -29.2 359 0.00
MeanDiff.
Inclusion and Capacity Index (Before Joining SHG) – Inclusion and capacity Index (After Joining SHG)
S.D. df
Role of Micro Financing in the Financial Inclusion and the Process of Capacity Building in the Bulandshahr District of Uttar Pradesh

116
the process of Financial Inclusion and the Capacity Building the score of Index is obtained at two different point of time as follows:
vBefore the joining of the SHG ( Pre SHGs scenario)
vAfter the Joining of the SHG (Post SHGs scenario)
Whether the difference in the score for each index is significant or not between the above mentioned time period, is decided by the application of the ‘paired t’ test.
Null hypothesis,H0: µ1 = µ2 (µ1 - µ2=0), i.e. There is no change in the index’s mean score after becoming the member of the SHGs.
Alternative hypothesis, Ha: µ1 ≠ µ2, i.e. there is a significant change in the index’s
mean score after becoming the member of the SHGs.
µ1 and µ2 is the respective mean value for the index before and after the joining of the SHGs. Here, the calculated value comes out to be greater than tabulated value. This implies that our null hypothesis will be rejected and the alternative hypothesis will be selected. It means that for the index, the difference of mean is significant at the 1% level i.e. we can say it with 99% confidence level that the score of the index have been enhanced significantly after becoming the member of the SHGs.
Decision making: The findings of this study have clearly indicated that there has been significant improvement in the capacity of women to participate or influence the decision making process at the various levels.
Control and Access to the Resources: More involvement in the self-help groups has given women better control and access as far as the resources are concerned. Women control over income, cash and savings and their access to the banks and the loan facilities has increased significantly.
Management and Accounting Skill: Active participation in the self-help groups has been helpful to the women as far as the improvement in the management and accounting skills are concerned. After becoming the group’s member women have been managing their family budget and family financial matters more confidently.
Autonomy: Self-help group has been very influential in promoting the women’s autonomy. Women have been taking autonomous and independent decisions making in the field of family, economic and social matters.
Selfconfidence: SHGs member’s feelings of self-worth as assessed by looking at their confidence level, treatment received from family members, attitude in helping the neighbours. In post phase group, members experienced better treatment by family members as they have been providing her more help and support and women’s confidence level increases in dealing various issues at the work place, in the family and in the community level.
Satyavrat Singh Rawat

117
Freedom: The SHGs programme has enhanced significantly the capacity to choose and women have been taking free and independent decisions regarding their expenditure and Investment.
Change in the of Role Women: In the postSHGs phase women reported that the control over their own lives has been improved significantly. Now their interactions with other members of the community have increased and they are feeling more free and confident. Their choices have been enlarged in every field. In the post phase women are also redefining their role in the family as well as in the society but this does not mean that the women are not doing their traditional role.
The micro financing programme definitely has potential to bring up the desired results but due to some internal and external factors relating to the operating environment of the self-help groups, this programme could not able to reap its full potential. In our study, we have found that some factors are responsible for the slow growth of micro finance in the study area. These factors can be classified in to the internal and external factors.
Problem of Targeting: Cronia and Stewert (1993) called it two error of targeting which commonly occurs in especially in the Government’s programmes for the poor’s. Like other government’s developmental programmes, this micro finance also faces the problem of targeting where the poor is excluded from the benefits of micro credit ( Type-I) and non-poor becomes its beneficiaries(Type-II) . This wrong targeting sometimes occurs deliberately and sometimes it is due to the institutional deficiency and the corruption prevailing in the system.
Fraud and Corruption: Fraud and the corruption are creating main constraints in the growth and expansion of any organisation. There are serious irregularities and fraudulent practices in the working of the SHGs. Corruption is also playing its role in hampering the growth and expansion. Lack of transparency, bogus records and malpractices are main cause of corruption in the SHGs.
Failure to Sustain Income Generating Activities: Although main aim of the SHGs is to promote savings. The main factor of motivation for savings is mainly secured future. The SHGs also promotes the loan for the productive purposes. Sustaining the growth of the SHGs requires sound income generating activities but the SHG’s face problem regarding income generation activities.
Misallocation of the Credit: Proper allocation of the credit is instrumental for sustaining the growth of SHGs. There are many cases in which wrong one is selected and right one is rejected as far as the credit allocation is concerned. Misallocation not only creates hurdles in the growth of the SHGs but also results in wastage of the valuable funds.
Role of Micro Financing in the Financial Inclusion and the Process of Capacity Building in the Bulandshahr District of Uttar Pradesh

118
Problems in Capacity Building: Problems in capacity building to SHG’s and its members include poor educational standards, non-availability of competent, experienced and qualified staff and resource persons, lack of quality reading materials, lack of community support, non availability of adequate funds, counselling and training etc. Only few of the respondents have received proper training and orientation for capacity building. These training programmes were attended and participated by some members only.
Bank Linkage: The sponsor bank’s role in promoting to SHGs has been very vital. The main problems in bank linkages were reported to be lack of cooperation and support, procedural delays, apathetic attitude of bank officials. Bank officials have a tendency either linger on or give secondary treatment to the SHGs related work. Lack of proper monitoring and feedback by the bank management has hampered the growth of the SHGs particularly in the study area.
Suggestions: Sustaining the momentum of the SHGs is very critical as far as the micro financing sector of India is concerned. It has been observed that more than 50% of the SHGs could not last up to the one year. To ensure sustainability of SHGs its formation and the functioning process should be closely monitored. In most of the cases formation and most of the maintenance cost of SHGs have to be permanently borne by the promoter, mostly a donor funded NGO, making the system inherently unsustainable. So, the government agencies and banks should fallows following steps carefully before lending and sanctioning any project:
vPre lending appraisal,
vCost benefit analysis of the project,
vPost lending supervision and monitoring,
vProper feedback and follow up action,
vRegularly remain in touch with the borrower and should create climate of personal touch with the borrowers,
vScaling and rating of the SHGs,
vMarketing support and training programme,
vStreamlining of credit into income generating activities.
Continuous effort are be needed for the capacity building in the micro financing sectors particularly the SHGs. Member’s poor awareness level, non-availability of competent and qualified staff and resource persons, lack of community support, counselling and training etc. are the main constraints in the processes of capacity building. India is the country where a collaborative model between banks, NGOs, MFIs and public administration is prevailing in the micro financing sector. Therefore
Satyavrat Singh Rawat

119
well coordinated and collaborative efforts are required for capacity building in the SHGs.
BIBLIOGRAPHY
Ahmad, A. (1999).Women Empowerment: Self Help Groups. Kurukshetra, Vol. 52 (4),pp. 9-13.
Chaddha, A. and Gautam ,D. (2005): “Banks and Financial Institution Role in the Poverty Eradication.” Bankman Publishers, Delhi,pp73-180.
Cornia,G.A. and Stewert ,F. (1993): “Two Errors of Targeting”, Economic Policy Series , UNICFF International Child Development Centre.
Dasgupta, R. (2005).Microfinance in India: Empirical Evidence, Alternative Models and Policy Imperatives. Economic and Political Weekly, 19 March.
Manimekalai, K. (2004).Economic Empowerment of Women Through Self-Help Groups. Third Concept, February.
Swaminathan, M.(2007).The Microcredit Alternative. Economic and Political Weekly , pp 1171-75.
www.nabard.org.com accessed on 29 May, 2012 at 10:30 pm.
www.rbi.org.in accessed on 30 May, 2012 at 9:15 pm.
www.undp.org.in accessed on 18 March, 2012 at 06:00 pm.
www.who.int accessed on 19 March, 2012 at 04:30 pm
Role of Micro Financing in the Financial Inclusion and the Process of Capacity Building in the Bulandshahr District of Uttar Pradesh

INTRODUCTION
The process of growth is dependent largely on the resources augmenting as a result of the flow of the FDI and role of FDI in the growth process has been a burning topic of debate in several countries including India. Foreign investment plays a significant role in development of any economy as like India. Many countries provide many incentives for attracting the foreign direct investment (FDI). It promotes an open business climate, builds technologies and advances employee training, besides helping government revenue to grow. FDI inflow in the past two decades stimulated by globalization and liberalization of the Indian economy have played a complementary role in filling the gap between domestic saving and investment. It is a preferred source of external finance for the simple reason that they are not debt creating, non volatile in nature and their returns depend upon the projects financed by the investor. Foreign Direct Investment in the past years has generated a lot of euphoria. It is said that “strong fundamentals” of the economy aided by liberalized government policy has led to the boom of FDI inflow in India. FDI inflow in India is found to be highly correlated with the economic factors taken into consideration and it is in India’s interest to continue to boost foreign investment by liberalizing rules on equity caps, investment reviews and other provisions that have impeded India’s ability to attract even more foreign investment over the recent years.
According to International Monetary Fund (IMF), FDI is defined as “ an investment that is made to acquire a lasting interest in an enterprise operating in an economy other than that of the investor”. The investor’s purpose is to have an effective voice in the management of the enterprise (IMF,1977). FDI is the process by which the residents of one country (the source country) acquire the ownership of assets for the purpose of controlling the production, distribution and other productive activities of a firm in another country (the host country).
Need for FDI
Need for FDI depends on saving and investment rate in any country. Foreign Direct
The Horizon - A Journal of Social Sciences July 2015, pp. 120-132
ISSN-0975-5535No.-II/2015, Volume-VI,
Geeta RaniLecturer in Economics
GGIC, Baraut (Baghpat), U.P.
TRENDS AND PATTERNS OF FOREIGN DIRECT INVESTMENT (FDI) IN INDIA IN THE POST
REFORMS PERIOD

121
investment acts as a bridge to fulfill the gap between investment and saving. In the process of economic development foreign capital helps to cover the domestic saving constraint and provides access to the superior technology that promotes efficiency and productivity of the existing production capacity and generates new production opportunity and technical collaborations, through capital markets via Euro issues and through private placements or preferential allotments. An important objective of promoting FDI in India and other developing countries has been to promote efficiency in production and increase exports. However, as correctly pointed out by C.P. Chandrashekhar and Jayati Ghosh, any increase in equity stake of the foreign investors in existing joint ventures or purchase of a share of equity by them in domestic firms would not automatically change the orientation of the firm. That is, “the aim of FDI investors would be to benefit from the profit earned in the Indian market. As, a result, in such cases FDI inflows need not be accompanied by any substantial increase in exports, whether such investment leads to modernization of domestic capacity or not”. Therefore, it is a challenge for a developing country like India to channelize its capital inflow through FDI into a potential source of productivity gain for domestic firms.
With the introduction of Industrial Policy Statement in July 1991, there has been a paradigm shift in FDI inflow in India. Service sector has been growing at a fast rate contributing approximately 64% to GDP in 2013 from 50% in 1991. This growth has been much faster than manufacturing sector which has remained more or less steady, contributing 14% to GDP in 1991 to 15% to GDP in the year 2013. Over the years FDI inflow in India has been increasing, still however, India receives negligible share of FDI as compared to other countries despite liberalization of foreign investment policy. According to Report on Currency and Finance, FDI inflows to China in 1990s were 10 times of the inflows to India. Though India has tremendous potential for absorbing greater flow of FDI in the coming years, other developing countries are attracting more FDI inflows than India mainly because of a number of factors like better manufacturing sector productivity, flexible labour laws, better labour climate and entry and exit procedures for business, business oriented and more FDI friendly policies etc.
Significance of FDI
Serious efforts are being made to attract greater inflow of FDI in the country by taking several actions both on policy and implementation front. FDI is a vital ingredient of the globalization efforts of the world economy. The growth of international production is driven by economic and technological forces. It is also driven by the ongoing liberalization of Foreign Direct Investment (FDI) and trade policies. One outstanding feature of the present-day world has been the circulation of
Trends and Pattern of Foreign Direct Investment (FDI) in India in the Post Reforms Period

122 Geeta Rani
private capital flow in the form of foreign direct investment (FDI) in developing countries, especially since 1990s. Since the 1980s, multinational corporations (MNCs) have come out as major actors in the globalization context. Governments around the world in both advanced and developing countries have been attracting MNCs to come to the respective countries with their FDI. This experience may be related to the broader context of liberalization in which most developing and transition countries have moved to market-oriented strategies. In this context, globalization offers an unparalleled opportunity for developing countries like India to attain quicker economic growth through trade and investment.
During the period of 1970s, international trade grew more rapidly than FDI, and thus international trade was by far the most other important international economic activities. This situation changed radically in the middle of the 1980s, when world FDI started to increase sharply. In this period, the world FDI has increased its importance by transferring technologies and establishing marketing and procuring networks for efficient production and sales internationally (Shujiro Urata, 1998).
Since the 1997 East Asian financial crisis, the relationship between Foreign Direct Investment (FDI), exports and economic growth has gained importance and attention among policy makers and researchers. The concept of ‘Investment led Economic Development’ has promoted the idea that the outward and inward FDI position of a country is linked to its economic development relative to the rest of the world. It recommends that the countries change through five different stages of development. These stages are being classified according to the propensity of the countries to the outward and/or inward investors (Dunning and Narula, 1999). This propensity, in turn, depends on the extent and pattern of the ownership specific advantages of domestic firms, its location advantages and the degree of utilization of the ownership specific advantages by the domestic and foreign firms in the internationalization of markets. Foreign Direct Investment (FDI) has appeared as the most significant source of external resource flows to developing countries over the years and has become a significant part of capital formation in these countries, despite their share in global distribution of FDI continuing to remain small or even declining.
The effects of FDI in the host economy are usually believed to be increase in the employment, augmentation in the productivity, and boost in exports and amplified pace of transfer of technology. It facilitates the utilization and exploitation of local raw materials, introduces modern techniques of management and marketing, eases the access to new technologies, foreign inflows can be used for financing current account deficits, finance flows in form of FDI do not generate repayment of
principle and interests (as opposed to external debt) and increases the stock of human

123
capital via on the job training. The effect of FDI on growth rate of output was constrained by the existence of diminishing returns of physical capital. Consequently, FDI could only put forth an effect on the level of output per capita, but not on the growth rate. In other words, it was unable to modify the growth of output in the long run. In the context of the new theory of Economic Growth, FDI is considered as an engine of growth of mainstream economies. As noted by the World Bank (2002), several recent studies concluded that FDI can promote the economic development of the host Country by promoting productivity growth and export. However, the exact relationship between foreign multinational corporations and their host countries varies considerably between countries and among industries. The characteristics of the host country and the policy environment are important determinants of net benefit of FDI. In view of the above discussion, this discussion provides rich insight into the relationship between FDI and growth. Therefore, this paper is an attempt to analyze the trends and patterns of Foreign Direct Investment (FDI) in India in the post-reforms period.
Foreign Direct and Indirect Investment
Foreign Direct Investment
FDI stands for Foreign Direct Investment, a component of a country's national financial accounts. Foreign direct investment is investment of foreign assets into domestic structures, equipment, and organizations. The FDI can take any route or form to enter into any nation. The three principal forms of FDI in India are joint ventures, acquisition of assets in a country and Greenfield ventures.
Foreign Indirect Investment as Portfolio Investment
Portfolio investment does not seek management control, but is motivated by profit. Portfolio investment occurs when individual investors invest, mostly through stockbrokers in stocks of foreign companies in foreign land in search of profit opportunities. Foreign investment comes in host country through various routes and many forms. Rather than attracting as much FDI as possible host country governments would be well advised to focus their efforts in inviting the “right” kind of FDI. Among all various routes the two main routes are:
1. Foreign Direct investment (FDI) and
2. Foreign Indirect Investment (FIIs)
The Inflow of Foreign Investment Comes Through Various Routes.viz:
1. Equity (Government, RBI, NRI, Acquisition, shares, Equity capital of unincorporated bodies); Re-invested earning; other capital.
2. Portfolio Investment (GDR/ADR, FIIs, OFF shore funds and others)
Trends and Pattern of Foreign Direct Investment (FDI) in India in the Post Reforms Period

124 Geeta Rani
Direct Investment /Indirect Investment
I) Equity
(a) Government (SIA/FIPB) (I) GDRs/ADRs.
(b) RBI (II) FIIs.
(c) NRI (III) off-shore funds and others.
(d) Acquisition of shares.
(e) Equity capital of.
(f) Unincorporated bodies.
II) Re-invest Dearing.
III) Other capital.
Determinants of FDI in Host Country
I) Host Country Determinants:
1. Policy framework for F.D.I..
2. Economic, political & social stability.
3. Rules regarding entry & operations.
4. Standards of treatment of foreign affiliates.
5. Policies on functioning & structure of markets (esp. competition & merger and acquisition [M&A] Policies.
6. International agreements on FDI.
7. Privatization Policy.
8. Trade policy (barriers-tariff & non-tariff) and coherence of FDI and trade policies.
9. Tax Policy.
II) Type of FDI /Principal Economic Determinants in Host Countries
1. Market-seeking.
2. Market size.
3. Market growth.
4. Access to regional and global markets.
5. Country specific consumer preferences.
6. Structure of markets.
III) Economic Determinates
1. Resource/Asset- Seeking.
2. Raw materials.

125
3. Low-cost unskilled labor.
4. Skilled labor.
5. Technological, innovatory and other created assets (e.q. brand name as embodied in dividable, firms and clusters.
6. Physical.
7. Infrastructure (Ports, roads, power & telecommunication.
IV) Business Facilitation
1. Investment promotion.
2. Investment incentives (including image building & investment generating activities and investment facilitation services).
3. Hassle costs (corruption, administrative efficiency & the like).
4. Social amenities (bilingual schools, quality of life etc.).
5. After-investment services.
V) Efficiency Seeking
1. Cost of resources and assets adjusted for productivity for labour resources.
2. Other input costs like easy transport & communication economy and cost of other intermediate products.
3. Membership of a regional integration agreement conducive.
Literature Review
Many empirical studies have been undertaken to analyze the trends and patterns of Foreign Direct Investment (FDI) in India, few of them are as follows:-
Ana Mar (1997) reviews the recent evidence on the scale of FDI to low-income countries over the period 1970-96 and major factors determining foreign companies’ decision to invest in a particular country. The study concludes that large market size, low labor costs and high return in natural resources are amongst the major determinants in decision to invest in low income.
Mucchielli and Soubaya (2000) investigated the determinants of the volume of trade of the French Multinational Corporations (MNCs). The major findings suggest that inward FDI has a positive influence on Foreign trade (including exports and imports), and this positive influence is stronger for exports compared with imports.
Charkraborty and Basu (2002) explored the co-integration relationship between net inflows of FDI, real GDP, unit cost of labor and the proportion of import duties in tax revenue for India with the method developed by Johansen (1990). They find two long-run equilibrium relationships. The first relationship is between net inflow of FDI, real GDP and the proportion of import duties in tax revenue and the second is
Trends and Pattern of Foreign Direct Investment (FDI) in India in the Post Reforms Period

126 Geeta Rani
between real GDP and unit cost of labor. They find unidirectional Granger Causality from real GDP to net inflow of FDI.
Naga Raj (2003) discusses the trends in FDI in India in the 1990s and compare them with china. The study raises some issues on the effects of the recent investments on the domestic economy. Based on the analytical discussion and comparative experience, the study concludes by suggesting a realistic foreign investment policy.
Salisu A.A. fees (2004) examined the determinants and impact of FDI on economic growth in developing countries using Nigeria as a case study. The study observed that inflation, debt burden, and exchange rate significantly influence FDI inflows into Nigeria. The contribution of FDI to economic growth in Nigeria was very low even though it was perceived to be a significant factor influencing the level of economic growth in Nigeria.
Kulwinder Singh (2005) analyzed the developments (economic and political) in India relating to the trends in two sectors:- Industry and Infrastructure. The study concludes that the impact of the reforms in India on the policy environment for FDI presents a mixed picture. The industrial reforms have gone far, though they need to be supplemented by more infrastructure reforms, which are a critical missing link.
Nirupam Bajpai and Jeffrey D. Sachs (2006) attempted to identify the issues and problems associated with India's current FDI regimes, and more importantly the other associated factors responsible for India's unattractiveness as an investment location. Despite India offering a large domestic market, rule of law, low labor costs, and a well working democracy, her performance in attracting FDI flows have been far from satisfactory. The conclusion of the study is that a restricted FDI regime, high import tariffs, exit barriers for firms, stringent labor laws, poor quality infrastructure, centralized decision making processes, and a very limited scale of export processing zones make India an unattractive investment location.
Nandita Dasgupta (2007) examined the effects of international trade and investment related macro-economic variables, namely, exports, imports and FDI inflows and the outflows of FDI from India over 1970 through 2005. Unidirectional Granger Causality was found from export and import to FDI outflows, but no such causality exists from FDI inflows to the corresponding outflows from India.
Burak Camurdan and Ismail Cevis (2009) developed an empirical framework to estimate the economic determinants of FDI inflows by employing a panel data set of 17 developing countries and transition economies for the period of 1989-2006. Seven independent variables were taken for this research namely, the previous period FDI, GDP growth rate, wage, trade rate, inflation rate and economic investment. The empirical results conclude that the previous period FDI is important as an economic determinant. Besides, it is also understood that the main determinants of

127
FDI inflows are Inflation rate, the interest rate and trade (openness) rate.
Sapna Hooda (2011) analyzed the impact of FDI on economic growth of Indian economy for the period 1991-92 to 2008-09. She Used OLS method for this purpose. The empirical results found that foreign Direct Investment ( FDI) is a vital and Significant factor influencing the level of growth in Indian economy. She also estimated the determinants of FDI inflows and found that trade GDP, Research and Development GDP, Financial position, exchange rate, Reserves GDP are the important macroeconomic determinants of FDI Inflows in India.
Trends and Patterns of FDI in India (1991-2012)
At the time of its independence in 1947, India was a host to a significant stock of Foreign Direct Investment (FDI) largely owed to her est. while colonial master: the UK. Soon after the independence, India embarked on a strategy of industrialization with active governmental intervention. Domestic enterprise accumulated considerable capability in the process of industrialization, which has influenced not only the pattern of inward FDI in the country in subsequent period but has also led to investments made by Indian enterprises abroad. The changes in government policy have also had an important bearing on the FDI position of India. Foreign Investment plays on important role in the long-term economic development of a country by:-
a) Augmenting availability of capital
b) Enhancing competitiveness of the domestic economy through transfer of technology.
c) Strengthening infrastructure and boosting exports employment opportunities.
d) Raising Productivity and Generating new investment.
Therefore, FDI is a strategic instrument of development policy. The initial policy stimulus to Foreign Direct Investment (FDI) in India came in July 1991 when the new industrial policy provided, inter alia, automatic approval for projects with foreign equity participation up to 51 percent in high priority areas. In the wake of economic liberalization policy initiated in 1991, the government of India has taken several measures to encourage foreign investment both Direct and portfolio, in almost all sectors of the economy. However, the emphasis has been on Foreign Direct Investment (FDI) inflows in the:-
a) Development of infrastructure.
b) Technological up gradation of Indian Industry.
c) Projects having the potential for creating employment opportunities on a large scale and.,
d) Setting up Special Economic Zones (SEZs) and establishing manufacturing units therein.
India has consistently been classified as one of the most attractive investment
Trends and Pattern of Foreign Direct Investment (FDI) in India in the Post Reforms Period

128 Geeta Rani
destinations by reputed international rating organizations. With a vast reservoir of skilled and cost-effective manpower, India offers immense opportunities for Business Process Outsourcing (BPO), Knowledge Process outsourcing (KPO) and Engineering Process Outsourcing (EPO). In recent years, the Government has initiated the second generation reforms under which measures have been taken to further facilitate and broaden the base of FDI in India. The policy for FDI allows freedom of location, choice of technology, repatriation of capital and dividends. As a result of these measures, there has been a strong surge of international interest in the Indian economy. The rate at which FDI inflow has grown during the post-liberalization period is a clear indication that India is fast emerging as an attractive destination for overseas investors.
Since economic reforms initiated in 1991, Government of India has taken many programs to magnetize FDI inflows, to improve the Indian economy. An important objective of promoting FDI in India and other developing countries has been to promote efficiency in production and increase exports. As a result, India has received total FDI of US$ 180,034 million from the year 1990-91 to 2011-12 which is due to the initiatives taken by the Government of India in attracting FDI inflows in India. The FDI inflows have shown a rising trend from 1991-92 to 1997-98 owing to the sincere programmes of structural liberalization and open market reforms. The rise in flows of FDI till 1997 was due to not only of the liberalization policy but also due to the sharp expansion in the global scale of FDI outflows during the 1990s. Another causal factor may have been the recovery of the Latin American economies, which had begun to emerge from the Debt Crisis of the 1980s. Then after during 1998-99 and 1999-00 there was decline in FDI inflow which was due to the decline in industrial growth rate in the economy and also due to the result of the East Asian Financial Crisis. But again in the next following year, foreign investment started to bounce back. During 2002-03 and 2003-04, again there was fall in flow of foreign direct investment which was due to the cast of Global Recession on the Indian economy. The FDI Equity inflows during the five years 2005-06 to 20011-12 showed a massive increase of more than seven times than those of the previous years 1991-92 to 1999-00 and 2000-01 to 2004- 05. This increase was due to the revised FDI Policy in March 2005, an important element of the policy was to allow FDI up to 100% foreign equity under the automatic route in townships, housing, built-up infrastructure and construction-development projects. The year 2005 also witnessed the enactment of the Special Economic Zones Act, which entailed a lot of construction and township development that came into force in February 2006.
Sources of FDI in India
India has broadened the sources of FDI in the period of reforms. There were 120

129
countries investing in India in 2012 as compared to 15 countries in 1991. Thus, the number of countries investing in India increased after reforms. After liberalization of economy Mauritius, South Korea, Malaysia, Cayman Islands and many more countries predominantly appears on the list of major investors apart from U.S., U.K., Germany, Japan, Italy, and France which are not only the major investor now but during pre-liberalization era also.
According to the data of Business Environment authored by Francis Cherunilam the insurance provides for 26 percent to 49 percent investment through auto route, Airlines 49 percent, Airport 49 percent, Telecom 74 percent, Real Estate 100 percent, Print Media and Defense 26 percent, Power, Roads and Highways, Banking, Petroleum, Journal, Advertizing, Film, Tea, Courier Services, Drugs and Pharmaceutical and Hotel and Tourism all provide for 100 percent FDI in their respective sectors.
India is suffering from the scarcity of financial resources and low level of capital formation because it has to majorly depend upon the external sources of Finance. Also the domestic resources are entirely inadequate to carry out development programmes. Foreign exchange reserves has increased from 1911 us million dollar in 1953-54 to 38036 in 1999-00 and 304818 us million dollar in 2010-11. Study found that SDR and reserve tranche position is fluctuating during the same time period. But Gold and foreign currency assets has increased from 274 and 1644 us million dollar to 2974 and 35058 and 22972 and 274330 us million dollar in 2010-11 respectively.
Table No. 1 Flow of FDI in India
Source:Report of RBI, Negative (-) sign indicates outflow
Trends and Pattern of Foreign Direct Investment (FDI) in India in the Post Reforms Period

130 Geeta Rani
Foreign investments have played a pivotal role in India to supplement the low level of domestic investment. The flows of foreign investments in India takes the form of direct investment and portfolio investment which are non-debt creating flows in nature. The FDI flows in India took a new turn with announcement of New Economic Policy in 1991. The FDI allowed in priority sectors for the development of industries. The table no 1 depicts that flows of FDI in India has increased from 599 million dollar in 1992-93 to 61851 million dollar in 2010-11. It also shows that out of total inflows, direct investment constituted 56.35 percent (315 million dollar) and portfolio investment worked out 43.65 percent (244 million dollar) in 1992-93. Over the period of 19 years, we found a drastic (U) turn in the share of direct and portfolio investments.
The Table No. 2 depicts route wise foreign investment inflow of FDI from 2000-01 to 2010-11. Table shows that FIPB, RBIs, Automatic and Acquisition have the maximum contribution in total FDI in India. Their shares remain more than 50 percent. It was minimum (50.83 %) in 2003-04 and maximum (72.22%) in 2008-09. FDI through equity was minimum (0.74%) in 2003-04 and maximum (8.72%) in 2004-05. FDI through Re-invested was minimum (22%) in 2007-08 and maximum (36.40%) in 2002-03. FDI through Other Capital was minimum (0.83%) in 2007-08 and maximum (14.64%) in 2003-03. It shows very high fluctuation in FDI in India. It shows negative growth also.
Table No.3 Route –Wise Foreign Investment in India(in % age)
Source: RBIs bulletin May 2011

131
Conclusion
In summary we can say that in India there is urgent requirement of FDI to support the ongoing developmental programmes of the economy. Though, we have attained great deal in this field yet much remains to be done in the field of ease of doing business in India and other norms facilitating the smooth functioning of business and the flow of FDI in coming years.
REFERENCES
1. Sarbapriya Ray Impact of Foreign Direct Investment on Economic Growth in, India: A Co integration Analysis, Advances in Information Technology and Management (AITM) 187, Vol. 2, No. 1, 2012, ISSN 2167-6372
2. Dr. Jasbir Singh,Ms. Sumita Chadha, Dr. Anupama Sharma, “Role of Foreign Direct Investment in India: An Analytical Study, Research Inventy: International Journal of Engineering and Science ISSN: 2278-4721, Vol. 1, Issue 5 (October 2012), PP 34-42 www.researchinventy.com 34
3. Nilofer Hussaini. N H, Economic Factors and Foreign Direct Investment in India: A Correlation Study, Asian Journal Of Management Research, Online Open Access Publishing Platform for Management Research Volume 2 Issue 1, 2011, Research Article ISSN 2229 – 3795
4. .Priyanka Sahni, Trends And Determinants Of Foreign Direct Investment In India: An Empirical Investigation, International Journal of Marketing and Technology http://www.ijmra.us 144 August 2012 IJMT Volume 2, Issue 8 ISSN: 2249-1058
5. A.T. Kearney’s (2007): Global Services Locations Index”, www.atkearney.com
6. Alhijazi, Yahya Z.D (1999): “Developing Countries and Foreign Direct Investment”, digitool.library.mcgill.ca.8881/dtl_publish/7/21670.htm.
7. Andersen P.S and Hainaut P. (2004): “Foreign Direct Investment and
Employment in the Industrial Countries”, http:\\www.bis\pub\work61.pdf.
8. Balasubramanyam V.N, Sapsford David (2007): “Does India need a Lot More FDI”, Economic and Political Weekly, pp.1549-1555.
9. Basu P., Nayak N.C, Archana (2007): “Foreign Direct Investment in India: Emerging Horizon”, Indian Economic Review, Vol. XXXXII. No.2, pp. 255-266.
10. Belem Iliana Vasquez Galan (2006): “The effect of Trade Liberalization and Foreign Direct Investment in Mexico”, etheses.bham.ac.uk /89/1/ vasquezgalan06phd.pdf.
11. Bhagwati J.N. (1978), “Anatomy and Consequences of Exchange Control Regime”, Vol 1, Studies in International Economies Relations No.10, New York, ideas-repec.org/b/nbr/nberbk/bhag78-1.html.
Trends and Pattern of Foreign Direct Investment (FDI) in India in the Post Reforms Period

132 Geeta Rani
12. www.eximbank.com
13. www.imf.org
14. www.rbi.org
15. www.worldbank.org
16. www.wto.org
17. www.ifc.org

BOOK REVIEW
The Horizon - A Journal of Social Sciences July 2015, pp. 133-134
ISSN-0975-5535No.-II/2015, Volume-VI,
Financial Crises: Socio-Economic Causes and Institutional ContextAuthor of the Book: Brenda Spotton Visano Publisher: Routledge, Taylor & Francis Group, London and New York. Pages: 144
Neha Nainwal Assistant Professor
Laxmi Bai College, University of Delhi
This book is authored by Mr. Brenda Spotton Visano, an Associate Professor of Economics at York University, Canada. It consists of 11 well written chapter, explanatory notes on the topic, bibliography, and an index.
Main Findings of the Book
The part I is pivotal chapter. It helps us to get insight of socio - economic view of financial crises. This part consists of 5 chapters that deal with the issue relating to socio-economic framework of financial crisis. It starts from the introduction to the evolution of financial fragility. In this introduction, it defines the financial crises at both economic and social levels. At the economic level, financial crises are systemic disturbances to the financial system that impede the system’s ability to allocate financial capital and disrupt the economy’s capacity to function. The breakdown in financial markets can adversely affect non-financial sectors of the economy. In this way, financial crises can precede both temporally and causally economic crises in employment, production and trade. The book also illustrates the concepts of manias, panics and crises. Later on, it also examines the impact of uncertainty on forming behavior of institutions (rules and conventions). In continuing this, the book, at its part 1, gains importance in light of the explanation of speculation as a fool’s paradise.
Part II deals with the progression of a manias- panic episode. This part consists of 3 chapters. Here the focus point is to examine the institutional organization of speculation and the influence of credit creation and bank on speculation. Speculation normally leads to financial instability, which in turn, may be a strong cause for creating the environment that push-up for financial crisis. Financial instability may arise because of loss of information, inadequate of information, incompleteness of markets; investors are ill-informed, etc. On the other hands, the book is popularised because it also examines the other side of the coin – the influence of credit creation and bank on speculation. It explores the endogenous credit dynamics that support and promote speculation in periods of optimistic uncertainty. The book also explores the cause of financial distress experienced in the wake of a recession of speculative

134
enthusiasm and considers the conditions under which that distress could erupt into a panic.
The final part of the book gives a detailed explanation of variations in manias, panics and crises. This part consists of 3 chapters – time space comparisons of financial instability, institutional indicators of financial fragility and evolution of financial crises. In the book, it is emphasized that the nature of innovation is such that, at times, the induced social and economic changes are profound and profoundly uncertain. It is in these periods of major transition that the most spectacular of speculations- and recoil in crises-are most likely to occur. Interestingly, it is also emphasized that economic and social crisis is more severe when the precipitating financial crisis involves the collapse of deposits banks.
Utility of the book
The book is designed to interest a cross-section of readers, viz. teachers and students of economics, commerce, law, public administration, business management, chartered accountancy and company secretaryship. It will also serve the needs of legislators, business executives, entrepreneurs and investors, and others interested in tax structure developments in India. On the whole, the book is very informative and knowledge enhancing. It is useful to a variety of users. Policy makers, academicians, researcher, managers and journalists alike can utilise this book. It can be useful for someone who is, in general interested in fiscal policies in India.
Critics of the book
This book gains importance in light of the fact that financial crisis is a recurring phenomenon for any economic policy of any government. It is also concerned with the use of socio-economic causes and institutional approach to examining the nature of financial crises. As the book is largely based on a descriptive approach, it does not qualify for a research book but qualifies as good detailed reference book.
Neha Nainwal

BOOK REVIEW
The Horizon - A Journal of Social Sciences July 2015, pp. 135-136
ISSN-0975-5535No.-II/2015, Volume-VI,
This book is authored by Dr. M. Lakshmi Narasaiah, Professor of Economics at Sri Krishnadevaraya University Post-graduate Centre, Kurnool, Andhra Pradesh, India. It has 32 chapters’ well written chapter, bibliography, and an index.
The book essentially focuses on the issue of consumer interest in the context of international trade and economic growth. It basically originates with the debate that the benefits that would fall to the consumers are usually ignored. Despite their numbers, they do not carry the weight that producers and other lobbies command. Normally, consumers are seldom informed about how the availability, quality, price and choice of the hundreds of items which they buy each year are affected by trade policy decisions and government decisions. To discuss this debate, the design of entire book is framed.
The issue of international trade and economic growth are discussed internally and externally. It talks about the world trade, export subsidiaries, international trade, free trade, WTO, agricultural trade, World Bank, population growth, energy, urbanization and dematerilisation of the world economy. This book is designed to analyse the existence of consumers’ satisfaction with that of international trade and economic growth.
The book is also focusing largely on “how do government decisions on trade affect the consumer?” Virtually all protective policies mean higher prices for the consumer. If it is not consumer who pays, it will be domestic producer that ultimately leads to higher prices for the consumer through indirect channels.
The book explains World Trade- as the challenge for developing countries. In this line it also examines export subsidies, international trade with the consumer’s money, eliminations of barriers from trade and trading towards peace. It also estabilised free trade as a peacemaker for both developing as well as developed
International Trade and Economic GrowthAuthor: Dr. M. Lakshmi NarasaiahPublisher: Discovery Publishing House Pvt. LTD. New DelhiYear: 2008Pages: 172ISBN: 978-81-8356-305-5
Phool ChandAssistant Professor
PGDAV (D) College, University of Delhi

136
countries. In the context of trade, it also analysed the provisions and agreements lying with WTO and developing countries. With this analysis, it explored the winners and losers from WTO’s agreements.
At the intermediate stage, the book gain importance in the light of the fact that it provides the direction of future of agricultural trade. Later on, it debated an issue – “can economic growth reduce poverty?” To response this, it has been estabilised that there is no direct causality between growth and poverty reduction. And, there is indirect causality between growth and poverty reduction. The finding is very much suggestive that increase in economic growth may lead to reduction in the poverty only if government promotes labour-intensive development. The book also discusses the challenges before traditional economic growth and technological entrepreneurship as the new force for economic growth.
At the end, it explored the interconnection between economics and environment, population growth and energy, population growth and urbanization. In the process of interconnection, the book also emphasisedthat for any kind of growth fiancé matters by examining the role of financial liberalisation. In concluding part in this book, tourism industry has been categorised as the world biggest industry.
The book is designed for the researcher who is intended to work out the relationship between international trade and economic growth with special focus on the consumer interest. On the whole, the book is very informative and knowledge enhancing. It is useful to a variety of users.
As the book is largely based on a descriptive approach, it does not qualify for a research book but qualifies as good detailed reference book. It contains only theoretical framework that needs to be tested.
Phool Chand
SOME ASPECTS ON PREVAILING TRENDS OF BORROWING MONEY WITH SPECIAL REFERENCE
TO AN REMOTE RURAL AREA IN ARUNACHAL PRADESH
The Horizon - A Journal of Social SciencesNo.-II/2015, Volume-VI, July 2015, pp. 137-148ISSN-0975-5535
1Om Jee Ranjan2B. W. Pandey and Subhash Anand
1Department of Geography, Delhi School of Economics, University of Delhi, Delhi 2Department of Geography, Delhi School of Economics, University of Delhi, Delhi
INTRODUCTION:
Humans have a lot of pro social tendencies. The tendency of human society is based on the basic principle of being together and mutually helping each other. Helping the needy ones by providing own available commodities to them and in return satisfying one’s needs by taking the things available with them ((Bernardus, 2003). The social foundations reinforced by this borrowing and lending trend and created the social class. The mutual cooperation and desire for utilization of conveniences has given birth to economy which according to the local features goes on Organized – escalated (Ranjan, 2014).
Thus, the borrowing trend which had begun from the initial times of human evolution today it will be developed into an intricate system in various forms. Banking system, co- operative institutions, futures trading, share market, trade of securities and many more services; even every works which is improve the human prosperity is a form of borrowing and lending trend.
Economic activity is deeply associated with geographic features. Nature of economy and its development is directly influence by geographical boundaries and agricultural activities, when it is mainstay of any isolated-spatial region. As an example, if, paddy-cultivation is main income source in any isolated region then it can be can say that harvesting time of paddy-cultivation is a prime time of economic activities in this particular area and reaming time is deeply interrelated with this prime time.
Indebtedness and its influence on an isolated- remote area are only concerned of this paper. Because, when money is needed and bag is empty, borrowing is the only way left. There are many dimension of Indebtedness – need to money and unavailability any income facility at that time constrain to borrow money.
The characteristics of geographical space determine and control of economic activity. The geographical characteristics have a great influence on the way of living

138
in the society, culture, production and economic activities. The needs of the people in eastern Himalayan zone may differ more or less from the needs of the people of rest of India. The physiographic conditions have profound effects on their economic activity (Basu, 1983). Though, today in this era of modern technology and whole world has become a global village. Even the physiographic hindrances have become redundant. Many pioneer geographers like- Walter Christaller, August Losch, Peter Haggett, Alfred Weber etc. have also tried to determine the geographical boundaries of economic activity in their own respective ways, which determines the development of lifestyle of related society.
Actually borrowing trend has a circle. This circle is like a boundary line which describes the limit of an isolated area. The perimeter of this isolated area can be underlined by communicable smoothness. For example, economic activities within 15 km radius of the present study area, is maximum, because there is communicational disruption from outer areas. The cities provided many commercial activities like banking are situated at a distance of at least 15 km from the centre of area. And this distance due to lack of facilities (for example – contracted/paved road, transportation etc) becomes inaccessible (figure 1.).
Thus, in the gaping place of communicational network, this kind of isolated area can be situated. In those it’s a part of economic activity. It can be said trend of borrowing emerge more strong in remote isolated areas, especially in Tawang district, where most people are involved in cultivation or other primary production
As we know India is called nation of village and farmers. At present, only about 33 per cent of Indian’s citizens settle down in urban centers. The remaining 67 per cent reside in rural areas making Asia’s third largest economy and the biggest nation of village in the world. Development process without inclusion of rural India is thus lop-sided and unsustainable. Rural development has always been the prime independence. All five years plans were focused towards the special benefit of the rural community some of the objectives have been achieved and others have failed but the effort for further development has not ceased. Generally lack of capital, lack of employment opportunities, growth of population, excessive pressure of employment opportunities, growth of population, and excessive pressure of population on agriculture, illiteracy, unhealthy traditions like child – marriage and funerals, corruption in public distribution system, and sometimes joint family system, and monsoon failure are greatly responsible for the poverty of rural masses.
Om Jee Ranjan, B. W. Pandey and Subhash Anand

139
Figure1: Model of Borrowing Circle
Hence credit facilities are to be brought to the door step of rural beneficiary for taking then out of the grip of pecuniary poverty (Bardhan , 1978, 1984). The lesson of history is that an essential of agriculture is credit. Neither the condition of the country nor the native of the land tenure, nor the position of agriculture affects the one great fact that the agriculturist must borrow.
The present study area possesses excellent agricultural activities with more than 80 percent population incumbent on agriculture. So main source of income is in the harvesting period and after that they compel to borrow money for their domestic expenditure (Iqbal, 1988). Because, the period of agrarian production is fix and it stay for few month, so until the period of next harvesting or income received from other sources, the earn money is floating hither and thither, which was earned at the time of last harvesting.
During the harvest, they are capable off paying the essential cost of their own development and able to return the loan too, if they have. They even rejoice and spend money on some cultural, social activities, doing pilgrimage, etc. consequentially, the maximum people of indigenous rural society, who depend on subsistence agriculture, have compulsion to borrow money for various expenditures, such as education, health, etc. This paper attempts to understand the relationship between trend of borrow money and income time through correlation analysis.
Indebtedness is not only cast effect on farming community but also on whole society of that area because their prime source of income is agriculture. It will cast more profound effect, when the infrastructure is underdeveloped and disrupted from the link of other production areas due mountainous phisio – climatic conditions. Thus, the trend of borrowing money and indebtedness is emerging out stronger in this type of semi-close economy, because the main window of their economy opens once in year for economic interplay, when their product goes to market. And for the
Some Aspects on Prevailing Trends of Borrowing Money with Special Reference to an Remote Rural Area in Arunachal Pradesh

140
remaining time, the main economic activity in this type of society is involved in “current future trading” and “barter”. An inaccessible rural area like Tawang district is directly influenced by the above situation.
Trend of Borrowing Money and Indebtedness in Isolated-Remote-Rural Area:
Human being is not only an organic fauna but also a pure social one. Living in a society as a responsible social human being is the ultimate goal of human. Economic activities are the basic units of development. If the credit- based economy is circulating in any region, then it must be casting some impact on living standard and livelihood. For example, education could disrupt due to unavailability of borrowing money (Ranjan 2014). In any region, the living standard of society approximately corresponds to the level of economic growth, and its glaring effect can be seen in many mountain villages of Tawang district, where level of economic growth and educational status, both are a vital role to strengthen the regional development.
Every modern business is run on credit. Agriculture in India, however, gives rise to peculiarly urgent problem of finance because of its uncertainty, small unit of farm production and scattered nature of its operation (Yunus 1986). If farmers need money for farming then there must be a need of money for their other important work and regular works peculiarly, in remote isolated area like Tawang district. Because of the Indian agriculture is dependent upon marginal and subsistence farming by the millions of small farmers who are not in a position to same for productive purpose due to low output. Hence they depend almost on borrowing money and pay a part of their income by way high interest. Rural credit comprises formal and informal lending systems. And informal lending includes credit extended by friends, relatives, money lenders etc.
Trend of borrowing is made up of the following-
(1) Borrowed by commercial banks, Regional Rural Banks, the cooperative banks, credit societies constitutive banks, credit societies constituting bank and credit societies constituting the formal sector;
(2) Micro credit involving the bank- small household group (SHG) linkage and the micro finance institution (MFls);
(3) Credit being extended by the banks through government employment generation programmes like Swarnajayanti Gram Swarozgar Yojna (SGSY), which also involves an element of government subsidy and element of government subsidy; and
(4) Informal credit involving the rural money lenders, and relatives.
The 4th type of borrowings can often be seen in remote-isolated mountains area. Because, others formal credit giving institution is generally not works properly due
Om Jee Ranjan, B. W. Pandey and Subhash Anand

141
to disrupted and underdeveloped communication. So, informal lenders are the prime sector of concern study and attempt to know the structural pattern of informal lenders and its influence on related livelihood. According to Reserve Bank of India report (1989) relatives (14.2), landlords (1.5), agricultural money lenders 24.9) and professional money lenders (44.8) supplies 85.4 per cent money on credit and providing money on credit through remaining institutions are only 14.6 per cent. Formal and governmental institutions role are even more less in remote isolated areas like Tawang district. Actually, informal money providers on credit [relatives (14.2), landlords (1.5), agricultural money lenders (24.9) and professional money lenders (44.8)] are the conflux- points and its influence-periphery made a circle – trend of borrowing circle. Generally, those people who live in remote isolated area like Tawang district.
The common understanding of informal finance as described by Ayaggari et al (2008) is “that informal financial institutions play a complementary role to the formal financial system by servicing the lower end of the market - informal financing typically consists of small, unsecured, short term loans restricted to rural areas, agricultural contracts, households, individuals or small entrepreneurial ventures. Informal financial institutions rely on relationships and reputation and can more efficiently monitor and enforce repayment from a class of firms than commercial banks and similar formal financial institutions can… By informal financial institutions, we refer to the entire gamut of non-market institutions such as credit cooperatives, moneylenders, etc. that do not rely on formal contractual obligations enforced through a codified legal system.”
Indian peasant is born in debt, lives in debt and dies in debt” (Darling, 1925) Agricultural has direct effect on the upliftment of rural masses through employment generation and indirectly it affects poverty through growth in agriculture. It is the base of India’s economy. Sustainable development is the only path; Indigenous rural people of Tawang district can follow in order to eradicate poverty. This paper describes the need for an environmentally sustainable rural development in isolated-remote villages of India. But rural India is poor India although it feeds the nation (Sami, 2013). Generally growth of population, lack of employment opportunities, lack of capital, excessive pressure of population on agriculture, illiteracy, unhealthy tradition like child marriage, and beyond means expenditure on marriage and funerals, corruption in public distribution system, and sometimes joint family system, and monsoon failure are greatly responsible for the poverty of rural masses (Patel, 2007). Hence credit facilities are to be brought to the door step of rural beneficiary for taking them out of the grip of pecuniary poverty (Satish, 2005). The rural area of a single state is a more open economic system than rural India as a whole and therefore all-India relationships may not hold for individual states (Ahluwalia,
Some Aspects on Prevailing Trends of Borrowing Money with Special Reference to an Remote Rural Area in Arunachal Pradesh

142
1977). Infrastructural development is the backbone of rural development and it is expected to distribute the gains from agriculture widely by providing opportunities to less developed regions and to small and marginal farmers (Radhakrishna, 2006).
Study Area:
Tawang district lies between North latitudes 270 52' and 270 28' and East longitudes between 910 32' and 920 23'. The district is bounded by Lower Tibet in the north, Bhutan in the south and West Kameng district in the East. The district is divided into three sub-divisions, three blocks and nine circles.
The normal annual rainfall in Tawang area is nearly 1600 mm. Most of the rainfall is received during the monsoon period (June to September). The summer is moderate and extreme cold in winter. However, the mountain peaks are covered with perpetual snow. In winter, temperature falls below freezing point. Two third of the district constitutes high mountain ranges falling in the Higher Himalayan zone. The northern part of the district is mostly devoid of vegetation, due to heavy snowfall during winter season. The economy of Tawang district is basically agrarian in nature with more than 80 of the population dependent on agriculture. And the agriculture of Tawang Chu river basin is mainly depends on monsoon railfall. The alpine and temperate agro climatic conditions of the district are conducive for certain agricultural activities. Wheat is the major food crop produced along with Rice, Maize and Millet.
Objectives
The main objectives of this study are,
1. To study the livelihood situation in remote isolated mountainous area.
2. To analyzing the borrowing trends and indebtedness pattern in remote-isolated area.
Each objective carries a significant research question which’s answers help to understand the economic Scenario and compulsion of borrowing money in isolated rural region like Tawang district.
Methodology and Data Base:
Secondary data on socio economic variable are obtained from the census of India. It is gives only general information about study area. Yet the authentic data of trends of borrowing money and indebtedness is not available. Therefore, study has been done using questionnaire as well as formal and informal discussion with 200 households. This is based on primary data collection at household level.
This study is based on simple cluster sampling of specific households according to objective. The samples of 90 households (10 households from each sub district) are
Om Jee Ranjan, B. W. Pandey and Subhash Anand

143
taken for study. Taken households from Tawang, Kitpi, Thingbu, Lhou, Jang, Mukto, Bongkhar, Lumla, Dudunghar sub district have been interviewed keeping in view the status of livelihood according to questionnaire which mainly include period of income and it effect on expenditure. After collected required information, the obtained data has been analyzed in the perspective of trend of borrowing money, on SPSS.
Livelihood Situation in Remote-Isolated Mountainous Area:
According to 2011 census data, the total net area sown of Tawang district is about 4495 hector but currently using by people is 393 ha., and 210 ha. is uncultivated land. The net irrigated area of the study area of Tawang district is 366 ha. This indicates that the study area has scope for utilization of its land resources (census of India, 2001).
Shifting cultivation is the predominant mode of agriculture pattern and the institution of traditional village council is responsible to manage and control property right in both land and forest. About 44per cent households are involved in production related activities as, transport and other types of operators. About 40per cent household depended on paddy and horticultural farming and rest of households in study area are depends on professional work like teaching, clerking and other private/government relate jobs. Less than 4 percent of the sampled households are engaged in small businesses like parchun shop, grocery shop, cloth mercantile etc.
Tawang district in industrial situation is insignificant. About 22 numbers of village and small scale industry (SSI) units registered permanently and still functioning on 2006 in this study area. According to census of India (2001), the district administration invested 25.20 lakh in industrial sector in 2005-06.
According to collected data, about 44 households are engaged in artisan/handicraft activities, and their products items are sold in within the villages and in local market. People of the study area are doing shifting and settled cultivation of rice, maize and millets crops. The sampling results of the sample villages indicate that gardening and truck farming are other important production in the villages. Only 10 households (about 11.1 percent) have done cannel irrigation in only one village.
The census of India (2011) shows, cannel irrigation situation is third lowest in Tawang district and only 53 ha. of agrarian land being covered. Data shows, the high yielding seeds of rice and wheat are using in only 7 villages. Along with, Chemical fertilizers are used in only 20 villages. Collected information professed that households of Tawang district need credit to improve their cultivation costs.
Analysis of Economic Component: Effects of Borrowing Trends
“What is trend of borrowing money?” exploration of this pithy question is the base
Some Aspects on Prevailing Trends of Borrowing Money with Special Reference to an Remote Rural Area in Arunachal Pradesh

144
line of this paper. Many dimensions can be possible in an economic component but here the following economic components are discussed:
Generally, income time frequency is ‘in days’ in river basin. Here by income time frequency it means that time frequency which is then after getting complete income is obtained. This interval is comparatively more in remote Himalayan villages than in plains and is even more is isolated area and remote rural area. Income time frequency in signal occupation and long time investment sector is much more than job of any kind. If in case of economic system of the present isolated area then here the medium for basic income is agriculture, and time for agriculture production in Tawang river valley is maximum six months. These households depend on only agriculture and the whole annual expenditure is managed by income of six month only.
A part of this, in agrarian based economy system, the certainty of time of income also is in month. ‘Income Time Certainty’ which is occurring in months, brings borrowing trend and make a boundary line of Borrowing Circle in related economy. In this behalf, analysis has been done in detail with the help of example. Here it is just being mention that among the sample taken, 55 per cent have stated that their income is never on time and for the 42 per cent household, some time their income is on time. There is only 3 per cent or even less house hold which have income from job along with the income from main source (figure 2), and 42 per cent households income source is from business along with agriculture (whose income is sometimes on time.) consumptions shows economic status more clearly than income.
Source: Primary Survey, 2014
Figure 2: Get Your Income on Time
Often
Sometimes
Never /No
Om Jee Ranjan, B. W. Pandey and Subhash Anand

145
Because, the limit and nature of consumption are generally extend the developing line of a society. Even the samples collected from related isolated area shows the same.
Income Certainty (on Time)
Income certainty indicates the definite time of income or the income obtained is fixed. For example, - if the chances for getting income on first date of a month is 100 per cent then it can be said that it is 100 per cent income certainty. In this way the percentage of fluctuation in his chances for getting the income also describe the percentage of income certainty. Sample taken from this isolated area, almost 55 per cent households stated that they never have obtained their income on time, and 42 per cent households obtained their income on time not very often. The income of the rest 3 per cent people only is on time who along with primary occupation and also involved in additional occupation like job.
Now the question rises on the matter of fact that the maximum households are not able to get their income time. So, for their expenditures done on determined socio-economic activities, do they have to borrow?
So, for the answer of this question almost 25 per cent households told that they always have to borrow; whereas the answer of 60 per cent of household was that they have to borrow only for sometimes. Only 14.50 per cent households said that they never borrow money for any household expenditure (Figure 3).
Source: Primary survey, 2014
Figure 3: Bar Graph of Income Certainty and Borrow Money
Actually these 14.50 per cent households have all three type of income source (agriculture, business and job) and also have a good income in all 12 months. That’s
Often Sometimes Never/No
Get your Income on Time Borrow Money (if don't get income on time)
Some Aspects on Prevailing Trends of Borrowing Money with Special Reference to an Remote Rural Area in Arunachal Pradesh

146
by they do not need to borrow money on credit basis but rather they are lender of isolated rural area.
This economic system develops upon promise and credit but range of villager-credit is not so long in geographic distance, its limit is bounded by communicational smoothness and depended on occupational pattern. Communicational smoothness and occupational patterns draw a circle of economic boundary. In this economic boundary, informal banking system runs for needy people. This economic boundary can be defined as a borrowing Circle. This trend of borrowing money crimps economic-socio life and prosperity of villagers. Actually it can be say that if any person wants to know development status or mode or life style of People of Tawang river valley or other this type of isolated regions then first of all they have to analyze Borrowing impact on their livelihood. For this propose surveyed questionnaires and data has been analyzed in detail. Now, whether there is any correlation between the extreme declination in income certainty and borrowing money? A correlation has been done on the basis of ‘Pearson method’ on SPSS which after getting examined gives the following result:
In the Table 1, according to ‘Pearson method’ R value (-.255) representing a strong negative correlation (as one variable increases, the other variable decreases). And P value is (.035).
Table 1: Correlation Between Income Time Certainty and Borrow Money
*Correlation is Significant at the 0.05 level (2-tailed).
Source: Primary Survey (Analyzed on SPSS), 2014
Om Jee Ranjan, B. W. Pandey and Subhash Anand

147
It means the negative correlation between get your income on time and borrow money (if do not get income on time) is considered to be significant. In other words, above table shows, that if income does not come as expected time and money is needed then villagers borrow money for own requirement. This output data shows result in overall view. When it will be analyzed in unit wise then result will came more positively from some households but may be some households give indifferent result. This analysis helped to explain the concerned components to indentify the basic cause of credit economy and its boundary.
Conclusion
Villagers of Tawang Chu river basin, who are cultivators, find themselves caught in the trap of trend of Borrowing money and indebtedness. They play a significant role in the socio-economic life of the society and therefore, holistic development is not possible without developing this segment of the society. Credit accessibilities to villagers of isolated-remote area simply demonstrate that the direct access to institutional credit to villagers is very limited and suffers from the urban bias in extending it to them. ‘Income frequency’ and ‘income certainty’ is the most important component of trend of borrowing money and indebtedness. It has been explained, the impacts of borrowing increases with as interval of income frequency (in months) and when ‘income certainty’ increase, then impacts of borrowing decrease.
So, in this isolated-remote villages, where average farm-size is very small, and poverty and illiteracy continue to be preponderant among small landholders, the notion of sustainable agriculture ought to be viewed in the context of need for enhancement of productivity, production and profitability of agriculture and above all, for improvement in the economic conditions of farmers.
All these need a careful and in-depth analysis. After then the people of isolated area can break the Borrowing Circle and make a path toward modern-sustainable-development.
References:
Ahluwalia, Montek S. (1977), World Bank Reprint Series: Number Sixty; Reprinted from the Journal of Development Studies, 1977.
Bardhan, P.K., (1984), Land, Labour and Rural Poverty: Essays in Development Economics, Oxford University Press, New Delhi.
Bardhan, P. K.,&Rudra, A. (1978). Interlinkage of Land, Labour and Credit Relations: An Analysis of Village Survey Data in East India. Economic &Political Weekly, 13(6/7), 367-384.
Some Aspects on Prevailing Trends of Borrowing Money with Special Reference to an Remote Rural Area in Arunachal Pradesh

148
Basu, Kaushik (1983), The Emergence of Isolation and Interlinkage in Rural Markets, Oxford Economic Papers, Vol. 35, No. Pp-262-80
Maria, Franciscus Bernardus and L. Tyack (2003) “Animal Social Complexity: Intelligence, Culture, and Individualized Societies”, Cambridge: Harvard University Press, 2003
Patel, A.(2007). ‘Rural Financing Institution in India Touching the Lives of Millions’ Kurukshetra, a Journal on Rural Development. Delhi, 2007. Pp. 3-14.
Radhakrishna R. and Manoj Panda, ((2006), Indira Gandhi Institute of Development Research, Mumbai 2006.
Ranjan, Om Jee and Anjan Sen (2014). “Borrowing Trend Economy and Its Impact on Education in Isolated Rural Area: A Case Study of Aurangabad District, Bihar”. In: Thakur Rameshwer et al. (2014). Resources and Regional Development in India. Rawat Publication. Delhi, 2014. Pp. 230-246.
Ranjan, Om Jee and Anjan Sen (2014). “Mapping Borrowing Circle in Isolated Village: A Case Study of Bishrampur Village of Aurangabad District, Bihar”. M. Phil dissertation. University of Delhi, Delhi, India. July, 2014.
Sami, Lamaan. (2013), ‘Rural Credit in India’ Kurukshetra, A journal on Rural Development, vol.62, no.2. Dec, 15-20.
Satish P (2005): Mainstreaming of Indian Microfinance, Economic and Political Weekly, April, 23, pp-1731-1739.
The Rural Credit Survey Report, (1989). vol. II (Reserve Bank of India), 1989. p.167.
Yunus, Muhammad. (1986). “Credit for Self-employment: A Fundamental Human Right.”Background paper prepared for World Food Day, p.6.
Om Jee Ranjan, B. W. Pandey and Subhash Anand

Introduction
City play the multifunctional role, which attracts the people from the surrounding region, as result of that city experienced the high rate of inward migration toward the city. It results as the growing population, increased in density of population, expansion of urban area toward their peripheral areas. This all create pressure on the pre-existed transportation setup of the city. Transport systems play a key role in urban system. It determines as the main part of urban functions. An efficient transport system, just not provide only the interaction in different part of city, but it also decide the location of any activities in urban setup. In the urban planning process, transportation planning gets the main focus, because most of urban developments take place along the road networks. This is just because of the accessibility of those places are more easy going. In a well-connected transportation network core city became the nodal point form all of the region. In Delhi, it experienced the high rate of increase in population because of daily 5 lakhs people adding in the population by the inward migration (Economic Survey of Delhi, 2010). It adds the pressure on the transport system and public transport became very crowded. Their efficiency and capacity not sustain the growing population of city.
People switched toward the private mode of transport, but it not provide the long term solution of problem, it create other problems like congestion on roads, air pollution, increasing fuel consumption, slowdown in road traffic flow in peak hours (DDA, 2007).
As cities grow in size, the number of vehicular trips on road system goes up. This necessitates a pragmatic policy shift to discourage private modes and encourage public transport once the level of traffic along any travel corridor in one direction exceeds 20,000 persons per hour. It emphasis on introduced the MRTS (Mass Rapid Transit System) system in city. MRTS system with high capacity passenger flow within the city region helps in reducing the number of private vehicles in city, reduction in fuel consumption, efficient flow of traffic. It make city well functional,
The Horizon - A Journal of Social SciencesNo.-II/2015, Volume-VI, July 2015, pp. 149-158ISSN-0975-5535
ASSESSMENT OF SPATIO – TEMPORAL EXPANSION OF DELHI METRO RAIL
1Subhash Anand2Pankaj Kumar Azad
3Ashwajeet Chaudhary1Associate Professor, Department of Geography, Delhi School of Economics,
University of Delhi, Delhi2Former Research Scholar, Department of Geography, Delhi School of Economics,
University of Delhi, Delhi.3Senior Assistant Professor, Department of Geography, University of Allahabad, Allahabad.

150 Subhash Anand, Pankaj Kumar Azad & Ashwajeet Chaudhary
efficient, and also helping in maintains environmental sustainability in urban areas (Advani and Tiwari, 2005). This chapter aims to analyze expansion of Delhi Metro Rail in spatio-temporal context.
Networks
Table 1: The Journey of Delhi Metro
Source: Delhi Metro Rail Corporation, 2013
The Delhi Metro is being built in phases. Phase I completed 65.11 km of route length, of which 13.01 km is underground and 52.10 km surface or elevated. The inauguration of the Vaishali-Barakhamba Road corridor of the Blue Line marked the completion of Phase I on October 27, 2006. Phase II of the network comprises 128 km of route length and 79 stations, and is fully completed, with the first section opened in June 2008 and the last line opened in August 2011. Phase III (112 km) and Phase IV are planned to be completed by 2015 and 2021 respectively, with the network spanning 413 km.
The total length of the underground corridor presently is 48.06 kilometers and Phase III alone will have underground corridors of 41.04 kilometers. The first phase of Delhi Metro’s construction had 13.01 kilometers of underground Metro lines while the second phase had 34.89 kilometers. In Phase III, about 40 per cent of the total proposed Metro network will be underground. The decision to construct more underground corridors was taken this time to ensure that the construction work causes minimum inconvenience to the people. By constructing so many underground stretches, DMRC will also be able to avoid causing any damage to the existing infrastructure such as flyovers and roads.
The longest underground section of Phase III will be from Indira Gandhi International Airport (Domestic) to Kalkaji on the Janakpuri West – Kalindi Kunj corridor which will be 17.28 kilometers long. The Mukundpur – Yamuna Vihar corridor will have underground lines of 14.38 kilometers and the Central Secretariat – Kashmiri Gate corridor will have a total of 9.37 kilometers of underground lines.

151Assessment of Spatio – Temporal Expansion of Delhi Metro Rail
As per present plans, most of the underground work will be done through Tunnel Boring Machines (TBMs), New Austrian Tunneling Method (NATM) and stations will be constructed with the help of the cut and cover technology. Initial tests such as geo technical surveys, soil surveys, and utility tests are being conducted by specialized agencies on all the above mentioned corridors.
Table 2: Details of Underground Stretches
Source: Delhi Metro Rail Corporation, 2013
Temporally Operational Routes of Delhi Metro
As on August 27, 2011, the whole of Phase-I and Phase-II are complete, with the network comprising six lines with 142 metro stations and a total length of 189.7 km.
Table 3: Temporally Operational Routes of Delhi Metro
Source: Delhi Metro Rail Corporation, 2013

152 Subhash Anand, Pankaj Kumar Azad & Ashwajeet Chaudhary
Source: DMRC, 2013
Figure 1: Operational Routes of Delhi Metro
Red Line
The Red Line was the first line of the Metro to be opened and connects Rithala in the west to Dilshad Garden in the east, covering a distance of 25.15 kilometres. It is partly elevated and partly at grade, and crosses the Yamuna River between Kashmiri Gate and Shastri Park stations. The inauguration of the first stretch between Shahdara and Tis Hazari on December 24, 2002, caused the ticketing system to collapse due to the line being crowded to four times its capacity by citizens eager to have a ride. Subsequent sections were inaugurated from Tis Hazari – Trinagar (later renamed Inderlok) on October 4, 2003, Inderlok – Rithala on March 31, 2004, and Shahdara – Dilshad Garden on June 4, 2008.
This line connects the Inter State Bus Terminal at Kashmiri Gate. It reaches to the one of the largest residential colony developed by Delhi Development Authority (DDA) i.e. Rohini. It also connects one of the oldest commercial hub Azad Market.
Yellow Line
The Yellow Line was the second line of the Metro and was the first underground line to be opened. It runs for 44.65 kilometers from north to south and connects

153Assessment of Spatio – Temporal Expansion of Delhi Metro Rail
Jahangirpuri with HUDA City Centre in Gurgaon. The northern and southern parts of the line are elevated, while the central section through some of the most congested parts of Delhi is underground. The first section between Vishwa Vidyalaya and Kashmiri Gate opened on December 20, 2004, and the subsequent sections of Kashmiri Gate – Central Secretariat opened on July 3, 2005, and Vishwa Vidyalaya – Jahangirpuri on February 4, 2009. This line also possesses the country’s deepest Metro station at Chawri Bazaar, situated 30 metres (98 ft) below ground level. On 21 June 2010, an additional stretch from Qutub Minar to HUDA City Centre was opened, initially operating separately from the main line. However, Chhatarpur station on this line opened on August 26, 2010. Due to delay in acquiring the land for constructing the station, it was constructed using pre-fabricated structures in a record time of nine months and is the only station in the Delhi metro network to be made completely of steel. The connecting link between Central Secretariat and Qutub Minar opened on September 3, 2010. Interchanges are available with the Red Line at Kashmiri Gate station, Blue Line at Rajiv Chowk Station, Violet Line at Central Secretariat. New six coach trains are also introduced for convenience for passengers This line touches the most of the commercial areas of Delhi i.e. Chandini Chowk, Chawri Bazar, Rajiv Chowk (Connaught Place), Hauj Khas, INA, Huda City Center, MG Road one of the most famous Temple of Delhi “Chhatterpur Mandir”, also the tourist attraction of Delhi Qutub Minar, Red Fort, Delhi University and Government Offices i.e. Udyog Bhawan, Central Secretariat.
Blue Line
The Blue Line was the third line of the Metro to be opened, and the first to connect areas outside Delhi. Partly overhead and partly underground, it connects Dwarka Sub City in the west with the satellite city of Noida in the east, covering a distance of 49.93 kilometers. The first section of this line between Dwarka and Barakhamba Road was inaugurated on December 31, 2005, and subsequent sections opened between Dwarka – Dwarka Sector 9 on April 1, 2006, Barakhamba Road – Indraprastha on November 11, 2006, Indraprastha – Yamuna Bank on May 10, 2009, Yamuna Bank – Noida City Centre on November 12, 2009, and Dwarka Sector 9 – Dwarka Sector 21 on October 30, 2010. This line crosses the Yamuna River between Indraprastha and Yamuna Bank stations, and has India’s first extradosed bridge across the Northern Railways mainlines near Pragati Maidan. A branch of the Blue line, inaugurated on January 8, 2010, takes off from Yamuna Bank station and runs for 8.75 kilometers up to Vaishali in east Delhi. It was further extended up to Vaishali which was opened to public on July 14, 2011. A small stretch of 2.76 kilometers from Dwarka Sector 9 to Dwarka Sector 21 was inaugurated on October 30, 2010. Interchanges are available with the Yellow Line at Rajiv Chowk station, and with the Anand Vihar Railway Terminal.

154 Subhash Anand, Pankaj Kumar Azad & Ashwajeet Chaudhary
This line links some major areas i.e. Anand Vihar Railway and Bus Station, Akshardham Temple, Atta Market Noida, Connaught Place, Pusa Institutional Area, Karol Bagh, Jhandewalan Temple, Panchkuiya Road Market, Kirti Nagar Market, Janakpuri District Centre, and Rajauri Garden Commercial Centre.
Green Line
The Green Line was the first standard-gauge corridor of the Delhi Metro operated in 2010. The fully elevated line connects Mundka with Inderlok, running for 21.78 kilometers mostly along Rohtak Road. An interchange with the Red line is available at Inderlok station via an integrated concourse. This line also has the country’s first standard-gauge maintenance depot at Mundka.
It connects the Pira Garhi Industrial Area, Jwala Hedi Market, Rampura Industrial Area, Madipur Industrial Area and Shyama Prasad Mukherjee College.
Violet Line
The Violet Line is the most recent line of the Metro to be opened, and the second standard-gauge corridor after the Green Line. The 20.04 km long line connects Badarpur to Central Secretariat, with 9 km being overhead and the rest underground.
The first section between Central Secretariat and Sarita Vihar was inaugurated on October 3, 2010, just hours before the inaugural ceremony of the 2010 Commonwealth Games, and connects the Jawaharlal Nehru Stadium which is the venue for the opening and closing ceremonies of the event. Completed in just 41 months, it includes a 100 m long bridge over the Indian Railways mainlines and a 167.5 m long cable-stayed bridge across an operational road flyover, and connects several hospitals, tourist attractions and a major industrial estate along its route. Services are provided at intervals of 5 minutes. An interchange with the Yellow Line is available at Central Secretariat through an integrated concourse. On January 14, 2011, the remaining portion from Sarita Vihar to Badarpur was opened for commercial service, adding three new stations to the network and marking the completion of the line.
This line links Okhla Industrial Area, Mohan Cooperative State, Tuglakabad, Lajpat Nagar Market, Nehru Stadium, Central Government Office, Khan Market.
Airport Express
The Airport Express line runs for 22.70 km from New Delhi Railway Station to Dwarka Sector 21, linking the Indira Gandhi International Airport. The line is operated, by the Delhi Airport Metro Express Pvt. Limited (DAMEL), a subsidiary of Reliance Infrastructure, the concessionaire of the line. Constructed at a cost of Rs. 2,885 crore, the line has six stations (Dhaula Kuan and Delhi Aerocity became operational on August 15, 2011), with some featuring check-in facilities, parking and

155Assessment of Spatio – Temporal Expansion of Delhi Metro Rail
eateries. Rolling stock consists of six-coach trains operating at intervals of ten minutes and having a maximum speed of 135 km/h. Originally scheduled to open before the 2010 Commonwealth Games, the line failed to obtain the mandatory safety clearance, and was opened on 24 February 2011, after a delay of around 5 months. Out of 2 new lines and 10 route extensions proposed for Phase III, cabinet approvals have been obtained for 2 new lines and 4 line extensions totaling 121 km, with an estimated cost of 35,000 crore (US$ 6.98 billion). Construction has already begun on many of these in 2012, tenders of all approved lines will be awarded.
Table 4: Current Expansion of Delhi Metro
Source: Delhi Metro Rail Corporation, 2013
Phase IV
Phase IV has a year 2021 deadline, and tentatively includes further extensions to Sonia Vihar, Reola Khanpur, Palam, Najafgarh, Narela, Ghazipur, Noida Sector 62,
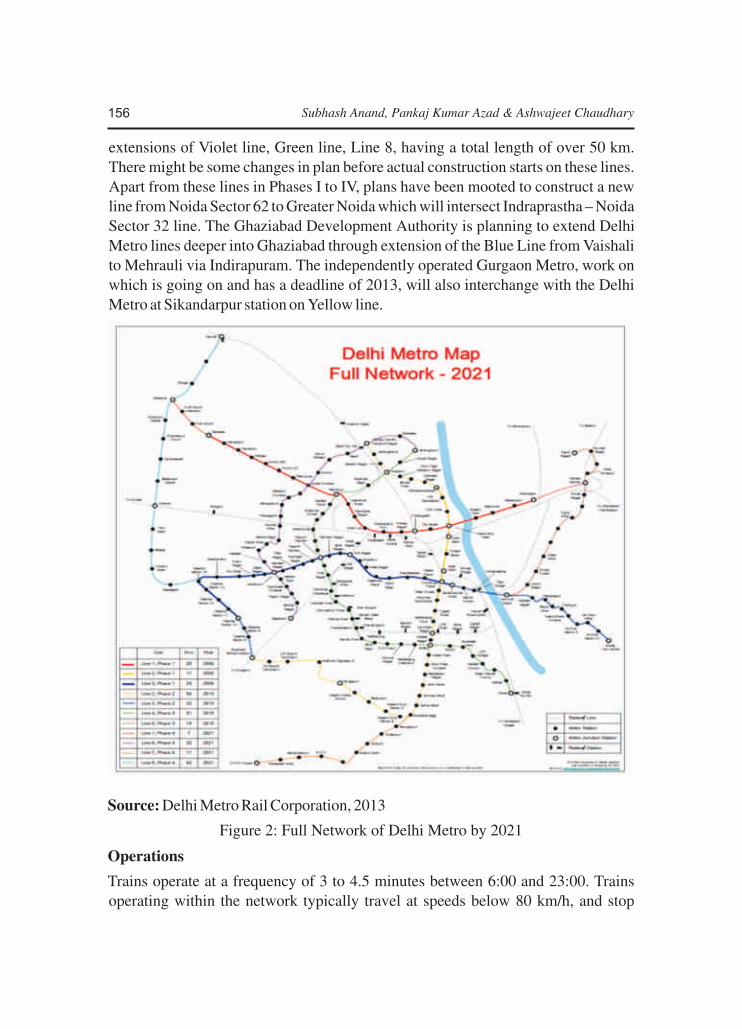
156 Subhash Anand, Pankaj Kumar Azad & Ashwajeet Chaudhary
extensions of Violet line, Green line, Line 8, having a total length of over 50 km. There might be some changes in plan before actual construction starts on these lines. Apart from these lines in Phases I to IV, plans have been mooted to construct a new line from Noida Sector 62 to Greater Noida which will intersect Indraprastha – Noida Sector 32 line. The Ghaziabad Development Authority is planning to extend Delhi Metro lines deeper into Ghaziabad through extension of the Blue Line from Vaishali to Mehrauli via Indirapuram. The independently operated Gurgaon Metro, work on which is going on and has a deadline of 2013, will also interchange with the Delhi Metro at Sikandarpur station on Yellow line.
Source: Delhi Metro Rail Corporation, 2013
Figure 2: Full Network of Delhi Metro by 2021
Operations
Trains operate at a frequency of 3 to 4.5 minutes between 6:00 and 23:00. Trains operating within the network typically travel at speeds below 80 km/h, and stop

157Assessment of Spatio – Temporal Expansion of Delhi Metro Rail
about 20 seconds at each station. Automated station announcements are recorded in Hindi and English. Many stations have services such as ATMs, food outlets, cafés and convenience stores. Eating, drinking, smoking, gambling and chewing of gum are prohibited in the entire system. The Metro also has a sophisticated fire alarm system for advance warning in emergencies, and fire retardant material is used in trains as well as on the premises of stations. Navigation information is available on Google Transit. The first coach of every train is reserved for women.
Conclusion
Over the last decade, the Delhi Metro has physically become part of the urban landscape. It has been absorbed by it, as concrete and metal have been built into, onto, and under the asphalt. Its 142 stations and six lines intersect with many of the large roads and radials of the city. With the construction of Phase III of the metro now underway, more of this intersection and bi-section is to come, as the intertwining of the streets and the Metro covers even more urban space. There is no question that the metro is an astounding feat of engineering and everyday mass transportation for close to two million people (and counting), but it also changes the way we see things. The metro may have been built as a stand-alone system, a kind of artifact placed onto Delhi’s landscape, but it has also become a prism through which we may view the city.
In Delhi, the metro line is often the high-point in what is predominately a low-rise city. As a result, Delhi metro platforms and lines provide a perfect, sometimes stage-like view of the landscape. This spatial understanding of, and perspective on, the city creates a greater awareness about the city itself among a larger number of people than ever before – of its contours and borders, rooftops and highways, malls and industries, settled and unsettled dwellings.
Survey explains how landscapes viewed by passengers through train windows were seen behind wires and poles for the first time, hence changing the nature of nature itself. Then this experience was endlessly reproduced. Moreover, as the distance between places became traversable in much shorter times (what geographer David Harvey calls “time-space compression,”) different places lost their “aura” or uniqueness.
References
Advani, Mukti and Tiwari, G., (2005), Evaluation of Public Transport System: Case Study of Delhi Metro, Transport Research and Injury Prevention Programme, Indian Institute of Technology, Delhi.
Census of India (2011), Provisional Population Tables, Govt. of India, New Delhi.
DDA (2007), Delhi Master Plan 2021, Ministry of Urban Development (Delhi

158 Subhash Anand, Pankaj Kumar Azad & Ashwajeet Chaudhary
Division), Government of India, New Delhi.
DMRC (2012), Annual Report, Delhi Metro Rail Corporation, New Delhi (http://www. delhimetrorail.com/project_updates.aspx).
DMRC (2013), Annual Report, Delhi Metro Rail Corporation, New Delhi (http://www. delhimetrorail.com/project_updates.aspx).
DMRC (2013), Towards New Horizons, New Delhi.
Economic Survey of Delhi, (2010), Planning Department, Govt. of NCT of Delhi, New Delhi.
Foster, M. and Bellamy, J., (2000), “Capitalism’s Environmental Crisis – Is Technology the Answer?”, Monthly Review, p.52 .
Hindustan Times, (2011), Existing Metro Connectivity to Tourist Spots, 29 June 2011.
RITES (2005), Integrated Multi-Modal Mass Rapid Transport System for Delhi, New Delhi.

The Horizon - A Journal of Social SciencesNo.-II/2015, Volume-VI, July 2015, pp. 159-170ISSN-0975-5535
STATUS AND ROLE OF WOMEN IN DISTRICT POLITICS
Naresh Yadav
INTRODUCTION
Women had played a significant and unsubstitutable role since the beginning of life. She has played important role in the formation of society, to maintain culture, and its development. A philosopher has rightly said that “a woman is behind the success of every man” beside this fact woman could not get the status of equality before the man she is facing severe disparity in the society. Every time she was made bound with the rules and customs of society made by man, having the dominating position.
Although there is positive aspect also which indicates better position of women. In ancient past she was assumed as “Devi”. In ancient history Indus valley civilisation was matriarchal.
In present scenario a revolution is getting its speed for the empowerment of women. Woman is getting reservation in politics at the strata, in service; several acts had been formulated for their safeguard in different fields. As a result of all this women has empowered herself at different activities. In politics women has got reservation at grass root level i.e. at district level politics. The Seventy-Third Constitution Amendment Act legitimised the entry of women in mainstream, grass-roots politics. The Panchayat elections held in the State of Rajasthan in January-February, 1995 were of historical significance for the State. For the first time, there was a widespread involvement of women in the electrol arena and politics.
The reservation for women in panchayati raj institutions legitimised the public domain – the male bastion of mainstream politics and governance – for ordinary rural women in Rajasthan. For a State, otherwise, feudal and backward, this was unique.
Participation in elections or politics is culturally considered unacceptable for women in Rajasthan society. Ideally, elections and politics require candidates and supporters to not simply step out the house, but meet and communicate with a cross-section of people and thus being under the gaze of the public. How are women challenging feudal and patriarchal norms and using the new opportunities for political parties in Panchayatiraj institutions in order to take on the new roles from which they were kept out over the ages. Are women often proxies for the men in elections and decision? Bye these reservation women are uplifting themselves in revolutionary way.
Role of Women in District Politics
The movements and efforts for gender political equality, launched by feminists since the closing years of the nineteenth century symbolise the beginning point of women

160 Naresh Yadav
empowerment and their socio-political transition. However all over the world, women take part in politics at a low degree particularly in the process of law and decision making, despite various steps to ensure them including enfranchisements.Empowerment of women has been the dominant credo precisely after the Beijing women’s conference in 1995. The reference was to ensure full participation of women in every aspect of development, government policies to empower women have moved a long arduous course since the provision for welfare of women as one of the weaker sections of Indian society was incorporated in the five year plans documents.
The political structure of India is largely inherited from the British political structure. The British introduced local democracy in India by constituting municipal councils and the municipal corporations in the last quarter for the nineteenth century. They also provided a federal structure to the country with the government of India Act, 1935.
District politics in India is a subject of the state government, the 73rd Amendment to the Constitution of India now makes it obligatory for the state governments to organize local bodies, to hold regular elections to them and to give them appropriate finances. The urban local bodies are of three grades: Municipal corporation for cities with a population of more than (0.3 million), municipal councils for towns smaller than this population limit and NagarPalika for villages in transition to becoming towns. These bodies are elected on a universal surface basis, with all citizens above the age of eighteen years of having a right to vote. The rural local bodies are organized in three tiers, the village Panchayat at the village level, the block level Panchayat Samiti and ZilaParishad for a district.
The 74th amendment to the Indian constitution has served as a major breakthrough towards ensuring women’s equal access and increased participation in local government Act, 1992 aims at constitutional guaranties to enable them to function as effectively democratized and self-governing institutions at the grass root level. This amendment provides reservation of 33 per cent of elected seats for women at local government level in urban and rural areas.
Objectives of the Study
¤To study the main characteristics of women in the study area.
¤To analyse the geographical, cultural characteristics, social structure and value system of the society in the study area.
¤To study the impact of various issues and aspects such as modernization, urbanization, industrialization, mass media education on the empowerment of women and role in district politics.

161Status and Role of Women in District Politics
¤To understand whether the participation of women in district politics has any specific relationship with the cultural, regions of the study area.
¤To study the relation of dominant caste and role and statuswomen in district politics.
¤To study the impact of women reservation in role & status of women in the society.
¤To suggest measures to make participation in politics and women empowerment programmes more effective and result oriented.
Research Methodology
The present study was conducted in Rajasthan state. Rajasthan state includes 33 districts. Out of 33 districts, only 3 districts were selected viz. Alwar, Bharatpur and Jaipur for the purpose of this study. In all 80 women elected representative were selected from each of three districts. Purposes sampling technique was used for selecting the sample from different blocks of districts Alwar, Bharatpur, Jaipur. Interview schedule and focused group discussions were used to elicit the required information. The interview schedule comprised of three sections viz (s) demographic profile of the respondents (b) factors affecting women members from performing their roles (c) expectations and suggestions for better leadership. The data was collected in the month of September, October, November 2011.
Analysis of Role and Status of Women in District Politics
During course of study we found that maximum number of women were elected in Panchayats and block samiti in comparison to Zila Parishads legislative assembly and parliament members in district of Alwar, there is no women representative in Assembly. Where as in case of Jaipur and Bharatpur districts, there are three elected MLAs in each district. Further, elected women representatives in case of ZilaParishad are 28, 21, 25 in Alwar, Bharatpur and Jaipur district respectively. For present study in selected samples of all three districts, maximum women are from Panchayats and Block Samities.
Respondents Profile
Out of total 240 respondents, 197 belong to middle age group varying from 30-50 years, 4 respondents were old (above 70 years), the respondents are reelected candidates since the last Panchayat election. It may be stated here that age factor is off course a significant factor. A matured age reflects quite sound and reasonable views in conformity with the needs and necessities warranted by the circumstances (Table 1)
Out of the majority (viz. 197) respondents, 186 were married and rest 11 were widow.

162 Naresh Yadav
Table 1: Respondents Profile (N 240)
Reasons for Contesting Elections
Majority of 190 of the respondents wished to help people in the society and to work for the development of the concerned village. 60 respondents mentioned that they had pressure from the family especially from their husbands and father-in-law’s 18 respondents entered politics to hold power and to prove their identity, political parties motivated 50 respondents and the 22 mentioned that since there was no other women member available she thus, contested elections (Table 2).
Table 2: Reasons for Contesting Elections
Meeting Attended by WER’s in Panchayat
Majority of 224 of the respondents had complete freedom of expression in the meetings. They were not found meek or mute; they usually raised their point and view in the Panchayat meetings. They actively participated in the discussion and debates regarding future plan of action. They were free to determine areas required more of development and financial assistance required for the betterment of the people 26 respondents expressed that they weren’t free to put forth their point of view, as male member’s view points were preferred in male headed panchayats other reason being that they felt hesitant to present their views in front of the male
P
P S
F M
W R
P
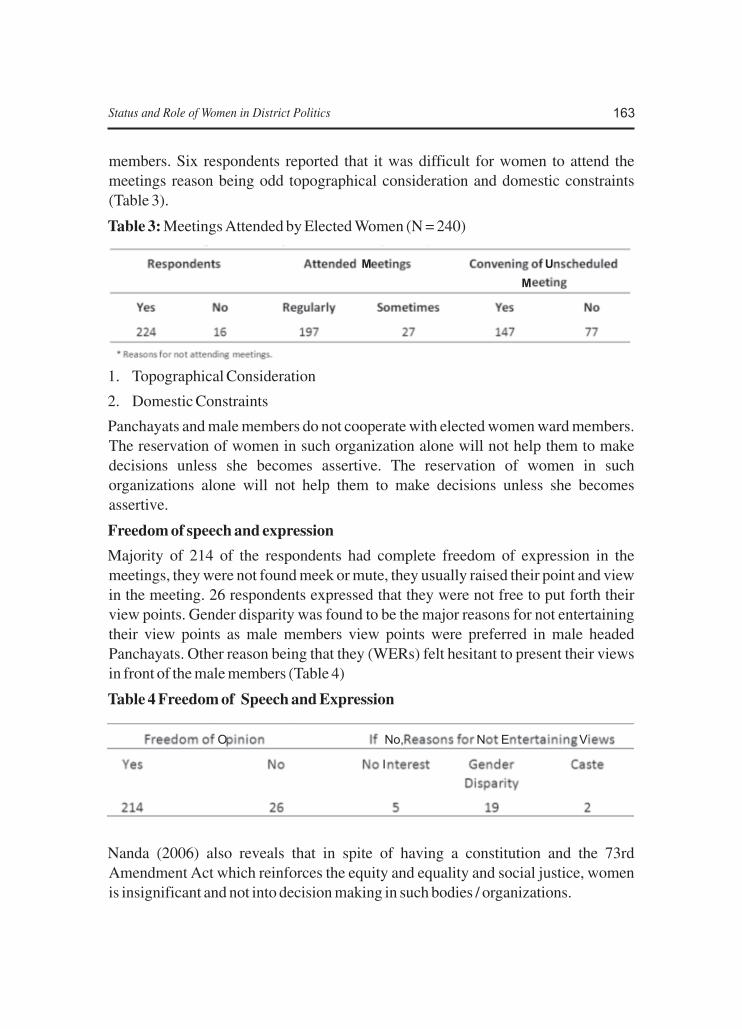
163Status and Role of Women in District Politics
members. Six respondents reported that it was difficult for women to attend the meetings reason being odd topographical consideration and domestic constraints (Table 3).
Table 3: Meetings Attended by Elected Women (N = 240)
1. Topographical Consideration
2. Domestic Constraints
Panchayats and male members do not cooperate with elected women ward members. The reservation of women in such organization alone will not help them to make decisions unless she becomes assertive. The reservation of women in such organizations alone will not help them to make decisions unless she becomes assertive.
Freedom of speech and expression
Majority of 214 of the respondents had complete freedom of expression in the meetings, they were not found meek or mute, they usually raised their point and view in the meeting. 26 respondents expressed that they were not free to put forth their view points. Gender disparity was found to be the major reasons for not entertaining their view points as male members view points were preferred in male headed Panchayats. Other reason being that they (WERs) felt hesitant to present their views in front of the male members (Table 4)
Table 4 Freedom of Speech and Expression
Nanda (2006) also reveals that in spite of having a constitution and the 73rd Amendment Act which reinforces the equity and equality and social justice, women is insignificant and not into decision making in such bodies / organizations.
M U
M
O No, N E V
I

164 Naresh Yadav
Reaction of WER’s to Non-Cooperation of Panchs
26 respondents who had no freedom of speech in Panchayat meetings gave out the reason of their disinterest in such meetings due to factors like, due to their inability in motivating their colleagues, frustration of not being heard and some of the members keeping away because of non-cooperation.
Table 5 (a) reveals that out of total respondents, WER’s did not find support from their colleagues during Panchayat meeting and while not being supported, they try to motivate them to their best. To of them felt frustrated and four of them remain absent from meetings as they felt useless to attend the meetings, if their views were not taken into considerations.
Table 5 (a) Reaction of WER’s to the Non-Co-operation of Panchs
As also reported by Nambiar (2001) that women were hesitant to attend such meetings because of frustration of not being heard and are only to communicate to the beneficiaries the plan of action of Gram Panchayat.
Problems Faced by WER’s
Problems faced by WERs from their colleagues out of the total respondents 20 stated that they face problems from other panches due to their self-motive: Panchayat members were exclusively guided by their personal interest. Whereas 9 respondents argued non cooperation that they primarily face on the basis of gender discrimination. The women representative thus felt hurt for not having been heard or supported and even if they presented befitting and relevant arguments. 9 respondents even faced abusive language from the male counterparts when they place their views for the development purpose of the areas. Five respondent alone revealed that even the female colleagues for their personal views and differences did not support her (table 5b).
Table 5 (b) Problems Faced by WER’s
Motivating them
Remain Absent from Meeting

165Status and Role of Women in District Politics
Lack of Support from Male Members
Lack of Support from Female Members
Inhibitions in Speaking in Front of Elders
*Showing Multiple Response
Decisions Taken by Women
Majority (140) of the respondents took decisions at their own level in Panchayat meetings as they opined that they are confident enough that decisions taken by them will benefit the people of their village. The reasons for their indifferent behavior in Panchayat meetings was gender decimation and male domination. 32 WERs stated that only male members held the right to take decisions on their own. Due to this, right to take decisions on their own. Due to this, 33 respondents opined that they never wanted to attend Panchayat meetings. The 18 respondent were of the view that they usually stand unaware about the agenda, thus could not comment on any deliberation. Another respondent felt hesitant to participate in the discussions in presence of male members present in the meetings, partly because they lacked confidence. (Table 6).
Table 6: Decisions taken by women (N = 240)
Stumbling Blocks in Family
Out of faced 240 respondents, 78 faced constraints from the family. 16 faced family interferences. 03 respondents believed that the family had no progressive social standing in the community, the families were, still taboo ridden and victims of ignorance and guided by old traditions. Four of the respondents stated that family members do not help them in household chores so household chores act as constraint in their work. Wherever women take up Panchayat works and role seriously, some oversight in family responsibilities will only be inevitable simply because they will not be able to devote the same amount of time and energy compared to when they were not Panchayat members. Respondent faced constraints like family interference in their work, still another respondent faced lack of support by family that is family did not support them economically. On the whole it may be concluded that the panches were between the fire and the frying pan. Neither the government gave them
If No, Reasons
C
C A
A
A
M

166 Naresh Yadav
any dole or incentive to inspire their importance and position in the family nor were the panches themselves on their own of any assistance to the family in the performance of its daily chores of the life. Hence indifference from the family.
Table 7: Constraints Faced by WER’s From Family (N = 240)
Majority of women leaders admitted that their husbands, discouraged them attending the meetings or hindered their activities. In most cases, it is the husband who made the decisions for Panchayat and the wives put their signature or thumb impressions on the official documents.
Problems Faced by WER’s While Dealing With the Administration
Majority of the WERs (208) revealed that they received support from government and administration whereas 30 WERs did not receive support from the administration reason being the male domination of the administration who were either discourteous, or corrupt showing utter disregard on gender basis morally, materially which also at times resulted in complete and total disassociation with the administration (Table 8)
Table 8 : Problems Faced by WER’s While Dealing With the Administration (N= 240)
Changes Required in Family and Community
An average number (84) of respondents wanted economic support from the administration so that they could perform better developmental activities in their villages. 88 respondents required help from family members to perform family chores, 80 for the respondents mentioned that they want liberal outlook from the family and community so that she can prove their mettle in the Politics

167Status and Role of Women in District Politics
Table 9: Changes Required in Family and Community (N= 240)
Performance for Better Leadership
Majority (158) of the respondents wanted freedom fro family and community which would make them to perform as better leaders. Further 56 respondents felt that ability to speak would serve as an asset for convening public and invoke their confidence and moral support. 60 respondents preferred literacy, self confidence and skill training for performance as an efficient leader for welfare and development of the people. 30 respondents believe that experience, self decision making power and honorium would strengthen their leadership qualities. 70 respondents preferred self initiative and organizing capacity for income generation. Thus, the survey of this study would make one conclude that it is somewhat not fair to expect the women to make wonders when she is as a first timer asked to representative her constituency.
Table 10: Performance for Better Leadership (N= 240)
History reveals the fact that the primitive Indian society never encouraged the women to come out of her domestic shell and play a role with her counterpart, the man. She was always a domesticated tool in the hand of the male patriarch, it is this imperative that she needs a thorough helping programmes that would provide her
1. Freedom from Restriction by Family
2. Freedom from Restriction by Community
3. Economic Support from Government
4. Help in Household by Family, Members
5. Liberal Outlook
*Multiple Responses

168 Naresh Yadav
education and confidence building initiatives which could chisel her participation of activities required for becoming representative of people in one form or the other (Table 10).
Factors that Motivate Women to Take Part in Politics
Out of total respondents 143 and 71 reported that economic independence family encouragement, transparency in PRIs and administration, support from government officials would go long way in motivating the women folk to participate in panchayat 38 respondents revealed that their dedication and commitment play an important and positive role for joining politics (Table 11)
Table 11: Factors that Motivate Women to Take Part in Politics
Concluding Remarks
In Indian constitution, there are provisions for equal rights for all citizens irrespective of their social and economic status. However, such provisions exist only in pen and paper for millions of economically and socially-disadvantaged people in India especially SC’s, ST’s and women. In India, women are in much worst position than men not only in terms of sex ratio, literacy rate, work force participation, life expectancy, but also in terms of their access to power structure which controls and guides the development programmes of a society. Since access to political opportunities and participation in political decision making process are important components of capability and autonomy, discrimination in this respect leads to wastage of women’s talent and efficiency which are necessary for all around development of the country. One of the three variables used in the construction of the Gender Empowerment Index (GEM) is the relative share of women in administrative and managerial position (UNDP 1995). Women need to be involved in decision-making process in order to bring their demands in the national agenda. In order to ensure empowerment of women in political arena, the issue of reservations of 1/3rd of the seats for women at grass root levels of the organizations was taken up by different women’s organizations and social thinkers.
The role of women in district politics, the political decision making process has been

169Status and Role of Women in District Politics
examined critically on the basis of data collection by interviewing the WER’s of three districts of Rajasthan viz. Alwar, Bharatpur and Jaipur. The present study which analyses roles and status of women in district politics Institutions is a study conducted to know the extent of women’s participation in decision making and stumbling blocks for women in their respective roles.
The study shows that the significant number of women in politics attended meeting regularly but few members have full freedom of speech and expression in the meeting and they usually raise their points. Some respondents mentioned that their views were not considered. The major reason being patriarchal set up and thereby non co-operation. As a reaction, the respondents got frustrated and choose to abstain from the further meetings. However, a fraction of members from within the Panchayats thought of overcoming the awareness of the situation by organizing themselves to attend meetings as usual to face and challenge the somewhat a critical face. They build confidence among themselves to establish their self entity. A minimal number of the women in politics revealed that they no doubt received support from the government officials and administration. Whereas a majority held the opposite view reason being that the male members for the women and they were not in any way prepared to reconcile with either a superior or even an equal position for their women members. However, it is gratifying to observe that womenrepresentatives ignored the non co-operative behavior of their colleagues and pushed further their own efforts to resolve the problems of the area. The data indicates how the panch members feel about increasing and accelerating the efficiency of working in the Panchayats. They feel that there should be practically no interference from the family and community stalling the independent functioning of the women members. The women members complained that they get no assistance and help from family members in the discharge of their domestic work. A majority of the respondents revealed that financial assistance is a necessary ingredient for their self esteem, their independent functioning and their committed concern and approach to the needs and urges of the people of the area.
In conclusion, it may be considered that to achieve the women empowerment, advancement can be facilitated with the co-ordination of different sections of the society such as male gentry, religious heads, political leaders who should come forward and shum their interpersonal interest even ego to understand and appreciate that the women are equally as important segments of society as men. Male chauvinism must go the sooner so much the better. Unless the male ridden society is transformed and replaced by a better socio-economic set up replaced by a better socio-economic set up where men and women are equal co-workers, the future of human set up appears to be bleak.

170 Naresh Yadav
References
Ambedkar, SN; 2000.New Panchayati Raj at Work. Jaipur: ABD Publishers.
Bhaskar K 1997. Womne Panchayat Members in Kerala:
Chandrashekhar, A 1991.Profile and Participation of Women ZilaParishad and Mandal Members. Journal of Rural Development, 19)6): 15-23.
Das C 1999. Indian Women: Work, Power and Status.
Kumatakar K 1998. Governance and Representation: A Study of Women and Local Self Government. Indian Journal of Public Administration, XIIX(3). Retrieved on 15th March 2007 http://www.indianngo.com
Mukhopadhyay A, 1995.Kultikri be West Bengal only all Women Gram Panchayat. Economic and Political Weekly, 128(4): 17-25.
Palanithuri, G, 2001. Empowering People for Prosperity: A Study of New Panchayati Raj system, New Delhi: Kanishka Publishers.
Pnada S 1997. Political Empowerment of Women. The Case of Orissa, Journal of Rural Development, 22 (4): 665-667.
Form 4 (See Rule-8)
Place of Publication : Ghaziabad, U.P. India
Periodicity : Bi-annual
Printer's Name : Anuj K. Goel
Nationality : Indian
Address : Om Graphic & PrinterKH-70, Kavi Nagar, Ghaziabad
Editor's Name : Dr. B.S. Yadav
Nationality : Indian
Address : H. No. 363, Nitikhand-IIIIndrapuram, Ghaziabad, U.P.
Declaration
I, Dr. B. S. Yadav, hereby declare that the particulars given above are true to the best of my knowedge and belief.
B.S. Yadav

Note to Contributors:
Unpublished original Papers/articles/book reviews from various fields of Social Sciences - Economics, Sociology, Geography, Political Science, History, Psychology, Management and Education are invited for publication in "The Horizon : A Journal of Social Sciences", a half-yearly publication f the "Shodh evam Shaikshnik Samiti (regd.)." The manuscript, complete with footnotes/references as necessary, typed in 1.5 space, Times New Roman or Arial font on A4/Letter paper format in MS-WORD or Adobe Page Maker may be sent to the Managing Editor both in hard and soft copies. The manuscript may also be submitted online to the E-mail address : [email protected] & [email protected]. The submission manuscript will held to imply that the work of the author is original and is not being sent for publication elsewhere.
Published by Dr. B S Yadav for Shodh evam Shaikshnik Samiti, Meerut, UP, India, registered at Meerut vide registration no. 868/2008-09 and printed at
M/s Om Graphic & Printer, Ghaziabad, U.P. India.
Single issue 500/- Editor-in-Chief : Dr. B S Yadav
Please address your correspondence to:
Editor-in-Chief:
Dr. B.S. YadavAssociate Professor & Head (Retd.)
Deptt. of Economics
D.N.PG. College, Gulaothi (Bulandshahr) U.P.
The Horizon - A Journal of Social Sciences
House No.-363, Niti Khand - III, Indrapuram,
Ghaziabad (U.P.), India
Contact : 09412471964, 09818465104
E-mail : [email protected]
Dr. Humayun MasoodCo-Editor
Contact : 09412657673

