a just and affordable transition towards a net zero
TRANSCRIPT

Directorate General of ElectricityMinistry of Energy and Mineral Resources Republic of Indonesia
Jakarta, July 22, 2021
A Just and Affordable Transition Towards a Net Zero Indonesia in Electricity Sector
Rida MulyanaDirector General of Electricity
Ministry Energy and Mineral Resources
1

CONTENTS
ELECTRICITY POLICYI
CLIMATE CHANGE COMMITMENTII
ENERGY TRANSITION TOWARD NET ZERO EMISSIONIII
2
3
9
14

ELECTRICITY POLICYI
3
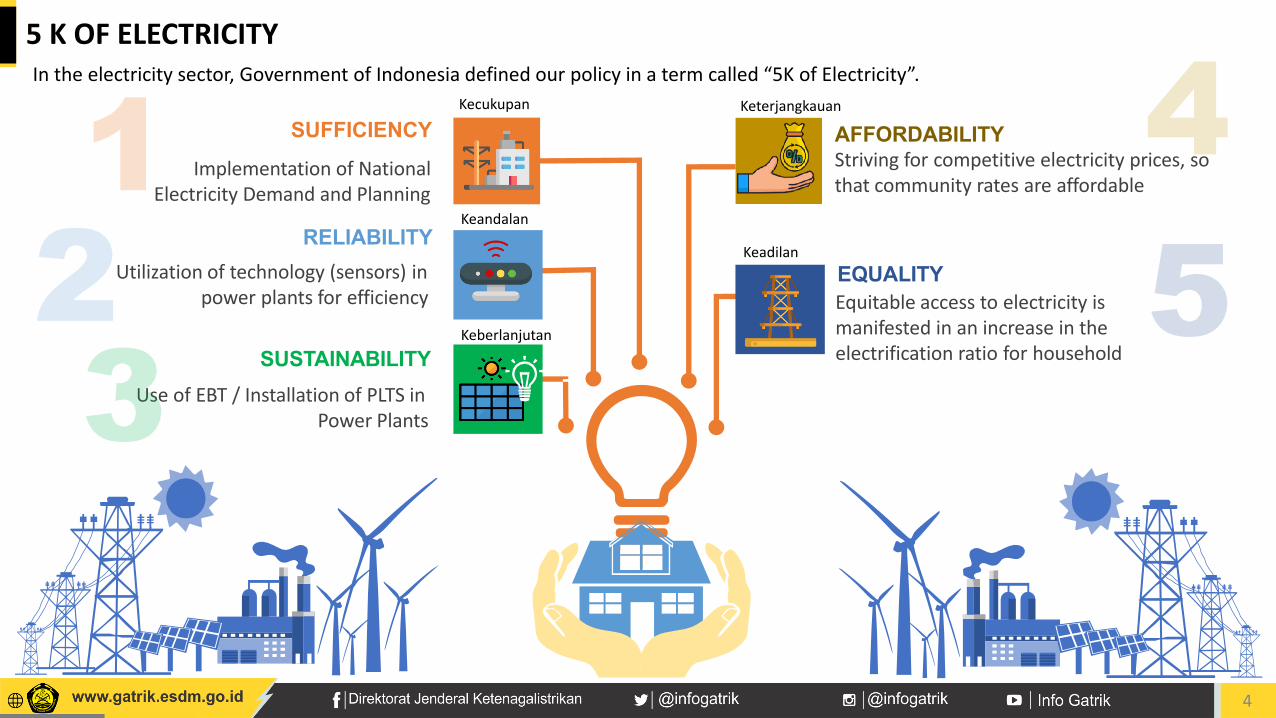
5 K OF ELECTRICITY
SUFFICIENCYImplementation of National
Electricity Demand and Planning
RELIABILITYUtilization of technology (sensors) in
power plants for efficiency
SUSTAINABILITYUse of EBT / Installation of PLTS in
Power Plants
AFFORDABILITYStriving for competitive electricity prices, so that community rates are affordable
EQUALITYEquitable access to electricity is manifested in an increase in the electrification ratio for household
In the electricity sector, Government of Indonesia defined our policy in a term called “5K of Electricity”. Kecukupan
Keandalan
Keberlanjutan
Keterjangkauan
Keadilan
4

5
POLICY DIRECTION FOR ELECTRICITY SUPPLY DEVELOPMENT
Source: National Electricity Master Plan 2019 - 2038
• Minimum share of RE 23% by 2025.
• Diesel generation is only for emergency and temporary power supplies such as crisis areas.
• GTPP/CC/GE/CCGE platform.• CFPP uses Clean Coal
Technology (CCT).• Utilization of local primary
energy sources.• The use of nuclear energy is
in line with National Energy Policy (KEN).
• Dispatching electricity to business and industrial centers (Special Economic Zones, Tourism and Industrial Zones).
• HVDC transmission for long distance power evacuation (point to point / inter-island).
• Expansion of access to electricity in remote and scattered areas.
• In 2020 smart grids is began to be implemented in Java-Bali.
GENERATION TRANSMISSION
• At least 1 substation for each district/city.
• The addition transformer of the substation if the load capacity of transformer has reached about 70%.
• Development of Gas Insulated Switchgear (GIS) for limited land.
• Reducing losses and rehabilitation of old network.
SUBSTATION RURAL ELECTRICITY AND SMART GRID
AFFORDABLE PRICEGOOD QUALITYSUFFICIENT
RpGUARANTEE
THE AVAILABILITY OF ELECTRICITY
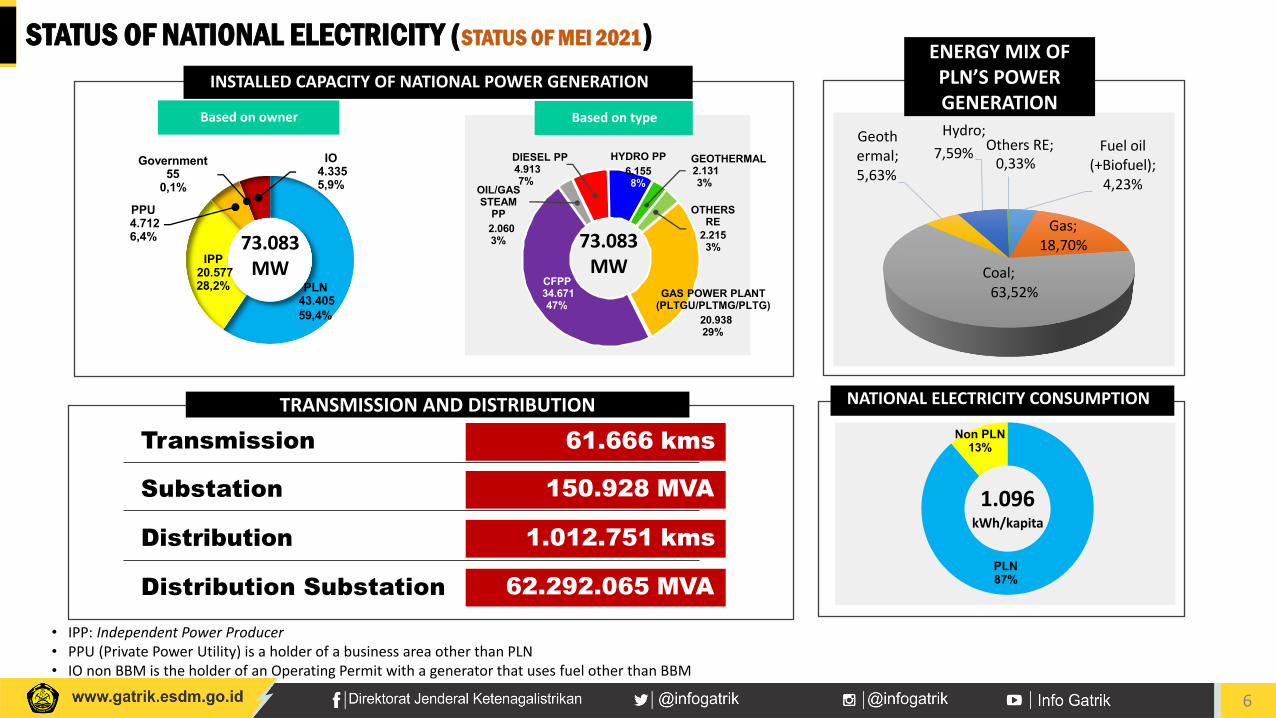
STATUS OF NATIONAL ELECTRICITY (STATUS OF MEI 2021)
Based on typeBased on owner
61.666 kmsTransmission
150.928 MVASubstation
62.292.065 MVADistribution Substation
1.012.751 kmsDistribution
TRANSMISSION AND DISTRIBUTION
INSTALLED CAPACITY OF NATIONAL POWER GENERATION
GAS POWER PLANT (PLTGU/PLTMG/PLTG)
20.93829%
CFPP34.67147%
OIL/GAS STEAM
PP2.0603%
DIESEL PP4.9137%
HYDRO PP6.1558%
GEOTHERMAL2.1313%
OTHERS RE
2.2153%
PLN43.40559,4%
Government55
0,1%
PPU 4.7126,4%
IPP 20.57728,2%
IO 4.3355,9%
73.083MW
NATIONAL ELECTRICITY CONSUMPTION
Non PLN 13%
1.096kWh/kapita
PLN 87%
73.083MW
Fuel oil(+Biofuel);
4,23%
Gas; 18,70%
Coal; 63,52%
Geothermal;5,63%
Hydro;7,59% Others RE;
0,33%
ENERGY MIXENERGY MIX OF PLN’S POWER GENERATION
• IPP: Independent Power Producer• PPU (Private Power Utility) is a holder of a business area other than PLN• IO non BBM is the holder of an Operating Permit with a generator that uses fuel other than BBM
6

Kaltim99%
100%
Sulut99%
100%
Aceh99%
100%Sumut
99%100%
Babel99%
100%
Bengkulu99%
100%Sumsel
99%100%
Banten99%100%
Jabar99%100% Yogyakarta
99%100%
Jakarta99%
100%Jateng
99%100%
Bali100%100%
Jatim99%
100%NTT88%
100%
Pabar99%
96,19% (70 Desa)
Maluku92%100%
Malut99%
100%
Sultra98%
100%
Sulsel99%100%
Sulbar99%
100%
Gorontalo99%100%
Sulteng99%
100%
Papua95%
95,00% (276 Desa)
Kalbar99%
100%
Kalsel99%
100%
Kalteng96%
100%
Kaltara99%
100%
NTB99%
100%
Sumbar99%
100%
Jambi99%
100%
Kepri99%
100%Riau99%
100%
Lampung99%
100%
December 202099,20%99,56%
March 202199,28%99,59%
RE
RD Household not yet electrified : 542.124 RT Villages not yet electrified : 346 villages
HOUSEHOLD (RE) AND RURAL AREAS (RD) ELECTRIFICATION RATIO
Komposisi RE (%) RD (%)
Electrified by PLN 97,04 90,01
Electrified by Non PLN 1,76 5,90
Electrified by LTSHE 0,48 3,68
Not yet electrified 0,72 0,41
7

CHALLENGES IN THE ELECTRICITY UTILITY SECTOR
Energy Transition Plan And Roadmap Implementation To Achieve Net Zero Emission 2060
High Penetration & Integration Of Variable Renewable Energy
Grid Modernization Through Smart Grid Implementation & Distributed Energy Resource Implementation
Market Development & Investment In The Renewable Energy, Grid Modernization And Electric Mobility Transformation Through Electric Vehicle
Su Subsidy Realocation
8

CLIMATE CHANGE COMMITMENTII
9
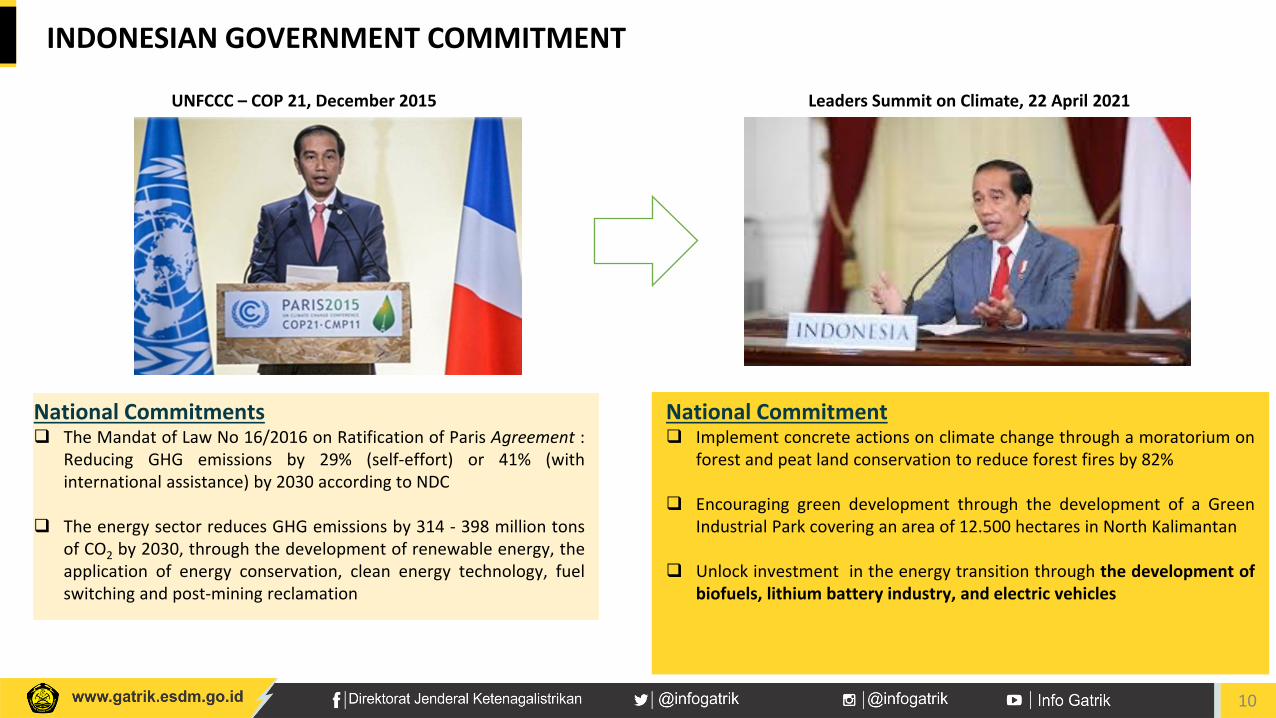
National Commitments The Mandat of Law No 16/2016 on Ratification of Paris Agreement :
Reducing GHG emissions by 29% (self-effort) or 41% (withinternational assistance) by 2030 according to NDC
The energy sector reduces GHG emissions by 314 - 398 million tonsof CO2 by 2030, through the development of renewable energy, theapplication of energy conservation, clean energy technology, fuelswitching and post-mining reclamation
UNFCCC – COP 21, December 2015
INDONESIAN GOVERNMENT COMMITMENT
Leaders Summit on Climate, 22 April 2021
National Commitment Implement concrete actions on climate change through a moratorium on
forest and peat land conservation to reduce forest fires by 82%
Encouraging green development through the development of a GreenIndustrial Park covering an area of 12.500 hectares in North Kalimantan
Unlock investment in the energy transition through the development ofbiofuels, lithium battery industry, and electric vehicles
10

Indonesia’s Nationally Determined Contribution (NDC) Target
No Sector GHG Emission 2010 (Million Ton CO2e)
GHG Emission in 2030(Million Ton CO2e)
Reduction (Million Ton CO2e)
BaU CM1 CM2 CM1 CM2
1 Energy 453.2 1,669 1,335 1,271 314 398
2 Waste 88 296 285 270 11 26
3 IPPU 36 69.6 66.85 66.35 2.75 3.25
4 Agriculture 110.5 119.66 110.39 115.86 9 4
5 Forest 647 714 217 64 497 650
Total 1,334 2,869 2,034 1,787 834 1,081
Mitigation Target of reduction (Million Ton CO2e)
Renewable energy 170.42Energy efficiency 96.33Clean power 31.80Fuel switching 10.02Post miningreclamation
5.46
Total 314.03
11

CO2 EMISSION REDUCTION IN ELECTRICITY SECTOR 2021
0
2
4
6
8
10
12
2020 2021 2022 2023 2024
4,71 4,925,36
5,91 6,07
8,78
10,37
mill
ion
ton
CO2
Target*
Realization
year**
Notes* Mitigation target for GHG emission reduction based on the Strategic Planning of the Directorate General of
Electricity 2020-2024**GHG mitigation realization is calculated for the previous one year
Clean Coal Technology in Coal Power Plant
3.368.736,64 tonCO2
Newly Constructed Gas Power Plant
5.943.814,93 tonCO2
Conversion from Single Cycle to Combined Cycle
49.125,36 tonCO2
Hydro Power Plant
32.929,08 tonCO2
Mini/Micro Hydro Power Plant
874.711,67 tonCO2
Solar Power Plant
106.703,94 tonCO2
GHG Mitigation in 2021
Mitigation Actions
Emission Reduction
12
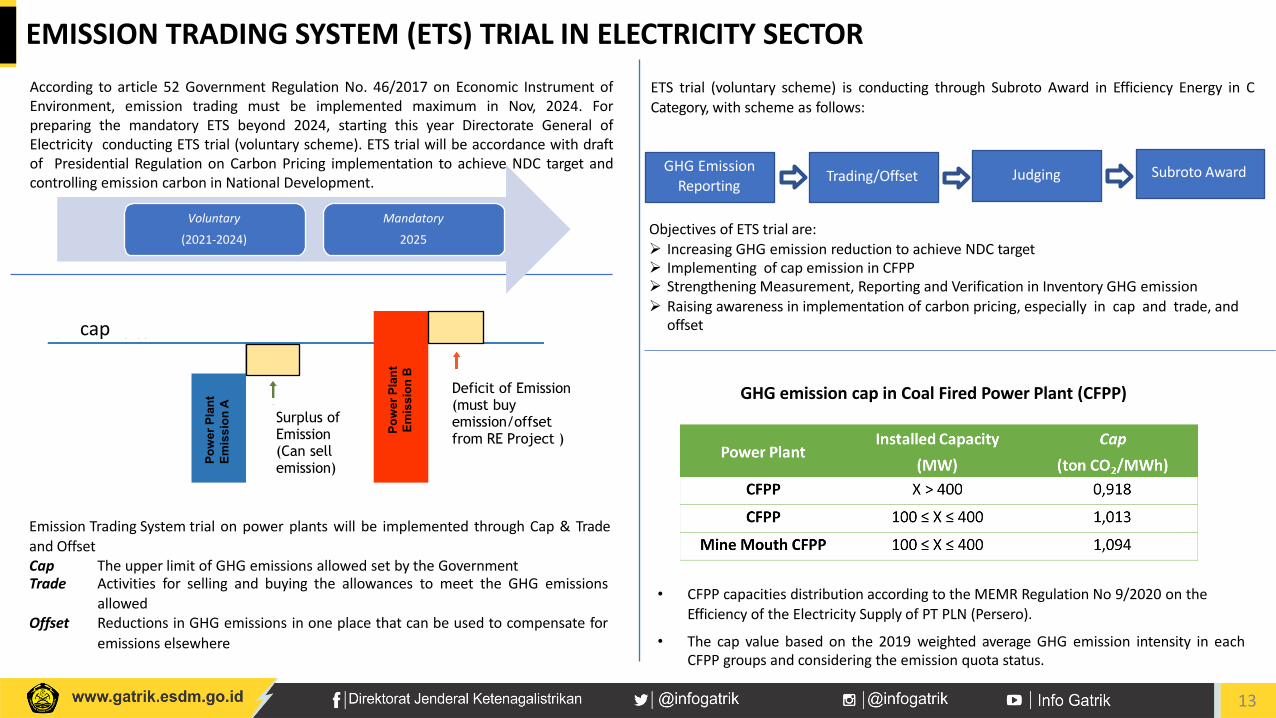
EMISSION TRADING SYSTEM (ETS) TRIAL IN ELECTRICITY SECTOR
Surplus of Emission (Can sell emission)
Deficit of Emission (must buy emission/offset from RE Project )
Pow
erPl
ant
Emis
sion
A
Pow
erPl
ant
Emis
sion
B
Emission Trading System trial on power plants will be implemented through Cap & Trade and OffsetCap The upper limit of GHG emissions allowed set by the GovernmentTrade Activities for selling and buying the allowances to meet the GHG emissions
allowedOffset Reductions in GHG emissions in one place that can be used to compensate for
emissions elsewhere
According to article 52 Government Regulation No. 46/2017 on Economic Instrument ofEnvironment, emission trading must be implemented maximum in Nov, 2024. Forpreparing the mandatory ETS beyond 2024, starting this year Directorate General ofElectricity conducting ETS trial (voluntary scheme). ETS trial will be accordance with draftof Presidential Regulation on Carbon Pricing implementation to achieve NDC target andcontrolling emission carbon in National Development.
Voluntary
(2021-2024)
Mandatory
2025
ETS trial (voluntary scheme) is conducting through Subroto Award in Efficiency Energy in C Category, with scheme as follows:
Objectives of ETS trial are: Increasing GHG emission reduction to achieve NDC target Implementing of cap emission in CFPP Strengthening Measurement, Reporting and Verification in Inventory GHG emission Raising awareness in implementation of carbon pricing, especially in cap and trade, and
offset
GHG Emission Reporting Trading/Offset Judging Subroto Award
GHG emission cap in Coal Fired Power Plant (CFPP)
• CFPP capacities distribution according to the MEMR Regulation No 9/2020 on the Efficiency of the Electricity Supply of PT PLN (Persero).
• The cap value based on the 2019 weighted average GHG emission intensity in each CFPP groups and considering the emission quota status.
cap
13

ENERGY TRANSITION TOWARD NET ZERO EMISSIONIII
14

NET ZERO EMISSION PARAMETER
03
04
0102
Implementing Hydrogen Fuel Cell
Utilization of energy storage effectively in the next 5 –10 years
Electricity production in 2060 is 1.887 TWh
Phasing-out CFPP gradually based on PPA
05 Implementing Nuclear Power Plants
15

ENERGY TRANSITION TOWARDS NET ZERO EMISSION
Fossil Fuel
Renewable Energy
Fossil Fuel
Clean Technology
(CCT, CCUS) + Net Sink
NRE Acceleration:- Primary Energy Substitution (Biofuels,
Cofiring, RDF/SRF)- Fossil Energy Conversion.- Additional Capacity of NRE Power Plant, focus
on Solar PV.o Hydro (incl. pumped storage)o Wind (on-shore and off-shore)o Biomass & Wasteo Geothermal (Gov’t Drilling, small-scale)o Ocean Energy
- Non-Electricity / Non-Biofuels (Briquette, Biogas, CBG).
- Electric Vehicle
- Nuclear (incl. SMR’s)
- Battery- Hydrogen
Green Energy
Smart Energy, Smart Grid, Energy Conservation
Availability, Accessibility, Affordability,
Sustainability & Competitiveness
Energy Independence
Energy Security
Sustainable Development
Low Carbon & Climate Resilience
16

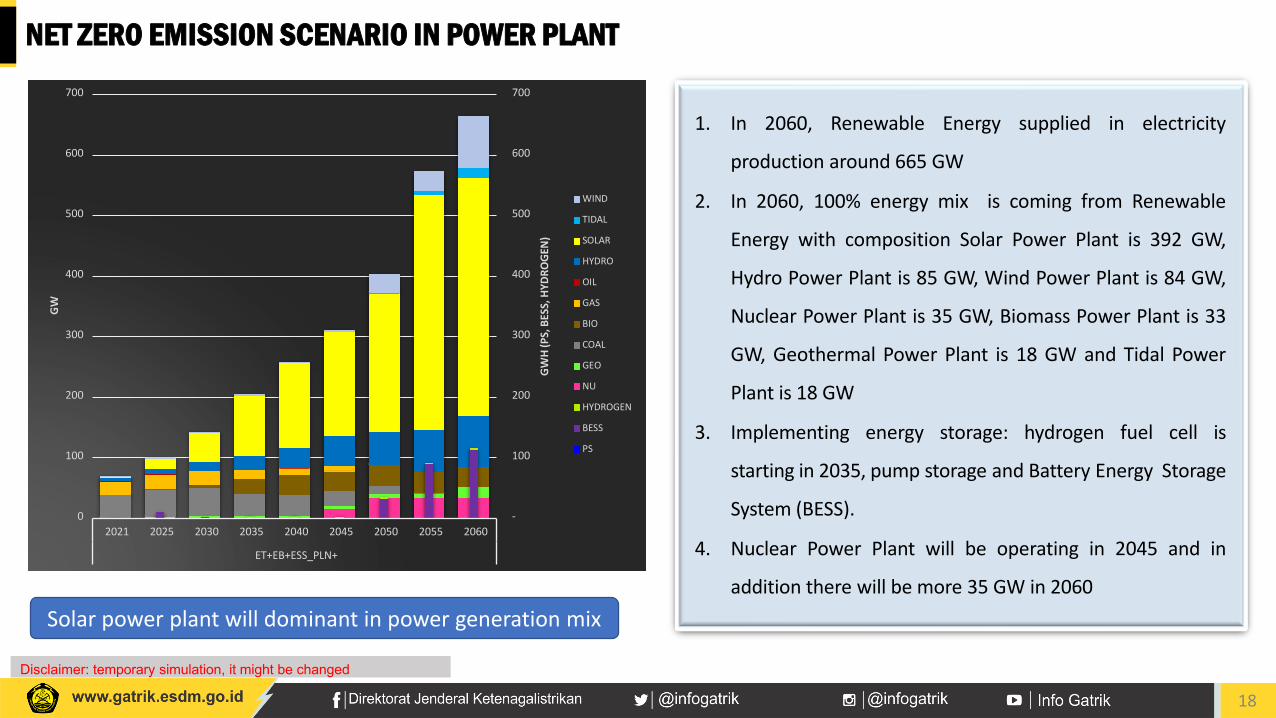
NET ZERO EMISSION SCENARIO IN POWER PLANT
COAL NE RE VRE GAS OIL2021 83% 0% 11% 0% 4% 1%2025 75% 0% 15% 6% 4% 0%2030 62% 0% 22% 14% 2% 0%2035 41% 0% 34% 23% 2% 0%2040 34% 0% 39% 27% 1% 0%2045 20% 13% 38% 28% 0% 0%2050 9% 22% 32% 37% 0% 0%2055 1% 17% 37% 44% 0% 0%2060 0% 14% 40% 45% 0% 0%
By 2060, energy mix inpower generation iscoming from clean energy
1. Electricity production in 2060 will be 1,887 TWh
2. By now, electricity production is 300 TWh and 120 TWh in
addition from 35 GW program, so there will be 1,380 TWh
electricity production from Renewable Energy
3. There is no additional Coal Fired Power Plant development plan
except currently under contract or construction (as seen on
chart, CFPP will be decreased – gray color)
4. No additional fossil fuel power plant after 2030 and significantly
decreasing by 2040 following the PPA period is over
5. CFPP and Combined Cycle Power Plant will be retired
accordingly to the operating period, where the last CFPP was
retired in 2058 while the last Combined Cycle was retired in
2054, and replacing with Renewable Energy power plants
6. Number of Renewable Energy power plants will be increasing
Disclaimer: temporary simulation, it might be changed
17
Disclaimer: temporary simulation, it might be changed
-
100
200
300
400
500
600
700
0
100
200
300
400
500
600
700
2021 2025 2030 2035 2040 2045 2050 2055 2060
ET+EB+ESS_PLN+G
WH
(PS,
BESS
,HYD
ROG
EN)
GW
WIND
TIDAL
SOLAR
HYDRO
OIL
GAS
BIO
COAL
GEO
NU
HYDROGEN
BESS
PS
1. In 2060, Renewable Energy supplied in electricity
production around 665 GW
2. In 2060, 100% energy mix is coming from Renewable
Energy with composition Solar Power Plant is 392 GW,
Hydro Power Plant is 85 GW, Wind Power Plant is 84 GW,
Nuclear Power Plant is 35 GW, Biomass Power Plant is 33
GW, Geothermal Power Plant is 18 GW and Tidal Power
Plant is 18 GW
3. Implementing energy storage: hydrogen fuel cell is
starting in 2035, pump storage and Battery Energy Storage
System (BESS).
4. Nuclear Power Plant will be operating in 2045 and in
addition there will be more 35 GW in 2060
NET ZERO EMISSION SCENARIO IN POWER PLANT
Solar power plant will dominant in power generation mix
18

NET ZERO EMISSION SCENARIO IN POWER PLANT
0
50
100
150
200
250
300
350
2021
2022
2023
2024
2025
2026
2027
2028
2029
2030
2031
2032
2033
2034
2035
2036
2037
2038
2039
2040
2041
2042
2043
2044
2045
2046
2047
2048
2049
2050
2051
2052
2053
2054
2055
2056
2057
2058
2059
2060
ET+EB+ESS_PLN+
JUTA
TON
OIL
GAS
COAL
BIO
Disclaimer: temporary simulation, it might be changed
1. In 2021, greenhouse gas (GHG) emission from
power plants is 261 MTCO2e
2. Peaking emission will occur near 2030 with
GHG emission around 322 MTCO2e
3. GHG emission will be decreasing in 2031,
along with retirement of CFPP and Combined
Cycle Power Plant and significantly decrease
in 2040 due to PPA period is over.
4. In 2060, GHG emission from power plant is
approaching zero
19

POLICY AND REGULATORY REFORM TO SUPPORT ENERGY TRANSITION
1. The Addition of Power Plants from Renewable Energy Beyond the Details of The Draft RUPTL PLN2021-2030 can be done;
2. Developing Electricity Infrastructure : Smart Grid;3. Revising the Grid Code;4. Developing The Distributed Generation, Micro-grid and Distributed Storage;5. Introducing Rooftop Solar PV for PLN’s Customers to Encourage Increased of NRE (MEMR
Regulation No. 49/2018 jo. No. 13/2019 jo. No. 16/2019);6. Reviewing and Deregulate: MEMR Regulation No. 50/2017 jo. No. 53/2018 jo. No. 4/2020
(regulation related to the purchase of electricity and the benchmark price of purchasing electricityby PLN);
7. Encourage The Use of Clean Energy in The Special Tourism Area;8. Renewable Energy-Based Economic Development (REBED) and Renewable Energy-Based Industry
Development (REBID);9. Substitution of Primary Energy for Power Generation: Co-Firing Biomass for CFPP and Conversion
DEPP to NRE Power Plant; and10. Grand National Energy Strategy.
20
THANK YOU
13

PROYEK PLTU ON-GOING
-
500
1.000
1.500
2.000
2.500
3.000
3.500
4.000
4.500
5.000
2021 2022 2023 2024 2025 2026 2029
Total 12,3 GW