a lamination micro mixer for µ …thtlab.jp/doc/tanjsme2005.pdfmixing principles such as chaotic...
TRANSCRIPT

JSME Int. J., Ser. C, Vol. 48, No. 4, (2005), pp. 425-435
1
A LAMINATION MICRO MIXER FOR µ-IMMUNOMAGNETIC CELL SORTER
Wei-Heong Tan*,***
Yuji Suzuki*
Nobuhide Kasagi*
Naoki Shikazono*
Katsuko Furukawa*
Takashi Ushida*,**
Key words: Regenerative medicine, Cell Sorter, Micromixer, Magnetic beads, Surface marker, Lamination
*Dept. of Mechanical Engineering, The University of Tokyo, Hongo, Bunkyo-ku, Tokyo 113-8656, Japan
**Center for Disease Biology and Integrative Medicine, The University of Tokyo
***Present address: CIRMM, Institute of Industrial Science, The University of Tokyo, Komaba 4-6-1, Meguro-ku, Tokyo 153-8505, Japan
Phone: +81-3-5452-6650, Fax: +81-3-5452-6649, Email: [email protected]
Int. J. JSME, Ser. C, Vol. 48, No. 4, (2005), pp. 425-435
2
Abstract
We report successful design, fabrication and testing of a novel lamination micro mixer to be integrated in the
micro-scale immunomagnetic cell sorter (µ-IMCS), which should be a key device for clinical applications of
regenerative medicine. This paper covers, (i)the concept of µ-IMCS, (ii)design and fabrication of lamination
mixer using MEMS technologies, (iii)numerical analysis for the evaluation of the mixer performance, and
(iv)experimental evaluation of target cell capturing with the present micro mixer. In order to reduce the
sedimentation loss of the cells and the magnetic beads, the conduits in the mixer are designed in such a way
that the stream is turned over 180 degree. It is found in the CFD analysis that the present lamination mixer
realizes better mixing and lower sedimentation loss than the one without rotation in the previous study.
Experiments reveal that the cell capture rate is (i)increased by up to 8.6 times compared with that in a
straight channel, and (ii)decreased with decreasing the residence time. It is also demonstrated in a
preliminary experiment that CD31 expressions of HUVEC and hMSC obtained with the present micro mixer
are in good agreement with the data obtained with a conventional cell sorting system. Therefore, the present
mixer should be a viable component in a µ-IMCS.

Int. J. JSME, Ser. C, Vol. 48, No. 4, (2005), pp. 425-435
3
1. Introduction
In anticipation of a coming aging society, regenerative medicine, which will replace a lost or damaged
organ or body part with new tissue, attracts much attention. Unlike organ transplants, small quantities of a
patient’s own stem or progenitor cells are collected, cultured, and transplanted back into the patient. It is
believed that regenerative medicine has the potential to heal Parkinson’s disease, broken cartilage, heart
damage, etc. with low risk of rejection.
As stem cells have the ability to proliferate indefinitely while retaining the potential to differentiate
into specialized cell types, they are highly prized for research purposes and possibly for future therapeutic
applications mentioned above. Unfortunately, they occur in minute amounts; for instance, the number density
of human Mesenchymal Stem Cell (hMSC) in bone marrow is only 102 cells/ml, which is 104 times smaller
than that of white blood cells. There exist large-scale cell sorters such as magnetic cell sorter (MCS) and
fluorescence-activated cell sorter (FACS), but they are not suitable for clinical applications due to their
expensive running cost. The final goal of the present study is to develop a micro cell sorting system, which
offers high degree of purification and efficiency as well as safety.
Techniques based on immunological recognition for specific labeling and separations are gaining
importance in recent years(1), (2), (3), where super paramagnetic particles coated with specific antibodies are
employed to isolate target cells. When added to a biological suspension, the beads will bind to the desired
cells due to specific affinity of the ligand on the surface of the beads. The resulting target-bead complex can
subsequently be removed from the suspension using a magnet. Magnetic immunological cell separation fares
excellently compared with other cell sorting methods when evaluated on criteria such as sorting purity and
efficiency.
To date, several groups have reported on micro systems for cell-sorting. Fu et al.(4) fabricated a micro
cell sorting device based on FACS and successfully separated Escherichia coli (E. coli) expressing green
fluorescent protein from a background of nonfluorescent E. coli cells. Takahashi et al.(5) employs real-time
phase-contrast image recognition inside their micro channel in order to distinguish the shape and distribution
of cell component within cells by non-destructive fluorescent staining. Non-target cells are then removed
into a buffer stream through the application of electrostatic force using agarose electrodes. However, the
sorting speed using optical recognition stays at 102 cells/s, which is not suitable for regenerative medicine

Int. J. JSME, Ser. C, Vol. 48, No. 4, (2005), pp. 425-435
4
applications, where the total number of cells to be examined is more than 106.
Figure 1 shows the proposed concept of a µ-IMCS proposed in the present study. Cell sample and
magnetic beads are separately introduced into the device. Magnetic beads have antibody coating, which
binds to a specific surface marker of the target cell. The two streams are completely mixed in the mixer, and
magnetic beads attach onto target cells. Subsequently, cell-beads complexes formed are separated into the
buffer fluid using an external magnetic field. Advantage of using µ-IMCS for cell sorting is two folds. Firstly,
binding of magnetic beads to the target cells can be achieved in seconds, which is orders of magnitudes
shorter than conventional MCS requiring long incubation time. Secondly, unlike FACS(4), we do not need
bulky and expensive optical systems. This also translates to the ease of parallelization of µ-IMCS to handle
large sample volumes typically required for regenerative medicine. Through micro fabrication technology,
miniaturization of the magnetic separation protocol onto a chip will further reap benefits such as reduction of
sample and reagent, and shorter process time. Nevertheless, miniaturization also gives rise to other
challenges such as the problem of mixing.
In microfluidic devices, flow is inherently laminar due to its low Reynolds number, and mixing is
dictated by molecular diffusion process. Diffusion of particles suspended in the flow media is well
characterized with
3difTD ,
dκπµ
= (1)
where κ, T, d and µ are respectively the Boltzman constant, the absolute temperature of the fluid, the particle
diameter, and the viscosity of the fluid. With a simple dimensional analysis, the diffusion time scale, τD, can
be derived as:
2
23D
dif
L d L ,D T
πµτκ
∝ = (2)
where L is the characteristic mixing length (e.g., the channel width). Therefore, the time needed for mixing
based on diffusion is unacceptably long, especially for large d and L. For instance, under the present
experimental condition with L=200µm and d=1µm as described later, τD is 105 s. Therefore, a micromixer
will be required to promote mixing.
Micromixers can be broadly classified into two categories, i.e., passive and active mixers. Passive

Int. J. JSME, Ser. C, Vol. 48, No. 4, (2005), pp. 425-435
5
mixer can achieve mixing without any external energy input except for the streamwise pressure gradient
required to drive the flow. Active mixers, on the other hand, exert external perturbations to stir the fluid in
order to enhance mixing.
To date, there are numerous active mixers that have been proposed. Mixing using electrokinetic
instability(6), differential pressure(7), ultrasonic or piezoelectric actuation(8), (9), (10), magnetic stirrers(11) and
chaotic advection(12), (13), (14) have been reported. In these devices, some form of actuators or moving parts are
employed as stirrers to churn the fluid and parameters such as rotation rate of the stirrers,
amplitude/frequency of vibration of the actuators should be adjusted for different flow conditions to obtain
optimum mixing. However, such moving parts are prone to clogging and mechanical wear and tear.
In passive mixers, channel geometry is designed in such a way that the diffusion length is reduced.
Mixing principles such as chaotic advection(15), (16), hydrodynamic focusing(17) and lamination(18), (19), (20) have
been reported. Unlike active mixers, fabrication process is relatively simple, and complete mixing is possible
for different flow rate with a single channel geometry.
In the present study, we report the successful design, fabrication and testing of a novel lamination
micro mixer to be used in the micro-scale immunomagnetic cell sorter (µ-IMCS), which should be
indispensable in regenerative medicine.
2. Mixer Design
Lamination mixers are also known as Möbius or Split-and-Recombine (SAR) mixers. The basic
approach is to split the flow of two fluid layers perpendicularly to the interface, introduce into two separate
channels, and then reunite them downstream. Theoretically, if the flow is laminar, after passing n mixers in
series, two fluids will be laminated in 2n layers and mixing becomes 4n-1 times faster(18). Whereas an
exponential decrease of lamellae thickness is obtained, the increase in total pressure drop ∆p is linear.
Mixing performance is approximately the same over entire cross-sectional area and lamination is realized in
a wide range of Re. In addition, without any abrupt change in cross-sectional area, bio-molecules in the fluid
is not subjected to large shear stress, thus no damage of cells is expected.
To date, several groups of researchers have proposed lamination mixers. Kim et al.(19) incorporated a
lamination mixer into a DNA purification chip. However, due to the shear forces experienced during splitting

Int. J. JSME, Ser. C, Vol. 48, No. 4, (2005), pp. 425-435
6
and merging, ideal lamination flow pattern is not achieved. Schönfeld et al.(20) designed a near ideal
lamination mixer, in which the shear force was minimized during the splitting and merging. They fabricated
their mixer by assembling two identical plates, structured by precision milling. Their mixer is relatively large
and not suitable for handling minute volumes of reagents and sample. Hardt et al.(21) propose design rules for
ideal implementation of SAR scheme as follows:
(i) Flow splitting is to be performed using a thin layer which slices the main stream into two sub-streams.
(ii) The sub-streams should be independently guided in separate channels.
(iii) During recombination, shear forces between the merging streams have to be avoided.
(iv) In any stage of the SAR operation, channel curvatures should be minimized in order to reduce
unwanted secondary flow effects.
In the preset study, one stream contains cells and the other stream contains magnetic beads. Since
specific density of the magnetic beads is much larger than unity, the sedimentation loss is of major concern.
Therefore, we have devised a novel lamination mixer having 180° rotation of the streams in each mixer unit
in order to minimize the unwanted effect of sedimentation.
Figure 2 shows the 3D geometry of the present mixer unit to achieve lamination with 180° rotation.
Each mixer unit has a length of 700µm and height of 600µm. The channels have a cross-section of 200 x 200
µm. The flow is spilt into two separate streams using a T-junction. Subsequently, the two sub-streams are
individually guided by L-shaped channels downstream to be merged. Again, during the recombination of the
sub-streams, a T-junction (orientated 90° to the first T-junction) is employed. Using this geometry, we can
achieve near ideal lamination. Unlike conventional lamination-type mixer, streams of cells and beads are
turned over after each mixer unit in order to minimize sedimentation loss of cells and beads in the mixer.
This geometry is realized using three separate layers (Fig. 2c). The middle layer is for the T-junction for
flow-splitting, while the top and bottom layers contain the L-shaped channels for guiding the sub-streams.
This anti-symmetrical design ensures that the flow is evenly split and recombined. Corners and stagnation
regions of the mixer are rounded in such a way that stagnant flow regions are reduced. It is theoretically
shown that by combining nine mixer units in series, streams of cells and beads are repeatedly interlaced with
29 =512 layers.

Int. J. JSME, Ser. C, Vol. 48, No. 4, (2005), pp. 425-435
7
3. Numerical Analysis
3.1 Lamination pattern
Figure 3(a) shows the geometry of the present mixer and the grid system used for numerical analysis
with commercial CFD software, FLUENT 6, Fluent Inc.. The number of the grid system is 70x60x60. Steady
state fully-developed velocity field is assumed with a periodic boundary condition at the inlet and the outlet.
For visualization of the lamination pattern, 5000 particles are placed uniformly at the top half of the
inlet at the beginning of the computation. The particles are then tracked, and their positions at the outlet of
each mixer unit are plotted as shown in Fig. 3(b-f). In the present mixer, the lamination pattern is near ideal
since the shear forces during the splitting and merging of the flow is avoided using T-junction. It is also
shown that the lamination pattern undergoes 180° rotation after each mixer unit.
The lamination pattern for the mixer proposed by Kim et al.(19) is shown in Fig. 4(b-f) for comparison.
The computational mesh, consisting of 70x60x20 grids, is shown in Fig. 4(a). Due to shear forces
experienced during splitting and merging, lamination structure is significantly distorted. It is clear that
patches of tracer particles are sparsely distributed even after 9 mixer units. Therefore, in the present mixer,
lamination pattern is more ideal and mixing is more uniform over the entire cross-section.
Since the Reynolds number (Re) remains small in microchannels, the flow is inherently laminar.
However, due to the streamline curvature, the effect of the secondary flow of the Prandtl’s first kind is
increased with Re. In order to examine the effect of Re on lamination, computations for different Re are
made. As shown in Fig. 5, there is no significant secondary flow for Re< 1 and the lamination patterns are
similar. However, when the Re is increased to 10, the secondary flow becomes larger and the lamination
pattern is slightly “twisted”. However, even at this Re, the flow is still effectively laminated and mixing
performance is almost unchanged.
3.2 Sedimentation loss
Since the specific density of magnetic beads is 1.5g/cm3 and larger than unity, the sedimentation loss
in the mixer due to gravity force should be evaluated. For this purpose, Lagrangian tracking of magnetic
beads has been performed using an one-way coupling method(22). Since the particle diameter is as small as
1µm, the Basset and added mass terms can be neglected. After some manipulation, the particle velocity can

Int. J. JSME, Ser. C, Vol. 48, No. 4, (2005), pp. 425-435
8
be obtained as follows:
V = U +τ pFgrav.( )1- e-t / τ p( ), (3)
where U and V are the fluid and particle velocity, respectively, and τp is the particle relaxation time given
by
τ p =ρp
ρ f
d 2
18ν, (4)
where ρp and ρf are the density of the particle and fluid, respectively. In addition, Fgrav is the gravitational
force given by
Fgrav.= 1 -ρ f
ρp
⎛
⎝⎜
⎞
⎠⎟ g . (5)
In the present study, τp for the magnetic beads is in the order of 10-7s, and thus we can approximate the
particle velocity as
V = U +τ p Fgrav. . (6)
The fluid velocity obtained from FLUENT 6 is employed to compute the particle trajectories using Eq. (6).
The time integration has been made by a 4th order Runge-Kutta method, while bilinear interpolation is used
for spatial interpolation.
Similar to the lamination pattern visualization, 5000 equally spaced particles are introduced at the inlet
of the mixer, trajectories of each particle is tracked with Eq. (6). A particle is assumed to have sunk when it
contacts the bottom wall. The percentage of the sedimentation loss is calculated by dividing the number of
sunken particles by the total number of particles introduced at the inlet.
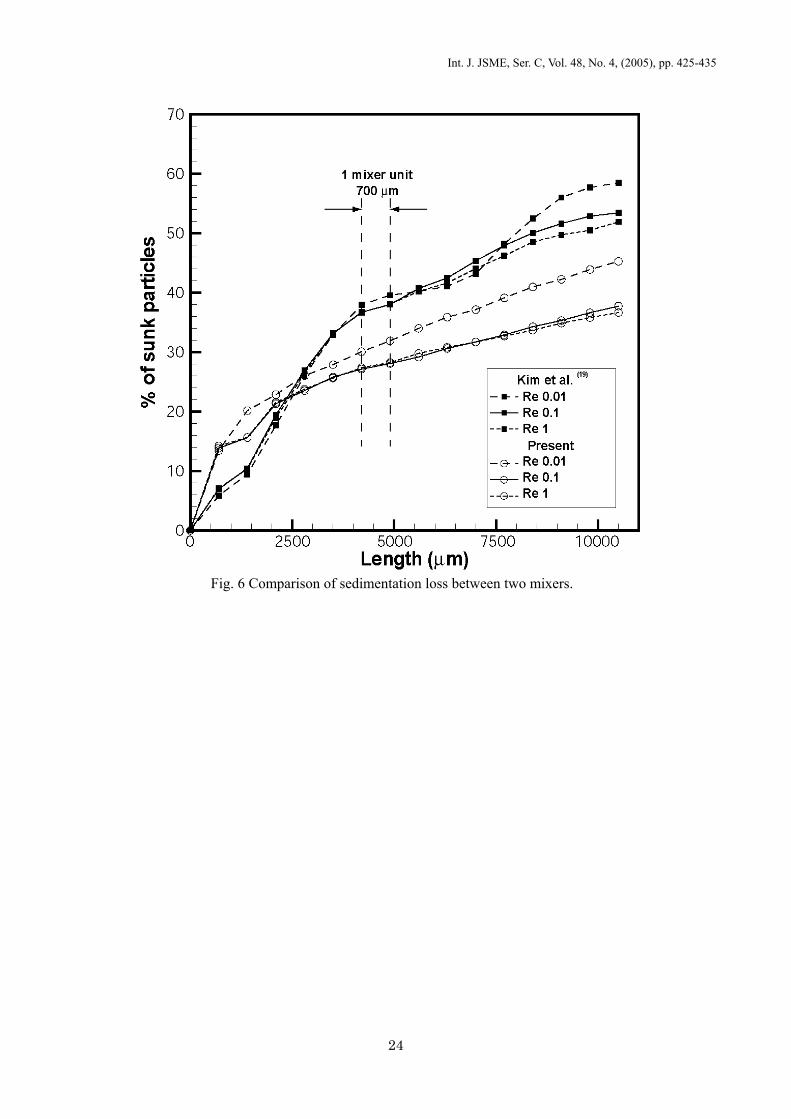
Result of the computation is shown in Fig. 6. Compared with the mixer proposed by Kim et al.(19), the
present mixer has a higher sedimentation loss for the first three mixer units. After the 3rd mixer unit, the rate
of sedimentation decreases and lower sedimentation loss is achieved for all the Re computed. In the first few
mixer units, the particles are still not well distributed in the fluid, and sedimentation loss occurs mainly at the
top/ bottom L-shaped channels. More specifically, when the fluid flows into the L-shaped channels, it is
rotated 90° and the particles that are initially introduced at the top half of the mixer becomes orientated
vertically with respect to the flow. This rotation brings some particles closer to the floor of the mixer,

Int. J. JSME, Ser. C, Vol. 48, No. 4, (2005), pp. 425-435
9
contributing to the higher initial sedimentation loss for the present mixer. Even though the proposed mixer by
Kim et al.(19) has a lower sedimentation loss for small number of mixer units, this does not imply that mixing
between the cells and magnetic beads is better as mixing is minimal in the first few units (see Figs. 3 and 4).
After the initial sedimentation loss, the sedimentation rate decreases for the present mixer. We postulate that
this is due to the ability of the particles to stay suspended for a longer period of time as the direction of
gravitational force with respect to the flow is constantly changing due to the rotation.
Even though cells are not as dense as magnetic beads, the cells used in this study (10-15 µm) are an
order of magnitude larger than the beads (1 µm). The terminal velocity is proportional to the square of
diameter but only linearly proportional to the specific density. Therefore, even though the density of the cells
are very difficult to estimate, we can expect that the problem of sedimentation loss will also occur for cells.
Compared with previous mixer without rotation, the present mixer offers better mixing with lower
sedimentation loss.
4. Materials and Methods
4.1 Device fabrication
Soft lithography(23) using elastomer PDMS (Sylgard® 184 Silicones Elastomer, Dow Corning) was
chosen for micro fabrication technology of the present mixer as it offers advantages such as rapid
prototyping, ease of fabrication and most importantly biocompatibility. In order to establish the mixer
structure, SU-8 molds are made on silicon wafer using standard lithography techniques, and three separate
PDMS layers are cast from SU-8 master molds. SU-8 masters are made from negative photoresist SU-8 100
(MicroChem Corp.) on silicon wafers. SU-8 is spin-coated onto a clean wafer from 0 rpm to 800 rpm for 16s,
followed by 800 rpm to 1050 rpm for a total of 38 s in order to obtain a spin-coated resist thickness of 200
µm. The edge bead is then removed using a razor blade before soft baking at 65°C for 15 minutes and 95°C
for 95 minutes on a leveled hotplate. The wafer is allowed to slowly cool down to room temperature. SU-8 is
then exposed with a transparency mask using a mask aligner (Union Optical, PEM-800) for 70 s to slightly
over-expose the resist. Post exposure bake is done at 65°C for 5 minutes and 35 minutes at 95°C. After the
wafer has cooled down gradually to room temperature, it is developed with SU-8 Developer for about 20
minutes with agitation. It is then rinsed with isopropyl alcohol and then dried with a gentle stream of

Int. J. JSME, Ser. C, Vol. 48, No. 4, (2005), pp. 425-435
10
nitrogen.
The mold is treated with trimethylchlorosilane for 2 minutes before use to prevent adhesion of silicone
rubber. Fabrication process for the PDMS membrane is similar to that described by Jo et al.(24) Briefly, the
prepolymer mixture is poured over the master, and a transparency film is carefully lowered onto the
prepolymer mixture. A piece of Pyrex wafer, followed by a rubber sheet (5 mm thick) is placed over the
transparency film. The whole stack is then clamped between two aluminum plates before being left to cure at
room temperature for a day to avoid any crack of the Pyrex wafer. The PDMS membrane (still attached to
the wafer) is then cured at 65°C for 2 hours in an oven. The top and bottom PDMS slabs are prepared using
the same pre-mixture as the PDMS membrane. In addition, the curing conditions are kept identical for
different layers to keep shrinkage ratio of PDMS layers the same that might contribute to alignment errors.
Before bonding the PDMS layers, the surfaces of PDMS are treated with oxygen plasma (26 Pa, 20W,
20 s) using reactive ion etcher (RIE-10NR, Samco). During the alignment under microscope, a small amount
of methanol is applied between the PDMS layers for preventing the activated surfaces from irreversibly
bonding upon contact. The thin layer of methanol also aids precise alignment as it allows the layers to slide
on each other. The methanol is removed by vacuuming or heating it on a hotplate. Both methods perform the
job equally well, but caution must be taken to proceed slowly to prevent gas bubbles from forming between
the PDMS layers. The alignment accuracy of all the mixer test sections used in the present experiments is ±
20 µm.
4.2 Cell Culture/ Specimen preparation
Human umbilical vein endothelial cells (HUVEC, C2517-A) purchased from Sanko Junyaku Co., Ltd.
are cultured with EGM-2 at 37 °C in a 5% CO2 humidified atmosphere to increase the cell population before
the experiments. For each experiment, the cell concentration used was approximately 1x10⁶ cells/ml.
HUVEC cells are conjugated with biotin by incubating with biotin-labeled anti CD31 antibody. The
suspension is then centrifuged, rinsed to remove the excess antibody and resuspended in phosphate buffered
saline (PBS). Human mesenchymal stem cells (hMSC) cells are purchased from Allcells, LLC (US). Detail
information regarding its properties, thawing and reculturing protocols can be obtained from
http://www.allcells.com. On the other hand, hMSC are dyed with SYTO Fluorescent Nucleic Acid Stain #24

Int. J. JSME, Ser. C, Vol. 48, No. 4, (2005), pp. 425-435
11
(Molecular Probe). Briefly, hMSC is added to the dyeing solution which is prepared by adding 1µl of SYTO
is added to 5ml of HEPES solution. After 20 mins, the cell suspension is centrifuged. The dyeing solution is
removed and the cells are resuspended in PBS. Dynabeads® MyOneTM Streptavidin having 1 µm in diameter
is used as the magnetic beads. The beads are diluted with PBS to the appropriate volume concentration
before the experiments.
4.3 Experimental methods
Figure 7 shows the experimental setup. Magnetic beads and HUVEC cells are separately introduced
into the test-section at a flow rate of 5.9 µl/min, (corresponding to Re=1) using a syringe pump (Harvard
Apparatus, Harvard 22 syringe pump). A separate syringe pump (Ultra Micro Pump+ Micro 4 controller,
WPI) is employed to introduce the buffer fluid.
Two types of cell isolation experiments are conducted to examine the performance of the present
mixer with (i)cell suspension having a single kind of cell, (ii)cell suspension having two different kinds of
cells. In the present paper, positive selection refers to cells that are attached with the magnetic beads and
subsequently isolated by magnetic field, while cells that are left after removal of positive selection are
defined as negative selection.
Concentration of cells before and after the experiment is measured with hemacytometer. The index to
measure the capture rate when beads are mixed with cells is defined as:
Positive Recovery % 100%ve
o
NN+= × , (8)
o ve ve LN N N N+ −= + + , (9)
where No is the original cell concentration, N+ve is the concentration of positive selection, N-ve is the
concentration of negative selection and NL is concentration of cells lost in the process. In addition, an index
of the amount of cell loss is defined as:
Cell Recovery % 100%ve ve
o
N NN
+ −+= × . (10)
4.3.1 Experiments with HUVEC
Test sections incorporated with a magnetic trap (Fig. 8) are fabricated in order to compare mixing

Int. J. JSME, Ser. C, Vol. 48, No. 4, (2005), pp. 425-435
12
performance of the present mixer (Fig. 8a) with that of a straight channel (Fig. 8b). Before the experiment,
the mixer is first filled with PBS to reduce adhesion of cells to channel walls. A permanent magnet is
inserted into the cavity above the magnetic trap to capture beads and cell-bead complexes that flow out of the
test-section (Fig. 8c). The corresponding volume concentration of cells and beads is 0.06% and 0.15%,
respectively. The flow rate of the buffer fluid is 11.8 µl/min. After all the beads and cells have been
introduced into the test section, the pumps are stopped and the tube containing negative selection is replaced
with a new tube. The permanent magnet is then removed and the positive selection flushed out with buffer
fluid (50 µl) at a flow rate of 11.8 µl/min (Fig. 8d).
4.3.2 Target cell isolation from pre-mixed cell suspension
In order to differentiate hMSC from HUVEC, hMSC cells are dyed with SYTO Green Fluorescent
Nucleic Acid Stain, which appears green when viewed through a filter under microscope. In this experiment,
the ratio of the number of HUVEC: hMSC in the pre-mixed cell suspension is chosen as 1:1.24. The
corresponding volume concentration of cells and beads is 0.04% and 0.15%, respectively. The flow rate is
chosen as 11.8 µl/min, which corresponded to Re=1. Test section without magnetic trap is used, and
magnetic particle concentrator is used to isolate cells attached with magnetic beads from the cell sample at
the outlet.
5. Results & Discussion
Results are summarized in Table 1. As expected, in the straight channel, there is little mixing and as a
result, the positive recovery is as low as 3.4 %. On the other hand, using the present mixer, the cell recover is
increased by 8.6 folds and becomes 29.4 %. Cell recovery for both devices is relatively low as we could not
flush out all the cells that have settled in the magnetic trap.
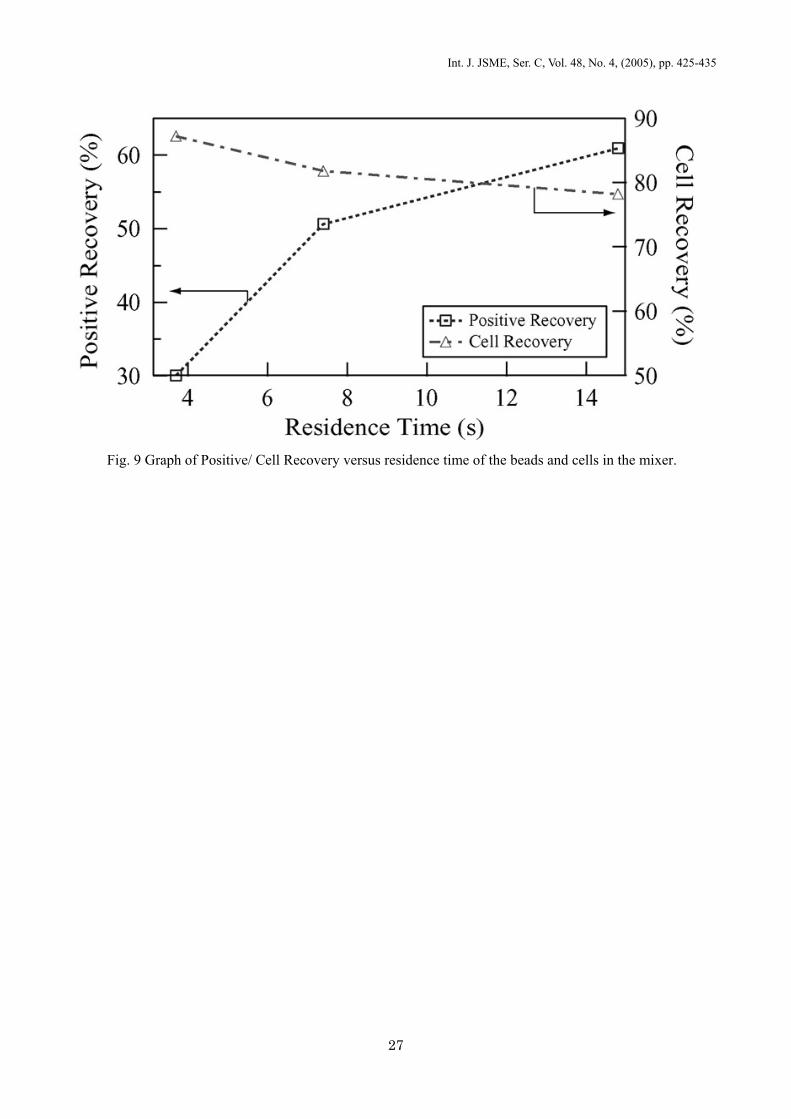
Figure 9 shows the positive recovery, and cell recovery versus the residence time of the beads and cells
in the mixer. In this experiment, the flow rate of the buffer fluid is 23.6 µl/min. Residence time is defined
with the distance from the inlet of the mixer to the magnetic trap (~37.22 mm) and the bulk mean velocity of
the flow. This worked out to a residence time of 14.8 s, 7.4 s and 3.7 s for Re of 0.5, 1 and 2, respectively.
When the residence time is increased, positive recovery increases, i.e., more cells are attached with

Int. J. JSME, Ser. C, Vol. 48, No. 4, (2005), pp. 425-435
13
beads. As the beads and cells flow through the mixer, they are interlaced and dispersed among each other.
Brownian motion causes collisions among beads and cells, and when the streptavidin molecule on the bead
“bump” into the biotin attached to the surface of the cell in the correct orientation, the bead will attach to the
cell. With the increase in residence time, collisions between the beads and cells due to Brownian motion are
also increased. On the other hand, the cell recovery is reduced slightly as the sedimentation loss increases
with the residence time.
Figure 10 shows the schematic of the experiment together with photos of both positive and negative
selection. In the positive selection, HUVEC attached with many magnetic beads isolated by the permanent
magnet can be seen, while hMSC dyed with green fluorescent is shown in the negative selection. Figure
11(a) and (b) respectively show the CD31 expression of HUVEC and hMSC evaluated using a commercial
MCS system. These experiments are conducted with HUVEC and hMSC separately to determine the
proportion of cells that expresses CD31 for HUVEC and hMSC, respectively. It is found that it is as large as
95.5% for HUVEC, while only 4.21% for hMSC. Therefore, CD31 is a good indicator to distinguish between
HUVEC and hMSC. Figures 11(c) and (d) show the results with the present mixer. The percentage of
HUVEC and hMSC in the positive and negative selection is in good agreement with the data shown in Fig.
11(a) and (b). The cell recovery remains 57.3%, but much higher recovery yield should be achieved by
further improvement of the mixer design. The result of this experiment clearly shows the viability of using
this mixer as a component in a µ-IMCS.
6. Conclusions
A novel passive lamination mixer that is suitable for the mixing of magnetic beads and cell is designed,
fabricated and tested. The mixer is fabricated using soft lithography techniques whereby 3 layers of PDMS
replicas are permanently bonded with an alignment error within 20 µm.
Numerical studies using Fluent 6 have confirmed that near ideal lamination is achieved with the
present mixer, and that the lamination pattern undergoes 180° rotation after each mixer unit. The mixing
performance is found to be unchanged for the Reynolds numbers examined. Simulations on sedimentation
loss revealed that the present mixer has lower sedimentation loss compared to previous mixer.
Experiments with biotin conjugated HUVEC cells and streptavidin magnetic beads confirmed that

Int. J. JSME, Ser. C, Vol. 48, No. 4, (2005), pp. 425-435
14
mixing is enhanced and the cell capture rate is increased by up to 8.6 times compared with that in a straight
channel. Higher positive recovery is achieved with the increase in residence time as collisions between the
beads and cells due to Brownian motion are increased, leading to more interaction between cells and beads.
On the other hand, the cell recovery is reduced slightly as the sedimentation loss increases with the residence
time. Using CD31 as an indicator to distinguish between HUVEC and hMSC, a preliminary experiment to
isolate target cells from a pre-mixture of HUVEC and hMSC has been made. The results are in good
agreement with that done using a commercial MCS system, supporting the viability of using this mixer as a
component in a µ-IMCS.
7. Acknowledgments
This work is supported by Grant-in-aid for Scientific Research (S) (No. 15106004) from JSPS.

Int. J. JSME, Ser. C, Vol. 48, No. 4, (2005), pp. 425-435
15
References
(1) Sinclair, B., “To bead or not to bead: applications of magnetic bead technology,” The Scientist, 12,
(1998), No.13.
(2) Fuh, C. B. and Chen, S. Y., “Magnetic split-flow thin fractionation: new technique for separation of
magnetically susceptible particles,” J. Chromatography A, 813, (1998), pp. 313-324.
(3) Hoyos, M., Moore, L. R., McCloskey, K. E., Margel, S., Zuberi, M., Chalmers, J. J., and Zborowski, M.,
“ Study of magnetic particles pulse-injected into an annular SPLITT-like channel inside a quadrupole
magnetic field,” J. Chromatography A, 903, (2000), pp. 99-116.
(4) Fu, A. Y., Spence, C., Scherer A., Arnold, F.H., and Quake, S.R., “A microfabricated
fluorescence-activated cell sorter,” Nature Biotech., 17, (1999), pp. 1109-1111.
(5) Takahashi, K., Hattori, A., Suzuki, I., Ichiki, T., and Yasuda, K., “Non-destructive on-chip cell sorting
system with real-time microscope image processing,” J. Nanobiotechnology, 2:5, (2004).
(6) Oddy, M. H., Santiago, J. G., and Mikkelsen, J. C., “Electrokinetic instability micromixing,” Anal.
Chem., 73, (2001), pp. 5822-5832.
(7) Deshmukh, A. A., Liepmann, D., and Pisano, A. P., “Characterization of a micro-mixing, pumping and
valving system,” Proc. 11th Int. Solid-State Sensors and Actuators (Transducers’ 01), Munich, Germany,
(2001), pp. 950–953.
(8) Yasuda, K. and Ichiki, M., “Non-contact handling of biomaterials in microchamber using ultrasound,”
Proc. 12th Int. Solid-State Sensors and Actuators, Transducers’99, Sendai, Japan, (1999), pp. 128-129.
(9) Yang, Z, Goto, H., Matsumoto, M., and Maeda, R., “Active mixer for microfluidic systems using

Int. J. JSME, Ser. C, Vol. 48, No. 4, (2005), pp. 425-435
16
lead-zirconate-titanate(PZT)-generated ultrasonic vibration,” Electrophoresis, 21, (2000), pp. 116-119.
(10) Yang, Z., Matsumoto, S., Goto, H., Matsumoto, M., and Maeda, R., “Ultrasonic micromixer for
microfluidic systems,” Sensors and Actuators, A, 93, (2001), pp. 266-272.
(11) Lu , L. H., Ryu, K. S., and Liu, C., “A magnetic microstirrer and array for microfluidic mixing,” J.
MEMS, 11, (2002), pp. 462-469.
(12) Lee, Y. K., Deval, J., Tabeling, P., and Ho, C. M., “Chaotic mixing in electrokinetically and pressure
driven micro flows,” Proc. IEEE Int. Conf. MEMS, Interlaken, (2001), pp. 483-486.
(13) Suzuki, H., Kasagi, N., and Ho, C. M., “Chaotic mixing of magnetic beads in micro cell separator,” Proc.
3rd Int. Symp. Turbulence and Shear Flow Phenomena, Sendai, Japan, (2003), pp. 817-822.
(14) Suzuki, H., Ho, C. M., and Kasagi, N., “A chaotic mixer for magnetic bead-based micro cell sorter,” J.
MEMS, 13, (2004), pp. 779-790.
(15) Stroock, A. D., Dertinger S. K. W., Ajdari, A., Mezic, I., Stone H. A., Whitesides G. M., “Chaotic mixer
for microchannels,” Science, 295, (2002), pp. 647-651.
(16) Beebe, D. J., Adr ian, R. J. , Olsena, M. G. , Stremlera, M. A., Aref, H., Jo, B. H., “Passive mixing in
microchannels: Fabrication and flow experiments,” Mech. Industry, 2, (2001), pp. 343-348.
(17) Knight, J. B., Vishwanath, A., Brody, J. P. and Austin, R. H., “Hydrodynamic focusing on a silicon
chip: mixing nanoliters in microseconds,” Phy. Rev. Lett., 80, (1998), pp. 3863-3866.
(18) Branebjerg, J., Gravesen, P., Krog, J. P., Nielsen, C. R., “Fast Mixing by Lamination,” Proc. IEEE
Workshop MEMS’96, San Diego, (1996), pp. 441-446.
(19) Kim, J. H., Kim, B. G., Nam, H., Park, D. E., Yun, K. S., Yoon, J. B., You, J., and Yoon, E., “A

Int. J. JSME, Ser. C, Vol. 48, No. 4, (2005), pp. 425-435
17
disposable DNA sample preparation microfluidic chip for nucleic acid probe assay,” J. MEMS, 11, (2002),
pp. 133-136.
(20) Schönfeld, F., Hessel, V., and Hofmann, C., “An optimised split-and-recombine micro-mixer with
uniform ‘chaotic’ mixing,” Lap on a chip, 4, (2004), pp. 65-69.
(21) Hardt, S., Drese, K., Hessel, V., and Schönfeld, F., “Passive micro mixers for applications in the micro
reactor and µ-TAS field,” Microchannels and Minichannels (ICMM2004), Rochester, (2004), pp. 45-51.
(22) Maxey, M. R. and Riley, J. J., “Equation of motion for a small rigid sphere in a nonuniform flow,” Phys.
Fluids, 26, (1983), pp. 883-889.
(23) Xia, Y., and Whitesides, G. M., “Soft lithography,” Annu. Rev. Materials Sci., 28, (1998), pp. 153-184.
(24) Jo, B. H., Van Lerberghe, L. M., Mostsegood, K. M., and Beebe, D. J., “Three-dimensional
micro-channel fabrication in polymethylsiloxane (PDMS) elastomer,” J. MEMS, 9, (2000), pp. 76-81.

Int. J. JSME, Ser. C, Vol. 48, No. 4, (2005), pp. 425-435
18
Table 1 Comparison of mixing performance of mixer with straight channel

Int. J. JSME, Ser. C, Vol. 48, No. 4, (2005), pp. 425-435
19
Fig.1 Concept of µ-IMCS

Int. J. JSME, Ser. C, Vol. 48, No. 4, (2005), pp. 425-435
20
First 90° rotation
Split into 2 streams
Curved to remove stagnant regions
(b)(a)
Flow Direction
Second 90° rotation
Fig. 2 (a) Lamination with 180° rotation, (b) Geometry of a mixer unit, and (c) Mixer is realized using 3 separate layers
Merge at the exit
(c)
T-junction for flow splitting L-shaped channels for
guiding sub-streams

Int. J. JSME, Ser. C, Vol. 48, No. 4, (2005), pp. 425-435
21
(a) (b) (c)
(d) (e) (f) Fig. 3 Results of CFD analysis of the present mixer, (a) Computational mesh, (b) 5000 particles
uniformly seeded at the top half of the inlet. Particle distribution at the exit of (c) 1st, (d) 2nd, (e) 6th, and
(f) 9th unit. The channels have a cross-section of 200 x 200 µm2.

Int. J. JSME, Ser. C, Vol. 48, No. 4, (2005), pp. 425-435
22
(a) (b) (c)
(d) (e) (f) Fig. 4 Results of CFD analysis for mixer proposed by Kim et al. (19). The geometry is slightly modified to
facilitate comparison with the present mixer. (a) Computational mesh, (b) 5000 particles uniformly seeded at the top half of the inlet. Particle distribution at the exit of (c) 1st, (d) 2nd, (e) 6th, and (f) 9th unit.

Int. J. JSME, Ser. C, Vol. 48, No. 4, (2005), pp. 425-435
23
(a) (b) (c) Fig. 5 Effects of Re on lamination pattern, (a) Re = 0.01, (b) Re = 1 and (c) Re = 10
Int. J. JSME, Ser. C, Vol. 48, No. 4, (2005), pp. 425-435
24
Fig. 6 Comparison of sedimentation loss between two mixers.

Int. J. JSME, Ser. C, Vol. 48, No. 4, (2005), pp. 425-435
25
Fig. 7 Experimental setup. Flow rates of cells/magnetic beads and buffer fluid are separately controlled
by two syringe pumps. Syringes containing cells/magnetic beads are kept vertically throughout the experiment to minimize sedimentation loss.

Int. J. JSME, Ser. C, Vol. 48, No. 4, (2005), pp. 425-435
26
Fig. 8 Modified test sections with magnetic trap and workings of magnetic trap. (a) Test sections with
9mixer units, and (b) straight channel. Magnetic trap with (c) permanent magnet inserted, and (d) permanent magnet removed.
(a) (b)
(c) (d)
Int. J. JSME, Ser. C, Vol. 48, No. 4, (2005), pp. 425-435
27
Fig. 9 Graph of Positive/ Cell Recovery versus residence time of the beads and cells in the mixer.

Int. J. JSME, Ser. C, Vol. 48, No. 4, (2005), pp. 425-435
28
Fig. 10 Schematic of target cell isolation experiment.

Int. J. JSME, Ser. C, Vol. 48, No. 4, (2005), pp. 425-435
29
Fig. 11 CD31 expression of (a) HUVEC and (b) hMSC evaluated using a commercial MCS system and percentage of (c)
HUVEC and (d) hMSC in the positive and negative selection, respectively.
(a) (c)
(b) (d)