a large-scale experimental comparison of the tetrad and triangle tests in children
TRANSCRIPT

A LARGE-SCALE EXPERIMENTAL COMPARISON OF THE TETRADAND TRIANGLE TESTS IN CHILDRENjoss_385 1..6
KAREN GARCIA1,3, JOHN M. ENNIS2 and WITOON PRINYAWIWATKUL1
1Department of Food Science, Louisiana State University Agricultural Center, Baton Rouge, LA 708032The Institute for Perception, Richmond, VA
3Corresponding author. TEL: 225-578-5188;FAX: 225-578-5300;EMAIL: [email protected]
Accepted for Publication June 2, 2012
doi:10.1111/j.1745-459X.2012.00385.x
ABSTRACT
Interest in the Tetrad test as an alternative to the Triangle test is growing as theoreti-cal results indicate that the Tetrad test has relatively high power for an unspecifiedmethod. But a large-scale experimental comparison of the Tetrad test with the Tri-angle test for the same stimuli has not yet appeared in the sensory literature. In thispaper, we report results from such a large scale comparison, with the addition thatthe testing was conducted with children. This comparison is important as the pres-ence of a fourth stimulus in the Tetrad test could lead to reduced effect sizes due tosensory fatigue, adaptation and memory effects. Using Thurstonian analysis, wequantify this reduction in effect size and we apply a recently developed guideline toshow that the Tetrad test remains more powerful than the Triangle test in this setting,even with the reduction in effect size.
PRACTICAL APPLICATIONS
This paper demonstrates that the Tetrad test is a superior alternative to the Triangletest in at least one practical setting. More generally, this paper serves as a template forsensory researchers who might replace Triangle testing with Tetrad testing withintheir discrimination testing programs. Using the analytic methods outlined in thispaper, researchers can quantify the increase in perceptual noise caused by the addi-tion of a fourth stimulus.
INTRODUCTION
“How can we do more with less?” In recent years this questionhas been asked repeatedly, not least within the sensory com-munity. Yet this question has only partially been answered.One suggestion has been to replicate testing (Bi and Ennis1998, 1999, 2001a; Brockhoff and Schlich 1998; Ennis and Bi1998; Meyners 2007); another has been to adjust the wordingof questionnaires, either with the inclusion of a “no differ-ence”option (Angulo and O’Mahony 2005; Alfaro-Rodriguezet al. 2007; Kim et al. 2008; Ennis et al. 2011; Christensen et al.2012; Ennis and Ennis 2012); a third approach has been tocompare the sensitivity of various testing methodologies(Ennis 1990, 1993; Dessirier and O’Mahony 1998; Rousseauet al. 1998, 2002; Bi and Ennis 2001b; Ennis and Jesionka2011).
Regarding the comparison of various methodologies, awell established fact is that specifying an attribute of interest
greatly increases the sensitivity of testing (Gridgeman 1970;Frijters 1979; Ennis 1993). But this fact is only of partial valueto a product tester who lacks knowledge of the nature of thedifference between samples. Although progress has beenmade using a “warm-up” procedure in which respondentsfirst identify the most salient attribute distinguishing samplesbefore attempting to differentiate the (re-presented) sampleswith respect to the specified attribute (Rousseau andO’Mahony 1997), a promising new development is the use ofthe Tetrad test as a more sensitive method for unspecifiedtesting (Ennis and Jesionka 2011).1
1 Note that an alternate but also promising line of research is basedon adjusting experimental protocol to encourage the use of moresensitive decision rules (c.f. Lee et al. 2007; Van Hout et al. 2011;Hautus et al. 2011a,b; Kim and Lee 2012).
bs_bs_banner
Journal of Sensory Studies ISSN 0887-8250
1Journal of Sensory Studies •• (2012) ••–•• © 2012 Wiley Periodicals, Inc.

In the Tetrad test, four stimuli are presented. Two stimulicome from one sample, while the remaining two come froma second sample. Respondents are asked to group thesamples into two groups of two with respect to similarity.Note that these instructions are not the same as to select thetwo samples that are most similar – these latter instructionscould lead to two intermediate samples being selected as apair, leaving behind the two samples that are most differentfrom each other to form the second pair. An attribute can bespecified, giving the specified Tetrad test, but more interest-ing for our purposes are instructions in which no attributeis specified. These instructions give the unspecified Tetradtest, which is similar to other unspecified methods such asthe Triangle test, the duo-trio test, the same-different testand so on, in that no prior attribute knowledge is required.Although other unspecified testing methods are wellstudied, interest in unspecified Tetrad test is relatively recent(Masuoka et al. 1995; Delwiche and O’Mahony 1996; Enniset al. 1998; Ennis and Jesionka 2011). For the remainder ofthis paper, when we write “Tetrad test” we mean theunspecified Tetrad test.
The Tetrad test is noteworthy among unspecifiedtesting methods as it is predicted to have relatively highpower and hence to require smaller samples sizes fortesting (Ennis and Jesionka 2011). Although this predic-tion has been validated in small-scale studies (Masuokaet al. 1995; Delwiche and O’Mahony 1996), a large-scalestudy comparing the Tetrad and Triangle tests has yet toappear.
One benefit of such a large-scale study is increased preci-sion in the estimation of effect sizes. Specifically, as theTetrad test requires evaluations of four samples instead ofthree, it is reasonable to question the viability of the Tetradtest as an alternative to the Triangle test. Sensory fatigue,adaptation and memory effects arising from the evaluationof an additional sample can lead to a loss of sensitivity(Rousseau and O’Mahony 1997; Rousseau et al. 1999, 2002;Lau et al. 2004). By conducting a large-scale study usingboth the Tetrad and Triangle tests involving the samestimuli with the same respondents, one can more defini-tively quantify this potential loss. Moreover, using a guide-line recently developed by Ennis (2012), one can determinewhether or not this potential loss is so great as to negate thetheoretical power advantage of the Tetrad test over theTriangle test.
In this paper, we report results from a large-scale studyin which approximately 400 elementary school childrenevaluated the same apple juice variants in both Tetradand Triangle tests. We then analyze the results from aThurstonian perspective and use the recently developedguideline of Ennis (2012) to show that the Tetrad test ismore powerful, operationally and not just in theory, in thisinstance.
MATERIALS AND METHODS
Subjects
Four hundred four children, with ages ranging from 6–11 andin grades one through six, from elementary schools in BatonRouge, Louisiana, U.S.A., participated in our study. Thebreakdown by grade was 96 first graders, 55 second graders,48 third graders, 80 fourth graders, 51 fifth graders and 74sixth graders.
To be eligible for participation, students needed to bein grades 1–6 and not be allergic to any of the ingredientsin the product. Participants were required to have parentalconsent and to sign an assent form, approved by theLouisiana State University AgCenter Institutional ReviewBoard prior to participating in the testing. No mone-tary incentive or rewards were given to subjects forparticipation.
Stimuli
Stimuli consisted of apple juice (Mott’s Original, 100% applejuice, Mott’s LLP, Rye Brook, NY). The discrimination testswere performed between the pure product and juice dilutedto 75% by weight. All samples were presented in approxi-mately 1.5 fl oz aliquots in lidded black plastic cups (DartConex Complements Black Portion 2 oz, Dart ContainerCorporation, Mason, MI) and served at room temperature(~25C).
Testing Procedure
Participants performed the Tetrad and Triangle tests in thesame session. The session lengths ranged between 20 and30 min. Before each session, each participant was pro-vided with sample presentations to explain the logisticsof the tests. During this presentation, the terms sameand different were reviewed; the participants were asked todefine same and different, give examples and determine ifsets of given foods were the same or different. Also,each participant was given a demonstration of the tastingprocedure along with an explanation of how to use thequestionnaire.
The specific instructions for the Tetrad test were:“Here are four juice samples; two belong to one groupand the other two belong to a different group:separate them according to their taste into two groupsof two.”
For the Triangle test the instructions were:“Here are the juices; two are the same and one is different:identify the juice that is different.”
COMPARISON OF TETRAD AND TRIANGLE K. GARCIA, J.M. ENNIS and W. PRINYAWIWATKUL
2 Journal of Sensory Studies •• (2012) ••–•• © 2012 Wiley Periodicals, Inc.
During the session, the subjects performed one trial of theTetrad test and two trials of the Triangle test.2 The order of thetests was balanced across participants. Before each test, par-ticipants began each session by rinsing their mouths withroom temperature (~25C) water. For each test, the sampleswere presented simultaneously and the children wereinstructed to taste them in the order given, from left to right.Re-tasting was allowed as long as the children tasted all thesamples in the given order.
RESULTS AND ANALYSIS
In our analysis, we sought to determine whether the twotesting methods indicated the same underlying effect sizes orwhether one of the methods reported a smaller effect sizethan the other. Given that sensory fatigue, adaptation andmemory effects can lead to reduced effect sizes (Rousseau andO’Mahony 1997; Rousseau et al. 1999, 2002; Lau et al. 2004),our expectation was that the Tetrad test, with four stimuli toevaluate instead of three as in the Triangle test, would show areduced effect size.
In order to compare methodologies, we used Thurstoniantheory to analyze the data. This theory is originally due toThurstone (1927) but has been developed heavily over thepast century by contributors in wide variety of fields (see Leeand O’Mahony, 2007, for a thorough review and Brockhoffand Christensen, 2010, for a recent statistical advance). UsingThustonian theory, we estimated the underlying effect sizebetween the two apple juice variants, as measured by both theTriangle and the Tetrad tests (Ura 1960; Ennis et al. 1998). Inaddition, we determined the variance in our estimates usingthe approach described in Bi et al. (1997). In what follows, weuse the terms“effect size”and“d,” the Thurstonian measure ofsensory disciminal distance, interchangeably.
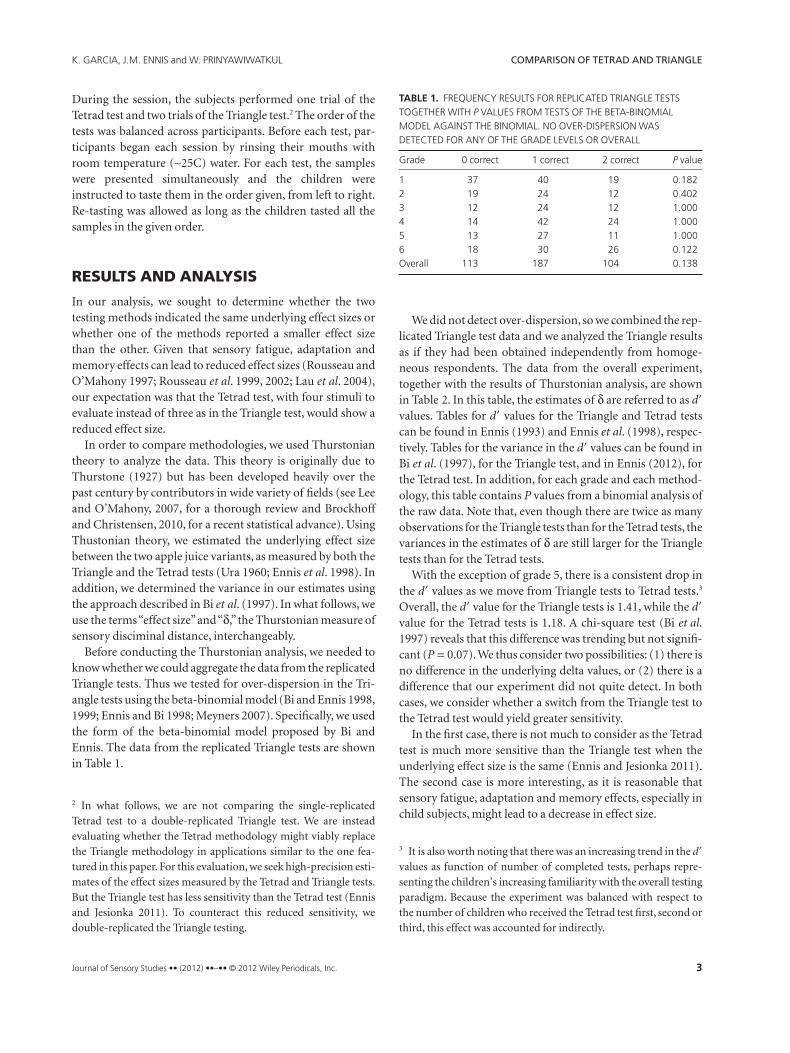
Before conducting the Thurstonian analysis, we needed toknow whether we could aggregate the data from the replicatedTriangle tests. Thus we tested for over-dispersion in the Tri-angle tests using the beta-binomial model (Bi and Ennis 1998,1999; Ennis and Bi 1998; Meyners 2007). Specifically, we usedthe form of the beta-binomial model proposed by Bi andEnnis. The data from the replicated Triangle tests are shownin Table 1.
We did not detect over-dispersion, so we combined the rep-licated Triangle test data and we analyzed the Triangle resultsas if they had been obtained independently from homoge-neous respondents. The data from the overall experiment,together with the results of Thurstonian analysis, are shownin Table 2. In this table, the estimates of d are referred to as d�
values. Tables for d� values for the Triangle and Tetrad testscan be found in Ennis (1993) and Ennis et al. (1998), respec-tively. Tables for the variance in the d� values can be found inBi et al. (1997), for the Triangle test, and in Ennis (2012), forthe Tetrad test. In addition, for each grade and each method-ology, this table contains P values from a binomial analysis ofthe raw data. Note that, even though there are twice as manyobservations for the Triangle tests than for the Tetrad tests, thevariances in the estimates of d are still larger for the Triangletests than for the Tetrad tests.
With the exception of grade 5, there is a consistent drop inthe d� values as we move from Triangle tests to Tetrad tests.3
Overall, the d� value for the Triangle tests is 1.41, while the d�
value for the Tetrad tests is 1.18. A chi-square test (Bi et al.1997) reveals that this difference was trending but not signifi-cant (P = 0.07). We thus consider two possibilities: (1) there isno difference in the underlying delta values, or (2) there is adifference that our experiment did not quite detect. In bothcases, we consider whether a switch from the Triangle test tothe Tetrad test would yield greater sensitivity.
In the first case, there is not much to consider as the Tetradtest is much more sensitive than the Triangle test when theunderlying effect size is the same (Ennis and Jesionka 2011).The second case is more interesting, as it is reasonable thatsensory fatigue, adaptation and memory effects, especially inchild subjects, might lead to a decrease in effect size.
2 In what follows, we are not comparing the single-replicatedTetrad test to a double-replicated Triangle test. We are insteadevaluating whether the Tetrad methodology might viably replacethe Triangle methodology in applications similar to the one fea-tured in this paper. For this evaluation, we seek high-precision esti-mates of the effect sizes measured by the Tetrad and Triangle tests.But the Triangle test has less sensitivity than the Tetrad test (Ennisand Jesionka 2011). To counteract this reduced sensitivity, wedouble-replicated the Triangle testing.
3 It is also worth noting that there was an increasing trend in the d�
values as function of number of completed tests, perhaps repre-senting the children’s increasing familiarity with the overall testingparadigm. Because the experiment was balanced with respect tothe number of children who received the Tetrad test first, second orthird, this effect was accounted for indirectly.
TABLE 1. FREQUENCY RESULTS FOR REPLICATED TRIANGLE TESTSTOGETHER WITH P VALUES FROM TESTS OF THE BETA-BINOMIALMODEL AGAINST THE BINOMIAL. NO OVER-DISPERSION WASDETECTED FOR ANY OF THE GRADE LEVELS OR OVERALL
Grade 0 correct 1 correct 2 correct P value
1 37 40 19 0.1822 19 24 12 0.4023 12 24 12 1.0004 14 42 24 1.0005 13 27 11 1.0006 18 30 26 0.122Overall 113 187 104 0.138
K. GARCIA, J.M. ENNIS and W. PRINYAWIWATKUL COMPARISON OF TETRAD AND TRIANGLE
3Journal of Sensory Studies •• (2012) ••–•• © 2012 Wiley Periodicals, Inc.

In order to fully investigate this second possibility, we needto allow for the possibility that there is more perceptual noisein the Tetrad test than in the Triangle test (see also Ennis2012). To understand this perspective, recall that d is the dif-ference in perceptual intensity between normal distributionswith unit variance. This means that d can be thought of as asignal to noise ratio where the signal is the difference in per-ceptual intensities and the noise is one. But an alternativeviewpoint is to suppose that the normal distributions havestandard deviation s and define d as
δ μσ
= (1)
where m is the underlying difference between the means of thetwo normal distributions. This more general perspectiveallows for the possibility that the Triangle and Tetrad testshave different s values even when the average difference inperceptual intensities between the apple juice variants is thesame in both tests.
To see how this perspective is implemented, let
δ μσ�
�= (2)
be the effect size for the Tetrad test and let
δ μσΔ
Δ= (3)
be the effect size for the Triangle test. Since m is the same inboth Eqs. (2) and (3), the effect size (d�) in the Tetrad test willbe smaller than the effect size (d�) when the perceptual noise(s�) in the Tetrad test is larger than the perceptual noise (s�)in the Triangle test (see Fig. 1).
With this perspective, we estimate the increase in percep-tual noise in our experiment as
σσ
μ σμ σ
δδ
�
� � �Δ
Δ Δ Δ= = ≈ ′′
= =d
d
1 41
1 181 195
.
.. (4)
Thus we estimate that the perceptual noise increased byabout 20% when Tetrad tests were conducted instead of Tri-angle tests. This increase in perceptual noise roughly corre-sponds to a 16% drop in effect size:
δδ
� �
Δ Δ≈ ′
′= =d
d
1 18
1 410 837
.
.. (5)
To complete the analysis, we consider whether the Tetradtest remained more powerful than the Triangle test, even inthe face of this reduced effect size. Ennis (2012) has proposeda guideline stating that the Tetrad test is more powerful thanthe Triangle test as long as
σ σΔ Δ> ×2
3 (6)
Comparing Eq. (6) to Eq. (5), we note that 0.837 > 2/3.Thus, our point estimate indicates higher power for theTetrad test. To be more rigorous, we use the statistical theoryof multiplicative comparisons (Ennis and Ennis 2011) andobtain 95% confidence that
δ δ� > ×0 711. Δ (7)
As 0.711 > 2/3, we have strong evidence that the Tetrad testis in fact more powerful than the Triangle test for our testpopulation and with the stimuli tested.
CONCLUSION
In this paper, we satisfied the need for a large-scale test com-paring the Triangle and Tetrad tests. Specifically, in a test with404 children involving sweetened apple juice, the Tetrad testreturned a higher correct proportion than the Triangle testbut also a potentially reduced effect size. Despite this reducedeffect size, the Tetrad test remained more powerful than theTriangle test as the effect size returned by the Tetrad test wasreliably more than two-thirds the effect size returned by theTriangle test. This result is notable given that the subjects werechildren – we expect sensory fatigue, adaptation and memoryeffects to be greater in children than in adults. As the Tetradtest remained more powerful than the Triangle test in thiscase, we are optimistic that the Tetrad test can provide greaterpower and improved sensitivity in other applicationsthroughout sensory science.
TABLE 2. PROPORTIONS OF CORRECTRESPONSES, d� VALUES, VARIANCES INESTIMATES, AND P VALUES FOR THE TETRADAND TRIANGLE TEST METHODS FORINDIVIDUAL GRADE LEVELS AND OVERALL
Grade
Tetrad tests Triangle tests
N Pc P value d� Var N Pc P value d� Var
1 96 0.42 0.05 0.70 0.051 192 0.41 0.02 0.92 0.0582 55 0.47 0.02 0.92 0.063 110 0.44 0.02 1.11 0.0803 48 0.56 <0.01 1.24 0.058 96 0.50 <0.01 1.47 0.0724 80 0.61 <0.01 1.40 0.033 160 0.56 <0.01 1.79 0.0395 51 0.73 <0.01 1.80 0.053 102 0.48 <0.01 1.36 0.0716 74 0.55 <0.01 1.21 0.038 148 0.55 <0.01 1.74 0.043Overall 404 0.54 <0.01 1.18 0.007 808 0.49 <0.01 1.41 0.009
COMPARISON OF TETRAD AND TRIANGLE K. GARCIA, J.M. ENNIS and W. PRINYAWIWATKUL
4 Journal of Sensory Studies •• (2012) ••–•• © 2012 Wiley Periodicals, Inc.

ACKNOWLEDGMENTS
The authors thank Daniel Ennis and Benoit Rousseau forhelpful feedback.
REFERENCES
ALFARO-RODRIGUEZ, H., ANGULO, O. and O’MAHONY, M.2007. Be your own placebo: A double paired preference testapproach for establishing expected frequencies. Food Qual.Prefer. 18(2), 353–361.
ANGULO, O. and O’MAHONY, M. 2005. The paired preferencetest and the “no preference” option: Was Odesky correct? FoodQual. Prefer. 16(5), 425–434.
BI, J. and ENNIS, D.M. 1998. A Thurstonian variant of thebeta-binomial model for replicated difference tests. J. Sens.Stud. 13, 461–466.
BI, J. and ENNIS, D.M. 1999. Beta-binomial tables for replicateddifference and preference tests. J. Sens. Stud. 14, 347–368.
BI, J. and ENNIS, D.M. 2001a. Exact beta-binomial tables forsmall experiments. J. Sensory Studies 16, 319–325.
BI, J. and ENNIS, D.M. 2001b. The power of the “A”-“Not A”method. J. Sensory Studies 16, 343–359.
BI, J., ENNIS, D.M. and O’MAHONY, M. 1997. How to estimateand use the variance of d’ from difference tests. J. SensoryStudies 12, 87–104.
BROCKHOFF, P.B. and CHRISTENSEN, R.H.B. 2010.Thurstonian models for sensory discrimination tests asgeneralized linear models. Food Qual. Prefer. 21(3),330–338.
BROCKHOFF, P.B. and SCHLICH, P. 1998. Handling replicationsin discrimination tests. Food Qual. Prefer. 9, 303–312.
CHRISTENSEN, R.H.B., LEE, H.S. and BROCKHOFF, P.B. 2012.Estimation of the Thurstonian model for the 2-AC protocol.Food Qual. Prefer. 24(1), 119–128.
DELWICHE, J. and O’MAHONY, M. 1996. Flavourdiscrimination – an extension of Thurstonian paradoxes to theTetrad method. Food Qual. Prefer. 7, 1–5.
FIG. 1. THE TRIANGLE AND TETRAD TESTSCAN REPORT DIFFERENT EFFECT SIZES(d� � d�) EVEN WHEN THE UNDERLYINGDIFFERENCES IN PERCEPTUAL INTENSITIES (m)IS THE SAMEIn this example, s� = 1 and s� = 2.
K. GARCIA, J.M. ENNIS and W. PRINYAWIWATKUL COMPARISON OF TETRAD AND TRIANGLE
5Journal of Sensory Studies •• (2012) ••–•• © 2012 Wiley Periodicals, Inc.

DESSIRIER, J.-M. and O’MAHONY, M. 1998. Comparison of d’values for the 2-AFC (paired comparison) and 3-AFCdiscrimination methods: Thurstonian models, sequentialsensitivity analysis and power. Food Qual. Prefer. 10, 1–8.
ENNIS, D.M. 1990. Relative power of difference testing methodsin sensory evaluation. Food Technol. 44, 114, 116, 117.
ENNIS, D.M. 1993. The power of sensory discriminationmethods. J. Sensory Studies 8(4), 353–370.
ENNIS, D.M. and BI, J. 1998. The beta-binomial model:Accounting for inter-trial variation in replicated difference andpreference tests. J. Sensory Studies 13, 389–412.
ENNIS, D.M. and ENNIS, J.M. 2012. Accounting for nodifference/preference responses or ties in choice experiments.Food Qual. Prefer. 23(1), 13–17.
ENNIS, D.M., ROUSSEAU, B. and ENNIS, J.M. 2011. Short Storiesin sensory and Consumer Science, 1st Ed., IFPress, Richmond,VA.
ENNIS, J.M. 2012. Guiding the switch from Triangle testing toTetrad testing. J. Sensory Studies 27 (in press).
ENNIS, J.M. and ENNIS, D.M. 2011. Confidence bounds formultiplicative comparisons. Commun. Stat.-Theor. M. 40(17),3049–3054.
ENNIS, J.M. and JESIONKA, V. 2011. The power of sensorydiscrimination testing methods revisited. J. Sensory Studies 26,371–382.
ENNIS, J.M., ENNIS, D.M., YIP, D. and O’MAHONY, M. 1998.Thurstonian models for variants of the method of Tetrads. Br. J.Math. Stat. Psychol. 51, 205–215.
FRIJTERS, J.E.R. 1979. The paradox of discriminatorynondiscriminators resolved. Chem. Senses 4, 355–358.
GRIDGEMAN, N.T. 1970. A re-examination of the two-stageTriangle test for the perception of sensory differences. J. FoodSci. 35, 87–91.
HAUTUS, M.J., SHEPHERD, D. and PENG, M. 2011a. Decisionstrategies for the A Not-A, 2AFC and 2AFC-reminder tasks:Empirical tests. Food Qual. Prefer. 22(5), 433–442.
HAUTUS, M.J., SHEPHERD, D. and PENG, M. 2011b. Decisionstrategies for the two-alternative forced choice reminderparadigm. Attention, Percept. Psychophys. 73(3), 729–737.
KIM, H.S., LEE, H.S., O’MAHONY, M. and KIM, K.O.K. 2008.Paired preference tests using placebo pairs and differentresponse options for chips, orange juices and cookies. J. SensoryStudies 23(3), 417–438.
KIM, M.A. and LEE, H.S. 2012. Investigation of operationallymore powerful duo-trio test protocols: Effects of differentreference schemes. Food Qual. Prefer. 25(2), 183–191.
LAU, S., O’MAHONY, M. and ROUSSEAU, B. 2004. Arethree-sample tasks less sensitive than two-sample tasks?Memory effects in the testing of taste discrimination. Percept.Psychophys. 66(3), 464–474.
LEE, H.S. and O’MAHONY, M. 2007. The evolution of a model: Areview of Thurstonian and conditional stimulus effects ondifference testing. Food Qual. Prefer. 18(2), 369–383.
LEE, H.S., VAN HOUT, D. and HAUTUS, M.J. 2007. Comparisonof performance in the A-Not A, 2-AFC, and same-different testsfor the flavor discrimination of margarines: The effect ofcognitive decision strategies. Food Qual. Prefer. 18(6), 920–928.
MASUOKA, S., HATJOPOULOS, D. and O’MAHONY, M. 1995.Beer bitterness detection: Testing Thurstonian and sequentialsensitivity analysis models for triad and Tetrad methods. J.Sensory Studies 10, 295–306.
MEYNERS, M. 2007. Proper and improper use and interpretationof Beta-binomial models in the analysis of replicated differenceand preference tests. Food Qual. Prefer. 18(5), 741–750.
ROUSSEAU, B. and O’MAHONY, M. 1997. Sensory differencetests: Thurstonian and SSA predictions for vanilla flavoredyogurts. J. Sensory Studies 12, 127–146.
ROUSSEAU, B., MEYER, A. and O’MAHONY, M. 1998. Powerand sensitivity of the same-different test: Comparison withTriangle and duo-trio methods. J. Sensory Studies 13, 149–173.
ROUSSEAU, B., ROGEAUX, M. and O’MAHONY, M. 1999.Mustard discrimination by same-different and Triangle tests:Aspects of irritation, memory and t criteria. Food Qual. Prefer.10, 173–184.
ROUSSEAU, B., STROH, S. and O’MAHONY, M. 2002.Investigating more powerful discrimination tests withconsumers: Effects of memory and response bias. Food Qual.Prefer. 13(1), 39–45.
THURSTONE, L.L. 1927. A law of comparative judgement.Psychol. Rev. 34, 273–286.
URA, S. 1960. Pair, Triangle and duo-trio test. Rep. Stat. Appl. Res.Union Jpn. Sci. Eng., 7, 107–119.
VAN HOUT, D., HAUTUS, M.J. and LEE, H. 2011. Investigationof test performance over repeated sessions using signaldetection theory: Comparison of three nonattribute-specifieddifference tests 2-AFCR, A-NOT A and 2-AFC. J. SensoryStudies 26(5), 311–321.
COMPARISON OF TETRAD AND TRIANGLE K. GARCIA, J.M. ENNIS and W. PRINYAWIWATKUL
6 Journal of Sensory Studies •• (2012) ••–•• © 2012 Wiley Periodicals, Inc.