a legacy of change -...
TRANSCRIPT

London 2012December 2012
London 2012 Post-Games Sustainability Report
A legacy of change

400,000tonnes of carbon dioxide equivalent saved (against reference footprint)
100per cent Games operations waste diverted from landfill
62per cent out of a total of 10,173 tonnes of Games operational waste actually reused, recycled or composted
99per cent out of a total of 61,000 tonnes of waste from installing and decommissioning Games venues reused or recycled
86per cent of Olympic Park visitors travelled by rail
70per cent of LOCOG suppliers were SME’s contributing 26 per cent by value of our programme
39per cent of staff directly employed by LOCOG at the peak of the Games had been unemployed prior to their recruitment
75 number of event related papers published on Learning Legacy website
23.5 per cent of staff directly employed by LOCOG during the Games were resident in one of the six Host Boroughs
15.5 million sustainably sourced meals29 per cent increase in number of
cyclists in central London during the Olympic Games compared with same period the year before

Foreword from the Chair of the London 2012 Sustainability Ambassadors Group 6
Statement from the Chief Executive of LOCOG 7
Our sustainability journey 10
Stakeholder priorities 17
− Low carbon Games 18
− Zero waste Games 25
− Sustainable and accessible transport 32
− Economic benefits of sustainability 40
− Promoting sustainable living 46
− Olympic Park legacy plan 52
LOCOG sustainability objectives at a glance 57
Assurance statement 68
Contents

4 Publication title
This is the final sustainability report from London 2012. As it is less than a year since we published our Pre-Games Sustainability Report (‘Delivering Change’, April 2012), we are issuing this as a supplement to that report, rather than a full annual report in its own right. The focus of this supplement is on what we achieved in the delivery of the Games and the culmination of our sustainability programme.
The structure of the report closely mirrors the summary report we produced in April 2012. This was centred on six topics that our stakeholders said mattered most to them, which we have now updated with results and outcomes from the Games together with new information on legacy where available. The focus is primarily on the London Organising Committee of the Olympic Games and Paralympic Games (LOCOG) as the organisation responsible for staging the Games; we have provided a brief narrative on how our programme was developed over the seven years since winning the bid. We have also set out how we did against our corporate sustainability objectives.
Although it can be read in conjunction with our Pre-Games Sustainability Report this shorter report cannot possibly convey the full detail of the London 2012 sustainability programme. However, we are pleased to be able to complement this with a number of standalone case studies, micro-reports, research summaries and champion product documents on the Learning Legacy website: http://learninglegacy.independent.gov.uk/
As this is a supplement to our full report earlier this year, which was prepared using the Global Reporting Initiative’s (GRI’s) G3.1 Sustainability Reporting Guidelines and Event Organisers Sector Supplement which was checked by GRI and found to be consistent with an application level of A, we have provided an updated GRI index, which highlights all indicators and disclosures that have been changed. This report retains the ‘A’ application level by virtue of it being a supplement. This index can also be found on the Learning Legacy website.
Acknowledgements
We would like to thank all our partners, suppliers, stakeholders, colleagues, Games Makers, team members and supporters for their valuable contributions to making our sustainability programme come alive during the Games and helping us achieve our objectives. Sustainability has many technical aspects but ultimately it is about people: we are deeply grateful to the wider public for the way they responded to the Games, created the atmosphere and appreciated the venues, the organisation and levels of service. Their recognition of our efforts has made it all worthwhile.
4A legacy of change
About this report

5A legacy of change
The Olympic Park during the Games
5A legacy of change

6A legacy of change
For most people, the “national high” that settled over the country during the Olympics and Paralympics lasted for many weeks – a “wellbeing afterglow” as a colleague of mine described it! In a funny kind of way, people felt blessed by the intensity of feelings associated with the Games and by their indisputable success.
For us, as Sustainability Ambassadors, that “afterglow” was strongly influenced by the sure knowledge that we all felt very comfortable talking about the 2012 Games as “the most sustainable Olympics and Paralympics of the modern era” – one must assume that all those naked Greeks really would have had a lower carbon footprint!
Our part in that story was very small indeed, and though the credit goes in the first instance to David Stubbs and his team, there were literally countless people who had a hand in this sustainability success story. Meeting the challenge of securing a “net positive impact” from something with as humungous a social and environmental footprint as the Olympics could only be achieved by embedding both the principles of sustainability and operational responsibility across the entire operation.
The Host City Contract between London and the International Olympic Committee mandated much of that, but the leadership of both the ODA and LOCOG worked hard to get that “whole company” buy-in.
This report represents a “first cut” on the final story, with a particular focus on those issues which were seen by stakeholders as being of particular importance. There’s a lot of detail here on waste (a “game-changing” exemplar for the whole of the construction industry), on
the carbon footprint (and you have to celebrate the fact that one of the reasons the final outcome wasn’t quite as good as it might have been was the fact that there were so many more visitors than had been anticipated!) and on employment.
For me, this last element is of particular importance in the sustainability picture, and this is the first time I’ve seen the very impressive “local content” figures on page 42.
There will be more to be reported on in due course, including the final report from the Commission for a Sustainable London 2012 which acted throughout the last five years as the independent watchdog for the Games. And much still has to be delivered through the London Legacy Development Corporation, which will now be expected not to fall short on what has already been achieved.
Physically, there’s no doubt that it’s the Olympic Park that will make the most significant “lasting impression” on the lives of many millions of people over the years to come. But there is so much else here that will contribute to the legacy of the 2012 Games, and the sustainability story is right up there as one of the most important aspects.
Jonathon Porritt November 2012
Jonathon Porritt is Founder Director of Forum for the Future www.forumforthefuture.org
Foreword from the Chair of the London 2012 Sustainability Ambassadors Group
The London 2012 Sustainability Ambassadors at the Velodrome: Left to Right; Jonathon Porritt ,Tim Smit, Deborah Meaden, Kevin McCloud, Saci Lloyd and Eugenie Harvey (absent James Cracknell)

7A legacy of change
The London 2012 Olympic and Paralympic Games were an enormous success on numerous fronts and that is testimony to the hard work and excellence of so many people in-volved in the project. I am also hugely proud that we honoured our ambitious sustainability commitments and succeeded in raising the bar and setting new standards in so many areas. This wasn’t something extra; it was an integral part of what we did and helped us deliver such great Games.
This report provides the final results of the key strands of our sustainability programme, many of which will set a benchmark for the future. But overall, how were the Games delivered in a sustainable way? When we published our Sustainability Guidelines for Corporate and Public Events (first issued in July 2008 and updated in May 2010 and February 2012), we set out a definition of what we meant by a sustainable event. This identified eight key attributes which I think are a good way of looking at how we performed.
1. Provide an accessible and inclusive setting for all The detailed planning in the early years to ensure we designed our venues and services to be as accessible as possible really bore fruit during the Games, complemented by the highly successful Games Mobility service. Our food services provided sufficient options to cater for diverse dietary, ethnic, cultural and practical needs; we provided affordable options, access to free drinking water and people could bring their own food into LOCOG
venues. Above all, the warm welcome provided our volunteer Games Makers from all walks of life helped to make everyone feel part of the Games.
2. Provide a safe and secure atmosphere Thankfully there were no major safety or security incidents during the Games. The screening of visitors into venues was efficient, friendly and even fun. This was due in large part to the marvellous professionalism of the armed forces and police and their positive engagement with the public. Behind the scenes, the work of the security and emergency services all contributed to the overwhelmingly relaxed and secure atmosphere at the Games.
3. Have minimal negative impacts on the environment The Games inevitably consume a large amount of resources, but through our planning, procurement and operational choices we have massively avoided waste, we have made substantial carbon savings, sourced environmentally friendly products and taken care to protect the natural and cultural heritage found on our venues. From the natural planting of the Olympic Park to the detailed surveys and ecological management at Greenwich Park and Box Hill, and the partnerships we initiated, we made important contributions to biodiversity conservation.
4. Encourage healthy living The inspirational power of sport clearly shone through during the Games. Since then, clubs up and down the country have reported a surge in participation in so many different sports. For the Games we instigated the Active Travel Programme, which not only enabled spectators and workforce to cycle or walk to venues, but it formed a huge
Statement from the Chief Executive of LOCOG
Paul Deighton Chief Executive The London Organising Committee of the Olympic Games and Paralympic Games Limited
8A legacy of change
part of managing the background travel demand across London. We addressed air quality concerns by ensuring we had a low-emission vehicle fleet, maximising use of public transport modes and fitting particulate filters to several of our temporary power generators. Finally, let’s not forget the health and wellbeing benefits of creating a major new parkland in east London, providing vital open space for recreation and enjoyment of the natural environment.
5. Promote responsible sourcing Staging the Games required a vast amount of goods and services, more than £1 billion-worth in value, all of which had to be sourced sustainably. We put huge effort into our procurement programme, in which sustainability was an integral part of our definition of value for money. This gave us a diverse supplier base, of which 70 per cent of companies were small and medium-sized enterprises (SMEs) and represented all nations and regions of the UK. In 2011, we were certified to the globally recognised standard of the Chartered Institute of Purchasing and Supply for our effective processes, strategies, policies and procedures. We always knew there would be challenges, particularly in the area of labour standards, which is why our ground-breaking Sustainable Sourcing Code introduced the innovative concept of a Complaints and Dispute Resolution Mechanism, something we understand other companies are looking to emulate.
6. Deliver excellent customer experience When people feel valued they appreciate what you have done. All our client groups, from athletes
to spectators, gave us excellent feedback on their Games experience. Their appreciation of the quality of service, of the venues and landscaping, of the transport and security services and the friendliness of the volunteer Games Makers made for an especially memorable occasion. Attention to detail had been a vital factor in achieving this, and sustainability was a key component.
7. Encourage more sustainable behaviour One thing that came through loud and clear from the Games was that people respected the quality of the venues. So many remarked on how clean and litter-free they were, and how easy it was for them to recycle their waste. Respect for place was also important, whether at the newly created Olympic Park, on the sensitive chalk grasslands of Box Hill (part of the Road Cycling route), or on the grassy cliffs overlooking Weymouth Bay (our Sailing venue). Through many of the Inspire projects, our Get Set education programme and the local initiative Changing Places, we engaged thousands of people in sustainability projects and activities which we hope will continue for a long time to come.
8. Leave a positive legacy Although ultimately legacy is a long-term perspective, we can already see numerous examples where our work is being carried forward: among our partners, BT and Coca-Cola have adopted and adapted our carbon footprint methodology to look at their business areas; the Food Legacy Pledge (managed by Sustain) is attracting widespread support; the Waste and Resources Action Programme (WRAP ) is taking forward many of the learnings from our zero waste Games vision; and
we have been instrumental in the development of the new international management system standard for sustainable events, ISO 20121.
There is a lot to pass on to future Games and the wider world of events and businesses generally. We are enormously proud of what we have managed to do but we know this has only been a start.
Sustainability does not have an end point and we hope that what we have learnt and reported here will provide future events and major projects with a solid foundation for improving their sustainability performance.
Paul Deighton Chief Executive The London Organising Committee of the Olympic Games and Paralympic Games Limited

9A legacy of change
The natural landscaping of the Olympic Park provided an impressive backdrop for the Games experience
9A legacy of change

10A legacy of change
By all popular yardsticks the London 2012 Olympic and Paralympic Games were a huge success. For many it was just about the few magical weeks when all the years of planning and predictions and talk finally culminated in an amazing festival of human endeavour. But the London 2012 story is about much more than just the period of the Games and sustainability has been central to this wider story. In part this was about fulfilling promises: when we bid for the 2012 Games, we made a radical proposal to the International Olympic Committee. We weren’t just going to put on the biggest sporting event in the world; we were going to hold the world’s first sustainable Olympic and Paralympic Games.
We said that no Games should ever pass through a city without leaving a lasting impression. For us this meant the design and build of the Olympic parkland and venues, new transport and utilities infrastructure and a blueprint for a sustainable new community in east London based on the principles of ‘One Planet Living®’. We also wanted to have a lasting influence on the way people think and behave.
Delivering sustainability at scaleThe Games was a huge undertaking: the largest peacetime logistical exercise in the world. It involved staging 26 simultaneous world championships, taking a two-week break then staging another 20, bringing
together in excess of 200 competing nations – more than there are members of the UN – and providing for more than 15,000 Olympic and Paralympic athletes. They in turn were outnumbered two to one by media and supported by a workforce comprising almost 200,000 paid staff, volunteers and contractors, not to mention the holders of more than 11 million tickets. The Olympic Opening Ceremony was watched by 28.7m people in the UK, and billions worldwide.
Many people might blanch at the idea of so much one-off resource use and disruption alongside the notion of sustainability. There is something paradoxical about it. But that is before one considers the power of the Games to stimulate an enormous amount of positive and lasting change. Provided the latter can outweigh the former then it is worth doing. Our job was to make that balance work.
We saw London 2012 as a unique opportunity to demonstrate sustainability on an unprecedented scale. For a start it was a one-off chance to display the UK’s leadership on sustainability to a global audience. Secondly, it was an opportunity to reach vast numbers of people who wouldn’t otherwise be engaged by conventional sustainability campaigns; and finally, there is something about sport’s values that make an outstanding platform for promoting sustainable behaviour.
Our sustainability journey
London 2012 was gold winner in the Environment and Sustainability category of the 6th International Sports Event Management Awards, November 2012

11A legacy of change
After (2012): new wetland bowl in the north of the Olympic Park during the Games. This area provides valuable new habitats, amenity and flood relief.
Before (2004): derelict buildings on the future Olympic Park
So this was a unique chance to lead the way to show how, through sport, we could deliver lasting change – not just the obvious physical change in how a neglected part of east London was being transformed into a thriving community – massive though that was – but also...
– Change in the way large scale construction projects are planned and built.
– Change in the way we manage events.
– Change in the way the Olympic and Paralympic Movements view sustainability.
Nobody had previously looked at these issues at such a scale or for such a high-profile event. While we learnt from green initiatives of previous Host Cities, there was no real baseline for us to start from. And we had always said we would look at sustainability in its fuller, holistic sense – more than just ‘green Games’.
Starting from scratchThe emphasis on sustainability and legacy in the London 2012 bid clearly struck a chord with the International Olympic Committee; it was also right in terms of timing and stakeholder opinion and expectations in the UK.
But for all that, it was still very much a novelty in terms of how you actually make the Games more sustainable in a meaningful way. LOCOG and the Olympic Delivery Authority (ODA) were literally start-up organisations, with few people, no history and no systems and processes in place. Yes, there were certain
milestones, clear deliverables and an immovable deadline to meet, but the route map was sketchy at best, and for sustainability pretty well non-existent.
In many ways, however, the start-up environment was ideal as there were no entrenched misconceptions about sustainability that can so often hold back progress in established organisations. We were also aided by the fact that sustainability had been a key element of the bid and as such was enshrined in the Host City Contract.
It was also a potentially fragile beginning. Cynics in those early days asked how long it would be before we started watering down our commitments. Much of that had been born of bitter experience of previous grand projects that had fallen short of early rhetoric on sustainability. London 2012 was going to be different – those inside knew it, but it would take a while for wider stakeholders to recognise the seriousness of the endeavour and the extent of our ambition.
We certainly didn’t always get it right, and along the way we learnt from our mistakes. But by continually being there from the beginning, asking the questions and seeking better ways of doing things, we gave ourselves the opportunity to choose.
London 2012 has been the result of all these choices. Every one that we and our suppliers and partners made had an impact on the success of the Games as well as on the environment, the community and our legacy.

12A legacy of change
The architecture of sustainable GamesWhile this report is primarily about what we achieved at the Games, it all stems from the early work at the beginning of the project which set the foundations for future success.
The overarching framework for the London 2012 sustainability programme was the London 2012 Sustainability Policy (July 2006) and the London 2012 Sustainability Plan, ‘Towards a One Planet 2012’ (November 2007). These were issued by the Olympic Board, representing the Government, the Mayor of London, the British Olympic Association and London 2012. Both documents were revised and reissued in December 2009.
The London 2012 Sustainability Plan took a programme-wide approach covering all three of the key phases: preparation, Games and legacy, and built on the commitments set out in the London 2012 Candidature File and related bid documents. These were grouped into five priority themes:
– Climate change
– Waste
– Biodiversity
– Inclusion
– Healthy living
Many specific projects and workstreams were developed to address key aspects of each of these themes.
Underpinning all this are three key strands that ran through our programme and which have significant legacy potential:
– Sustainability management system
– Independent assurance
– Sustainability reporting
London 2012 was the inspiration for the development of BS 8901, which in turn led to ISO 20121, the first fully certifiable international Sustainability Management System standard. By 2011 both LOCOG and the ODA were third-party certified to BS 8901 (2009) and they both transitioned to ISO 20121 shortly after its launch in June 2012. The London Legacy Development Corporation is also committed to achieving this standard, while the Greater London Authority achieved BS 8901 certification in April 2012 for its city operations work.
The second strand was assurance. During the bid we recognised the potential value of having an independent voice to keep track of our programme and, indeed, to keep us on track. The Commission for a Sustainable London 2012 was set up in early 2007 specifically for this purpose. Over the last five years it has built up a strong portfolio of general and thematic reviews across the whole London 2012 programme. It was a step into the unknown when the Commission was set up, but it is certain that its continual presence and scrutiny across the programme has helped all the delivery bodies raise their game.
Aerial view of Olympic Park during the Games

13A legacy of change
Our third strand was reporting. In collaboration with the Global Reporting Initiative (GRI) and a number of international partners, including the International Olympic Committee (IOC), we supported the development of an Event Organisers Sector Supplement of the GRI sustainability reporting guidelines. We applied this internationally recognised framework to our annual sustainability reports issued in spring 2011 and 2012, the latter receiving a GRI check to level ‘A’ based on the new Event Organisers Sector Supplement.
Key challenges and choicesWhile our greatest advantage had been our presence from the start of the project, ensuring that sustainability became an integral part of policies and processes, our greatest challenge was to stay with the pace as the organisation grew and the programme intensified.
LOCOG started in 2005 with fewer than 50 people transitioning from the bid team. We were an SME and effectively remained so for the next four years. It was only in 2010 that we expanded beyond 500 employees, rising to over 8,000 by Games time. It was relatively simple creating a culture of sustainability among a few dozen peers; quite another among hundreds and then thousands.
Five key tactical choices enabled us to keep the sustainability programme on track through this environment of constant change, while always remaining a small core team:
– The Sustainability team was placed within the central strategy and planning department, which gave us good access to what was going on.
– We focused our efforts on procurement and workforce training as two key areas where our influence would have maximum effect across the organisation.
– We leveraged partnerships with sponsors and external organisations to bolster the strength of the team.
– Operational functions – such as catering, transport, logistics and technology – were empowered to deliver key sustainability objectives.
– As the organisation grew, Sustainability team members were embedded in other departments, notably in Venues and Infrastructure, Ceremonies and Communications to provide hands-on support where it could be most effective.
Even with all these elements it was still a massive undertaking and we had to focus on priorities while taking account of risks and opportunities. The targets set out in LOCOG’s Sustainability Strategy, coupled with the disciplines of a sustainability management system, continual assurance by CSL and effective partnership working, were essential to our eventual success.
Sustainability teams in other London 2012 delivery bodies had also worked hard to manage the challenges of rapidly increasing scale and intensity over the course of the project.
Women’s Road Cycle race at Box Hill, Surrey, 29 July. Local conservationists applauded LOCOG’s efforts to protect the ecologically sensitive chalk grasslands on this site.
Putting final touches to safeguarding protected wildlife habitat at Hadleigh Farm, Essex, Mountain Bike venue.

14A legacy of change
Sustainability at the GamesIn the final few months leading up to and during the Games, the Sustainability team had two primary roles: first to ensure compliance with regulatory environmental obligations, as well as our own sustainability requirements, and second to promote the London 2012 sustainability story. At our peak during the Olympic Games we had a team of 21 staff and 14 volunteer Games Makers (most of whom were sustainability professionals). This was split roughly 25 for compliance monitoring and 10 for stakeholder engagement and communications support.
The compliance monitoring team operated on a roving basis across clusters of venues to ensure we had an active presence at all LOCOG venues, with special focus on priority sites such as Greenwich Park, Weymouth and Portland, Box Hill, Eton Dorney, Hadleigh Farm and the Olympic Park. The team also had a key role in managing the relationship with statutory agencies and assurance bodies. Staff from the Environment Agency, Natural England, the National Trust and Royal Parks also played a complementary role in supporting our work.
The engagement team was based in the Main Press Centre on the Olympic Park and focused on managing a programme of media and stakeholder tours of the Park. They were also responsible for the sustainability sessions of the official Olympic and Paralympic Observer Programmes run by the IOC and IPC respectively for future Host Cities and Candidate Cities as part of the Transfer of Knowledge Programme.
An initiative to engage athletes in sustainability operated out of the One Planet Centre in the Olympic and Paralympic Village. This was managed by BioRegional in partnership with Coca-Cola and LOCOG, with funding from Defra.
Several London 2012 commercial partners were actively engaged in promoting sustainability on the Olympic Park during the Games: BP and Cisco with their interactive pods as part of the ‘Walk in the Olympic Park’ project; BP, BMW and EDF with their main showcases highlighting their sustainability initiatives and products; and Coca-Cola’s roving team of ‘Recycling Ambassadors’.
LOCOG Sustainability team, July 2012
15A legacy of change
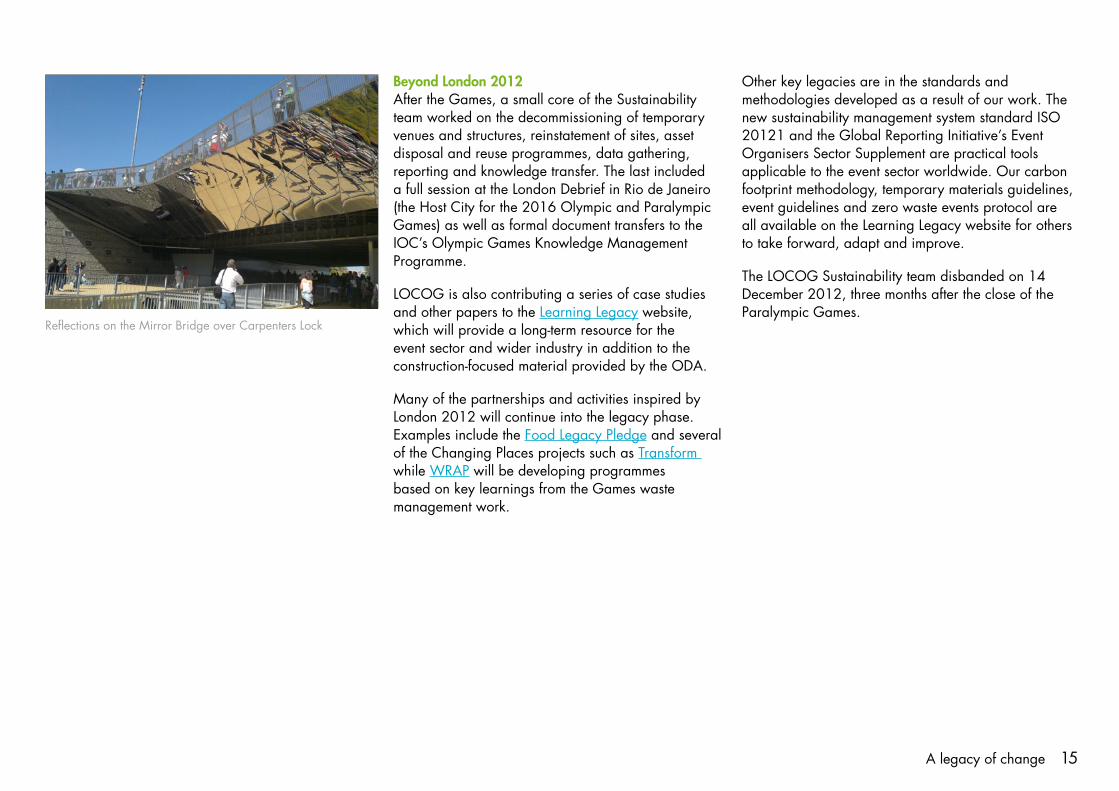
Beyond London 2012After the Games, a small core of the Sustainability team worked on the decommissioning of temporary venues and structures, reinstatement of sites, asset disposal and reuse programmes, data gathering, reporting and knowledge transfer. The last included a full session at the London Debrief in Rio de Janeiro (the Host City for the 2016 Olympic and Paralympic Games) as well as formal document transfers to the IOC’s Olympic Games Knowledge Management Programme.
LOCOG is also contributing a series of case studies and other papers to the Learning Legacy website, which will provide a long-term resource for the event sector and wider industry in addition to the construction-focused material provided by the ODA.
Many of the partnerships and activities inspired by London 2012 will continue into the legacy phase. Examples include the Food Legacy Pledge and several of the Changing Places projects such as Transform while WRAP will be developing programmes based on key learnings from the Games waste management work.
Other key legacies are in the standards and methodologies developed as a result of our work. The new sustainability management system standard ISO 20121 and the Global Reporting Initiative’s Event Organisers Sector Supplement are practical tools applicable to the event sector worldwide. Our carbon footprint methodology, temporary materials guidelines, event guidelines and zero waste events protocol are all available on the Learning Legacy website for others to take forward, adapt and improve.
The LOCOG Sustainability team disbanded on 14 December 2012, three months after the close of the Paralympic Games.
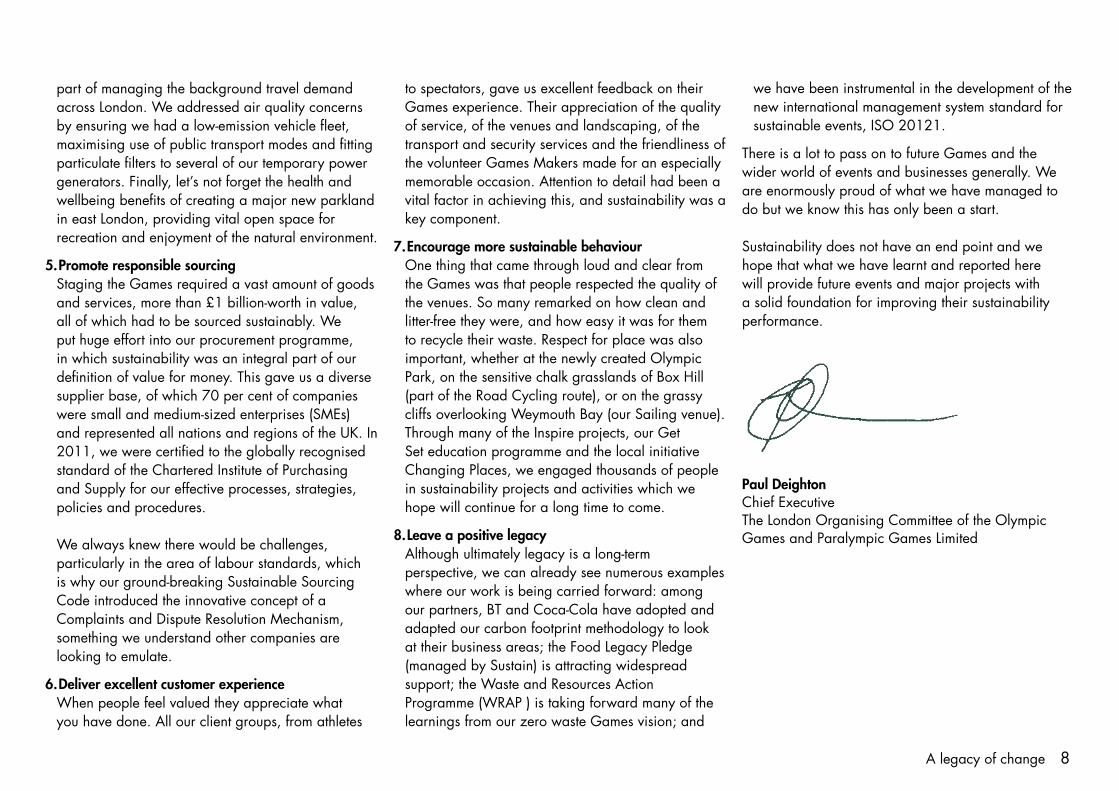
Reflections on the Mirror Bridge over Carpenters Lock

16A legacy of change 16A legacy of changeBeach volleyball venue at Horse Guards Parade

17A legacy of change
Since the development of the bid, we have been working with our stakeholders to define and test our approach to sustainability. As we got closer to the Games, we wanted to know what they cared most about. In 2011, we identified their priority issues through a materiality review process. We consulted representatives from each of our 12 stakeholder groups through an online survey, in-depth interviews and a series of workshops carried out by Futerra. For more information on the materiality review and how we have applied the outcomes to our reporting and communications, please see ‘About this report’ on pages 16-19 of our main Pre-Games Sustainability Report.
The issues of most interest to our stakeholders mapped closely with our themes, but have a slightly different emphasis.
Stakeholder priority issues – Carbon management to deliver a low carbon Games
– Delivering a zero waste Games
– Providing sustainable and accessible transport solutions
– Using the Games to showcase the economic benefits of sustainability
– Promoting sustainable living by making sustainability a visible part of the Games
– Ensuring the Olympic Park legacy contributes to the regeneration of communities in east London
The following sections provide an update on each of these priority areas.
Stakeholder priorities
The London 2012 Gardens flanking the restored Waterworks River

18A legacy of change
Our approachDelivering a low carbon Games was one of our flagship sustainability commitments. In part this was framed by the strategic choices to use existing venues wherever practical, to build new permanent venues only where there was a strong legacy case and, finally, to use temporary structures for all other needs. This approach, coupled with the compact nature of the Olympic Park and commitment to investing in and utilising public transport systems and a new utilities infrastructure, provided a strong foundation for our low carbon plans.
Unlike the process of accounting for the carbon emissions of an average organisation, measuring carbon for an event the size of the Games presents many challenges: there are no standards to provide guidance, there are many unpredictable elements, and the whole production evolves, with decisions taken dynamically, right up to the end. There was little available information upon which to base an effective and measurable carbon management strategy.
To overcome this knowledge gap, we developed a new methodology that gave us a forward-looking, predictive model of our likely carbon emissions, which we called a reference footprint.
When we first started this exercise in late 2007, we inevitably had a limited understanding of the full scale of the project, significant data gaps, or simply poor quality data, which meant we had to make many assumptions. Despite these limitations, we have been able to use the carbon footprinting as a valuable tool, allowing us to prioritise the areas where we were best positioned to avoid and minimise carbon emissions.
As we have progressed, we have been able to refine the original reference footprint (first published in December 2009) and map this against a more accurate reduction scenario based on projected carbon savings from revised operational plans. Without an initial baseline it is hard to evidence reductions, so the focus has been firmly on avoiding emissions in the first place.
Early on we took a number of key decisions: first, to account for all Games-related emissions covering the seven years from winning the bid to the end of the Games – we have not amortised them over the lifetime of the permanent venues. Second, we have included embodied carbon, not simply emissions from energy in use. Third, we defined a hierarchy to minimise the footprint through emission avoidance, reduction, substitution measures and compensation.
‘The innovative approach to minimising the carbon footprint of the Games, coupled with the transparent honesty in confronting head-on those areas where performance is difficult to measure give us for the first time a benchmark which all other projects can use and aspire to improve upon.‘
Tim Smit Chief Executive an Co-Founder of the Eden Project and
London 2012 Sustainability Ambassador
Low carbon Games

19A legacy of change
We recognised that the final, actual footprint would nevertheless be a substantial figure. We therefore developed a broad approach to carbon compensation, embracing knowledge transfer, asset disposal, local retro-fitting projects, behavioural change initiatives and conventional carbon offsetting. The legacy of these initiatives will be significant but we do not make any claims about being ‘carbon neutral’ as the measurability and boundary definition of many of these initiatives is imprecise.
Our carbon management highlightsLondon 2012 carbon footprintEarly estimates put London 2012’s total carbon footprint at 3.4m tonnes of carbon dioxide equivalents (tCO2e). This figure encompassed all construction works (of which the Olympic Park was the most significant) and all new transport infrastructure (primarily rail extensions) as well as the impacts of
spectators and, of course, the staging of the Olympic and Paralympic Games themselves.
This overall figure was split into ‘owned’, ‘shared’ and ‘associated’ emissions. The last are essentially consequential impacts of hosting the Games – primarily spectator travel and accommodation – over which organisers may have some influence but no real control. In contrast, the ‘owned’ emissions are a result of direct decisions by the London 2012 delivery bodies, and it is in these areas where we have focused our carbon reduction efforts.
Across the programme we are able to report savings of approximately 400 ktCO2e against the reference footprint. These were achieved across both construction and staging of the Games, principally through design modifications, materials selection, procurement policies and operational interventions during the Games. However, given the huge
Figure 1: Original London 2012 reference footprint – ktCO2e (2009)
Figure 2: Actual measured London 2012 carbon footprint –ktCO2e (2012)
1,728400
730
Total 3.4MtCO2e
988
311
1,442
Total 3.3MtCO2e
Construction (ODA owned)
Transport infrastructure (ODA owned)
Transport infrastructure (non-ODA)
Operations (LOCOG owned)
Spectators (and other associated emissions)
429
161429
159
20A legacy of change
popular success of the London Games, which included 15m people lining the route of the Olympic Torch Relay and full venues throughout the Games, the component of associated spectator-related emissions was inevitably larger than originally estimated. This translates into a final overall carbon footprint of 3.3m tCO2e.
The reductions in the construction and transport infrastructure segments were achieved pre-Games. The two particular areas to consider here are the spectator and operations footprints which have both been updated using actual consumption data collected during and after the Games.
Carbon footprint of the GamesPrior to the Games, the greatest uncertainty was in the LOCOG-owned emissions. These are primarily linked to activities which peak during, or near to, Games time: venue energy use, transport services, the supply
and use of temporary materials and so on. A full list of those LOCOG-owned emissions sources identified and estimated in previous sustainability reports is given in Table 1 along with pre-Games estimates from 2009, 2011 and 2012.
In the pre-Games sustainability report, published in April 2012, the LOCOG reference footprint was estimated at 420 ktCO2e. This was based on best estimates available up to the end of 2011. It was predicted that the actual footprint could be as low as 326 ktCO2e (a fall of 22 per cent) if all reduction commitments were implemented.
A final pre-Games reference footprint for LOCOG is shown below to be 434 ktCO2e. This includes two additional elements (extra hotel accommodation and two hotel ships) that had not been anticipated in the 2011 iteration of the reference footprint.
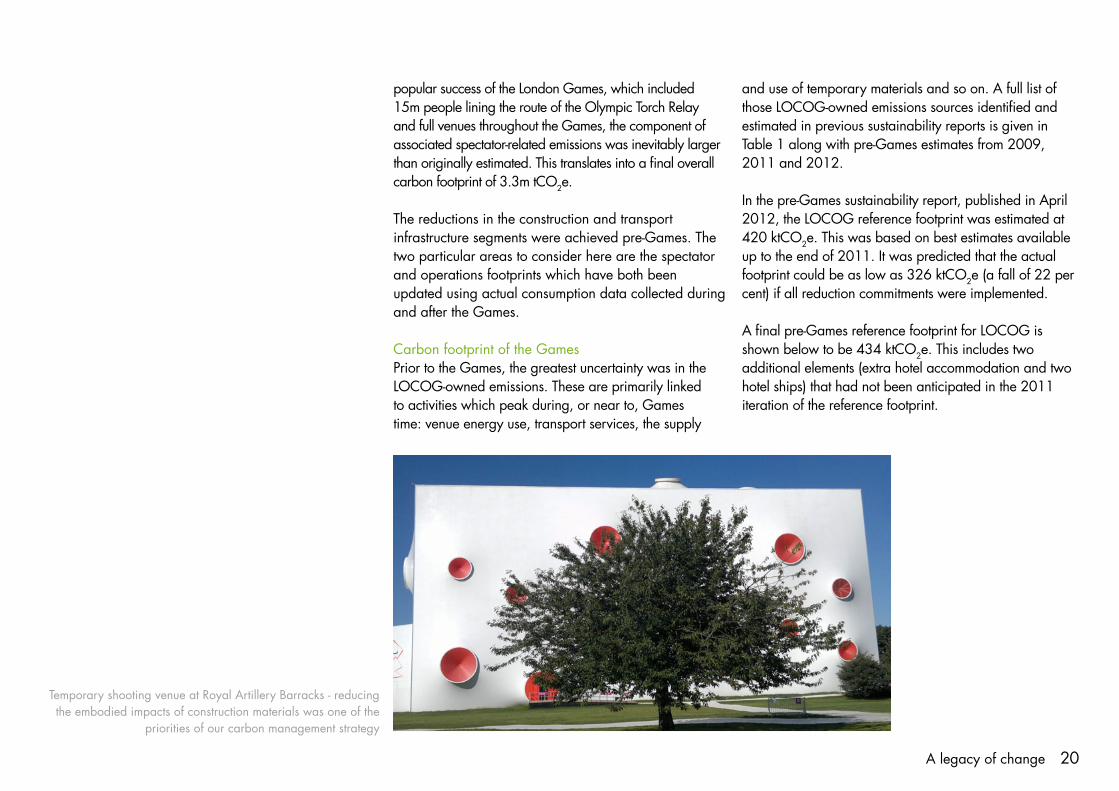
Temporary shooting venue at Royal Artillery Barracks - reducing the embodied impacts of construction materials was one of the
priorities of our carbon management strategy

21A legacy of change
Taking all these elements into account, our final post-Games estimated footprint of 311 ktCO2e shows an actual reduction of 28 per cent from the revised reference case. Significant changes are summarised below. For further details see the Learning Legacy website.
The continual oscillation of the reference footprint is a reflection on the original lack of high-quality data and knowledge of the scope of the project in the early days. The importance of this exercise is therefore more in the benchmarking value of the final actual footprint, rather than the notional reductions.Areas where the carbon footprinting information did lead to changes in our plans and operations principally related to our hiring strategy for overlay, which was also extended to FF&E and sports equipment. In terms of overlay alone this ‘saved’ 64 per cent of the potential impact of this element because all the hired materials and equipment can be used for their lifetime in the marketplace rather than being customised for one use only.
Venue energy use shows a drop of 31 ktCO2e (34 per cent) from the reference footprint. This massively exceeds the 6 ktCO2e savings target we had set in lieu of the use of on-site renewables, as detailed in our previous sustainability reports. We know that a significant proportion of this is due to over-specification and safety margins, rather than real savings, but given the order of magnitude we are confident that we did implement sufficient measures to exceed our target.
Smaller savings were realised in other areas. Transport services showed some savings; anecdotal evidence suggests that many officials, media and teams opted to use existing public transport services instead. The Torch Relay was kept within the UK, avoiding the long international flights of previous Relays. In IT services, some equipment hiring late in the pre-Games period provided small savings.
429
0
100
200
300
400
500
Revised (2012) reference footprint
Actual footprint 2012
Figure 3: LOCOG owned GHG emissions (ktCO2e)Other smaller items
Ceremonies and culture
Games workforce and athletes
Travel grants
Transport services
IT services
Furniture, Fixtures and Equipment (FF&E)
Overlay
Venue energy use
Additional accommodation

22A legacy of change
There was an increase in travel grants (LOCOG funding for athletes and team officials travelling to the Games). The number of grants was 43 per cent higher than the 2009 forecast, though most of the additional trips were in short-haul range. 11 per cent of grants were taken on Eurostar instead of air, providing some carbon savings.
Spectator carbon footprintThe original reference footprint used the best available estimates of spectator numbers, points of origin and travel modes that were available in 2009. Spectator numbers substantially exceeded expectations leading to an increased ‘actual’ footprint for spectators from 670 to 913 ktCO2e. This increase was mainly due to the impact of travel, but also includes revised estimates for accommodation, catering, merchandise and waste.
429
LOCOG owned
Original (2009)
reference footprint
(ktCO2)
Revised (2011)
reference footprint (ktCO2e)
Revised (2012)
reference footprint (ktCO2e)
Actual footprint
2012 (ktCO2e)
Venue energy use 15 95 91 60
Overlay 152 131 131 47
Furniture, Fixtures and Equipment (FF&E) 47 40 40 38
IT services 50 39 39 37
Transport services 34 11 13 11
Travel grants 29 29 29 31
Games workforce and athletes 16 16 16 15
Ceremonies and culture 8 8 8 5
of which Torch Relay 3.5 3.9 3.5 1.0
Other smaller items 51 51 51 51
Subtotal 400 420 418 296
Additional accommodation - - 12 12
Hotel ships - - 4 4
Total 400 420 434 311
Table 1: LOCOG owned Greenhouse Gas emissions
1. The data in this table is presented in thousands of tonnes of carbon dioxide equivalents (ktCO2e) and is therefore subject to rounding.
Notes

23A legacy of change
Following the publication of the second edition of the London 2012 Transport Plan (May 2011), we looked in more detail at the potential carbon footprint of spectator transport journeys to and from the Games (by road, rail and air). This was updated using actual travel data following the Games.
To provide a realistic assessment of the impact of the Transport Plan, the calculated emissions from domestic spectator travel have been compared to a ‘business as usual’ reference case based on existing travel patterns within the UK for which data is readily available. This comparison shows a 30 per cent reduction in the carbon footprint for 2012 actual travel (see Figure 4). Overall this translates into a six per cent reduction when spectator travel outside of the UK is included. In other words, the Transport Plan had succeeded
in changing travel patterns, shifting people to more sustainable forms of transport at Games time.
There is little that London 2012 could have done to impact directly on the majority of the spectator travel footprint as it was largely made up of air travel by overseas visitors. To try and compensate for the carbon arising from these journeys and increase awareness of the carbon impact of travel, London 2012 sustainability partner BP Target Neutral initiated free carbon offsetting to spectators and teams. This captured more than 500,000 individual return journeys, offsetting more than 99,000 tonnes of CO2e arising from travel.
Figure 4: Spectator travel within the UK - 'Business as usual' reference case compared to 2012 actual travel (tonnes CO2e)
Air
Coach
Car
P&R Coach
UK train
Underground
DLR
Taxi
0
20,000
40,000
60,000
80,000
100,000
120,000
140,000
160,000
Business as usual 2012 Actual
2

24A legacy of change
Lessons for the futureBy carbon footprinting the event we were able from the early stages to provide a predictive impact assessment, and thereby inform decisions to minimise these impacts. The methodology we have pioneered, along with the detailed information we have gathered on energy and resource use, quantities and types of materials and scope of Games activities, have now been banked as vital knowledge for the benefit of future major projects and events.
Our approach was also able to highlight the importance of embodied impacts and the different life cycle considerations to take account for temporary structures and materials. The importance of post-event reuse of equipment, materials and other assets must not be underestimated and this is where huge savings can be achieved (or costs incurred). The footprinting work helped us optimise venue designs, procurement strategies and material specifications. Through this we achieved the most significant carbon savings. However, more opportunities were identified late in the procurement process, such as the use of hired IT equipment, which could have yielded greater savings if implemented earlier.
Care should be taken, however, as it also meant we underplayed the significance of direct energy consumption and other resource use until late in the programme. Our initial 2009 work showed a low footprint for this area. The priority of LOCOG’s energy team had to be to ensure sufficient energy supply, both from mains electricity and temporary power generators, to meet the anticipated demand. Their work relied on designing for the energy demand requests from the different operational areas.
Without a remit for energy conservation, this resulted in cautiously high forecasts of energy use (shown as the 2012 reference case). The major users were field of play lighting, broadcasting and technology.
The actual electricity use from grid and generators was considerably lower than these forecasts, as shown in Table 1, and a portion of this apparent saving was due to efficiency measures and energy management over the whole period; the remainder represents safety margins. Inevitably, there will always be an element of over-scoping to ensure adequate safety margins, but this has provided future events with a much clearer benchmark of real energy demands that will help them configure their power solutions in a more optimal way. We know these figures could have been driven down further with an earlier and more concentrated focus on energy conservation.
In terms of carbon compensation, the potential benefits from the wider uptake of our footprinting methodology and more optimal energy demand and generator configurations based on our learnings should lead to further major savings. The asset disposal and reuse programme has also been a major factor in our compensation strategy (see ‘Zero waste Games’ chapter).
There are significant carbon emissions associated with major events and these should remain a key area of focus for future organisers.
One of seven micro-wind turbines on the Olympic Park that provided a visible dimension to the low carbon Games, while the low embodied carbon of the materials used in venue construction achieved some of our biggest wins.

25A legacy of change
Our approachThe management of resources at a major global event like the Games is absolutely vital to the successful operation of venues and official facilities. Waste and resource management is undoubtedly one of the more visible elements of the Games sustainability performance.
London 2012, and its partners, aimed to ensure that waste was minimised throughout the programme, from planning to legacy. A development on the scale of the Olympic Park and an event on the scale of the Games provided the opportunity to create a micro-economy of resource efficiency, putting in place the infrastructure and processes to minimise waste and to maximise reuse and recycling.
The Olympic Delivery Authority more than delivered on its challenging reuse and recycling targets and its sustainability performance has been described as ‘game-changing for the construction industry’ by the Commission for a Sustainable London 2012.
LOCOG’s commitment to deliver the first zero waste to landfill Games was no less challenging and is regarded as one of its flagship sustainability targets. If that was not enough, we also set ourselves unprecedented reuse, recycling and composting targets for the Games. To get anywhere close to these targets on an operation on the scale of the Games would represent a significant step change in waste performance at major events in the UK, and perhaps for wider industry too.
Key Games targets – Ensure that no waste arising within ‘closed venues’ (sites managed by LOCOG where access is restricted) during the operational period will be sent directly to landfill.
– Ensure that at least 70 per cent, by weight, of operational waste is reused, recycled or composted.
– Take reasonable endeavours to reuse or recycle at least 90 per cent, by weight, of the material arising from the installation and decommissioning of our venues (stretch target)2 .
Events are high pace and high intensity activities in compressed, fixed timescales. These challenges are compounded by complexities of the supply chain, diverse and inconsistent packaging specifications, inconsistent waste and recycling collection systems, and inconsistent messaging and communications at venues regionally and nationally. Perhaps the biggest challenge of all was to predict how people would behave on the day in an environment where recycling would not necessarily be front of mind. These complex challenges required a unique approach.
After several years of research, analysis and consultations with industry and sustainability experts, advisory groups and key partners, we published our Zero Waste Games Vision in February 2012. This detailed the steps that we, and our partners, intended to take to deliver our zero waste Games commitment. It also complemented our overarching commitment to stage a low carbon Games.
Zero waste Games
‘The ambitious target to make London 2012 the first Zero Waste Games has been achieved through LOCOG’s detailed planning, innovation and partnership approach. This is something other events can and should aspire to do‘.
Dr Liz Goodwin Chief Executive
Waste and Resources Action Programme (WRAP)
2Temporary construction works and facilities (otherwise known as ‘overlay’) supplemented to venues that are required to run the event (for example, portable buildings, tents, security screening areas, furniture, fences, sports surfaces, banners, and flags).
26A legacy of change
We were able to take a centrally managed approach to delivering on our waste and resource management obligations. We identified areas up front that had the potential to create waste and then employed strategies which avoided waste in the first place, or we targeted solutions for reuse or recycling.
Securing the right delivery partners and robust contracts was also essential. We established strict requirements on zero landfill, reporting, supporting reuse objectives, provision for revenue sharing and the need for approval before any facilities (recycling, composting, and so on) could be used.
We took action across 10 critical success factors3 that we identified as being crucial to delivering our targets. The Zero Waste Games Vision set out these actions in more detail and we are pleased to report that we made excellent progress against each of them. We recognise the opportunity for the principles and practices we have developed to be used more widely. There is a suite of documents prepared by LOCOG and our partners covering more detail on a range of topics of relevance to our Zero Waste Games Vision on the Learning Legacy website4. WRAP has also commissioned additional pieces of evaluation work connected with the Games. At the time of writing (November 2012) much of this work has yet to be completed and will be reported as part of WRAP’s wider work on the Event Industry Roadmap5 in spring 2013.
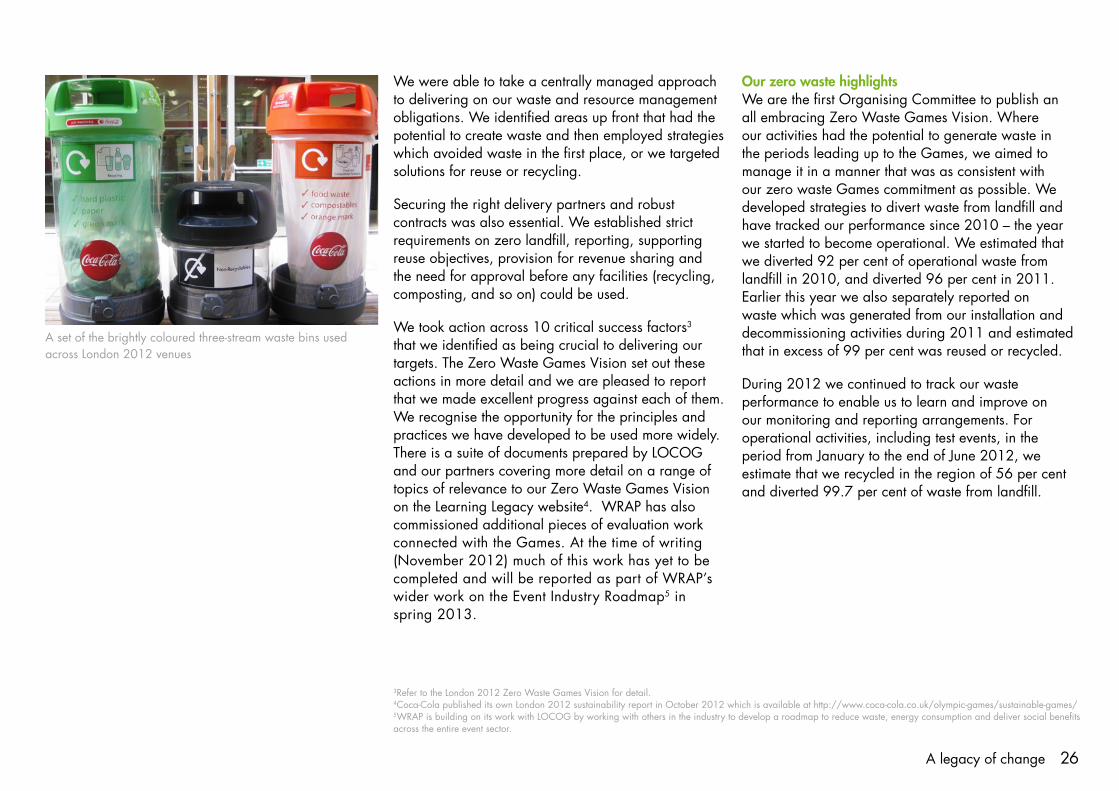
Our zero waste highlightsWe are the first Organising Committee to publish an all embracing Zero Waste Games Vision. Where our activities had the potential to generate waste in the periods leading up to the Games, we aimed to manage it in a manner that was as consistent with our zero waste Games commitment as possible. We developed strategies to divert waste from landfill and have tracked our performance since 2010 – the year we started to become operational. We estimated that we diverted 92 per cent of operational waste from landfill in 2010, and diverted 96 per cent in 2011. Earlier this year we also separately reported on waste which was generated from our installation and decommissioning activities during 2011 and estimated that in excess of 99 per cent was reused or recycled.
During 2012 we continued to track our waste performance to enable us to learn and improve on our monitoring and reporting arrangements. For operational activities, including test events, in the period from January to the end of June 2012, we estimate that we recycled in the region of 56 per cent and diverted 99.7 per cent of waste from landfill.
A set of the brightly coloured three-stream waste bins used across London 2012 venues
3Refer to the London 2012 Zero Waste Games Vision for detail.
4Coca-Cola published its own London 2012 sustainability report in October 2012 which is available at http://www.coca-cola.co.uk/olympic-games/sustainable-games/ 5WRAP is building on its work with LOCOG by working with others in the industry to develop a roadmap to reduce waste, energy consumption and deliver social benefits across the entire event sector.

27A legacy of change
Games reuse, recycling and composting performanceDuring the Games period6 we diverted 100 per cent of event operations waste from landfill.
Our initial figure for reuse, recycling and composting amounted to 82 per cent, significantly exceeding our 70 per cent target. This was calculated in the same way that most businesses in the UK report on their waste performance: by measuring the proportion of different streams leaving their sites or venues.
However, our experience from following up the fate of waste leaving venues suggests that reporting on this basis is misleading and does not clarify the true end fate of the waste. The bulk of commercial waste is normally comingled with waste from other producers at an intermediary site such as a transfer station or Materials Recovery Facility (MRF), so there is no way of knowing how much is truly recycled. Levels of contamination in
the streams and efficiencies of treatment facilities are therefore not generally taken into account.
In contrast, we were uniquely able to dig deeper into these figures as we had exclusive use of SITA UK’s MRF in Barking for 78 days from 1 July 2012 and a contractual requirement to track all waste to its end processes – which many businesses in the UK do not do. 93 per cent of all waste collected from London 2012 venues was taken to this site. This tracking showed the true reuse, recycling and composting rate was 62 per cent.
Our reuse data contributed to the overall 70 per cent target. Reuse is likely to be under-reported with several items such as surplus uniforms, medical consumables and tools in the process of being sold or donated to charitable causes at the time of writing. Table 2 provides a summary of event operations waste performance during the Games.
Method Tonnes Percentage of total
Re-use 1,716 17
Recycling 2,908 29
Composting 1,706 17
Recovery
– Energy recovery 3,795 37
– Other recovery 48 0.5
– Treatment (Hazardous) 0.003 0
Incineration 0.3 0
Landfill 0 0
Total 10,173
% of total waste re-used, recycled and composted 62%
% of total waste diverted from landfill 100%
Table 2: Waste generated in connection with operational activities during the Games
6We said in our Zero Waste Games Vision that we would report on our targets in a way that was relevant to our venues. The reporting period for event operations is 1 July to 31 October 2012, to allow for the fact that some items took longer to be collected for reuse or recycling (for example, many surplus event-related items such as office paper, sports equipment, and so on were first returned to our logistics depots). The bulk of the waste, however, was generated in the period from 1 July to 12 September 2012.
1. The data in this table is subject to rounding.
2. Supporting footnotes are available in a case study on the Learning Legacy website.
3. Does not include discrete data associated with London 2012 Ceremonies (this is available in a separate case study on the Learning Legacy website) or waste collected via pedestrian and vehicle screening areas as this was outside the scope of our targets (around 200 tonnes was collected and 50 per cent was recycled). Although again outside the scope of our targets, data from ODA managed transport hubs and park-and-ride facilities was not available at the time of writing.
Notes
28A legacy of change
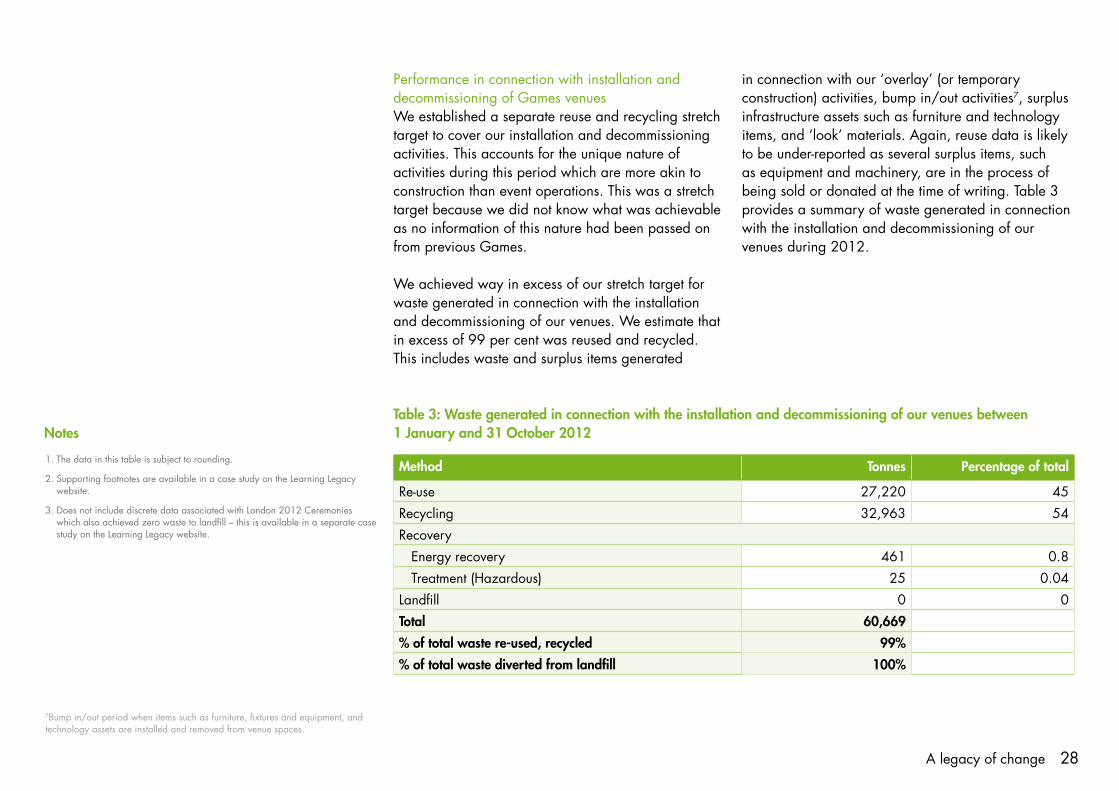
Performance in connection with installation and decommissioning of Games venuesWe established a separate reuse and recycling stretch target to cover our installation and decommissioning activities. This accounts for the unique nature of activities during this period which are more akin to construction than event operations. This was a stretch target because we did not know what was achievable as no information of this nature had been passed on from previous Games.
We achieved way in excess of our stretch target for waste generated in connection with the installation and decommissioning of our venues. We estimate that in excess of 99 per cent was reused and recycled. This includes waste and surplus items generated
in connection with our ‘overlay’ (or temporary construction) activities, bump in/out activities7, surplus infrastructure assets such as furniture and technology items, and ‘look’ materials. Again, reuse data is likely to be under-reported as several surplus items, such as equipment and machinery, are in the process of being sold or donated at the time of writing. Table 3 provides a summary of waste generated in connection with the installation and decommissioning of our venues during 2012.
Method Tonnes Percentage of total
Re-use 27,220 45
Recycling 32,963 54
Recovery
Energy recovery 461 0.8
Treatment (Hazardous) 25 0.04
Landfill 0 0
Total 60,669
% of total waste re-used, recycled 99%
% of total waste diverted from landfill 100%
Table 3: Waste generated in connection with the installation and decommissioning of our venues between 1 January and 31 October 2012
1. The data in this table is subject to rounding.
2. Supporting footnotes are available in a case study on the Learning Legacy website.
3. Does not include discrete data associated with London 2012 Ceremonies which also achieved zero waste to landfill – this is available in a separate case study on the Learning Legacy website.
7Bump in/out period when items such as furniture, fixtures and equipment, and technology assets are installed and removed from venue spaces.
Notes

29A legacy of change
Engaging client groupsDuring the Games, the bulk of event waste (primarily food waste and associated packaging) was channelled into three primary streams: recycling; food and compostable packaging; and non-recyclables. These were colour coded and complemented by simple and consistent iconography. Colour-coded icons were on much of the food and drink packaging that was available in venues and corresponded to the waste bins themselves , which also had colour coordinated bin liners. We required our caterers to source the majority of their packaging from a single framework supply arrangement. This was to ensure that materials were streamlined and ideally compatible with either our recycling or compostables waste streams. While significant effort was made to integrate messaging into the design of collection systems and packaging we still needed to build awareness ahead of the Games to encourage our client groups (spectators, workforce, athletes, and so on) to recycle. We therefore developed and implemented a recycling communications strategy and campaign in partnership with WRAP.
The recycling communications campaign was aimed at the key waste producing audiences identified in a waste review conducted before the Games: spectators; workforce; press and broadcast; and athletes and officials. Communications materials including social media, spectator guides, workforce training materials and on-site newsletters were used to engage these audiences in recycling both before and during the Games. The major challenge of this campaign was to identify and successfully access communications channels within the timeframe of the project. The importance of early engagement of contractor staff was perhaps the biggest learning from the campaign. Top-down support
for sustainability objectives throughout the Organising Committee meant that weight was given to recycling messaging. However, the necessity for vital operational messages to be communicated during the Games limited the opportunity for recycling communications.
A similar pattern was evident within all key audiences. Some individuals, by far the majority, would make an obvious choice – whether right or wrong – as to which bin they put their waste in. Others would simply put their waste in the most convenient bin. During a spectator experience survey when asked to rate the ease of recycling during the Olympic Games, spectators scored it eight out of 10. 73 per cent of spectators surveyed during the Paralympic Games said that the waste stream logos on packaging made it clear which bin to put their waste in. However, around one in five of the spectators at the Paralympic Games were not aware of this recycling system .
Although contamination did occur in every stream, we believe arrangements worked relatively well for the bins in key areas such as the public realm, athlete dining areas and workforce break areas. Most individuals seemed to take notice and attempted to deposit items in the right bin – although they did not always make the right decision. We felt the quality of streaming in these areas was better than expected. These areas were typically better managed with less contamination than those under the responsibility of our caterers and broadcasters.
Colour-coded icons were used on food and drink packaging

30A legacy of change
Encouraging alignment of waste management practices at ‘open’ sitesWaste also occurred outside Games venues – for example, in the final approaches to venues, along Road Event and Torch Relay routes, and at events and Live Sites across London and the UK. Waste management at open sites like these presents different challenges and we continued to promote the Zero Waste Events Protocol as a practical guide for local authorities and other event organisers to understand the issues and implement consistent approaches.
Separate case studies giving lessons learned have been prepared, highlighting how waste was managed on the Olympic Torch Relay; in the look, wayfinding and signage programmes; and as part of the London City Operations programme. These are available on the Learning Legacy website.
Lessons for the futureOverall we are confident that we have demonstrated a system of event waste management that works and we have worked closely with WRAP to ensure the learnings are captured and taken forward. A summary of key lessons learned is below – but for more detail please refer to the Learning Legacy website.
Zero waste is a commendable and achievable aim. However, those wishing to achieve it must establish a clear vision and strategy for waste and resource management early on so that there is a common goal for everyone to work towards. The vision and strategy should consider specific opportunities and constraints and set key policies, objectives and targets that are challenging yet feasible. Key operational staff involved
in its delivery need to be fully supportive and have the appropriate skills and competencies. It is important to establish a positive partnership working relationship with your waste contractor early on. They also need to be fully supportive of your vision, in order to ensure continuity with what was proposed during their bid and with those involved in operational delivery, and must bring in the appropriate level of operational and technical expertise from the outset.
Materials are a resource and should not be wasted. 100 per cent diversion from landfill is relatively easy if the right contracting strategy is adopted. While energy recovery or other treatment technologies have a role to play for the foreseeable future greater emphasis should be put on targets, processes and infrastructure to deliver the highest levels of the waste hierarchy and optimise resource efficiency: first minimising waste and then maximising reuse opportunities. However, waste prevention is much harder to quantify than other aspects of the waste hierarchy. While we have attempted to quantify this we are likely to have significantly under-reported on our waste prevention efforts. There needs to be much greater guidance available to help businesses account for this more robustly.
We believe the 10 critical success factors that we identified as being crucial to delivering our targets were correct. There is some debate to be had over what is an appropriate number of streams for consumers to cope with. This needs to be considered in the context of the event/business and will very much depend on how much control you can exert over suppliers, the materials that are bought in and used and access to appropriate recycling facilities.
Recycling messaging over front-of-house bins

31A legacy of change
We believe that we would not have achieved the levels of recycling and composting we did with only two primary streams being in place, particularly in public realm and client group dining areas. Consistent and simple messaging, through which to engage all audiences, should be developed at an early stage. Messaging should communicate both the motivation for recycling and information required to recycle correctly. We believe that to avoid a continual ‘reinventing of the wheel’ there needs to be greater consistency (or streamlining) of materials used by contract caterers at a sectoral level; a move to a more consistent approach nationally to recycling communications (particularly in an ‘on the go’ context); and a proper consumer campaign around the On Pack Recycling Label scheme.
Strong contract management and support to contractors, particularly in areas where suppliers and contractors are responsible for significant waste production and disposal (for example, in kitchens) is vital to ensure recycling systems are communicated, understood and enforced at an operational level. This issue will be compounded where a significant number of temporary staff is used.
Processes for regularly monitoring and reporting waste arisings should be put in place so that performance can be analysed, benchmarked and/or improved. Again, we believe that an industry-wide reporting protocol needs to be developed, ideally by WRAP, to ensure businesses that wish to report and make claims about their waste performance do so accurately and transparently.
More than 85 per cent of spectators highly rated the cleanliness and absence of litter at Games venues

32A legacy of change
Our approachMore than 11m spectators attended the Games, along with a workforce of around 200,000, and tens of thousands of athletes, officials and dignitaries. This huge influx of people transformed London and proved an unprecedented test of the transport networks in the city as well as around the rest of the UK.
In addition to meeting the Games-time transport challenge, our aim was to maximise the long-term transport legacy benefits for London and the UK as a whole. These include the lasting physical improvement to transport infrastructure and the educational and inspirational role that the Games played in changing visitors’ behaviours towards using more sustainable modes of transport in the future.
Transport for the Olympic Games and Paralympic Games was delivered through a partnership between LOCOG’s Transport team, the ODA’s Transport team and Transport for London (TfL), who worked closely with a number of delivery partners including:
– Department for Transport
– Highways Agency
– Network Rail
– Train Operating Companies
– London and Continental Railways (LCR) including HS1 Ltd
– Other transport providers, including London boroughs and local authorities and transport operators across the UK
Below is a summary of sustainable and accessible transport achievements. For more detail please see the case study on the Learning Legacy website.
Sustainable and accessible transport highlights Public transport Games More than 9m Games Travelcards were issued for use on public transport within London (zones 1 to 9) and discounted fares were negotiated with train operating companies and national coach operators for travel within the UK. The Games Family were also provided with free public transport during the Games.
Sustainable and accessible transport Commitments at a glance
The London 2012 Transport Plan (www.london2012.com/transportplan) successfully delivered against its five key transport objectives:
– To provide safe, secure, inclusive, fast and reliable transport for the Games Family client groups.
– To provide frequent, reliable, friendly, inclusive, accessible, environmentally friendly and simple transport for spectators and visitors from around the UK and overseas.
– To leave positive lasting benefits and facilitate the regeneration of east London.
– To keep London and the rest of the UK moving during the Games and thus make it a positive experience to host the Games.
– To achieve maximum value for money for every pound spent on transport.
London 2012 won the Sustainable Transport at the Sustainability leaders Awards, December 2012

33A legacy of change
Transport modesA breakdown of spectator transport by mode for London venues is below.
Travelling to and from EuropeInternational rail was an important component of the transport provision and Eurostar carried many spectators from mainland Europe to and from the Games. Eurostar passenger numbers increased by four per cent during the Games compared to the same period in 2011.
The French, Belgian and Dutch Olympic teams and French and Belgian Paralympic teams travelled to London by Eurostar (with connections where applicable). Over the course of the Olympic Games Eurostar carried athletes and officials from more than 15 countries including New Zealand, Sri Lanka, USA and Canada.
Bus and coach Buses and coaches were the most suitable and sustainable transport solution for many journeys to the Games from towns and cities throughout the UK.
Services on offer included:
– Direct coach services to the Olympic Park, ExCeL, Greenwich Park, and Weymouth and Portland venues
– Strategic park-and-ride to the Olympic Park
– Venue local park-and-ride to minimise congestion
– Venue accessible shuttle services, including to nearby rail stations
– Enhanced local bus services
To ensure spectator bus and coach services were a lower carbon journey option, a significant majority of the combined fleet was less than five years old. All buses and coaches were required to meet the Euro IV standard or better for particulate (PM10) emissions. Mid-life vehicles underwent a thorough refurbishment and where necessary were retro-fitted with diesel particulate filters (DPFs) to minimise air pollution during Games time and in legacy.
Modes of arrival Olympic Park
Eton Dorney Lee Valley White Water Centre
Hadleigh Farm
Rail 86 49 49 34
Park-and-ride 3 38 20 30
Private coach 3 3 2 2
Walk/cycle 3 5 8 13
Other 5 5 21 21
Table 4: Olympic Games: spectator transport by mode for selected London 2012 venues (%)
The high speed Javelin Service between St Pancras International, Stratford International and Ebbsfleet was a key element of the rail network serving the Olympic Park

34A legacy of change
Other transport modesTaxis and private hire vehicles (PHV) provided a level of flexibility not offered by other transport modes. In particular, they provided an accessible travel alternative for those with special needs and impairments. TfL and the ODA worked closely with the trade and licensing authorities to integrate taxis and PHVs into Games transport operations, providing drop-off and pick-up locations at all Games venues.
Transport by water was a small but important element of Games transport. Greenwich Park, North Greenwich Arena and The Royal Artillery Barracks were all served by river services. The ODA contributed to TfL pier enhancements at Tower Pier for central London venues and Greenwich Pier for Greenwich Park.
The cable car installed by TfL ahead of the Games became a highlight for many spectators travelling across the Thames between North Greenwich Arena and ExCeL.
Accessibility and public transportAccessibility was integrated throughout all transport planning, demand forecasting, infrastructure improvements and venue transport operations.
To facilitate the increase in demand and to meet accessibility requirements, significant capacity enhancement work was undertaken at key transport nodes. Access improvement works at more than 90 national rail stations were completed by Games time. Some of these were completed by the ODA in partnership with train operating companies and the Department for Transport’s ‘Access for All’ programme, including access ramps, platform seating, lifts and accessible toilets.
A number of London Underground key stations were also identified as potential hotspots ahead of the Games, and further demand assessments were undertaken at these locations. Consequently, appropriate mitigations were identified to cope with wheelchair demand and people with restricted mobility at these locations. In addition, to complement existing public transport, all park-and-ride sites provided pre-booked accessible parking spaces and shuttle services were suitable for disabled spectators. These services were free for blue badge holders or members of a national equivalent scheme.
Improvements were also made to information for disabled users, including the delivery of an Accessible Spectator Journey Planner, ensuring call centres and booking websites had the right information, targeted emails and information on the Get Ahead of the Games website.
Approximately 40,000 wheelchair users attended ticketed events during the Olympic and Paralympic Games.
Travel managementTravel Demand Management (TDM) was a key part of the transport success story during the Games. The ODA initiated a TDM programme for London 2012, for which TfL took responsibility in 2011, to encourage key groups of travellers during the Games, including commuters, visitors to London, businesses and the freight industry, to change their travel behaviours.
Spectators arriving at Stratford

35A legacy of change
The TDM programme included Travel Advice for Businesses, and Traveller Information Services. Walking and cycling also played an important role in the transport of Games visitors and also for non-Games related journeys. Further information was provided on the London 2012 website and detailed travel information and ‘hotspot’ maps were made publicly available on the Get Ahead of the Games website.
The Spectator Journey Planner (SJP) enabled spectators to plan their journeys on the London 2012 website. The site allowed spectators to select their preferred travel options, including accessible travel, and directed users to booking facilities for the selected journey.
As a result, the public transport system was able to carry more people than ever before, with more than 62m journeys made on the Tube during the Olympic Games (up 35 per cent on normal levels), 6.9m journeys on the DLR (up by more than 100 per cent on normal levels) and 6.4m journeys on London Overground (up 26 per cent on normal 2012 levels). Traffic flows in central and inner London were down by 16.3 per cent in the morning peak and 9.4 per cent in the late afternoon/evening peak on normal levels during the Olympic Games, and down by 10.4 per cent in the morning peak and 2.3 per cent in the late afternoon/evening peak during the Paralympic Games. Serious and severe disruption was also down, by 20 per cent during the Olympic Games, helping to keep the capital’s roads running smoothly.
London 2012 Active Travel programmeThe London 2012 Active Travel programme (ATP) was developed to encourage more walking and cycling in the lead up to the Games, during the Games and in legacy. Below is a summary of ATP achievements; for more details please see the case study on the Learning Legacy website.
The programme was managed and delivered by TfL and London 2012 but drew together and promoted activity linked to the Games from a variety of stakeholders around the UK. London 2012 was the first Games to run a walking and cycling programme on this scale.
Hosting the Games was a fantastic opportunity to encourage those who wouldn’t usually consider walking or cycling to give it a go, particularly as public transport in London was busier than usual. The following incentives were provided:
– Secure cycle parking at every venue – more than 18,800 spaces were provided and operated by a range of organisations including LOCOG, TfL and the ODA.
– Free cycle maintenance service at selected venues over the Games period for spectators and staff.
– Guided walks and led cycle rides to many venues. These were led by trained staff and mainly aimed at inexperienced cyclists and families.
– Games-time messaging through spectator guides, workforce handbooks, spectator travel web pages, the SJP and activities on the Olympic Park promoting Inspire projects.
Secure cycle parking was provided at all competition venues
A fleet of shuttle buses transported spectators and workforce from railway stations and park and ride sites to Games venue

36A legacy of change
– New London cycle guide for the Olympic Park which highlighted cycle routes around the Park, temporary route diversions and spectator cycle parking.
– Easy to use cycle journey planner which offered spectators the choice of direct, quiet or recreational routes.
Businesses were supported to ensure resilience and enable staff and suppliers to alter their travel patterns. Walking and cycling were encouraged through promoting cycle training, cycle stands, guides, maps and cycle hire via seminars, workshops and online self-help materials.
Key achievements of the ATP were:
– More than 90 new walking and cycling projects were awarded the London 2012 Inspire mark.
– More than 2,500 spectators used the free cycle maintenance service over the Games period.
– Cycle parking usage varied between venues and events from 10 to 100 per cent. Feedback on the spectator cycle parking was very positive.
– More than 1,200 bicycles were security marked by the Metropolitan Police Cycle Task Force at the Olympic Park.
– Three per cent of spectators walked or cycled for part of their journey to the Olympic Park, rising to 17 per cent at Box Hill (Source: LOCOG spectator experience survey, October 2012).
– Measurements on bridges over the Thames during the Olympic Games indicated 20 per cent more cyclists and 22 per cent more people on foot, compared to the previous fortnight.
– Central London had 29 per cent more cyclists during the Olympic Games. In east London there were 58 per cent more cyclists and 158 per cent more pedestrians, indicating large increases in the areas most affected by the Games.
– At sites across London, the number of pedestrians counted was seven per cent higher during the Olympic Games and 18 per cent higher during the Paralympic Games compared to the same period last year.
Spectators walking to Eton Dorney

37A legacy of change
Games Family transportLOCOG was responsible for the safe, secure and reliable transportation of the Games Family, including bus and coach services for athletes and team officials, broadcasters and press, and technical officials, and for managing the deployment of 3,890 vehicles provided by BMW Group, the Official Automotive Partner.
The Games Family were encouraged to use public transport and all accredited clients also had free access to the London public transport network during the Games. Uptake by the Games Family was excellent with many quickly recognising that public transport was the best option for many of their journeys. As a result, demand for Games Family transport services was significantly lower than anticipated. For example, for the Games Family bus and coach fleet alone, 45 per cent less fuel was used than budgeted for over the course of the Games. All vehicles operated on BP ultimate fuels (including ultra low sulphur diesel) for cleaner emissions and improved fuel efficiency.
Average emissions across BMW Group UK’s supplied M1 vehicle fleet for London 2012 was 114g CO2/km (below the 120g CO2/km we stipulated). This average CO2 was achieved by including within the fleet a range of the latest BMW Group clean diesel, hybrid and electric vehicle technologies. More than 40 per cent of the fleet was also compliant with the forthcoming Euro 6 standards around nitrogen oxides (NOx) emissions. An additional 627 Multi Purpose Vehicles (MPVs) and minibuses were hired to meet additional client group demand which was
not anticipated when the BMW Group deal was negotiated. This resulted in the overall M1 fleet average increasing to 123g CO2/km which is still an unprecedented achievement given the size and nature of the fleet.
Our directly contracted bus and coach fleet comprised 1,297 vehicles in London, Weymouth, Eton Dorney and the five co-Host Cities. In addition there were approximately 450 midi-coaches and coaches contracted by our Coach Charter Programme for Marketing Partners, Ticketing Partners and Rate Card clients. All vehicles met the Euro IV standard or better for particulate (PM10) emissions as a minimum. The number of vehicles per Euro rating is shown in Table 5. The increase in pre Euro 4/IV was due to late changes, but overall we had a big swing to Euro 5/V, especially for buses in London which were the workhorses and did the most mileage.
A network of electric vehicle charging points is a significant legacy from the Games

38A legacy of change
All London 2012 venues operated according to our Low Emission Venue Policy. This set out specific criteria for emissions standards for all vehicles entering and operating within venues; that is, all Games Family vehicles and other client groups and service vehicles accredited to enter venues. Emissions standards are contained within Appendix B of the LOCOG Sustainable Sourcing Code (3rd edition). The standards complemented the Greater London Low Emission Zone but applied to all London 2012 venues across the UK. Compliance was determined from using vehicle age from flagged data supplied centrally by the Transport team. More than 93 per cent of the 22,100 accredited vehicles were determined to be in compliance with the policy. In addition, all golf buggies for logistics, event services and Games Mobility services were in compliance with the policy.
Lessons for the futurePublic transport, walking and cycling should be strongly promoted for all future events, in the UK and more widely. The measures chosen will depend on the scale of the event and the characteristics of the location. However, the principles of inspiring more active forms of travel through the staging of a major event and promoting as many travel options as possible, both for those travelling to the event and those that are temporarily impacted, can be applied easily elsewhere.
Initiating the programme as early as possible will help ensure this is embedded from the outset. This is particularly important in relation to infrastructure improvements but also to ensure prominent messaging.
Spectators leaving the Olympic Park for the Greenway walking route
Table 5: Number of vehicles per Euro rating
Number of vehicles Percentage of Games Family bus and coach fleet
contracted by LOCOG
Euro 2/3/II/III upgraded with traps to meet Euro 4/IV LEZ 189 15
Euro 4/IV 404 31
Euro 5/V 704 54
Total 1,297
Walking to the Greenway
1. Table does not include a breakdown of CCP vehicles – all were a minimum of Euro IV.
Notes

39A legacy of change
Key lessons of relevance to accessibility include:
– Providing as much honest and consistent accessible transport information as possible for disabled spectators ahead of their journey to enable an informed travel choice to meet individual requirements.
– Most disabled people, as with other spectators, booked their travel arrangements relatively late in the process, making it challenging to anticipate and plan for expected transport network demand.
– A lot of spectators who experienced mobility difficulties at a venue because of the distances involved will not necessarily perceive themselves as having a disability.
– The physical presence of staff to provide assistance and advice on the public transport network gave reassurance and confidence to disabled people.
– Asking a few additional accessibility questions at the ticketing stage will enable earlier planning of the expected accessible transport provisions.
It is vital that walking and cycling are communicated as viable transport options alongside other modes, rather than added on as ‘nice extras’. As we have seen, the numbers of people using these modes can be significant and they can be vital in managing demand. They should therefore be strongly promoted.
The London 2012 Transport Plan demonstrated that through providing a clear vision, information and infrastructure it is possible to deliver increased use of public transport and high levels of walking and cycling over a relatively short period of time but still keep London moving during some of the busiest days the city has ever seen.
The Games Mobility Service was an important part of delivering accessible Games

40A legacy of change
Our approachThe London 2012 Games was an opportunity to demonstrate that sustainability is both deliverable and cost-effective.
Our sustainability ambitions with respect to the social and economic regeneration of east London were set out in the bid and received full cross-party political support as well as backing from the business community. To deliver sustainability as a net benefit, we knew our partners must seriously share our commitment. This provided an enabling context but the next critical step was to embed this thinking into our procurement and employment policies and procedures and establish appropriate support structures.
Highlights of economic benefitsSponsorshipLOCOG’s domestic sponsorship programme raised approximately £750m in cash and value in kind from more than 50 Partner companies. Sustainability was an integral component of the process of recruiting commercial Marketing Partners. This worked two ways: we ensured that sustainability was a visible part of the offer and included in contract (just like for conventional supplier deals through our procurement programme), while for many of the prospective Partners it was an important part of their pitch to become a London 2012 sponsor. One Partner to our knowledge commissioned an independent sustainability audit of LOCOG before they committed to the deal. It was clear in this case (and we suspect a number of others) that the strong sustainability credentials of the London 2012 programme were a determining factor in securing the sponsorship deal.
Overall, this additional value from sustainability probably accounted for several tens of millions of pounds’ worth of sponsorship revenue for the Games, although it is impossible to tease this out separately from other considerations.
More specifically, LOCOG created a bespoke designation and activation programme for a group of six Sustainability Partners, which delivered an additional £15m.
Many London 2012 Partners devoted significant marketing budgets to sustainability promotions (that is, on top of their core sponsorship deal). Among the Sustainability Partners, BP, EDF Energy and BMW Group incorporated strong sustainability messaging into their Olympic Park showcases and across broader advertising platforms; BP and Cisco participated in the ‘Walk in the Olympic Park’ activation (see p49); EDF Energy and GE invested in and promoted the sustainability of lighting on Tower Bridge and Electric Vehicle Charge Points across London (also with BMW Group, TfL and the Mayor’s Office); and BT invested in long-term telecommunications infrastructure for the Olympic Park and adopted the London 2012 Carbon Footprint methodology across its wider business.
Other examples include Thames Water, who delivered the black water treatment plant on the Olympic Park; Dow Chemical’s sustainable solutions for the Stadium wrap; UPS’s sustainable logistics programme; and Coca-Cola’s investment in a new PET reprocessing plant in Lincolnshire. Overall, many London 2012 sponsors engaged in the sustainability programme and provided significant input in terms of innovative goods
Economic benefits of sustainability
Six major brands signed up as London 2012 Sustainability Partners

41A legacy of change
and services, modified or updated processes and packaging solutions, and contribution of knowledge and expertise. All this contributed to a significant economic boost to the London 2012 programme and in the wider economy.
ProcurementSustainability was an essential part of LOCOG’s definition of value for money. We recognised this had to be a central consideration at all times alongside commercial, legal and quality criteria. Real value embraces risk mitigation, reputation enhancement, forward thinking and recognition that sustainability will not lead to significant cost increases if the requirements are made clear at the outset. Our procurement methods and processes were also set up as a means to deliver in excess of £75m savings against budget.
There have been many achievements as a result of the procurement methods and processes put in place, including certification by the Chartered Institute of Purchasing and Supply. Fundamentally, procurement
was critical to the delivery of most of LOCOG’s sustainability objectives and targets. High-level achievements can be summarised as follows:
– More than 70 per cent of our individual suppliers were micro, small and medium-sized enterprises, providing 26 per cent by value of our programme.
– More than 95 per cent of our total spend was within the UK.
– We posted more than 350 opportunities on CompeteFor and received more than 15,000 responses.
– About 20 per cent of our suppliers employed fewer than 10 people.
– Companies in every nation and region of the UK were awarded contracts (in part due to CompeteFor but also to the efforts of our Nations and Regions team).
– Just under half of our UK suppliers were outside London and the south-east.
Table 6: Examples of cost savings against projected resource use during the Games
Item Scoped amount Actual consumption
Cost saving (percentage)
Electricity 104.5m kWh 78.6m kWh £2.6m (25%)
Diesel fuel for generators 6.4m litres 3.8m litres £1.7m (40%)
Diesel fuel for bus/coach fleet 5.5m litres 2.5m litres £3.7m (54%)
Diesel (80%) and petrol (20%) for car fleet 2.0m litres 1.1m litres £1.1m
Water supply (via tankers) 16,600m3 6,600m3 £0 (40%)*
*The water supplied via tankers had been pre-purchased on the basis of estimated demand. This is an example where more rigorous testing of assumptions would have achieved significant cost savings. In resource terms the surplus water was not wasted as it was not brought to site.

42A legacy of change
Nineteen per cent of volunteer Games Makers from London were from the Host Boroughs and 34 per cent of all Games Makers were from Greater London
Resource efficienciesOne of the most tangible examples of cost efficiency is in power, fuel and water use during the Games, as illustrated in Table 6.
One of the greatest difficulties facing LOCOG was estimating quantities of power, fuel and water required for the Games given the lack of benchmark data. In addition, each Games is a different configuration from the previous ones and the scale of the operation run across multiple venues means that minor shifts magnify considerably. While it is impossible to separate out exactly the amount of savings due simply to unused contingency (or over-estimation) from those achieved through management interventions, these figures clearly show the enormous scope for resource conservation at major events.
EmploymentThe LOCOG Employment and Skills Strategy aimed to use the opportunity of the Games to help workless people gain valuable experience to enhance their personal and professional lives.
At the peak of the Games workforce, 39 per cent of staff directly employed by LOCOG had been unemployed prior to their recruitment, and 34 per cent of contractors newly employed for the Games were unemployed prior to their recruitment. We had also provided guaranteed Games Maker interviews to any graduate of Personal Best, a scheme which used the attraction of volunteering at the Games to help those furthest from work. More than 1,100 Personal Best graduates were interviewed and we believe that the vast majority of these became Games Makers.
We have always been committed to helping those furthest from the job market to secure jobs during the Games and we worked intensely with the six Host Boroughs (Barking and Dagenham, Greenwich, Hackney, Newham, Tower Hamlets and Waltham Forest)and contractors to find opportunities and fill them with qualified people. We set a target of recruiting seven to 12 per cent of our Games workforce (staff, contractors and volunteers) from those who were unemployed. Until the run-up to the Games, we consistently achieved this target, either at the top end of the target range or exceeding it. At Games time, our figures were far in excess of the target, as our short-term jobs recruited in the final months before the Games attracted a high volume of those previously unemployed.
We also set a target of 15-20 per cent of our Games workforce (staff, contractors and volunteers) to be resident within the six Host Boroughs:
– 23.5 per cent of staff directly employed by LOCOG were resident in one of the six Host Boroughs (59 per cent were resident in Greater London).
– 21 per cent of contractors employed for Games-time roles were resident in one of the six Host Boroughs (49 per cent were resident in Greater London).
– 6.5 per cent of total Games Makers recruited from across the UK were resident in one of the six Host Boroughs. This accounts for 19 per cent of London Games Makers (34 per cent of all Games Makers were resident in Greater London).

43A legacy of change
Asset redeploymentPost-Games reuse of equipment and materials was a primary consideration. This is especially important in the context of events which have short-term, temporary requirements. Asset redeployment strategies can significantly contribute to waste prevention and carbon compensation objectives as well as provide considerable cost savings.
Much of the equipment was hired in the first place, which is a key waste prevention measure as it is used again in the market. This strategy minimised the quantity of equipment that needed to be redeployed. Some of the equipment was given to local charities, schools in the Get Set network and to sport National Governing Bodies. The Procurement and Logistics teams have been reselling the remaining equipment and items have been auctioned online to staff and the general public. We believe we are on track to achieve around £8m from the resale of these items.
The temporary infrastructure of the venues also creates a large amount of reuse opportunities as long as careful deconstruction rather than demolition is undertaken. Wood, plasterboard, lighting and doors have all been redeployed at local charities, building projects and community programmes. However, more could have been achieved through earlier planning and identification of reuse at the outset. The Learning Legacy website includes several reuse-related micro-reports.
Lessons for the futureAs with the construction programme described in previous London 2012 sustainability reports, LOCOG delivered the Games on time, to a very high standard and within its £2bn budget. Sustainability was an integral part of this delivery and, as highlighted above, has demonstrated considerable added value.
Direct financial benefits included:
– Enhanced commercial sponsorship programme
– Significant cost savings through resource conservation measures
– Significant cost benefits through asset disposal and the reuse and recycling of waste materials
Indirect benefits have accrued through:
– Diversity and reach of the supply chain
– Employment and skills opportunities
– Redeployment of assets for the benefit of other businesses and the community
– Creation of new standards and knowledge transfer
– Enhanced reputational value
This has been achieved by making sustainability in its full sense an integral part of our commercial, procurement and employment programmes from the start. This has allowed us to make informed choices on goods and services to achieve value for money.
Hockey pitch rolled up for reuse at Sheffield Hallam University

44A legacy of change
It is not simply about finding the least costly solutions. Several times we decided to buy items that had a higher financial cost but which overall best met our value criteria. Sometimes we didn’t fully apply this approach and as a result incurred unnecessary costs elsewhere in the business (for example, not fitting switches to tents and cabins, which saved some overlay budget but cost more in energy use). Such missed opportunities were typically due to having to make rapid decisions in the run up to the Games; lack of good baseline data leading to over-specifying requirements; or simply a failure of nerve to change standard industry practice. In delivery-critical, time-pressured and high-profile projects such as the Games, nobody wants to be responsible for something going wrong because of undercutting or running out of supplies. What we have been able to measure and report will enable future events to be more accurate in scoping their resource requirements.
Where we were bold in our thinking, we made some choices that were strongly beneficial in environmental and social terms as well as being significantly cheaper. The most striking example was the integrated planning of the Paralympic Games. Not only was it a fundamentally more inclusive approach to manage the Olympic and Paralympic Games as one project (traditionally they have had different management teams and different branding), but there were huge savings achieved by reducing the duplication of materials required, the economy of scale of a unified look programme and through waste minimisation.
Many departments achieved cost-effective solutions through intelligent use of technology, efficient logistics or reuse of materials. Two examples of the last were Games Maker uniforms (the design optimised the amount of material required and minimised the transition from Olympic to Paralympic style) and ceremonies, where costumes and other materials and props were used across all four of the big productions. All these may seem obvious but had not been done before in a Games context.
The key lesson is that upfront commitment and investment in sustainability will pay major dividends over the lifetime of a project, both in direct cost savings and wider socio-economic benefits. It is also clear that in some areas London 2012 only scratched the surface of potential efficiencies and waste avoidance. Future events can build on these learnings by ensuring they factor sustainability fully into both procurement and contract management processes.
The emphasis on diversity and inclusion, both in the supply chain and workforce, achieved demonstrable benefits in terms of employment and skills development in the London 2012 Host Boroughs, and business benefits across all nations and regions of the UK.
The integrated Olympic and Paralympic ‘Look’ achieved huge savings through minimising transition between the Games

45A legacy of change
The temporary equestrian arena in the historic setting of Greenwich Park
45A legacy of change

46A legacy of change
Our approachOne of the continual challenges for London 2012 was how to communicate the sustainability story. The Games had always been seen as a major opportunity to make sustainability visible and meaningful to vast audiences, while recognising that the primary focus of the media and people attending or watching the Games would be sport.
Most of the pre-Games sustainability communications were of a technical nature, aimed at knowledgeable stakeholders. These included the publication of formal sustainability reports, launches of strategies and announcements on achieving certification to specific standards, conference presentations and our own annual sustainability conference for stakeholders and partners.
This approach was aimed at building trust and confidence among Non-Governmental Organisations (NGOs) and specialist organisations and individuals to establish a level of credibility for the claim of delivering ‘truly sustainable Games’. While this was fine for professional audiences, it was essential to broaden the appeal in time for the Games, so that the larger, non-specialist audiences were reached.
The approaches taken can be classified as:
– Embedding sustainability messaging into mainstream Games communication channels
– Emphasising key touch points relevant to spectators
– Active media engagement immediately before and during the Games
– Specific sustainability activities
– Letting the quality shine through
Highlights of promoting sustainable livingThe embedded approachSustainability messaging was integrated into several mainstream channels. The spectator guides sent to each ticket holder referenced sustainable travel modes, recycling and accessibility options. Each ticket wallet had a luggage tag bearing information on the BP Target Neutral carbon offset scheme, while at-venue and in-store messaging ranged from specific signage to PA announcements. All retail carrier bags highlighted reuse and recycling.
Sustainability pages were included in the London 2012 Games-time website and spectator app.
Promoting sustainable living
‘The sheer beauty of the Olympic Park enjoyed by so many was a great triumph and gave sustainability the joyful quality of culture, not simply virtue.‘
Tim Smit Chief Executive an Co-Founder of the Eden Project
and London 2012 Sustainability Ambassador

47A legacy of change
Key touch points: travel, food and wasteEveryone coming to the Games had to travel; they would need to eat and drink at some point during their visit; and they would have rubbish to dispose of. These are normal daily activities, so by offering and highlighting a more sustainable approach, it was hoped people would both notice and think about behaving more sustainably in general.
Initiatives in relation to these three areas were:
Travel: – Fully public transport Games
– Active Travel Programme to encourage cycling and walking to venues
– Games Mobility Service for improved accessibility
Food: – Diverse and affordable choice of food options at catering concessions
– Messaging on all menu boards emphasising ‘Greener, tastier, healthier’, supported by assurance marks for Fairtrade, Red Tractor Farm Assured and Marine Stewardship Council certified fish
– Provision of free drinking water
Waste: – Strikingly visible and prominent coloured waste bins: green for recyclables, orange for compostables and black for non-recyclables
– Colour-coded marks on food packaging to match the waste bin colours
London 2012 Market Research Partner, Nielsen, supported LOCOG in a large-scale online spectator experience survey before, during and after the Games. This confirmed the popular impression of highly successful Games, with the post-Games sample showing that 96 per cent of UK ticket purchasers said their overall experience of the Games met or exceeded their expectations.
In specific areas respondents were asked to rate questions on a scale of 1 (extremely poor) to 10 (extremely good). In general the results were strongly positive. These have been summarised for Olympic Park venues below.
Question/topic Top three scores (8,9 or 10 out of 10)
Bottom three scores (1,2 or 3 out of 10)
Ease and efficiency of public transport in London 91.0% 0.4%
Quality and choice of food 36.4% 8.75%
Clarity of recycling symbols 65.5% 12.6%
Ease of recycling at the Games 77.4% 1.6%
Litter/unclean surroundings 85.8% 1.1%Source: Nielsen/LOCOG spectator experience research July-September 2012
An unprecedented variety of quality food was served at the Games
Table 7: Spectator experience research results

48A legacy of change
The weakest score related to food but, interestingly, experience scores (during and after the Games) were considerably better than expectation scores (pre-Games). This is probably a reflection on people’s experience of event catering generally; the quality and choice of Games catering was appreciated by a sizeable proportion of spectators, albeit not the majority.
Active media engagementAchieving strong, positive media coverage on the sustainability story was intended to raise wider awareness of London 2012’s efforts and reinforce the elements experienced by visitors to the Games.
LOCOG operated a Sustainability Office in the Main Media Centre from the beginning of July (around three weeks before the Olympic Games) to the end of the Paralympic Games. Many interviews were held here and it was a starting point for taking journalists on tours of the Olympic Park. A Sustainability Communications Manager was hired from April to September 2012 to work alongside the LOCOG Press team.
Special media briefings on sustainability were held on the occasions of VIP visits to the Olympic Park (for example, by the Director General of the United Nations Environment Programme, the UK Secretary of State for Environment and London 2012 Sustainability Ambassadors).
The tone of media coverage became increasingly positive over this period:
– Daily Telegraph, 6 July: London’s 2012 Olympics wins my green gold medal
– CNN, 10 July: Olympic Park sets gold standard for sustainability
– Reuters, 10 July: London raises bar on greening the Games
– Our Future Planet, 23 July: The most sustainable Summer Olympics of modern times
– United Nations Environment Programme press release, 26 July: London 2012 will leave a lasting legacy for the UK and the Olympic Movement
– The Times, 28 July: Beijing had a Bird’s Nest. We have real bird life
– The Guardian, 10 August: London 2012 – helping set sustainability standards
– BBC News, 11 August: London 2012: Olympic Games ‘greenest ever’
Kevin McCloud, Deborah Meaden and Tim Smit talking to media in the Olympic Park, July 2012
Some of the Sustainability Ambassadors with members of the LOCOG Sustainability team in their office in the Main Press Centre

49A legacy of change
Specific sustainability activities‘Walk in the Olympic Park’ was a guided trail through the Parklands to narrate the story of transformation and legacy. This was waymarked by a series of butterfly logos on trees, posts and walls, and by specially commissioned restored telephone boxes located at vantage points. These iconic, bright red features attracted much passing interest from visitors and were popular photo points. The telephone boxes framed particular views and within the frames were etched brief descriptions of the story from that point. Most visitors experienced ‘Walk in the Olympic Park‘ by chance but it was marked on maps and had its own section within the London 2012 spectator app.
Letting the quality shine throughPeople responded very positively to the quality of the venues and the landscaping. The flower gardens and Parklands in the Olympic Park were hugely appreciated by visitors. These attributes contributed strongly to the positive ambience and experience cited by so many survey respondents. The naturalness of the planting, the waterways and wetlands imparted a special quality to the site.
In this passive way, many people recognised the sustainability efforts of London 2012, even if not specifically articulated as such. Similar reactions at other venues (for example, Weymouth and Portland, Eton Dorney, Greenwich Park and Box Hill) reinforced this impression.
Lessons for the futureConventional advice has been that sustainability has to be communicated pre-Games and will be overshadowed by sport during the event. The London 2012 experience suggests otherwise.
Data from our monthly tracker poll of the UK population shows that belief in the sustainability of London 2012 grew during the Games, peaking at 39 per cent in September 2012, up from 26 per cent in June 2010 (Table 8). Only 11 per cent disagreed that the Games were sustainable, down from 28 per cent in June 2010. Olympic ticket holders and young people (under 16 years) were found to believe more in the sustainability of the Games (48 per cent and 43 per cent agreeing respectively).
Question June 2010 July 2011 July 2012 (pre–games)
Sept 2012
The Games will be sustainable and environmentally friendly (% agree)
26 25 21 39
Had information on sustainability initiatives (% yes)
11 16 22 38
More will lead a healthier lifestyle (% agree)
21 15 14 28
Source: Nielsen/LOCOG State of the Nation, monthly tracker poll
Table 8: Public opinion tracking on sustainability of the London 2012 Games

50A legacy of change
These improvements in public recognition of London 2012’s sustainability only occurred during the Games. The figures had been largely consistent in every monthly survey from June 2010 up to the Games. Indeed, the figures suggest that belief in the sustainability of the Games was declining right up to Games time. This may be a reflection of negative campaigns and media coverage in the early months of 2012, and a general nervousness in the population about whether the Games would be a success.
This strongly suggests that the pre-Games efforts to communicate the sustainability story had not cut through to popular opinion but the actual experience of the Games and the visibility of sustainability in its overt and passive forms clearly did make a significant difference. While it is not possible to attribute this to any one of the approaches outlined above, it is reasonable to assume that each played some part and the combination of all, along with the wider appeal of the Games experience, created the critical mass to impact public opinion.
‘A Walk in the Olympic Park’ featured iconic telephone boxes inscribed with information about the transformation of the site Spectators discovering ‘A Walk in the Olympic Park’

51A legacy of changeVisitors admiring the stunning flower beds in the London 2012 Gardens 51A legacy of change

52A legacy of change
In October 2012 the London Legacy Development Corporation started work to transform the Olympic Park into Queen Elizabeth Olympic Park – a new destination to live, work and enjoy.
This is a huge, 18-month, £300m construction programme known as Clear, Connect and Complete. The Legacy Corporation will clear temporary sporting venues like the Basketball Arena, the Water Polo Arena and the Hockey pitches in the Riverside Arena; connect the Park by installing bridges, paths and cycleways; and complete the permanent venues like the Velodrome and the Aquatics Centre, making them suitable for everyday use.
The aim is to reopen the Park as soon as possible. The north of the Park will open a year after the Olympic Games Opening Ceremony, on 27 July 2013. The remainder of the Park will be open by spring 2014. A timeline of these phased openings is available at http://noordinarypark.co.uk/when
Key commitments during this phase include:
– Securing a BREEAM ‘excellent’ rating for the permanent venues including the two new hub buildings.
– Continuing to transport 50 per cent (by weight) of construction materials to the Olympic Park by rail or water.
– Parklands to double in size including the planting of 4,300 semi-mature trees, more than one million plants and 675 bird and bat boxes.
– 50 per cent of all deconstruction materials and arisings from the works, excluding general fill, to be reused.
– At least 90 per cent of all deconstruction materials and arisings (by weight) from the works, excluding general fill, to be reused or recycled.
The Legacy Corporation has been working closely with colleagues at the Olympic Delivery Authority to share knowledge from the build phase of the project to help inform the future development of the Park. Since the launch of its corporate environmental sustainability policy (published April 2012), the Legacy Corporation has been working with its partners and operators to embed the policy’s commitments in all workstreams. Key activities include:
– Working with the development partner for Chobham Manor, the first neighbourhood to be built on the Park, to design and deliver an exemplar neighbourhood which is zero carbon and achieves a significant reduction in potable water usage.
– The production of an energy masterplan to create an efficient, low carbon, affordable energy supply to the Park and surrounding area.
– Development of sustainability guidelines for all events on the Park, both large and small, including the implementation of a sustainable event management system for the Park to ISO 20121 standard.
– Development of a waste strategy to deliver our recycling and reuse ambitions for the Park.
– Development of a wayfinding and signage strategy which will help support sustainable behaviours within the Park.
Olympic Park legacy
‘The Olympic Park is a dazzling kick-start to the redevelopment of a new, sustainable East London; it is of course about the Games but after that it will be an extraordinary piece of urban regeneration’
Kevin McCloud Broadcaster and London 2012 Sustainability
Ambassador

53A legacy of changeFuture view of Southern end of the Queen Elizabeth Olympic Park in 2015 53A legacy of change

54A legacy of change
– Revisions to the Olympic Park Biodiversity Action Plan from 2009 to reflect changes in the Park plans and aspirations to use volunteers in monitoring work.
– Supporting the delivery of a visitor centre within the Energy Centre to promote measures that people can implement themselves.
The Legacy Corporationis drawing on experience from LOCOG to understand what worked during the Games, in particular looking at energy demand management, waste management and also how people used the Park.
Recent legacy highlightsLegacy Communities Scheme: full planning consent has been granted for a major mixed use development of the Park that will change the lives of thousands of Londoners with new schools, transport and infrastructure improvements, housing commitments and local employment and training programmes. Work is underway on the detailed designs and the development of the first neighbourhood, Chobham Manor.
Annual RideLondon event: a two-day world-class festival of cycling was unveiled in August 2012. The weekend festival will be known as RideLondon and will feature a series of events for amateur, club and world elite cyclists. RideLondon will open with a family fun ride for up to 70,000 cyclists on an eight-mile loop of closed roads around London’s iconic landmarks on 3 August 2013. The following day a 100-mile road ride for up to 20,000 amateur, club and world-class elite cyclists will take place, beginning in Queen Elizabeth Olympic Park and based on much of the route of the Olympic Games Cycling Road Race.
Wild Kingdom, Three Mills Green in Stratford: a unique and distinctive new play area at Three Mills Green was opened in September 2012. Wild Kingdom has been designed to allow children of all ages to create their own playground from the natural surroundings.
Legacy Corporation becomes the planning authority: from 1 October 2012 the Legacy Corporation became the planning authority for the Park and the immediate surrounding area. The Legacy Corporation will also be responsible for producing a Local Plan including sustainability requirements for new developments in the area.
South Park Plaza: permission has been granted for a new plaza in the south of the Park in the area between the ArcelorMittal Orbit, the Aquatics Centre and the Olympic Stadium. The plans will see this area transformed into beautiful new parkland with a 12m-wide tree-lined promenade, contributing to the Legacy Corporation’s plans to double the open space inside the Park in comparison to Games time.
North Park Hub: permission has been granted for a community hub in the north of the Park. The community building and play space will become a centre for visitors and themed on the local ecology. It will boast some of the most imaginative play facilities in the UK as children will be able to build dens, grow plants and investigate insects, or climb trees and play on a series of platform walkways, slides and bridges connected to trees. There will also be sand and water play activities where budding engineers can create dams and locks to mimic the changes made to the River Lea after the Games.
Future view of North Park Hub

55A legacy of change
The White Building: July saw the opening of the White Building, a new cultural venue in Hackney Wick funded by the Legacy Corporation. The centre focuses on innovation and creative practice at the intersection of art, technology and sustainability, and is part of our wider regeneration programme to improve the surrounding areas.
Delivering employment and skills benefitsThrough its socio-economic policy, the Legacy Corporation has developed an approach to employment and skills that:
– Uses its procurement process to assess bidders’ track record and proposals for securing local socio-economic benefits.
– Embeds those commitments contractually and works in partnership with its contractors, operators, tenants and developer partners to deliver them.
– Develops and delivers interventions with borough partners, Job Centre Plus and the Greater London Authority to embed best practice and partnership working.
– Adds value and avoids duplication with existing employment and skills provision in the Host Boroughs by using existing infrastructure and targeting and coordinating delivery according to the demands of Park employers.
– Tailors the approach to the specific needs of the sector, job volumes and contract.
Work is currently well underway to deliver against the construction minimum local employment target of 25 per cent for Host Borough residents and a three per cent local apprenticeship target. The Legacy Corporation has commissioned Reds10, an apprenticeship training
agency, to support its transformation contractors to deliver community benefits and successfully place the first four apprentices on site in October. We continue to work with training providers and skills funding agencies to deliver training programmes to ensure that potential job applicants have the necessary skills to access employment and apprenticeship opportunities on the Park.
The Legacy Corporation will seek to replicate this delivery model to support contractors and subcontractors engaged in subsequent construction phases on the Queen Elizabeth Olympic Park including end-uses, Chobham Manor, and the transformation of the Main Press Centre, International Broadcast Centre and Olympic Stadium.
Future view of canal side along Lea Navigation
Future view of canal side in shadow of the Olympic Stadium

56A legacy of change 56A legacy of changeFuture view of south Park from Carpenters Lock Balcony

57A legacy of change
LOCOG adopted 10 sustainability objectives that were identified as being most material to the delivery of our overall aim of setting new standards of sustainability for the Games and creating a powerful knowledge legacy. We have progressively worked towards a series of target areas and progress has been reported in our previous two reports.
The following tables set out the final status of each of these target areas and, where appropriate, signposts to further sources of information. These sources include earlier sections of this report, the Pre-Games Sustainability Report and the London 2012 Learning Legacy website.
LOCOG sustainability objectives at a glance
Ref Target area Status More detail
1.1 Achieve and maintain third-party certification to BS 8901:2009
Target achieved Pre-Games Sustainability Report (pages 100-101) Refer to the London 2012 Learning Legacy website for additional material
1.2 Work with relevant Functional Areas to embed sustainability into Games Readiness and C3 workstreams
Target achieved Pre-Games Sustainability Report (page 106) Refer to the London 2012 Learning Legacy website for additional material
1.3 Work with relevant Functional Areas to embed sustainability into Games Workforce and Volunteering workstreams
Target achieved Pre-Games Sustainability Report (pages 108-111)
1.4 Work with relevant Functional Areas to ensure sustainability issues are adequately addressed as part of post-Games dissolution activities
Target achieved Pre-Games Sustainability Report (page 111)
1.5 No significant issues identified as a result of thematic and annual reviews undertaken by the Commission for a Sustainable London 2012 – no red or amber ratings
Target achieved Post-Games Sustainability Report (page 68)
Objective 1: To operate an effective sustainability management system
Sustainability management

58A legacy of change
Ref Target area Status More detail
2.1 Define and measure the carbon footprint of the Games Target achieved Post-Games Sustainability Report (pages 18-23) Refer to the London 2012 Learning Legacy website for additional material
2.2 Reduce the footprint through avoiding, reducing and substituting carbon emissions and quantify achievements through specific case studies (at least one case study from every ‘big hitter’)
Target achieved Post-Games Sustainability Report (pages 19-23) Refer to the London 2012 Learning Legacy website for additional material
2.3 Reduce projected venue energy use by at least 6,000 tonnes CO2e (updated as a result of energy demand increases at venue level)
(Replaces: Supply 20 per cent of Olympic Park electricity requirements at Games time from new local renewable energy sources)
Target achieved Post-Games Sustainability Report (page 21) Refer to the London 2012 Learning Legacy website for additional material
2.4 Mitigate unavoidable carbon emissions of the Games through influencing the uptake of best practices and innovative approaches developed by London 2012, behavioural change initiatives and other forms of compensation, and quantify achievements through specific case studies
Target achieved Post-Games Sustainability Report (pages 23 and 43) Refer to the London 2012 Learning Legacy website for additional material
Objective 2: To deliver a low carbon Games and showcase how we are adapting to a world increasingly affected by climate change
Low carbon Games

59A legacy of change
Ref Target area Status More detail
3.1 Ensure that no waste arising during the 77-day Games period is sent directly to landfill from closed venues
Target achieved Post-Games Sustainability Report (page 27) Refer to the London 2012 Learning Legacy website for additional material
3.2 Treat all waste as a potential resource and ensure that at least 70 per cent of Games-time waste from closed venues is reused, recycled or composted
Close to target Post-Games Sustainability Report (page 27) Refer to the London 2012 Learning Legacy website for additional material
3.3 Take reasonable endeavours to reuse or recycle at least 90 per cent, by weight, of the material arising from the installation and deconstruction of LOCOG temporary venues and overlay (stretch target)
Target achieved Post-Games Sustainability Report (page 28) Refer to the London 2012 Learning Legacy website for additional material
3.4 Work with suppliers, partners and local authorities to encourage alignment of waste management practices at open sites with those adopted for closed venues
Target achieved Post-Games Sustainability Report (page 30) Pre-Games Sustainability Report (pages 140-142) Refer to the London 2012 Learning Legacy website for additional material
3.5 Work with partners to develop tools, public education and outreach initiatives to promote low-waste lifestyles
Target achieved Pre-Games Sustainability Report (pages 142-143
Objective 3: To deliver a zero waste Games, demonstrate exemplary resource management practices and promote long-term behavioural change
Zero waste Games

60A legacy of change
Ref Target area Status More detail
4.1 Ensure Games food and beverage services are delivered in accordance with the London 2012 Food Vision commitments
Target achieved Pre-Games Sustainability Report (pages 146-150) Refer to the London 2012 Learning Legacy website for additional material
4.2 Encourage organisations throughout the events, catering and hospitality sector to commit to supporting and implementing London 2012 standards across the industry
Target achieved Pre-Games Sustainability Report (pages 150-152) Refer to the London 2012 Learning Legacy website for additional material
Objective 4: To deliver the London 2012 Food Vision and leave a strong, sustainable legacy for London and the UK by nurturing commercial and educational partnerships
Food Vision

61A legacy of change
Ref Target area Status More detail
5.1 Ensure all Priority Spend Area contracts are procured and monitored in accordance with the LOCOG Sustainable Sourcing Code and applicable supporting strategies and guidelines
Close to target Contracts were continually prioritised and the majority were delivered in accordance with sustainability requirements
Refer to the London 2012 Learning Legacy website for additional material
5.2 Ensure all official LOCOG licensees adhere to the sustainability approvals process
Close to target The majority of licensees followed the sustainability approvals process
A small number of licensees went into production without LOCOG approval
Refer to the London 2012 Learning Legacy website for additional material
5.3 Ensure all materials are sourced in accordance with LOCOG policies
Target achieved Trackers established for key materials and a review of compliance undertaken and policies adhered to in all cases
Refer to the London 2012 Learning Legacy website for additional material
5.4 Ensure all timber and timber products are sourced in accordance with LOCOG policies
Target achieved Review of timber compliance undertaken and policies adhered to in all cases
5.5 Ensure all contracting organisations where the London Living Wage is appropriate and applicable to their contract commit to paying this as a minimum
Target achieved Pre-Games Sustainability Report (page 170)
5.6 Ensure all legitimate complaints relating to sustainability are handled appropriately
Target achieved In total, nine separate complaints, all related to labour standards with most involving multiple and sometimes complex issues, were accepted as falling within the scope of the mechanism and managed accordingly
A total of 74 identifiable remedial actions resulted as well as other collateral benefits, including negotiations between employers and trade unions
Refer to the London 2012 Learning Legacy website for additional material
Objective 5: To optimise sustainability through procurement, licensing and sponsorship deals
Procurement, sponsorship and licensing

62A legacy of change
Ref Target area Status More detail
6.1 Ensure LOCOG venues and infrastructure are delivered in accordance with the LOCOG Venues and Infrastructure Sustainability Strategy
Target achieved Priority targets not otherwise covered within this report:
– Hiring 85 per cent of commodities – achieved 86 per cent
– Reduce planned footprint of LOCOG venues by 25 per cent – achieved 47 per cent
– Reduce non-essential comfort cooling (HVAC) by 70 per cent – achieved 82 per cent
Refer to the London 2012 Learning Legacy website for additional material
6.2 Ensure Village operations are delivered in accordance with the LOCOG Villages Sustainability Strategy
Target achieved Through implementation of the strategy the following were achieved:
– Education and engagement of sustainability through training of contractors, facilities and residents managers, village publications and notices, and residence centre posters and messages
– Management of responsible decommissioning of the Village
– Facilitation of the One Planet Centre
6.3 Ensure Games technology is delivered in accordance with the LOCOG Technology Sustainability Strategy
Target achieved Pre-Games Sustainability Report (pages 183-185) Refer to the London 2012 Learning Legacy website for additional material
6.4 Ensure Games logistics is delivered in accordance with the LOCOG Logistics Sustainability Strategy
Target achieved Pre-Games Sustainability Report (pages 186-189) Refer to the London 2012 Learning Legacy website for additional material
6.5 Optimise composition of Games Family vehicle fleet Target achieved Overall demand for vehicles was lower than predicted as many client groups opted to use public transport See also Post-Games Sustainability Report (pages 32 and 37)
6.6 Achieve an average of 120 g per km or less of CO2 emissions across the fleet of M1 passenger vehicles required for the Games
Close to target Post-Games Sustainability Report (pages 37)
Objective 6: To embed sustainability in the planning and delivery of LOCOG venues and operations
Embed sustainability in planning and delivery

63A legacy of change
Ref Target area Status More detail
6.7 100 per cent of Games Family buses and coaches to achieve at least Euro IV standard
Target achieved Post-Games Sustainability Report (pages 37 and 38)
6.8 100 per cent of vehicles entering LOCOG accredited venues to be compliant with the LOCOG Low Emission Venues Policy
Close to target Post-Games Sustainability Report (page 38)
6.9 Encourage long distance domestic visitors and visitors from nearby countries (including teams and officials) to use rail rather than air transport
Close to target Post-Games Sustainability Report (pages 22 and 33)
6.10 Encourage members of the Games Family to travel on London's public transport wherever possible
Target achieved Overall demand for vehicles was lower than predicted as many client groups opted to use public transport
See also Post-Games Sustainability Report (pages 32 and 37)
6.11 Ensure press operations are delivered in a manner which is consistent with LOCOG’s sustainability objectives
Target achieved Pre-Games Sustainability Report (pages 190-191)
Refer to the London 2012 Learning Legacy website for additional material
6.12 Work with broadcasters, including Olympic Broadcasting Services, to minimise their sustainability impacts and support the communication of the London 2012 sustainability story
Close to target Key achievements include:
– Employed and trained more than 1,250 university students to work in different facets as broadcast professionals
– Achieved 90 per cent reuse and recycling as part of the International Broadcast Centre build and decommissioning works
A sustainability guidance document for broadcasters is available on the Learning Legacy website
6.13 All cleaning services to be delivered in accordance with a BS 8901:2009 certified management system and a supporting sustainability management plan
Target achieved Pre-Games Sustainability Report (page 191)
6.14 Work with partners to ensure that look and wayfinding solutions are delivered in accordance with LOCOG’s sustainability objectives
Target achieved Refer to the London 2012 Learning Legacy website for additional material
Objective 6: To embed sustainability in the planning and delivery of LOCOG venues and operations (continued)

64A legacy of change
Ref Target area Status More detail
6.15 Work with partners to ensure that the Opening and Closing Ceremonies are staged in a manner that is respectful to LOCOG sustainability objectives
Target achieved Refer to the London 2012 Learning Legacy website for additional material
6.16 Work with partners to ensure that Torch Relay operations respect LOCOG’s sustainability objectives
Target achieved Refer to the London 2012 Learning Legacy website for additional material
6.17 Determine whether other operational Functional Areas require specific sustainability objectives to be established by the end of 2011
Target achieved Pre-Games Sustainability Report (page 174)
Objective 6: To embed sustainability in the planning and delivery of LOCOG venues and operations (continued)

65A legacy of change
Ref Target area Status More detail
7.1 Monitor and report on delivery of the LOCOG Diversity and Inclusion Strategy’s priority themes and associated performance indicators
Target achieved A separate post-Games Diversity and Inclusion report will be published during the first quarter of 2013
Refer to the London 2012 Learning Legacy website for additional material
7.2 Monitor and report on the delivery of the LOCOG Diversity and Inclusion Charter
Close to target A separate post-Games Diversity and Inclusion report will be published during the first quarter of 2013
Refer to the London 2012 Learning Legacy website for additional material
Objective 7: To deliver the LOCOG Diversity and Inclusion Strategy and host the most inclusive Games possible by promoting access and celebrating diversity
Ref Target area Status More detail
8.1 Monitor and report on delivery of the LOCOG Employment and Skills Strategy’s priority areas and associated indicators
Target achieved Pre-Games Sustainability Report (pages 207-213)
Post-Games Sustainability Report (page 42)
Refer to the London 2012 Learning Legacy website for additional material
8.2 Monitor and report on supplier uptake of the LOCOG Employment and Skills Charter
Target achieved Pre-Games Sustainability Report (pages 207-213)
Refer to the London 2012 Learning Legacy website for additional material
Objective 8: To deliver the LOCOG Employment and Skills Strategy and provide individuals with work and life experience that they can use to enhance their personal and professional lives once the Games are over
Diversity and inclusion
Employment and skills

66A legacy of change
Ref Target area Status More detail
9.1 Develop and deliver the initiatives set out in the LOCOG Sustainability Communications and Stakeholder Engagement Plan
Target achieved Pre-Games Sustainability Report (pages 214-216)
Post-Games Sustainability Report (pages 46-50)
9.2 Deliver the objectives of the Changing Places programme Target achieved Refer to the London 2012 Learning Legacy website for additional material
9.3 Deliver the objectives of the Active Travel programme Target achieved Post-Games Sustainability Report (pages 35-36)
Refer to the London 2012 Learning Legacy website for additional material
9.4 Embed sustainability messages into all major internal- and external-facing LOCOG controlled programmes
Target achieved Pre-Games Sustainability Report (pages 221-223)
Post-Games Sustainability Report (pages 46-50)
9.5 All major LOCOG events and relevant Cultural Olympiad projects to adhere to the London 2012 Sustainability Guidelines for Corporate and Public Events
On track Sustainability is included as part of London 2012 Festival evaluation work that has been commissioned. Results of this evaluation were not available in time for the preparation of this report
See also Pre-Games Sustainability Report (pages 223-224).
9.6 Work with partners to develop and promote new standards of sustainability in event management
Target achieved Pre-Games Sustainability Report (pages 224-225)
9.7 Develop an engagement programme for athletes and Olympic and Paralympic Movements
Target achieved Pre-Games Sustainability Report (page 224) Post-Games Sustainability Report (page 14)
Objective 9: To influence behaviour change and promote sustainable living through outreach initiatives and leveraging the power of commercial partnerships
Promote sustainable living

67A legacy of change
Ref Target area Status More detail
10.1 Prepare London 2012 sustainability reports in compliance with Global Reporting Initiative guidelines
Target achieved All reports have been prepared in accordance with GRI sustainability reporting guidelines
10.2 Prepare Learning Legacy case studies from every corporate sustainability objective (at least one from every objective)
Target achieved More than 70 documents have been prepared covering all 10 corporate sustainability objectives and are available from the Learning Legacy website
10.3 Complete Olympic Games Impact (OGI) study and knowledge transfer obligations to the IOC
On track OGI study due to be completed in 2015
Final phase is being carried out by University of East London with funding from the Economic and Social Research Council and overseen by the British Olympic Association
Objective 10: To create a knowledge legacy for sustainability in event management through comprehensive knowledge management transfer and transparent sustainability reporting
Create knowledge legacy

68A legacy of change
Assurance Statement by the Commission for a Sustainable London 2012This final sustainability report of London 2012 presents an unprecedented opportunity to consider how London 2012 performed against its stated sustainability commitments. It has been the role of the Commission for a Sustainable London 2012 to hold each of the London 2012 bodies formally to account throughout the life of the 2012 programme and, in this final sustainability report for London 2012, we provide here a summary of our view on the programme’s performance.Over its life, the Commission has undertaken an extensive number of planned and responsive thematic and annual reviews, resulting in 235 recommendations. Progress against these along with full reports can be found on the Commission’s website at www.cslondon.org. At the time of writing, over 70 per cent have been achieved or satisfactorily closed, while just 10 per cent have either not been achieved, show no progress yet, or are at significant risk of having not been achieved. This demonstrates that London 2012 has been largely responsive to criticism to ensure that it remained on course in meeting its sustainability commitments.
This final report highlights in a commendably transparent manner London 2012’s successes and learnings from hosting the Games themselves. The report is focussed on what lessons can be learnt by future Games organisers and associated industry players across themes most important to stakeholders. It is supplemented by summary reporting against all sustainability related Games-time targets.
While we are not in a position to comment on the veracity of the data presented in this report, there is nothing that contradicts our own observations from the Games period which we reported in our post-Games report ‘London 2012 – From Vision to Reality’.
London 2012’s sustainability achievements surpass any other Games and have in many cases set new world best practice across development and events related sectors. As the world economy struggles in a climate of austerity, it would be easy for governments and industry players alike to view London’s performance as an unrepeatable high-point, domestically and abroad. This would be a mistake in our view.
The sustainability team within London 2012 ceases in mid December 2012, and our own Commission ends on 31 March 2013. There is a limited window to ensure that London’s legacy is best applied and not simply a fond memory. The Commission has one final review to undertake before we close, entitled ‘Beyond 2012’. We will focus this review on the many ways in which London’s performance can be embedded into wider industry practice.
A key question in our final review will be how the UK government can keep London’s legacy alive. We are heartened by the creation of a legacy unit within the Cabinet Office and under the leadership of Lord Coe and we look forward to seeing plans that set out how London’s legacy will live on.
Shaun McCarthy Chair

69A legacy of changeOlympic Games at Greenwich Park

This publication is available on request in other formats. LOC2012/SUS/1809Email [email protected] +44 (0)845 267 2012
This document can be found in the publications section of london2012.com and on the Learning Legacy website: http://learninglegacy.independent.gov.ukThis document is correct as of 12/12/2012
This document and the official Emblems of the London 2012 Games are © London Organising Committee of the Olympic Games and Paralympic Games Limited 2007–2012. All rights reserved.
The London Organising Committee of theOlympic Games and Paralympic Games Ltd.One Churchill PlaceCanary Wharf London E14 5LNSwitchboard +44 (0)20 3 2012 000Fax +44 (0)20 3 2012 001london2012.com