a linear index for predicting joint health states utilities from single health states utilities...
TRANSCRIPT

A Linear Index for A Linear Index for Predicting Joint Health Predicting Joint Health
States Utilities States Utilities from Single Health States from Single Health States
UtilitiesUtilitiesAnirban Basu University of Chicago William Dale University of Chicago Arthur Elstein University of Illinois
at Chicago David Meltzer University of Chicago
Academy Health Annual Research MeetingAcademy Health Annual Research MeetingOrlando June 5 2007Orlando June 5 2007
2
Calculation of QALYs in Calculation of QALYs in CEACEA
Health at any time Health at any time
combination of the presence and also of the combination of the presence and also of the levels of various ldquohealth conditionsrdquo or ldquoattributesrdquolevels of various ldquohealth conditionsrdquo or ldquoattributesrdquo
ldquo ldquomulti-attributerdquo in naturemulti-attributerdquo in nature
Combinatorial explosion of health states if all Combinatorial explosion of health states if all ldquohealth conditionsrdquo are consideredldquohealth conditionsrdquo are considered
Substantial interview burden to collect utilitiesSubstantial interview burden to collect utilities
Cognitive burden for eliciting preferences on Cognitive burden for eliciting preferences on ldquomulti-attributerdquo heath statesldquomulti-attributerdquo heath states
However some ldquomulti-attributerdquo health states However some ldquomulti-attributerdquo health states are sufficiently prevalent are sufficiently prevalent ignoring them ignoring them may influence CEAmay influence CEA
3
GoalGoal To develop an empirical model to predict the
utilities for a ldquobi-attributerdquo health state (JOINT STATE) based on the utilities of single-attribute health states
Single-attribute health states Only one health condition is present (or has a
fixed level) AND all other health conditions are either absent or fixed at some innocuous levels
Example Predict utility of a health state where patient experience both impotence and incontinence based on the utilities of health states where either impotence or incontinence is present
4
Traditional ModelsTraditional ModelsSS = Single state JS= Joint State
u()= Utility l () = 1 ndash u() = Disutility or Loss
Most commonly used models
1) Additive 2) Multiplicative and 3) Minimum
Each model is of the general form
l (JS) = f l (SS1) l (SS2) + ε
ie El (JS) = f l (SS1) l (SS2)
5
Traditional ModelsTraditional Models1) Additive
El (JS) = l (SS1) + l (SS2)
Eu(JS) = u(SS1) + u(SS2) - 1
2) Multiplicative
El (JS) = l (SS1) + l (SS2) - - l (SS1) (SS1) l (SS2) (SS2)
Eu(JS) = u(SS1) u(SS2)
3) Minimum
El (JS) = Max l (SS1) l (SS2)
Eu(JS) = Min u(SS1) u(SS2)
6
Traditional ModelsTraditional ModelsPrevious research (Dale et al MDM forthcoming)
finds all three models produce biased prediction of Eu(JS) while the minimum model was the best of the three in terms of overall bias and efficiency
Other models
Based of additivemultiplicative utility function Based of additivemultiplicative utility function ((Keeney and Raiffa 1976 1993) u(JS) = k1u(SS1) + k2u(SS2) + kk1k2u(SS1) u(SS2)
Also used by Torrence et al (1982 1986) to develop HUI Turns out for HUI IIIII
El (JS) = C [ [l (SS1) + l (SS2) - - l (SS1) (SS1) l (SS2)](SS2)]
7
Proposed ModelsProposed ModelsEEll(JS) = α0 + α1max(JS) = α0 + α1maxll(SS1) (SS1) ll(SS2) (SS2) + α2min+ α2minll(SS1) (SS1) ll(SS2) + (SS2) +
α3α3ll(SS1)(SS1)ll(SS2)(SS2)
Two unique features ndash Two unique features ndash 1) Parameters of the model are not tied to the 1) Parameters of the model are not tied to the
specific health conditionsspecific health conditions 2) Encompasses all three traditional generic 2) Encompasses all three traditional generic
mapping functions mapping functions α0 = 0 α1 = 1 α2 = 1 α3 = 0 α0 = 0 α1 = 1 α2 = 1 α3 = 0 Additive model Additive modelα0 = 0 α1 = 1 α2 = 1 α3 = -1 α0 = 0 α1 = 1 α2 = 1 α3 = -1 Multiplicative Multiplicative
modelmodelα0 = 0 α1 = 1 α2 = 0 α3 = 0 α0 = 0 α1 = 1 α2 = 0 α3 = 0 Minimum model Minimum model
8
Normative ConstraintsNormative ConstraintsNormative Restrictions Additive
Model Multiplicative
Model Minimum
Model Linear Index
U(SS1) = 1 U(SS2) = 1 U(JS) = 1
YES
YES
YES
α0 = 0
U(SS1) = 0 U(SS2) = 0 U(JS) = 0
NO
YES
YES
α1 + α2 + α3 = 1
U(SS1) = 0 U(SS2) = u U(JS) = 0
NO
YES
YES
α1 =1 α2 + α3 = 0
Constrained model for Linear Index El(JS) = 0 + maxl(SS1) l(SS2) + α[minl(SS1) l(SS2) - l(SS1)l(SS2)]
9
DataData Urology Clinics Urology Clinics
University of Chicago (45 positive biopsy)University of Chicago (45 positive biopsy) Northwestern (25 positive biopsy)Northwestern (25 positive biopsy)
Time amp Clinic SettingTime amp Clinic Setting 30 minutes between appointments30 minutes between appointments Embedded in larger surveyEmbedded in larger survey
At time of biopsy Referral for cause At time of biopsy Referral for cause 75 - elevated PSA (gt40 ngdL)75 - elevated PSA (gt40 ngdL) 25 - symptom abnormal DRE other25 - symptom abnormal DRE other
10
DataDataSingle StatesSingle States11 ImpotenceImpotence22 Urinary IncontinenceUrinary Incontinence33 AnxietyAnxiety
High Watchful WaitingHigh Watchful Waiting Low Post-prostatectomyLow Post-prostatectomy
Joint StatesJoint States Impotence amp IncontinenceImpotence amp Incontinence Impotence amp Post-prostatectomyImpotence amp Post-prostatectomy Impotence amp Asymptomatic Localized DiseaseImpotence amp Asymptomatic Localized Disease
Utilities elicited using time-tradeoff method with Utilities elicited using time-tradeoff method with ProSPEQT (Bayoumi 2004)ProSPEQT (Bayoumi 2004)
11
MethodsMethodsAn iterated bootstrapped split-sample An iterated bootstrapped split-sample
approachapproachx 100 Bootstrap data clustered by individuals
Split
Training Dataset (75) Test dataset (25 )
Fit model Store for future use--gt Estimate parameters--gt Save estimates
Posit prediction index Test goodness-of-fit
based on mean estimates in test datasets
RESULTSRESULTS
13
Table 1 Descriptive statistics (n = 207)Table 1 Descriptive statistics (n = 207)Characteristics Mean plusmn SD or Age (in years) 63 plusmn 76 Race White 56 African-American 39 Other 5 Marital Status MarriedCommon Law 76 DivorcedWidowed 11 Single Never Married 5 Education High School or less 24 Some College 21 College Grad or more 56 Income $35K or less 22 $35K to $50K 26 $50K to $100K 24 Over $100K 17 Health Status Excellent 35 Good 42 Fair 21 Poor 2
14
Table 2 Utilities (n = 207)Table 2 Utilities (n = 207)
Utility Health States N Mean Std Dev Median Single States Impotence 207 073 030 083 Incontinence 207 068 032 080 Post-Prostatectomy 207 078 029 094 Watchful Waiting 207 078 028 092 Joint States Impotence - Incontinence 207 063 035 073 Impotence - Post-Prostatectomy 207 070 032 082 Impotence - Watchful Waiting 207 066 034 079
15
Table 3 Parameter EstimatesTable 3 Parameter Estimates
Weights Mean Std Dev
95 Central Interval
α0 0046 0016 (0021 0081)
α1 0721 0052 (0625 0820)
α2 0331 0178 (-0011 0693)
α3 -0176 0212 (-0623 0212)
α1 ndash α2 0389 0192 (0040 0746)
Alternative Special cases Pr (F-test significant)
accross replicates
α0 = 0 α1 = 1 α2 = 1 α3 = 0 Additive Model
10
α0 = 0 α1 = 1 α2 = 1 α3 = 1 Multiplicative Model
10
α0 = 0 α1 = 1 α2 = 0 α3 = 0 Minimum model
10
16
Proposed linear indicesProposed linear indices With theoretical restrictionsWith theoretical restrictions
EEll(JS) = (JS) = 0 + max0 + maxll(SS1) (SS1) ll(SS2) - 0043596(SS2) - 0043596
[min[minll(SS1) (SS1) ll(SS2) - (SS2) - ll(SS1) (SS1) ll(SS2)](SS2)]
UnrestrictedUnrestricted
EEll(JS) = (JS) = 005 + 072max005 + 072maxll(SS1) (SS1) ll(SS2) + (SS2) +
033min033minll(SS1) (SS1) ll(SS2) (SS2) ndash ndash
018018ll(SS1) (SS1) ll(SS2)(SS2)
17
Table 4 Goodness-of Fit in Test (out-of Table 4 Goodness-of Fit in Test (out-of sample) Datasetssample) Datasets
Joint Health State Impotence-Post-prostatectomy Models Mean Residuals
(std err) Correlation
(std err) [p] Mean Sq Error
(std err) New Index (unconstrained) 00228 (0027)
00006 (0147)
[007] 00329 (0008) +
New Index with constraints 00302 (0027)
-03230 (0113) +
[046] 00389 (0012) +
Additive Model 01152 (0034) +
-05361 (0101) +
[099] 00627 (0016) +
Multiplicative Model 00838 (0031) +
-04280 (0110) +
[094] 00475 (0012) +
Minimum Model 00356 (0031)
-03407 (0114) +
[071] 00400 (0011) +
18
Figure 1 Goodness-of FitFigure 1 Goodness-of Fit
-6
-4
-2
02
4M
ean
Res
idu
als
Sample
[0 040]27
(040 - 070]23
(070 094)24
(094 10]26
Ranges of Predicted JS-Utility for Impotence-PostProstatectomy
New Index with Theoretical Constraints
New Index (unconstrained)AdditiveMultiplicative
Minimum
19
ConclusionsConclusions Empirical models that can predict utilities for Empirical models that can predict utilities for
the joint states are of great valuethe joint states are of great value
Develop and validate a simple predictive modelDevelop and validate a simple predictive model combines the utilities for patients of two single-combines the utilities for patients of two single-
attribute health states and predict utilities when attribute health states and predict utilities when these attributes occur jointly resulting in a bi-these attributes occur jointly resulting in a bi-attribute or joint state attribute or joint state
Proposed model outperforms the traditional Proposed model outperforms the traditional models and provides consistent estimates of models and provides consistent estimates of joint state utilitiesjoint state utilities
Theoretical constraints produce suboptimal fit Theoretical constraints produce suboptimal fit to stated utilities for joint statesto stated utilities for joint states
20
ConclusionsConclusions Close resemblance to the Close resemblance to the
additivemultiplicative formulation additivemultiplicative formulation proposed by Keeney amp Raiffa proposed by Keeney amp Raiffa
Also conforms with ldquoevaluative Also conforms with ldquoevaluative hypothesisrdquo in psychology comparing hypothesisrdquo in psychology comparing ldquojoint evaluation moderdquo versus ldquojoint evaluation moderdquo versus ldquoseparate evaluation modelrdquo (Hsee et ldquoseparate evaluation modelrdquo (Hsee et al 1999 Hsee and Zhang 2004) =gt al 1999 Hsee and Zhang 2004) =gt puts more weight on bigger loss puts more weight on bigger loss compared to the smaller onecompared to the smaller one
21
Limitation and Future Limitation and Future DirectionsDirections
Based on convenience sample in Based on convenience sample in urology clinics urology clinics
Only evaluated for health states Only evaluated for health states relevant to prostate cancerrelevant to prostate cancer
ldquoldquoImpotencerdquo was a common SS in all Impotencerdquo was a common SS in all the JSthe JS
Further validation of this new function Further validation of this new function in other joint health states in other in other joint health states in other diseases is warranted diseases is warranted
Tackle issues of logical versus illogical Tackle issues of logical versus illogical predictionspredictions

10
DataDataSingle StatesSingle States11 ImpotenceImpotence22 Urinary IncontinenceUrinary Incontinence33 AnxietyAnxiety
High Watchful WaitingHigh Watchful Waiting Low Post-prostatectomyLow Post-prostatectomy
Joint StatesJoint States Impotence amp IncontinenceImpotence amp Incontinence Impotence amp Post-prostatectomyImpotence amp Post-prostatectomy Impotence amp Asymptomatic Localized DiseaseImpotence amp Asymptomatic Localized Disease
Utilities elicited using time-tradeoff method with Utilities elicited using time-tradeoff method with ProSPEQT (Bayoumi 2004)ProSPEQT (Bayoumi 2004)
11
MethodsMethodsAn iterated bootstrapped split-sample An iterated bootstrapped split-sample
approachapproachx 100 Bootstrap data clustered by individuals
Split
Training Dataset (75) Test dataset (25 )
Fit model Store for future use--gt Estimate parameters--gt Save estimates
Posit prediction index Test goodness-of-fit
based on mean estimates in test datasets
RESULTSRESULTS
13
Table 1 Descriptive statistics (n = 207)Table 1 Descriptive statistics (n = 207)Characteristics Mean plusmn SD or Age (in years) 63 plusmn 76 Race White 56 African-American 39 Other 5 Marital Status MarriedCommon Law 76 DivorcedWidowed 11 Single Never Married 5 Education High School or less 24 Some College 21 College Grad or more 56 Income $35K or less 22 $35K to $50K 26 $50K to $100K 24 Over $100K 17 Health Status Excellent 35 Good 42 Fair 21 Poor 2
14
Table 2 Utilities (n = 207)Table 2 Utilities (n = 207)
Utility Health States N Mean Std Dev Median Single States Impotence 207 073 030 083 Incontinence 207 068 032 080 Post-Prostatectomy 207 078 029 094 Watchful Waiting 207 078 028 092 Joint States Impotence - Incontinence 207 063 035 073 Impotence - Post-Prostatectomy 207 070 032 082 Impotence - Watchful Waiting 207 066 034 079
15
Table 3 Parameter EstimatesTable 3 Parameter Estimates
Weights Mean Std Dev
95 Central Interval
α0 0046 0016 (0021 0081)
α1 0721 0052 (0625 0820)
α2 0331 0178 (-0011 0693)
α3 -0176 0212 (-0623 0212)
α1 ndash α2 0389 0192 (0040 0746)
Alternative Special cases Pr (F-test significant)
accross replicates
α0 = 0 α1 = 1 α2 = 1 α3 = 0 Additive Model
10
α0 = 0 α1 = 1 α2 = 1 α3 = 1 Multiplicative Model
10
α0 = 0 α1 = 1 α2 = 0 α3 = 0 Minimum model
10
16
Proposed linear indicesProposed linear indices With theoretical restrictionsWith theoretical restrictions
EEll(JS) = (JS) = 0 + max0 + maxll(SS1) (SS1) ll(SS2) - 0043596(SS2) - 0043596
[min[minll(SS1) (SS1) ll(SS2) - (SS2) - ll(SS1) (SS1) ll(SS2)](SS2)]
UnrestrictedUnrestricted
EEll(JS) = (JS) = 005 + 072max005 + 072maxll(SS1) (SS1) ll(SS2) + (SS2) +
033min033minll(SS1) (SS1) ll(SS2) (SS2) ndash ndash
018018ll(SS1) (SS1) ll(SS2)(SS2)
17
Table 4 Goodness-of Fit in Test (out-of Table 4 Goodness-of Fit in Test (out-of sample) Datasetssample) Datasets
Joint Health State Impotence-Post-prostatectomy Models Mean Residuals
(std err) Correlation
(std err) [p] Mean Sq Error
(std err) New Index (unconstrained) 00228 (0027)
00006 (0147)
[007] 00329 (0008) +
New Index with constraints 00302 (0027)
-03230 (0113) +
[046] 00389 (0012) +
Additive Model 01152 (0034) +
-05361 (0101) +
[099] 00627 (0016) +
Multiplicative Model 00838 (0031) +
-04280 (0110) +
[094] 00475 (0012) +
Minimum Model 00356 (0031)
-03407 (0114) +
[071] 00400 (0011) +
18
Figure 1 Goodness-of FitFigure 1 Goodness-of Fit
-6
-4
-2
02
4M
ean
Res
idu
als
Sample
[0 040]27
(040 - 070]23
(070 094)24
(094 10]26
Ranges of Predicted JS-Utility for Impotence-PostProstatectomy
New Index with Theoretical Constraints
New Index (unconstrained)AdditiveMultiplicative
Minimum
19
ConclusionsConclusions Empirical models that can predict utilities for Empirical models that can predict utilities for
the joint states are of great valuethe joint states are of great value
Develop and validate a simple predictive modelDevelop and validate a simple predictive model combines the utilities for patients of two single-combines the utilities for patients of two single-
attribute health states and predict utilities when attribute health states and predict utilities when these attributes occur jointly resulting in a bi-these attributes occur jointly resulting in a bi-attribute or joint state attribute or joint state
Proposed model outperforms the traditional Proposed model outperforms the traditional models and provides consistent estimates of models and provides consistent estimates of joint state utilitiesjoint state utilities
Theoretical constraints produce suboptimal fit Theoretical constraints produce suboptimal fit to stated utilities for joint statesto stated utilities for joint states
20
ConclusionsConclusions Close resemblance to the Close resemblance to the
additivemultiplicative formulation additivemultiplicative formulation proposed by Keeney amp Raiffa proposed by Keeney amp Raiffa
Also conforms with ldquoevaluative Also conforms with ldquoevaluative hypothesisrdquo in psychology comparing hypothesisrdquo in psychology comparing ldquojoint evaluation moderdquo versus ldquojoint evaluation moderdquo versus ldquoseparate evaluation modelrdquo (Hsee et ldquoseparate evaluation modelrdquo (Hsee et al 1999 Hsee and Zhang 2004) =gt al 1999 Hsee and Zhang 2004) =gt puts more weight on bigger loss puts more weight on bigger loss compared to the smaller onecompared to the smaller one
21
Limitation and Future Limitation and Future DirectionsDirections
Based on convenience sample in Based on convenience sample in urology clinics urology clinics
Only evaluated for health states Only evaluated for health states relevant to prostate cancerrelevant to prostate cancer
ldquoldquoImpotencerdquo was a common SS in all Impotencerdquo was a common SS in all the JSthe JS
Further validation of this new function Further validation of this new function in other joint health states in other in other joint health states in other diseases is warranted diseases is warranted
Tackle issues of logical versus illogical Tackle issues of logical versus illogical predictionspredictions
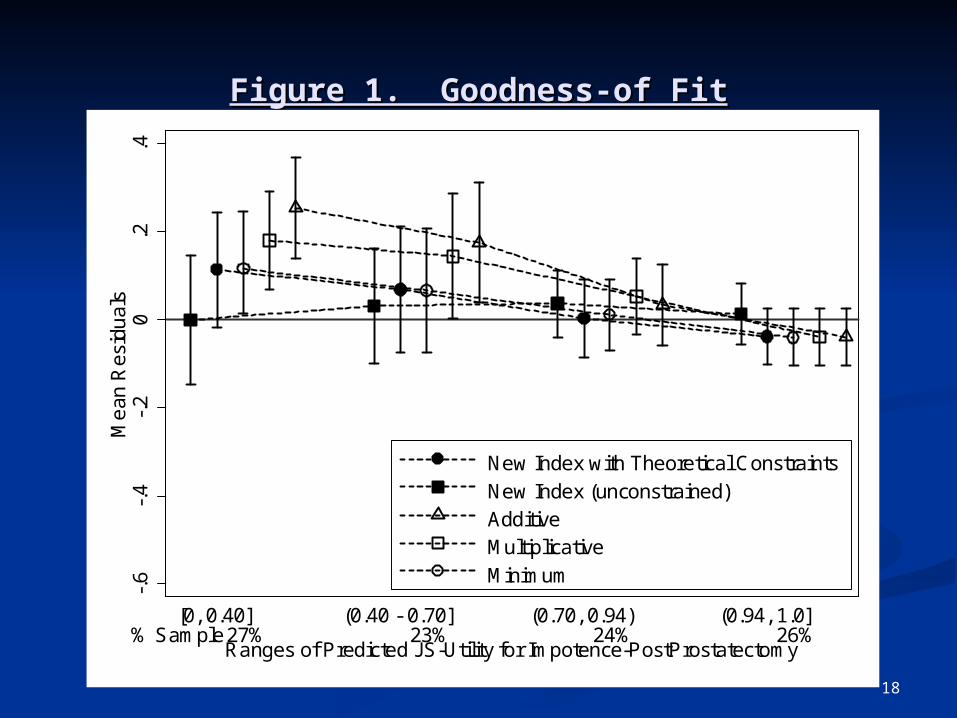