a liquidity analysis of crude oil - s&p dow jones … · the liquidity of the front-month crude...
TRANSCRIPT

CONTRIBUTORS
Peter Tsui Director Global Research & Design [email protected]
Aye M. Soe, CFA Senior Director Global Research & Design [email protected]
A Liquidity Analysis of Crude Oil ANNOUNCEMENT
Effective at the open on May 28, 2015, for implementation during the June roll period starting on June 1, 2015, the S&P GSCI Enhanced Commodity will follow a new contract determination for WTI crude oil.
The old methodology is as follows: on the third-to-last business day of every month, the contract determination is done through a calculation using the S&P GSCI contract calendar roll-out and roll-in contracts. If the return between the roll-in and roll-out contracts is greater than 0.5%, the contracts roll in to the sixth contract month out.
The new methodology is as follows: during the roll-in contract determination months of January through June, if the prior mentioned rule applies, the contracts will roll to the current year’s December contracts. During the roll-in contract determination months of July through December, if the rule applies, the contracts will roll to the next year’s December contracts.
We modified the enhanced roll strategy for the S&P GSCI Crude Oil because we observed a fundamental shift in the liquidity profile of the crude oil market. The following analysis presents the case for such a change.
A LIQUIDITY ANALYSIS OF CRUDE OIL
The liquidity of the front-month crude oil contracts has been decreasing steadily since 2001, while the next six forward month contracts have maintained their levels. There have been notable spikes in the liquidity profiles of the front-month contracts and the next six forward contracts, which is primarily due to the greater acceptance of the December and June contracts since 2001.
To investigate the liquidity levels, we calculated the value of open interests for each of the contracts for each month in U.S. dollars, from January 2001 to September 2014. We then normalized the values into percentages, and then we ranked them in descending order. The liquidity percentages of the contracts highlight the shifts in liquidity over time. By definition, the front-month contract changes each month, and thus when we comment on the liquidity of the front-month contract, we are implicitly talking about different contracts over time.
However, regardless of which contract is in the front-month position, we have seen a steady decline in its liquidity (see Exhibit 1).
RESEARCH

A Liquidity Analysis of Crude Oil February 2016
Exhibit 1: Front-Month Contract
Source: CRB (Commodity Research Bureau). Data from 2001 to 2014. Past performance is no guarantee of future results. Chart is provided for illustrative purposes.
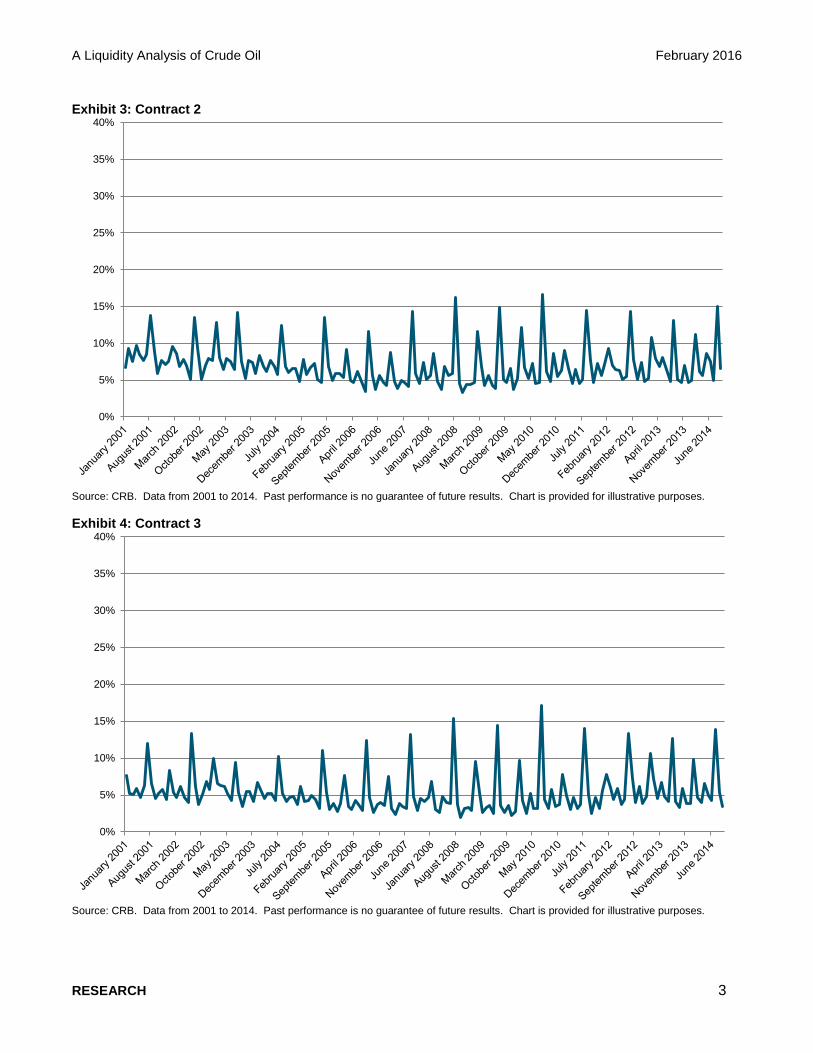
Exhibits 2 through 7 show the relative liquidity of the next six contracts over time. To be comparable with Exhibit 1, the same scales are used.
Exhibit 2: Contract 1
Source: CRB. Data from 2001 to 2014. Past performance is no guarantee of future results. Chart is provided for illustrative purposes.
0%
5%
10%
15%
20%
25%
30%
35%
40%
0%
5%
10%
15%
20%
25%
30%
35%
40%
RESEARCH 2
A Liquidity Analysis of Crude Oil February 2016
Exhibit 3: Contract 2
Source: CRB. Data from 2001 to 2014. Past performance is no guarantee of future results. Chart is provided for illustrative purposes.
Exhibit 4: Contract 3
Source: CRB. Data from 2001 to 2014. Past performance is no guarantee of future results. Chart is provided for illustrative purposes.
0%
5%
10%
15%
20%
25%
30%
35%
40%
0%
5%
10%
15%
20%
25%
30%
35%
40%
RESEARCH 3

A Liquidity Analysis of Crude Oil February 2016
Exhibit 5: Contract 4
Source: CRB. Data from 2001 to 2014. Past performance is no guarantee of future results. Chart is provided for illustrative purposes.
Exhibit 6: Contract 5
Source: CRB. Data from 2001 to 2014. Past performance is no guarantee of future results. Chart is provided for illustrative purposes.
0%
5%
10%
15%
20%
25%
30%
35%
40%
0%
5%
10%
15%
20%
25%
30%
35%
40%
RESEARCH 4

A Liquidity Analysis of Crude Oil February 2016
Exhibit 7: Contract 6
Source: CRB. Data from 2001 to 2014. Past performance is no guarantee of future results. Chart is provided for illustrative purposes.
The liquidity levels of the six contracts following the front-month contract seem to be relatively stable, except for the periodic spikes. Upon further investigation, these spikes were found to be due to the December and June contracts moving into the corresponding months. To illustrate this phenomenon more clearly, we ranked the liquidity percentage of each of the contracts in descending order. We then computed the average ranking of each contract month over five different time horizons prior to their expiration month: three months, six months, nine months, twelve months, and twenty-four months.
Exhibit 8: Average Ranking Analysis
Contract Month 3-Month Average 6-Month Average 9-Month Average 12-Month Average 24-Month Average
F 2.6 4.8 6.6 8.3 14.7
G 3.4 6.9 9.3 11.4 18.5
H 2.7 5.3 7.7 9.7 17.0
J 3.2 6.1 8.7 11.2 18.8
K 3.2 6.2 8.9 11.4 19.2
M 2.3 3.1 3.8 4.6 8.1
N 2.8 5.4 7.6 9.3 17.5
Q 3.3 6.4 9.4 11.7 19.6
U 2.8 4.9 6.7 8.3 14.6
V 3.2 5.8 8.2 10.5 18.3
X 3.5 6.5 8.5 10.5 17.6
Z 1.7 2.0 2.2 2.3 3.4 Source: CRB. Data from 2001 to 2014. Past performance is no guarantee of future results. Table is provided for illustrative purposes. Shaded rows represent the most-liquid months with the lowest average rankings. Monthly contracts from January through December are represented by letters F, G, H, J, K, M, N, Q, U, V, X, and Z, respectively.
0%
5%
10%
15%
20%
25%
30%
35%
40%
RESEARCH 5
A Liquidity Analysis of Crude Oil February 2016
The shaded rows in Exhibit 8 indicate the months that were the most liquid, with the lowest average rankings. For example, the December contract (Z) consistently ranked the highest, followed by the June (M) contract. The remaining four contracts in the top half were those from January (F), March (H), July (N), and September (U).
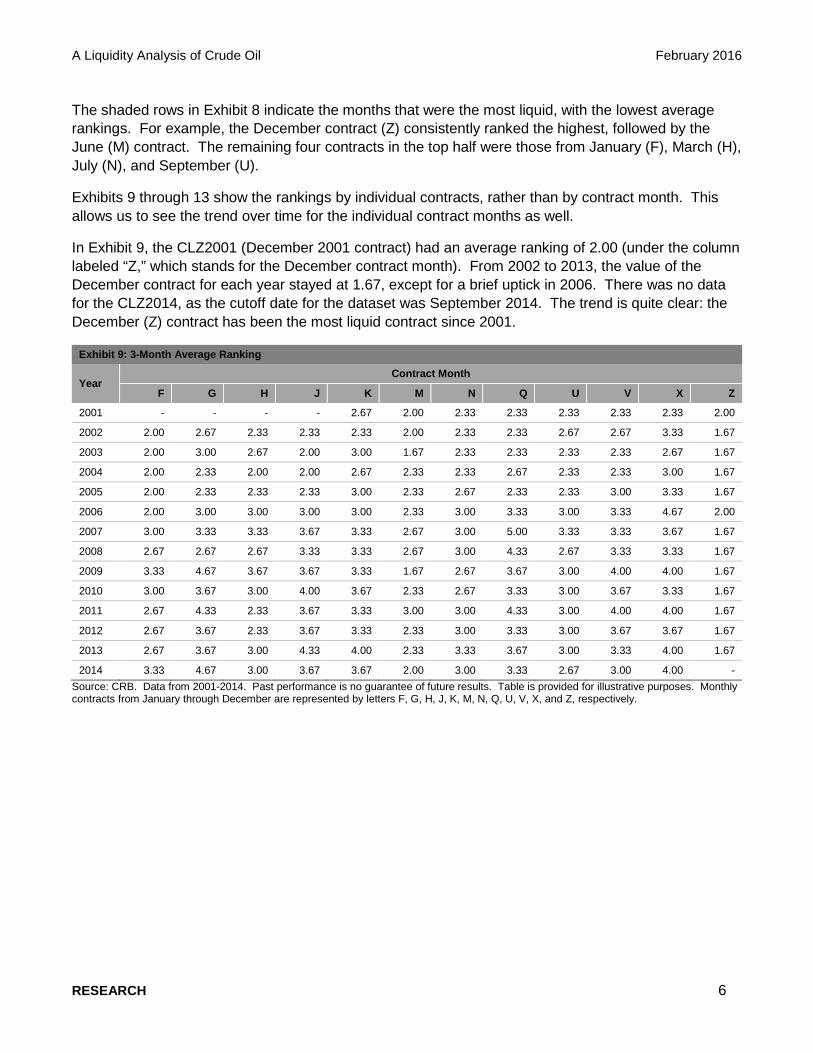
Exhibits 9 through 13 show the rankings by individual contracts, rather than by contract month. This allows us to see the trend over time for the individual contract months as well.
In Exhibit 9, the CLZ2001 (December 2001 contract) had an average ranking of 2.00 (under the column labeled “Z,” which stands for the December contract month). From 2002 to 2013, the value of the December contract for each year stayed at 1.67, except for a brief uptick in 2006. There was no data for the CLZ2014, as the cutoff date for the dataset was September 2014. The trend is quite clear: the December (Z) contract has been the most liquid contract since 2001.
Exhibit 9: 3-Month Average Ranking
Year Contract Month
F G H J K M N Q U V X Z
2001 - - - - 2.67 2.00 2.33 2.33 2.33 2.33 2.33 2.00
2002 2.00 2.67 2.33 2.33 2.33 2.00 2.33 2.33 2.67 2.67 3.33 1.67
2003 2.00 3.00 2.67 2.00 3.00 1.67 2.33 2.33 2.33 2.33 2.67 1.67
2004 2.00 2.33 2.00 2.00 2.67 2.33 2.33 2.67 2.33 2.33 3.00 1.67
2005 2.00 2.33 2.33 2.33 3.00 2.33 2.67 2.33 2.33 3.00 3.33 1.67
2006 2.00 3.00 3.00 3.00 3.00 2.33 3.00 3.33 3.00 3.33 4.67 2.00
2007 3.00 3.33 3.33 3.67 3.33 2.67 3.00 5.00 3.33 3.33 3.67 1.67
2008 2.67 2.67 2.67 3.33 3.33 2.67 3.00 4.33 2.67 3.33 3.33 1.67
2009 3.33 4.67 3.67 3.67 3.33 1.67 2.67 3.67 3.00 4.00 4.00 1.67
2010 3.00 3.67 3.00 4.00 3.67 2.33 2.67 3.33 3.00 3.67 3.33 1.67
2011 2.67 4.33 2.33 3.67 3.33 3.00 3.00 4.33 3.00 4.00 4.00 1.67
2012 2.67 3.67 2.33 3.67 3.33 2.33 3.00 3.33 3.00 3.67 3.67 1.67
2013 2.67 3.67 3.00 4.33 4.00 2.33 3.33 3.67 3.00 3.33 4.00 1.67
2014 3.33 4.67 3.00 3.67 3.67 2.00 3.00 3.33 2.67 3.00 4.00 - Source: CRB. Data from 2001-2014. Past performance is no guarantee of future results. Table is provided for illustrative purposes. Monthly contracts from January through December are represented by letters F, G, H, J, K, M, N, Q, U, V, X, and Z, respectively.
RESEARCH 6
A Liquidity Analysis of Crude Oil February 2016
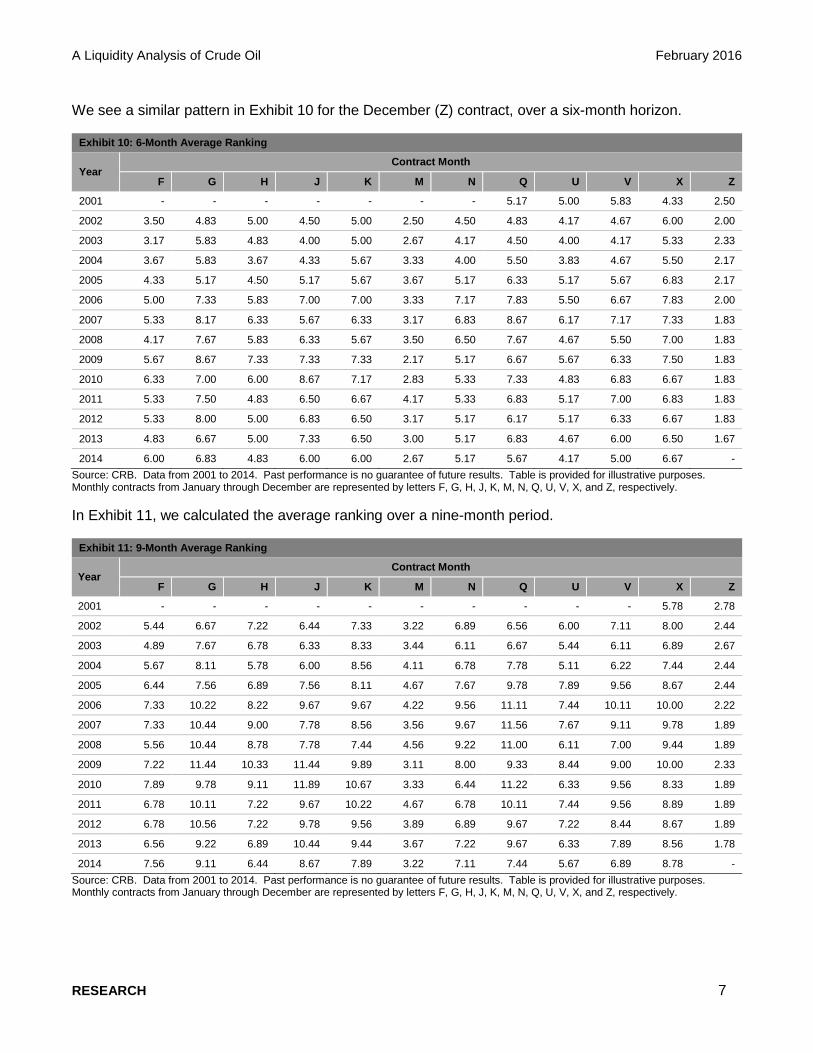
We see a similar pattern in Exhibit 10 for the December (Z) contract, over a six-month horizon.
Exhibit 10: 6-Month Average Ranking
Year Contract Month
F G H J K M N Q U V X Z
2001 - - - - - - - 5.17 5.00 5.83 4.33 2.50
2002 3.50 4.83 5.00 4.50 5.00 2.50 4.50 4.83 4.17 4.67 6.00 2.00
2003 3.17 5.83 4.83 4.00 5.00 2.67 4.17 4.50 4.00 4.17 5.33 2.33
2004 3.67 5.83 3.67 4.33 5.67 3.33 4.00 5.50 3.83 4.67 5.50 2.17
2005 4.33 5.17 4.50 5.17 5.67 3.67 5.17 6.33 5.17 5.67 6.83 2.17
2006 5.00 7.33 5.83 7.00 7.00 3.33 7.17 7.83 5.50 6.67 7.83 2.00
2007 5.33 8.17 6.33 5.67 6.33 3.17 6.83 8.67 6.17 7.17 7.33 1.83
2008 4.17 7.67 5.83 6.33 5.67 3.50 6.50 7.67 4.67 5.50 7.00 1.83
2009 5.67 8.67 7.33 7.33 7.33 2.17 5.17 6.67 5.67 6.33 7.50 1.83
2010 6.33 7.00 6.00 8.67 7.17 2.83 5.33 7.33 4.83 6.83 6.67 1.83
2011 5.33 7.50 4.83 6.50 6.67 4.17 5.33 6.83 5.17 7.00 6.83 1.83
2012 5.33 8.00 5.00 6.83 6.50 3.17 5.17 6.17 5.17 6.33 6.67 1.83
2013 4.83 6.67 5.00 7.33 6.50 3.00 5.17 6.83 4.67 6.00 6.50 1.67
2014 6.00 6.83 4.83 6.00 6.00 2.67 5.17 5.67 4.17 5.00 6.67 - Source: CRB. Data from 2001 to 2014. Past performance is no guarantee of future results. Table is provided for illustrative purposes. Monthly contracts from January through December are represented by letters F, G, H, J, K, M, N, Q, U, V, X, and Z, respectively.
In Exhibit 11, we calculated the average ranking over a nine-month period.
Exhibit 11: 9-Month Average Ranking
Year Contract Month
F G H J K M N Q U V X Z
2001 - - - - - - - - - - 5.78 2.78
2002 5.44 6.67 7.22 6.44 7.33 3.22 6.89 6.56 6.00 7.11 8.00 2.44
2003 4.89 7.67 6.78 6.33 8.33 3.44 6.11 6.67 5.44 6.11 6.89 2.67
2004 5.67 8.11 5.78 6.00 8.56 4.11 6.78 7.78 5.11 6.22 7.44 2.44
2005 6.44 7.56 6.89 7.56 8.11 4.67 7.67 9.78 7.89 9.56 8.67 2.44
2006 7.33 10.22 8.22 9.67 9.67 4.22 9.56 11.11 7.44 10.11 10.00 2.22
2007 7.33 10.44 9.00 7.78 8.56 3.56 9.67 11.56 7.67 9.11 9.78 1.89
2008 5.56 10.44 8.78 7.78 7.44 4.56 9.22 11.00 6.11 7.00 9.44 1.89
2009 7.22 11.44 10.33 11.44 9.89 3.11 8.00 9.33 8.44 9.00 10.00 2.33
2010 7.89 9.78 9.11 11.89 10.67 3.33 6.44 11.22 6.33 9.56 8.33 1.89
2011 6.78 10.11 7.22 9.67 10.22 4.67 6.78 10.11 7.44 9.56 8.89 1.89
2012 6.78 10.56 7.22 9.78 9.56 3.89 6.89 9.67 7.22 8.44 8.67 1.89
2013 6.56 9.22 6.89 10.44 9.44 3.67 7.22 9.67 6.33 7.89 8.56 1.78
2014 7.56 9.11 6.44 8.67 7.89 3.22 7.11 7.44 5.67 6.89 8.78 - Source: CRB. Data from 2001 to 2014. Past performance is no guarantee of future results. Table is provided for illustrative purposes. Monthly contracts from January through December are represented by letters F, G, H, J, K, M, N, Q, U, V, X, and Z, respectively.
RESEARCH 7

A Liquidity Analysis of Crude Oil February 2016
In Exhibit 12, we calculated the average ranking over a 12-month period.
Exhibit 12: 12-Month Average Ranking
Year Contract Month
F G H J K M N Q U V X Z
2001 - - - - - - - - - - - -
2002 - 8.33 9.00 9.08 9.25 4.00 8.50 8.33 6.83 8.83 9.75 3.08
2003 6.33 9.25 8.58 9.17 11.58 4.50 8.33 8.67 6.92 8.67 8.75 3.00
2004 7.67 10.08 8.25 8.33 11.08 4.50 9.17 10.25 6.25 8.50 9.67 2.83
2005 7.67 9.92 9.17 10.17 11.42 5.67 10.50 12.08 9.83 12.25 10.42 2.58
2006 9.67 12.42 10.25 11.75 12.25 5.25 11.92 13.33 9.92 12.83 11.58 2.58
2007 8.92 12.83 11.08 10.17 11.42 4.25 11.50 13.83 9.42 11.75 12.00 1.92
2008 7.25 13.33 11.08 10.25 8.83 5.67 11.75 13.75 7.17 8.33 11.08 1.92
2009 8.50 13.08 12.50 14.00 11.17 4.33 9.08 12.42 10.50 12.00 12.67 2.33
2010 9.58 12.33 11.17 14.67 13.67 4.50 7.08 13.50 7.75 11.92 10.17 1.92
2011 8.42 11.67 9.50 11.58 13.25 5.25 7.75 12.75 9.75 11.83 10.25 2.00
2012 8.25 12.42 9.08 12.33 11.92 4.33 8.00 12.00 9.75 10.50 9.75 1.92
2013 8.08 10.92 8.50 12.50 12.08 4.08 8.67 11.75 7.58 10.08 9.67 1.83
2014 8.83 11.08 8.25 11.08 9.83 3.83 8.33 9.42 6.58 8.50 10.58 - Source: CRB. Data from 2001 to 2014. Past performance is no guarantee of future results. Table is provided for illustrative purposes. Monthly contracts from January through December are represented by letters F, G, H, J, K, M, N, Q, U, V, X, and Z, respectively.
In Exhibit 13, we showed the average ranking over a 24-month period. An average ranking of 2.92 for CLZ2013 meant that commodity investors had been using this contract 24 months out and had endowed it with the highest liquidity levels, compared with 6.50 for the June contract from the same year (CLM2013), which had the second highest liquidity levels. These two contracts had greater liquidity than the remaining contracts in 2013.
Exhibit 13: 24-Month Average Ranking
Year Contract Month
F G H J K M N Q U V X Z 2001 - - - - - - - - - - - -
2002 - - - - - - - - - - - -
2003 - 16.25 15.25 17.54 18.38 9.04 16.54 14.54 13.25 17.08 16.67 4.38
2004 14.54 17.67 16.08 17.42 18.42 8.08 17.50 18.42 12.46 17.00 16.83 5.17
2005 14.46 17.58 17.13 18.50 19.75 9.46 16.83 19.00 16.96 19.33 18.17 4.13
2006 15.83 19.29 17.58 18.58 18.92 9.04 18.79 20.08 16.08 19.88 18.71 3.54
2007 15.17 19.67 17.92 17.42 19.79 7.75 19.21 20.38 15.75 18.25 18.58 2.71
2008 15.33 19.50 17.17 18.33 18.83 8.25 19.54 21.54 11.92 15.46 18.46 2.83
2009 13.21 16.54 19.08 19.42 17.63 9.38 17.46 20.71 16.75 19.67 20.96 3.13
2010 16.67 20.13 17.38 22.88 21.38 7.17 17.00 23.46 15.25 20.00 18.25 2.92
2011 16.25 19.13 18.29 16.50 21.00 8.92 17.42 19.83 16.63 20.54 17.21 3.33
2012 14.00 19.08 16.50 20.42 19.00 7.38 15.63 19.33 16.67 18.58 16.21 2.58
2013 13.21 18.38 16.21 20.08 20.33 6.50 17.33 20.08 12.50 17.92 14.83 2.92
2014 13.42 18.67 15.50 18.71 17.25 6.50 16.71 17.88 10.88 16.38 16.13 - Source: CRB. Data from 2001 to 2014. Past performance is no guarantee of future results. Table is provided for illustrative purposes. Monthly contracts from January through December are represented by letters F, G, H, J, K, M, N, Q, U, V, X, and Z, respectively.
RESEARCH 8

A Liquidity Analysis of Crude Oil February 2016
We now show the relative liquidity profile observed in two separate months, June 2014 and September 2014, in order to highlight the trend of diminishing liquidity in the front-month contracts and the prevalence of the December contracts. In Exhibit 14, the liquidity profile of crude oil looked like “business as usual” through June 2014. The front-month contract in this case was from August 2014, and it was the most liquid. We then saw the spikes represented by the subsequent December and June contracts. Generally, the liquidity is concentrated in the front end of the curve, and for June 2014, it was no exception.
Exhibit 14: Relative Liquidity by Contract for June 2014
Source: CRB. Data from 2001 to 2014. Past performance is no guarantee of future results. Chart is provided for illustrative purposes.
In Exhibit 15, we see something that is quite unusual; the highest level of liquidity was not in the front-month contract but in the following contract. In this case, in September 2014, the front-month contract was the November 2014 contract. The first contract after that was the December 2014 contract. The December 2014 contract was 2% higher than the front-month contract as a result of the general diminishing of the front-month contract liquidity and the preference for the December contract.
Exhibit 15: Relative Liquidity by Contract for September 2014
Source: CRB. Data from 2001 to 2014. Past performance is no guarantee of future results. Chart is provided for illustrative purposes.
0%
2%
4%
6%
8%
10%
12%
14%
16%
18%
20%
Months Out
0%
2%
4%
6%
8%
10%
12%
14%
16%
18%
Months Out
RESEARCH 9

A Liquidity Analysis of Crude Oil February 2016
Finally, we compared the U.S. dollar values of the sixth-month forward contract of a given month with the December contract. In order to have a meaningful comparison, this would have to be done on an individual contract basis. For this purpose, we compared the December 2013 contract of WTI crude from June 2012 to October 2013. The sixth contract outstanding for WTI crude changes each month. For instance, the sixth-month forward contract, as of June 2012, was the January 2013 contract. Thus, we track the dollar values of the sixth-month forward contract from June 2012 until the rolling out of the WTI December 2013 contract in October 2013, for a total of 17 months. During this period, as shown in Exhibit 16, we see that the U.S. dollar values of the December 2013 contract were always greater than or equal to the U.S. dollar values of the sixth nearby contract, with the levels being the same when the December 2013 contract happened to be the sixth nearby contract in May 2013.
Exhibit 16: U.S. Dollar Value of WTI Crude for Sixth Contract Versus December 2013 Contract (CLZ2013)
Source: CRB. Data from 2001 to 2014. Past performance is no guarantee of future results. Chart is provided for illustrative purposes.
PERFORMANCE COMPARISON
We then compared the roll yields of five S&P GSCI commodity roll strategies for crude oil using back-tested index data.
1. S&P GSCI Crude Oil
2. S&P GSCI Crude Oil 3 Month Forward
3. S&P GSCI Crude Oil Dynamic Roll
4. S&P GSCI Crude Oil Enhanced
5. S&P GSCI Crude Oil Enhanced Roll (back-tested)
For number 4, we did not change any of the historical values of the new S&P GSCI Crude Oil Enhanced Roll prior to the change; for number 5, we simulated the effect of applying the new algorithm from the beginning of January 1995.
-
5,000,000,000
10,000,000,000
15,000,000,000
20,000,000,000
25,000,000,000
30,000,000,000
35,000,000,000
40,000,000,000
US
D
Sixth Contract December 2013 (CLZ2013)
RESEARCH 10

A Liquidity Analysis of Crude Oil February 2016
The comparison was done over the historical period of January 1995 to December 2015. We segmented this 21-year period in terms of the contango/backwardation (C/B) metric. We calculated the gradient between the following specified contracts.
a) From contract 1 to contract 2 (denoted as cb 1-2)
b) From contract 1 to contract 4 (denoted as cb 1-4)
c) From contract 1 to contract 7 (denoted as cb 1-7)
d) From contract 1 to contract 13 (denoted as cb 1-13)
In Exhibit 17, we can discern a persistent phenomenon of contango and backwardation. When the gradient is negative, the market is in backwardation; likewise, when the gradient is positive, the market is in contango. We assigned an index number of 1 to contango, and an index number of -1 to backwardation. When the index values of the market representing contango and backwardation are cumulatively added, we get a pathway, as seen in Exhibit 17, with one for each of the four different metrics.
Exhibit 17: Cumulative C/BMetrics
Source: Thomson Reuters DataScope Select. Data from 1994 to 2015. Past performance is no guarantee of future results. Chart is provided for illustrative purposes.
Based on the C/B metrics, we can divide the past 21 years into eight segments.
a) From Jan. 17, 1995, to Feb. 25, 1997
b) From Feb. 25, 1997, to Feb. 24, 1999
c) From Feb. 24, 1999, to Feb. 11, 2005
d) From Feb. 11, 2005, to April 30, 2007
e) From April 30, 2007, to April 10, 2008
-2000
-1500
-1000
-500
0
500
1000
1500cb 1-2 cb 1-4 cb 1-7 cb 1-13
RESEARCH 11

A Liquidity Analysis of Crude Oil February 2016
f) From April 10, 2008, to Dec. 12, 2012
g) From Dec. 12, 2012, to Sept. 22, 2014
h) From Sept. 22, 2014, to Dec. 31, 2015
The eight segments have a different number of days in each segment, ranging from a low of 239 days to a high of 1,488 days. The total over this historical period is 5,257 trading days. We presented the cumulative roll yields, the ranking, and the annualized roll yield in the exhibits below.
Exhibit 18: Cumulative Roll Yields
Period Number of Days C/B
S&P GSCI Crude Oil
(%)
S&P GSCI Crude Oil 3-
Month Forward (%)
S&P GSCI Crude Oil Dynamic Roll (%)
S&P GSCI Crude Oil Enhanced
Roll (%)
S&P GSCI Crude Oil
Enhanced Roll (Back-Tested) (%)
From To
Jan. 17, 1995 Feb. 25, 1997 528 B 176 133 176 183 183
Feb. 25, 1997 Feb. 24, 1999 501 C 67 81 84 83 94
Feb. 24, 1999 Feb. 11, 2005 1,488 B 168 252 220 200 185
Feb. 11, 2005 April 30, 2007 553 C 61 85 114 89 105
April 30, 2007 April 10, 2008 239 B 101 103 102 104 106
April 10, 2008 Dec. 12, 2012 1,180 C 42 68 100 66 72
Dec. 12, 2012 Sept. 22, 2014 446 B 104 112 99 106 106
Sept. 22, 2014 Dec. 31, 2015 322 C 79 85 71 84 84
Entire Period 5,257 - 42 153 267 167 227 Source: Thomson Reuters DataScope Select. Data as of Dec. 31, 2015. Past performance is no guarantee of future results. Table is provided for illustrative purposes and reflects hypothetical historical performance. Please see the Performance Disclosure at the end of this document for more information regarding the inherent limitations associated with back-tested performance.
Exhibit 19: Ranking (1=lowest, 5=highest)
Period Number of
Days C/B S&P GSCI Crude Oil
S&P GSCI Crude Oil 3-
Month Forward
S&P GSCI Crude Oil Dynamic
Roll
S&P GSCI Crude Oil Enhanced
Roll
S&P GSCI Crude Oil Enhanced
Roll (Back-Tested)
From To
Jan. 17, 1995 Feb. 25, 1997 528 B 3 1 2 4 5
Feb. 25, 1997 Feb. 24, 1999 501 C 1 2 4 3 5
Feb. 24, 1999 Feb. 11, 2005 1,488 B 1 5 4 3 2
Feb. 11, 2005 April 30, 2007 553 C 1 2 5 3 4
April 30, 2007 April 10, 2008 239 B 1 3 2 4 5
April 10, 2008 Dec. 12, 2012 1,180 C 1 3 5 2 4
Dec. 12, 2012 Sept. 22, 2014 446 B 2 5 1 4 3
Sept. 22, 2014 Dec. 31, 2015 322 C 2 5 1 4 3
Entire Period 5,257 - 1 2 5 3 4 Source: Thomson Reuters DataScope Select. Data as of Dec. 31, 2015. Past performance is no guarantee of future results. Table is provided for illustrative purposes and reflects hypothetical historical performance. Please see the Performance Disclosure at the end of this document for more information regarding the inherent limitations associated with back-tested performance.
RESEARCH 12

A Liquidity Analysis of Crude Oil February 2016
Exhibit 20: Annualized Roll Yield
Period Number of Days C/B
S&P GSCI Crude Oil
(%)
S&P GSCI Crude Oil 3-
Month Forward (%)
S&P GSCI Crude Oil Dynamic Roll (%)
S&P GSCI Crude Oil Enhanced
Roll (%)
S&P GSCI Crude Oil
Enhanced Roll (Back-Tested) (%)
From To
Jan. 17, 1995 Feb. 25, 1997 528 B 31 15 31 33 33
Feb. 25, 1997 Feb. 24, 1999 501 C -18 -10 -8 -9 -3
Feb. 24, 1999 Feb. 11, 2005 1,488 B 9 17 14 12 11
Feb. 11, 2005 April 30, 2007 553 C -20 -7 6 -5 2
April 30, 2007 April 10, 2008 239 B 1 3 2 5 6
April 10, 2008 Dec. 12, 2012 1,180 C -17 -8 0 -8 -7
Dec. 12, 2012 Sept. 22, 2014 446 B 2 7 -1 4 3
Sept. 22, 2014 Dec. 31, 2015 322 C -17 -12 -23 -13 -13
Entire Period 5,257 - -4.1 2.0 4.8 2.5 4.0 Source: Thomson Reuters DataScope Select. Data as of Dec. 31, 2015. Past performance is no guarantee of future results. Table is provided for illustrative purposes and reflects hypothetical historical performance. Please see the Performance Disclosure at the end of this document for more information regarding the inherent limitations associated with back-tested performance.
We go on to look at the turnover statistic for each of the five roll strategies. Turnover is defined as the quotient of different futures contracts deployed to the number of calendar months involved. There are a total of 251 months during the period of January 1995 to December 2015. A second statistic that we are going to present is the average gap between the contract month and the calendar month. For example, for the S&P GSCI, the gap between the contract month and the calendar month for crude oil is equal to 2; this means that when the calendar month is January, the nearby futures contract is the March contract.
Exhibit 21: How Many Different Contracts are in Each Segment Period?
Period Number
of Months in Period
C/B S&P GSCI Crude Oil
S&P GSCI Crude Oil 3-
Month Forward
S&P GSCI Crude Oil Dynamic
Roll
S&P GSCI Crude Oil Enhanced
Roll
S&P GSCI Crude Oil
Enhanced Roll (Back-
Tested) From To
February 1995 February 1997 25 B 25 25 21 25 25
March 1997 February 1999 24 C 24 24 8 24 11
March 1999 February 2005 72 B 72 72 39 72 64
March 2005 April 2007 26 C 26 26 3 26 5
May 2007 April 2008 12 B 12 12 4 12 10
May 2008 December 2012 56 C 56 56 8 56 30
January 2013 September 2014 21 B 21 21 6 21 20
October 2014 December 2015 15 C 15 15 4 10 5
Grand Total 251 - 251 251 93 246 170
Turnover Rate (%) - - 100.0 100.0 37.1 98.0 67.7 Source: Thomson Reuters DataScope Select. Data as of Dec. 31, 2015. Past performance is no guarantee of future results. Table is provided for illustrative purposes and reflects hypothetical historical performance. Please see the Performance Disclosure at the end of this document for more information regarding the inherent limitations associated with back-tested performance.
RESEARCH 13

A Liquidity Analysis of Crude Oil February 2016
The turnover statistic for the S&P GSCI and the S&P GSCI Crude Oil 3 Month Forward was 100%. This means that a new contract was deployed for each passing calendar month. The S&P GSCI Crude Oil Dynamic Roll strategy had the lowest turnover of 37.1%. The new S&P GSCI Crude Oil Enhanced (back-tested) had the second-lowest turnover of 67.7%.
In Exhibit 22, we converted the contract months into numerical values and calculated the gap between the contract month and the calendar month, and summed up all the individual gaps. As mentioned earlier, the minimum value of the gap is equal to 2 in the case of the S&P GSCI. For the S&P GSCI 3 Month Forward, the gap is equal to 5 (2+3). For the S&P GSCI Dynamic Roll, on average, the gap is almost 17 months, while the gap for the new S&P GSCI Crude Oil Enhanced (back-tested) strategy is about 6.
Exhibit 22: How Much Is the Gap Between the Contract Month and the Calendar Month?
Period Number
of Months in Period
C/B S&P GSCI Crude Oil
S&P GSCI Crude Oil 3-
Month Forward
S&P GSCI Crude Oil Dynamic
Roll
S&P GSCI Crude oil
Enhanced Roll
S&P GSCI Crude Oil
Enhanced Roll (Back-
Tested) From To
February 1995 February 1997 25 B 50 125 62 54 50
March 1997 February 1999 24 C 48 120 490 116 224
March 1999 February 2005 72 B 144 360 506 196 232
March 2005 April 2007 26 C 52 130 659 152 281
May 2007 April 2008 12 B 24 60 160 56 33
May 2008 December 2012 56 C 112 280 1571 252 418
January 2013 September 2014 21 B 42 105 193 46 51
October 2014 December 2015 15 C 30 75 504 129 144
Grand Total 251 - 502 1,255 4,145 1,001 1,433
Average - - 2 5.0 16.5 4.0 5.7 Source: Thomson Reuters DataScope Select B. Data as of Dec. 31, 2015. Past performance is no guarantee of future results. Table is provided for illustrative purposes and reflects hypothetical historical performance. Please see the Performance Disclosure at the end of this document for more information regarding the inherent limitations associated with back-tested performance.
PROS AND CONS
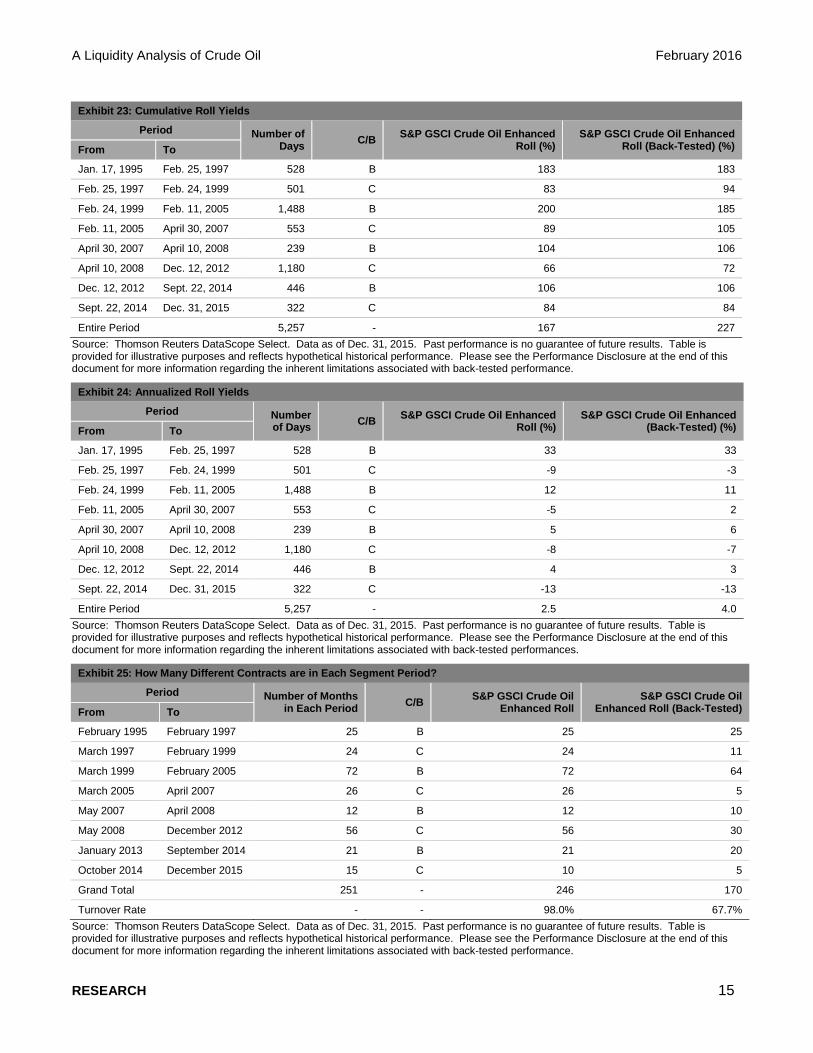
In terms of the comparison between the old and the new S&P GSCI Crude Oil Enhanced Roll strategy using back-tested data, Exhibits 23-26 tell an interesting story. The new roll strategy theoretically would have added approximately 1.5% in annual yield and reduced the turnover from 98% to 68%. The average gap between the contract month and the calendar month increased from 4.0 to 5.7, meaning that on average, the contracts deployed theoretically would be extended by two more months out on the curve.
RESEARCH 14
A Liquidity Analysis of Crude Oil February 2016
Exhibit 23: Cumulative Roll Yields
Period Number of Days C/B S&P GSCI Crude Oil Enhanced
Roll (%) S&P GSCI Crude Oil Enhanced
Roll (Back-Tested) (%) From To
Jan. 17, 1995 Feb. 25, 1997 528 B 183 183
Feb. 25, 1997 Feb. 24, 1999 501 C 83 94
Feb. 24, 1999 Feb. 11, 2005 1,488 B 200 185
Feb. 11, 2005 April 30, 2007 553 C 89 105
April 30, 2007 April 10, 2008 239 B 104 106
April 10, 2008 Dec. 12, 2012 1,180 C 66 72
Dec. 12, 2012 Sept. 22, 2014 446 B 106 106
Sept. 22, 2014 Dec. 31, 2015 322 C 84 84
Entire Period 5,257 - 167 227 Source: Thomson Reuters DataScope Select. Data as of Dec. 31, 2015. Past performance is no guarantee of future results. Table is provided for illustrative purposes and reflects hypothetical historical performance. Please see the Performance Disclosure at the end of this document for more information regarding the inherent limitations associated with back-tested performance.
Exhibit 24: Annualized Roll Yields
Period Number of Days C/B S&P GSCI Crude Oil Enhanced
Roll (%) S&P GSCI Crude Oil Enhanced
(Back-Tested) (%) From To
Jan. 17, 1995 Feb. 25, 1997 528 B 33 33
Feb. 25, 1997 Feb. 24, 1999 501 C -9 -3
Feb. 24, 1999 Feb. 11, 2005 1,488 B 12 11
Feb. 11, 2005 April 30, 2007 553 C -5 2
April 30, 2007 April 10, 2008 239 B 5 6
April 10, 2008 Dec. 12, 2012 1,180 C -8 -7
Dec. 12, 2012 Sept. 22, 2014 446 B 4 3
Sept. 22, 2014 Dec. 31, 2015 322 C -13 -13
Entire Period 5,257 - 2.5 4.0 Source: Thomson Reuters DataScope Select. Data as of Dec. 31, 2015. Past performance is no guarantee of future results. Table is provided for illustrative purposes and reflects hypothetical historical performance. Please see the Performance Disclosure at the end of this document for more information regarding the inherent limitations associated with back-tested performances.
Exhibit 25: How Many Different Contracts are in Each Segment Period?
Period Number of Months in Each Period C/B S&P GSCI Crude Oil
Enhanced Roll S&P GSCI Crude Oil
Enhanced Roll (Back-Tested) From To
February 1995 February 1997 25 B 25 25
March 1997 February 1999 24 C 24 11
March 1999 February 2005 72 B 72 64
March 2005 April 2007 26 C 26 5
May 2007 April 2008 12 B 12 10
May 2008 December 2012 56 C 56 30
January 2013 September 2014 21 B 21 20
October 2014 December 2015 15 C 10 5
Grand Total 251 - 246 170
Turnover Rate - - 98.0% 67.7% Source: Thomson Reuters DataScope Select. Data as of Dec. 31, 2015. Past performance is no guarantee of future results. Table is provided for illustrative purposes and reflects hypothetical historical performance. Please see the Performance Disclosure at the end of this document for more information regarding the inherent limitations associated with back-tested performance.
RESEARCH 15

A Liquidity Analysis of Crude Oil February 2016
Exhibit 26: How Much is the Gap Between the Contract Month and the Calendar Month?
Period Number of Months in Each
Period C/B S&P GSCI Crude Oil
Enhanced Roll S&P GSCI Crude Oil
Enhanced Roll (Back-Tested) From To
February 1995 February 1997 25 B 54 50
March 1997 February 1999 24 C 116 224
March 1999 February 2005 72 B 196 232
March 2005 April 2007 26 C 152 281
May 2007 April 2008 12 B 56 33
May 2008 December 2012 56 C 252 418
January 2013 September 2014 21 B 46 51
October 2014 December 2015 15 C 129 144
Grand Total 251 - 1,001 1,433
Average - - 4.0 5.7 Source: Thomson Reuters DataScope Select. Data as of Dec. 31, 2015. Past performance is no guarantee of future results. Table is provided for illustrative purposes and reflects hypothetical historical performance. Please see the Performance Disclosure at the end of this document for more information regarding the inherent limitations associated with back-tested performance.
SUMMARY
The popularity of the December and June contracts for crude oil cannot be simply explained by the term structure. When investors take a long position in those months, they create pockets of liquidity that may override the temporary exigencies of contango or backwardation. Given the sustained liquidity demonstrated by back-tested data with respect to approximately the past decade of such contracts, there may be extra room for capitalizing on such liquidity from a rolling strategy perspective.
RESEARCH 16
A Liquidity Analysis of Crude Oil February 2016
ABOUT S&P DOW JONES INDICES S&P Dow Jones Indices LLC, a division of S&P Global, is the world’s largest, global resource for index-based concepts, data and research. Home to iconic financial market indicators, such as the S&P 500® and the Dow Jones Industrial AverageTM, S&P Dow Jones Indices LLC has over 115 years of experience constructing innovative and transparent solutions that fulfill the needs of institutional and retail investors. More assets are invested in products based upon our indices than any other provider in the world. With over 1,000,000 indices covering a wide range of assets classes across the globe, S&P Dow Jones Indices LLC defines the way investors measure and trade the markets. To learn more about our company, please visit www.spdji.com.
RESEARCH 17

A Liquidity Analysis of Crude Oil February 2016
PERFORMANCE DISCLOSURE The S&P GSCI Crude Oil Dynamic Roll was launched on January 26, 2011. The S&P Crude Oil Enhanced was launched on September 22, 2009. The S&P GSCI Crude Oil was launched on May 1, 1991. The S&P GSCI Crude Oil 3 Month Forward was launched on December 6, 2007. All information presented prior to an index’s Launch Date is hypothetical (back-tested), not actual performance. The back-test calculations are based on the same methodology that was in effect on the index Launch Date. Complete index methodology details are available at www.spdji.com.
S&P Dow Jones Indices defines various dates to assist our clients in providing transparency. The First Value Date is the first day for which there is a calculated value (either live or back-tested) for a given index. The Base Date is the date at which the Index is set at a fixed value for calculation purposes. The Launch Date designates the date upon which the values of an index are first considered live: index values provided for any date or time period prior to the index’s Launch Date are considered back-tested. S&P Dow Jones Indices defines the Launch Date as the date by which the values of an index are known to have been released to the public, for example via the company’s public website or its datafeed to external parties. For Dow Jones-branded indices introduced prior to May 31, 2013, the Launch Date (which prior to May 31, 2013, was termed “Date of introduction”) is set at a date upon which no further changes were permitted to be made to the index methodology, but that may have been prior to the Index’s public release date.
Past performance of the Index is not an indication of future results. Prospective application of the methodology used to construct the Index may not result in performance commensurate with the back-test returns shown. The back-test period does not necessarily correspond to the entire available history of the Index. Please refer to the methodology paper for the Index, available at www.spdji.com for more details about the index, including the manner in which it is rebalanced, the timing of such rebalancing, criteria for additions and deletions, as well as all index calculations.
Another limitation of using back-tested information is that the back-tested calculation is generally prepared with the benefit of hindsight. Back-tested information reflects the application of the index methodology and selection of index constituents in hindsight. No hypothetical record can completely account for the impact of financial risk in actual trading. For example, there are numerous factors related to the equities, fixed income, or commodities markets in general which cannot be, and have not been accounted for in the preparation of the index information set forth, all of which can affect actual performance.
The Index returns shown do not represent the results of actual trading of investable assets/securities. S&P Dow Jones Indices LLC maintains the Index and calculates the Index levels and performance shown or discussed, but does not manage actual assets. Index returns do not reflect payment of any sales charges or fees an investor may pay to purchase the securities underlying the Index or investment funds that are intended to track the performance of the Index. The imposition of these fees and charges would cause actual and back-tested performance of the securities/fund to be lower than the Index performance shown. As a simple example, if an index returned 10% on a US $100,000 investment for a 12-month period (or US $10,000) and an actual asset-based fee of 1.5% was imposed at the end of the period on the investment plus accrued interest (or US $1,650), the net return would be 8.35% (or US $8,350) for the year. Over a three year period, an annual 1.5% fee taken at year end with an assumed 10% return per year would result in a cumulative gross return of 33.10%, a total fee of US $5,375, and a cumulative net return of 27.2% (or US $27,200).
RESEARCH 18

A Liquidity Analysis of Crude Oil February 2016
GENERAL DISCLAIMER © 2016 S&P Dow Jones Indices LLC, a division of S&P Global. All rights reserved. S&P, SPDR and S&P 500 are registered trademarks of Standard & Poor’s Financial Services LLC, a division of S&P Global (“S&P”). DOW JONES is a registered trademark of Dow Jones Trademark Holdings LLC (“Dow Jones”). These trademarks together with others have been licensed to S&P Dow Jones Indices LLC. Redistribution, reproduction and/or photocopying in whole or in part are prohibited without written permission. This document does not constitute an offer of services in jurisdictions where S&P Dow Jones Indices LLC, Dow Jones, S&P or their respective affiliates (collectively “S&P Dow Jones Indices”) do not have the necessary licenses. All information provided by S&P Dow Jones Indices is impersonal and not tailored to the needs of any person, entity or group of persons. S&P Dow Jones Indices receives compensation in connection with licensing its indices to third parties. Past performance of an index is not a guarantee of future results.
It is not possible to invest directly in an index. Exposure to an asset class represented by an index is available through investable instruments based on that index. S&P Dow Jones Indices does not sponsor, endorse, sell, promote or manage any investment fund or other investment vehicle that is offered by third parties and that seeks to provide an investment return based on the performance of any index. S&P Dow Jones Indices makes no assurance that investment products based on the index will accurately track index performance or provide positive investment returns. S&P Dow Jones Indices LLC is not an investment advisor, and S&P Dow Jones Indices makes no representation regarding the advisability of investing in any such investment fund or other investment vehicle. A decision to invest in any such investment fund or other investment vehicle should not be made in reliance on any of the statements set forth in this document. Prospective investors are advised to make an investment in any such fund or other vehicle only after carefully considering the risks associated with investing in such funds, as detailed in an offering memorandum or similar document that is prepared by or on behalf of the issuer of the investment fund or other investment product or vehicle. S&P Dow Jones Indices LLC is not a tax advisor. A tax advisor should be consulted to evaluate the impact of any tax-exempt securities on portfolios and the tax consequences of making any particular investment decision. Inclusion of a security within an index is not a recommendation by S&P Dow Jones Indices to buy, sell, or hold such security, nor is it considered to be investment advice. Closing prices for S&P Dow Jones Indices’ US benchmark indices are calculated by S&P Dow Jones Indices based on the closing price of the individual constituents of the index as set by their primary exchange. Closing prices are received by S&P Dow Jones Indices from one of its third party vendors and verified by comparing them with prices from an alternative vendor. The vendors receive the closing price from the primary exchanges. Real-time intraday prices are calculated similarly without a second verification.
These materials have been prepared solely for informational purposes based upon information generally available to the public and from sources believed to be reliable. No content contained in these materials (including index data, ratings, credit-related analyses and data, research, valuations, model, software or other application or output therefrom) or any part thereof (“Content”) may be modified, reverse-engineered, reproduced or distributed in any form or by any means, or stored in a database or retrieval system, without the prior written permission of S&P Dow Jones Indices. The Content shall not be used for any unlawful or unauthorized purposes. S&P Dow Jones Indices and its third-party data providers and licensors (collectively “S&P Dow Jones Indices Parties”) do not guarantee the accuracy, completeness, timeliness or availability of the Content. S&P Dow Jones Indices Parties are not responsible for any errors or omissions, regardless of the cause, for the results obtained from the use of the Content. THE CONTENT IS PROVIDED ON AN “AS IS” BASIS. S&P DOW JONES INDICES PARTIES DISCLAIM ANY AND ALL EXPRESS OR IMPLIED WARRANTIES, INCLUDING, BUT NOT LIMITED TO, ANY WARRANTIES OF MERCHANTABILITY OR FITNESS FOR A PARTICULAR PURPOSE OR USE, FREEDOM FROM ERRORS OR DEFECTS. In no event shall S&P Dow Jones Indices Parties be liable to any party for any direct, indirect, incidental, exemplary, compensatory, punitive, special or consequential damages, costs, expenses, legal fees, or losses (including, without limitation, lost income or lost profits and opportunity costs) in connection with any use of the Content even if advised of the possibility of such damages.
Credit-related information and other analyses, including ratings, research and valuations are generally provided by licensors and/or affiliates of S&P Dow Jones Indices, including but not limited to S&P Global’s other divisions such as Standard & Poor’s Financial Services LLC and S&P Capital IQ LLC. Any credit-related information and other related analyses and statements in the Content are statements of opinion as of the date they are expressed and not statements of fact. Any opinion, analyses and rating acknowledgement decisions are not recommendations to purchase, hold, or sell any securities or to make any investment decisions, and do not address the suitability of any security. S&P Dow Jones Indices does not assume any obligation to update the Content following publication in any form or format. The Content should not be relied on and is not a substitute for the skill, judgment and experience of the user, its management, employees, advisors and/or clients when making investment and other business decisions. S&P Dow Jones Indices LLC does not act as a fiduciary or an investment advisor. While S&P Dow Jones Indices has obtained information from sources they believe to be reliable, S&P Dow Jones Indices does not perform an audit or undertake any duty of due diligence or independent verification of any information it receives.
To the extent that regulatory authorities allow a rating agency to acknowledge in one jurisdiction a rating issued in another jurisdiction for certain regulatory purposes, S&P Global Ratings Services reserves the right to assign, withdraw or suspend such acknowledgement at any time and in its sole discretion. S&P Dow Jones Indices, including S&P Global Ratings Services, disclaim any duty whatsoever arising out of the assignment, withdrawal or suspension of an acknowledgement as well as any liability for any damage alleged to have been suffered on account thereof.
Affiliates of S&P Dow Jones Indices LLC, including S&P Global Ratings Services, may receive compensation for its ratings and certain credit-related analyses, normally from issuers or underwriters of securities or from obligors. Such affiliates of S&P Dow Jones Indices LLC, including S&P Global Ratings Services, reserve the right to disseminate its opinions and analyses. Public ratings and analyses from S&P Global Ratings Services are made available on its Web sites, www.standardandpoors.com (free of charge), and www.ratingsdirect.com and www.globalcreditportal.com (subscription), and may be distributed through other means, including via S&P Global Rating Services publications and third-party redistributors. Additional information about our ratings fees is available at www.standardandpoors.com/usratingsfees.
S&P Global keeps certain activities of its various divisions and business units separate from each other in order to preserve the independence and objectivity of their respective activities. As a result, certain divisions and business units of S&P Global may have information that is not available to other business units. S&P Global has established policies and procedures to maintain the confidentiality of certain non-public information received in connection with each analytical process.
RESEARCH 19