a literature review of spreadsheet technology formulas are expressions that perform op-erations on...
TRANSCRIPT

A Literature Review of Spreadsheet Technology
Alexander Asp Bock
IT University Technical Report Series TR-2016-199
ISSN 1600–6100 November 2016

Copyright c© 2016, Alexander Asp Bock
IT University of CopenhagenAll rights reserved.
Reproduction of all or part of this workis permitted for educational or research useon condition that this copyright notice isincluded in any copy.
ISSN 1600–6100
ISBN 978-87-7949-364-3
Copies may be obtained by contacting:
IT University of CopenhagenRued Langgaards Vej 7DK-2300 Copenhagen SDenmark
Telephone: +45 72 18 50 00Telefax: +45 72 18 50 01Web www.itu.dk
A Literature Review of Spreadsheet Technology
Alexander Asp Bock∗
Software and Systems, IT University of Copenhagen
November 2016
Abstract
It was estimated that there would be over 55 million end-user programmers in 2012 [1]in many different fields such as engineering, insurance and banking, and the numbers are notexpected to have dwindled since. Consequently, technological advancements of spreadsheets isof great interest to a wide number of people from different backgrounds. This literature reviewpresents an overview of research on spreadsheet technology, its challenges and its solutions. Wealso attempt to identify why software developers generally frown upon spreadsheets and howspreadsheet research can help alter this view.
Contents
1 Introduction 11.1 Spreadsheet Terminology . . . . . 2
2 Sheet Representation 3
3 Recalculation 33.1 Dataflow . . . . . . . . . . . . . . . 53.2 Parallel Recalculation . . . . . . . 63.3 Templates . . . . . . . . . . . . . . 7
4 Bugs In Spreadsheets 84.1 Smells . . . . . . . . . . . . . . . . 84.2 Data Clones . . . . . . . . . . . . . 104.3 Type Systems . . . . . . . . . . . . 11
4.3.1 Template Inference . . . . . 114.3.2 Static Type Systems . . . . 124.3.3 Units and Labels . . . . . . 13
4.4 Testing . . . . . . . . . . . . . . . 164.5 Assertions . . . . . . . . . . . . . . 18
5 Functional Spreadsheets 195.1 User-defined Functions . . . . . . . 195.2 Sheet-defined Functions . . . . . . 19
6 Visualisation 22
7 Related Work 23
8 Conclusion 23
9 Acknowledgements 24
References 24
Appendix 32
1 Introduction
Spreadsheets have existed since the 1970’s [2, 3,4] and many commercial and research spread-sheet applications are in widespread use today:LibreOffice’s open-source OfficeCalc [5], Gnu-meric [6], Apple’s Numbers [7], VisiCalc [4, 8],Lotus 1–2–3 [4] and Google spreadsheets [9].The most popular commercial application is un-doubtedly Microsoft Excel. Spreadsheet usersare so-called end-users or end-user programmers,people who are not trained IT professionals, butuse programs such as spreadsheets as a means toan end, and are often domain experts in theirrespective fields. These communities include,but are by no means limited to, scientific, finan-cial, engineering and governmental domains [10].
∗E-mail: [email protected]
1

2016
Spreadsheets have also been used for educationalpurposes such as an introductory course in pro-gramming [11, see section 6] [12, 13]. They vastlyoutnumber the number of professional program-mers, and so spreadsheet end-user programmingcan be viewed as a highly ubiquitous form of pro-gramming. As a result, the spreadsheet researchcommunity is highly active and largely agrees onthe popularity and abundance of spreadsheets asvaluable organisational tools [14].
Despite their abundance, there seems to bea tendency from the software development com-munity to frown upon spreadsheet programmingas not being “real programming” [15, 16, 17, 18].Casimir even suggests that spreadsheets are justplain boring for programmers [17].
Spreadsheets can generally be described asfirst-order, declarative and functional languageswith a visual interface. Compared to traditionalprograms they do not have a compilation step,but instead an edit-run work cycle [14]. Anotherdistinctive feature of spreadsheets is their sup-port for automatic recalculation where cell valuesare instantly updated in response to user modi-fications.
This study explores the current challenges inspreadsheet technology and consolidates, com-pares and critiques state-of-the-art approachesto solving them. More specifically, we aim toanswer the following questions:
1. What are some notable advances in spread-sheet technology?
2. How do these advances affect end-user de-velopment?
3. Do professionals in the software industrynot consider spreadsheet programming as“real” programming, and if so, why?
The contributions of this paper are a broadcoverage and critical discussion of differentspreadsheet technologies and their different foci.We stress that this literature review is not in-tended to cover all the current literature onspreadsheets, but to provide a general overviewof the research on spreadsheets for interestedreaders. We have chosen to divide the litera-ture in this study into several categories basedon which part of the spreadsheet paradigm theyaddress. In each section, we succinctly highlightthe research contributions, results and other rele-vant points and compare the approaches to those
from other papers if applicable. For the reader’sconvenience, a table is available in the appendixthat gives an overview of the referenced litera-ture and to which categories they belong.
We conclude with a small table of contents.
1.1 Spreadsheet Terminology
In this section, we provide a short introductionto some of the general spreadsheet terminologyused throughout this paper.
A spreadsheet is a graphical user interfacetool that consists of a number of worksheets eachof which is composed of a rectangular grid ofcells. Each cell can contain different values suchas text, a number, a date or a formula to namea few. A cell containing a formula can referto another cell by way of references. Rows andcolumns in the cell grid each have a unique num-ber and letter respectively. Numbers usuallystart at 1 and letters at A. A reference can beeither absolute or relative. An absolute refer-ence refers to a cell using its exact address suchas $B$10 (tenth row, second column). A relativereference instead contains offsets relative to thecontaining cell; the relative reference -1, 5 incell $B$10 would refer to the cell at $A$15. Notethat the type of a reference does not affect for-mula evaluation, but affects the formula when itis copied. There are different ways of displayingreferences. The R1C1 format lists rows followedby columns. For instance, R2C1 is an absolutereference to the cell in the second row and firstcolumn and R[-1]C[-1] is a relative reference toa cell located one row and column above and tothe left of the cell containing the reference. Inthe A1 format, the columns are listed first. Ab-solute references are prefixed with a dollar signand relative references omit it, thus relative tocell B2, A1 is a reference to the previous columnand row, while $B$10 is an absolute reference tocolumn B and the tenth row. Both formats sup-port combinations of absolute and relative rowsand columns in a single reference along with cellranges that refer to a cell area. Lastly, Funcalc[19] uses another format called the C0R0 format,which is zero-based and indexes with the columnfirst, but is otherwise similar to the R1C1 for-mat. Zero-indexing is convenient for array accessin most contemporary programming languagessince they also use zero-based indices, so Fun-calc uses this format internally.
2
2016
Formulas are expressions that perform op-erations on cells to yield a result. A classicalexample is the SUM function: SUM($A$1:$A$20)
sums the values in the cells spanned by the range$A$1:$A$20, i.e. the first twenty rows of the firstcolumn. Most modern spreadsheet applicationssupport a wide range of these types of aggre-gation functions. They also generally supportfunctions for calendars, currencies and databasesetc.
2 Sheet Representation
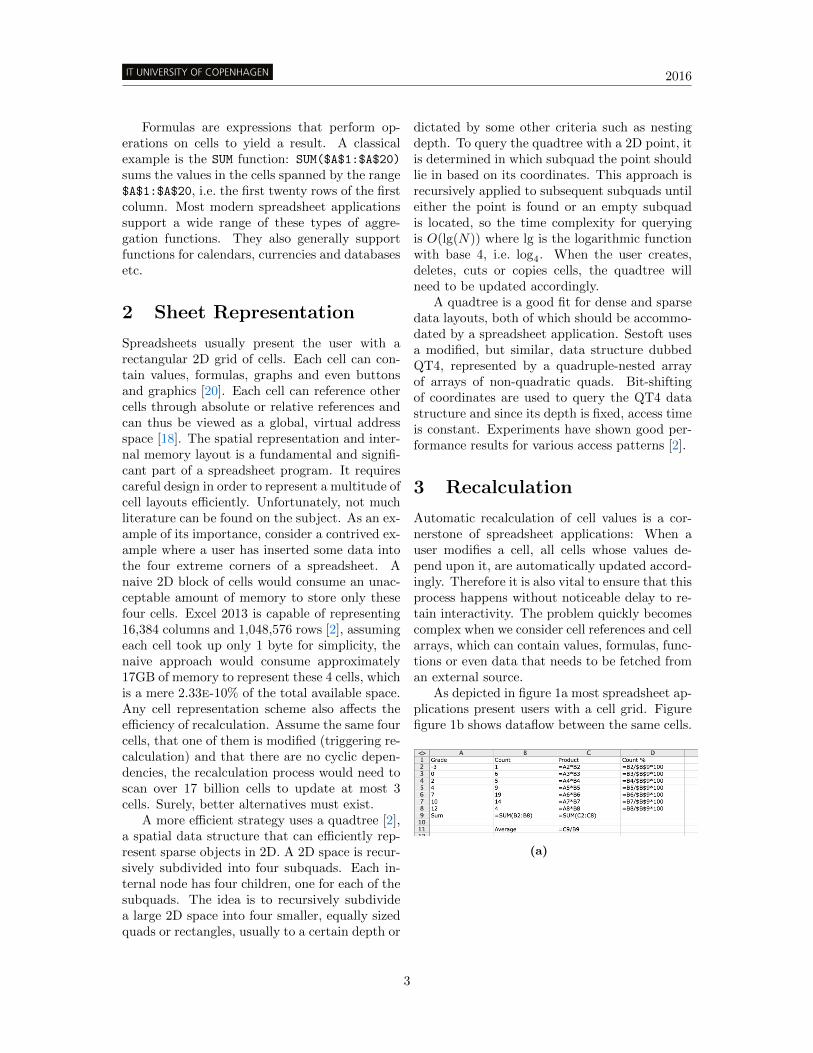
Spreadsheets usually present the user with arectangular 2D grid of cells. Each cell can con-tain values, formulas, graphs and even buttonsand graphics [20]. Each cell can reference othercells through absolute or relative references andcan thus be viewed as a global, virtual addressspace [18]. The spatial representation and inter-nal memory layout is a fundamental and signifi-cant part of a spreadsheet program. It requirescareful design in order to represent a multitude ofcell layouts efficiently. Unfortunately, not muchliterature can be found on the subject. As an ex-ample of its importance, consider a contrived ex-ample where a user has inserted some data intothe four extreme corners of a spreadsheet. Anaive 2D block of cells would consume an unac-ceptable amount of memory to store only thesefour cells. Excel 2013 is capable of representing16,384 columns and 1,048,576 rows [2], assumingeach cell took up only 1 byte for simplicity, thenaive approach would consume approximately17GB of memory to represent these 4 cells, whichis a mere 2.33e-10% of the total available space.Any cell representation scheme also affects theefficiency of recalculation. Assume the same fourcells, that one of them is modified (triggering re-calculation) and that there are no cyclic depen-dencies, the recalculation process would need toscan over 17 billion cells to update at most 3cells. Surely, better alternatives must exist.
A more efficient strategy uses a quadtree [2],a spatial data structure that can efficiently rep-resent sparse objects in 2D. A 2D space is recur-sively subdivided into four subquads. Each in-ternal node has four children, one for each of thesubquads. The idea is to recursively subdividea large 2D space into four smaller, equally sizedquads or rectangles, usually to a certain depth or
dictated by some other criteria such as nestingdepth. To query the quadtree with a 2D point, itis determined in which subquad the point shouldlie in based on its coordinates. This approach isrecursively applied to subsequent subquads untileither the point is found or an empty subquadis located, so the time complexity for queryingis O(lg(N)) where lg is the logarithmic functionwith base 4, i.e. log4. When the user creates,deletes, cuts or copies cells, the quadtree willneed to be updated accordingly.
A quadtree is a good fit for dense and sparsedata layouts, both of which should be accommo-dated by a spreadsheet application. Sestoft usesa modified, but similar, data structure dubbedQT4, represented by a quadruple-nested arrayof arrays of non-quadratic quads. Bit-shiftingof coordinates are used to query the QT4 datastructure and since its depth is fixed, access timeis constant. Experiments have shown good per-formance results for various access patterns [2].
3 Recalculation
Automatic recalculation of cell values is a cor-nerstone of spreadsheet applications: When auser modifies a cell, all cells whose values de-pend upon it, are automatically updated accord-ingly. Therefore it is also vital to ensure that thisprocess happens without noticeable delay to re-tain interactivity. The problem quickly becomescomplex when we consider cell references and cellarrays, which can contain values, formulas, func-tions or even data that needs to be fetched froman external source.
As depicted in figure 1a most spreadsheet ap-plications present users with a cell grid. Figurefigure 1b shows dataflow between the same cells.
(a)
3

2016
A2
B4
C9
C11
B9
C5 D5
A5
C6 D6
A6
C7 D7
A7
C8 D8
A8
B5
B6
B7
B8
C4 D4
A4
C3 D3
B3A3
B2
C2 D2
(b)
Figure 1: A spreadsheet (figure 1a) and its cor-responding support graph (figure 1b) [2].
Such a graph is used in many spreadsheetapplications to track dependencies between non-empty cells and efficiently recalculate those af-fected by an update. One such graph is the sup-port graph defined by Sestoft [2]. In this graph,there is an edge in the graph from a source cellto a target cell if the target cell depends on thesource cell, and the source cell is said to sup-port its target cells, hence the name. Becausethe edges point in the inverse direction of datadependencies, the support graph is analogous toa dataflow graph [21] where data flows along itsedges. Conversely, the dependency graph is theinverse graph of the support graph where edgessignify cell dependencies. The nomenclature forthese graphs is not standardised, so we defineexact terms for them here to avoid confusion.For example, Hoon et al. use used-by and usesrespectively [22]. We choose to use the termssupport graph and dependency graph since theymost accurately capture their intent, and sincethe latter is used extensively in the literature ongraphs and should thus be more immediate to alarger audience.
Before discussing some approaches to recal-culation, we explain the difference between staticand dynamic cell reference cycles [2]. When re-calculating cells, cyclic dependencies are prob-lematic. In Excel, the offending cells are marked
by a #CYCLE! error value. If one cell reference,perhaps transitively, refers to itself, a static cy-cle has been found. On the other hand, a dy-namic cycle occurs when cells contain non-strictexpressions such as the IF function [2]. For non-strict functions, not all arguments need to beevaluated in order to fully evaluate the function.Consequently, dynamic cycles may or may not bediscovered during recalculation. A spreadsheetcan have both types of cycles, and a spreadsheetwith a dynamic cycle also has a static cycle, butthe converse is not true.
Sestoft [2] proposes two different strategiesfor recalculation which use the support graph.We will only discuss the one which is currentlyused in the Funcalc research spreadsheet applica-tion [19], called standard minimal recalculation.
The recalculation algorithm is minimal in thesense that it will visit each cell affected by a userupdate at most once. Barring the discovery ofcycles, recalculation will make sure that the val-ues of all cells are updated after its completion.Each cell can be in any of four states: dirty be-cause it has not been computed yet, computingbecause its value is currently being computed,enqueued because the cell is currently waiting tobe picked for computation on a queue, or upto-date if the cell has been updated. Recalculationis divided into two phases: Mark and Evaluateas described below. The algorithm starts out byidentifying the recalculation roots, the set of cellsthat have been modified and all volatile cells thatneed to be recalculated, and putting them in arecalculation queue. It then makes sure that allcells affected by these roots are marked as dirty.This is the Mark phase. In the Evaluate phase,a cell is picked from the queue. If it is not alreadyuptodate or computing (which would mean thatthere is a cycle), it is either dirty or enqueued,so it is marked as computing and evaluated. Theevaluation of formulas lead to the evaluation ofthe cells that the formula expression refers to byway of recursive function calls. When a cell hasbeen fully evaluated, it is marked as uptodateand its set of supported cells that are markeddirty are added to the queue. All these cells aremarked as enqueued before they are added tothe queue. If a cell is discovered that is in statecomputing, then a cycle has been found. Theuse of the enqueued state means that the recal-culation can distinguish between cells that arewaiting on the queue to be computed and cells
4

2016
which have already been picked from the queueand are currently being computed. If we did notuse separate states but used computing for bothof them, cells could be put on the queue thatwould have that state and then be reported aswrongly causing a cycle when they were pickedoff of the queue. We illustrate this fact in fig-ure 2. Imagine that a user changed the constantin cell A1 from 42 to 43, so A1 is the only recal-culation root. All cells are initially marked asdirty. Cell A1 will be marked as uptodate as it isa constant and cells A2 and B1 will be added tothe recalculation queue. We would now normallyhave the scenario depicted in figure 2b. Let cellB1 be the next cell to be picked from the queue.In this case the system would report a cycle be-cause after cell B1 has been fully evaluated it willadd its set of supported cells to the recalculationqueue and marking each of them as computinginstead of enqueued. Then when cell A2 is pickedoff of the queue and its state is found to be com-puting, the system will erroneously believe thatit has found a cycle. Thus using enqueued allowsus to differentiate between cells that are on thequeue and those that are not.
A B1 43 =A1+1
2 =A1+B1
(a) A spreadsheet with some simple dependen-cies. Cell A1 supports both cells A2 and B1,while cell B1 also supports cell A2.
A1uptodate
A2enqueued
B1 enqueued
(b) The corresponding support graph for thespreadsheet in figure 2a.
Figure 2: A spreadsheet and its support graph.
Sestoft also proposes an approximate topo-logical sort on the order of cell dependencies toavoid deep recursive calls which may exceed thestack depth. This approach is also suggested in[23].
Serek and Poulsen examined optimised recal-culation using the support graph in Funcalc [24].Flemberg and Larsen further improved this al-gorithm in their Master thesis [25]. We discusstheir work in section 3.2.
In [22], Hoon et al. implement a spreadsheetapplication using the pure and lazy functionallanguage Clean. This has an impact on recalcu-lation, because the spreadsheet is evaluated in alazy fashion. Cell updates that are not visible tothe user, because they are outside the view port,need not be re-evaluated until they come intoview. This recalculation strategy is especiallyefficient if the user stays within the current areain the spreadsheet and is modifying a particularcell multiple times before moving the screen, be-cause resources are not expended trying to eval-uate dependencies of that cell until they becomevisible. Using Sestoft’s strategy, recalculationof affected cells is done regardless of whetheror not they are visible, wasting potentially un-needed computations. In contrast, lazy evalu-ation may affect moving around in the spread-sheet if a user moves into an area with lot of de-pendencies whose recalculation has been delayed.However, this could be done asynchronously toavoid affecting the user interface, and cells whosevalues have not yet been computed could be as-signed the value #GETTING DATA which is used byExcel for long-running calculations. The loadingcould also be performed speculatively and asyn-chronously by pre-computing some of the cellsthat surround the user’s current viewport underthe assumption that users will eventually moveto some other part of the spreadsheet. Morework is necessary to fully understand and com-pare these two approaches.
3.1 Dataflow
Dataflow will be a recurring term in this study,and so requires a more precise definition since ithas multiple interpretations in the literature.
Fine-grained dataflow is implemented inhardware and dates back to the 1970’s at MIT,with active researchers like K. Arvind and R.S. Nikhil. It was conceived in an attempt todesign an entirely new hardware model thatcould rival the Von Neumann machine modeland avoid the so-called Von Neumann bottleneck[26, 27]. Arvind and Nikhil developed the paral-lel language Id that was compiled into a paral-
5

2016
lel machine language that used dataflow graphsto model the flow of computations and theirdependencies [27]. The instructions were thenexecuted on a special Tagged Token DataflowArchitecture (TTDA) with data-driven instruc-tion scheduling based on the data dependen-cies of the dataflow graph. Computationshad to wait for their dependencies to be com-puted, but otherwise independent computationscould execute in parallel. Another example arealso so-called asynchronous or self-timed circuits[28]. While not specifically associated with fine-grained dataflow, they exhibit similar properties.These circuits are not governed by a central clockas in contemporary CPUs, but instead use sig-nals to communicate, akin to the flow of datathat triggers execution of instructions in the Id
language.The language SISAL or Streams and Itera-
tion in a Single Assignment Language, its accom-panying compiler by Sarkar [29], and the worksof John Hennessy and David Cann [30, 31, 32,33] are examples of coarse-grained dataflow, andwas implemented in software. This difference ingranularity led to their respective names, sincesoftware can be considered coarse-grained com-pared to a more low-level, fine-grained hardware-and instruction-level approach. Coarse-graineddataflow programming was at its peak in themid 1980’s, but later declined due to the scarcityand cost of shared-memory multi-core proces-sors, that are much more abundant today andexist on smaller scales such as personal laptopsand smartphones.
The final type of dataflow is called syn-chronous dataflow programming. Gilles Kahninvestigated this concept in 1974 with a formal-isation of the semantics of a simplified languagefor communicating parallel processes modelledby a schema or network, that closely resemblesa dataflow graph [34]. Lustre was designed forreactive systems in 1991 by Halbwachs et al. [35].The authors define a dataflow model, and a lan-guage which augments this model with a conceptof time-dependent flows, clocks and operators forconstruction of time-sensitive and event-drivenprograms. The synchronous aspect of Lustre isthe formulation of conditions and relations usingthe semantics of the language that control theinterplay of events.
3.2 Parallel Recalculation
Parallel programming has received renewed in-terest from the computer science research com-munity in the last decade. A widespread man-ifestation of parallel machines is the shared-memory multi-core system where processorsshare a global address space, used for both stor-age and communication between parallel threadsand processes. Today such systems can be foundin anything from desktop and laptop computersto graphics processing units and mobile phones.However, leveraging this performance requiresexpert knowledge and experience to deliver per-forming and scalable solutions, something thatend-users are rarely equipped to do. Systemsthat automatically use the available resourcesand accelerate end-user software are thus veryattractive. This is further emphasised becausereal-world spreadsheets can easily become hugeand overwhelming and contain complex formulasthat can take a long time to recalculate. Somespreadsheets applications thus opt to allow theuser to temporarily disable automatic recalcula-tion during the development of spreadsheets, andlater enable it when the spreadsheet’s design andlayout are satisfactory.
Contrary to what we expected, we did notfind significant literature about parallel spread-sheets. We did discover a few patents nonethe-less, but most of them are described in a vagueor slightly obfuscated manner.
Previously, in section 3, we discussed dif-ferent recalculation strategies and the dataflowand dependency graphs and mentioned how thegraphs are suitable for parallel execution. Giventhis fact and the prevalence of contemporarymulti-core systems, it is perhaps surprising thatfew attempts have been made to enable parallelrecalculation. This is possibly either a testamentto the difficulties in creating a satisfactory solu-tion or that the subject is just not as interestingas the other aspects of spreadsheets.
Flemberg and Larsen [25] attempted to ac-celerate spreadsheet recalculation in Funcalc [19]in their Master thesis based on Sarkar’s work onan optimising compiler for the SISAL language[36]. Sarkar developed algorithms for partition-ing and scheduling dataflow computations whichhe claimed could be used for SISAL and any par-allel language. Flemberg and Larsen suggest animproved heuristic for the partitioning algorithm
6

2016
and provide a new scheduling algorithm usingthe Task Parallel Library (TPL) [37]. They donot support sheet-defined or volatile functions(see section 5.2 for the latter) and support a sub-set of the built-in functions, in order to test thegeneral applicability of their partitioning algo-rithm. They use the TPL’s dataflow constructsto create a dataflow pipeline for the partitionedtasks. They do not perform any benchmarksdue to the effort of engineering required to eval-uate performance and the fact that any speed-up could be attributed to either partitioning,scheduling or both. The results indicated thattheir new heuristic is better suited for partition-ing spreadsheet computations than Sarkar’s orig-inal heuristic. Furthermore, all the requirementswere fulfilled in all three example spreadsheets,created by the authors themselves.
Distributed systems for accelerated evalua-tion of spreadsheet computations have been ex-plored by Abramson et al. and Nadiminti et al.[38, 39]. Abramson et al. suggest a distributedsolution where an external tool is in charge ofscheduling computations. The results are thenread back into the spreadsheet. They focusmainly on simulations in Excel. Their system,ActiveSheets, consists of an Excel front-end anda back-end that automates the entire process us-ing Nimrod, a research tool [40] which has a com-mercial counterpart, EnFuzion [41]. The parallelevaluation of the spreadsheet is based on the flowof data between cells, and is thus an example ofcoarse-grained dataflow (see section 3.1). Inde-pendent computations are sent to Nimrod andexecuted in parallel. Their system exploits bothinter- and intra-cell parallelism. The authors donot provide any details to the actual implementa-tion of ActiveSheets, but provide two case stud-ies.
Nadiminti et al. [39] developed the Excel plu-gin ExcelGrid, and similar distributed systemsthat use grid systems, using .NET and a ser-vice oriented architecture (SOA). The systemwas designed to run multiple instances of thesame task using different parameters, similar toa distributed SIMD (Single Instruction, Mul-tiple Data) model. The user activates Excel-Grid through a graphical user interface, select-ing input and output cells and the system col-lects input parameters from the spreadsheet en-tered by the user. The workload is distributedto a cluster of desktop computers that share a
file system, then subsequently collected and re-turned via callbacks. The system can run onboth enterprise-local networks and global net-works. The authors conduct two experimentsusing different grid systems, but disclose few de-tails about them, such as the size of their exper-iments.
Commercial applications also exist. Spread-sheetGear [42] is a collection of commercial plu-gins for Excel, one of which is a calculationengine that boasts multi-threaded recalculation.HPC Services for Excel developed by Microsoftenables workbooks and user-defined functions(those defined in Visual Basic, not sheet-definedfunctions, see section 5 for a discussion) to be off-loaded to run on clusters of compute nodes viaa SOA interface [43].
3.3 Templates
Also known as models, templates are minimalor compressed spreadsheets that specify a pre-defined layout to be used in development. Tem-plates have to be instantiated into actual spread-sheets in which development can take place.Spreadsheet templates provide several benefits.First, the template is usually compressed suchthat repeated columns and rows of similar dataare collapsed into a single one. For instance,some columns might contain the same formulasand can thus be collapsed into one. Second, theycan be created by a domain expert and used bynovice users, reducing errors and deviations. Fi-nally, if the template is correct and error-free, soare any spreadsheet instantiations [44, 45]. Tem-plates are thus relevant for our continued discus-sion on error handling in spreadsheets.
Abraham and Erwig [46] implemented an al-gorithm for inferring templates in. In earlierwork, the Visual Template Specification Lan-guage or VISTL [47] and the Gencel [45] systemwere developed to specify, and generate spread-sheets from templates, respectively. A user spec-ifies the spreadsheet template in VISTL and in-stantiates the template in Gencel according tohis or her requirements. Gencel ensures thatreference, range and type errors are not presentsuch that the instantiated spreadsheet is also freefrom these errors, and that it abides by the orig-inal structure of the template. The intent of thiswork is to automate template creation by infer-ring a minimal, underlying template from a given
7

2016
spreadsheet. The authors use the spatial analy-sis algorithms from UCheck (see section 4.3.3) todetermine the overall layout of the current sheet.This avoids inferring a template from unrelateddata in the same sheet. Next, sets of similar for-mulas are identified. The sets include as manyof these as possible to generate a minimal tem-plate. Two formulas are deemed similar if theyare cp-similar, i.e. if one could have resulted froma copy-paste of the other. Additionally, if thedata is of the same type there is strong evidencethat two formulas are cp-similar, otherwise thesystem has been made tolerant to minor data de-viations in formulas. These sets, that are part ofa similar pattern, are then overlaid to producethe template.
4 Bugs In Spreadsheets
In light of the ubiquity of spreadsheets, it isalarming that many studies have found that theyoften contain a large amount of errors [48, 49,50], perhaps due to overconfidence in end-users’ability to avoid errors [48, 51, 52] or the trustthat is put into computers to compute correctresults [53]. We do not mean the built-in errorcodes such as #N/A or #DIV/0!, but bugs intro-duced by human error such as referring to anincorrect cell yielding an incorrect value in thatcell. As observed by Powell et al. No studieson spreadsheets themselves have shown errors tobe rare or inconsequential [50]. This is escalatedby reports of losses of up to billions of dollars[54, 55, 56, 57], because spreadsheets are usedfor important business decisions. Consequently,a large part of the research on spreadsheets hasbeen devoted to error detection and handling,as well as methods for visual feedback to reportthose errors in a manageable and understandablemanner. For further reading on spreadsheet er-rors, Kruck [57] provides an overview of studiesof spreadsheet errors, Powell et al. [50] conducta critical review of the literature on spreadsheeterrors in and Zhang et al. [58] evaluate the effi-ciency in spreadsheet anomaly detection of Am-Check [59], UCheck [11] and Dimension [60] inan empirical study.
There have been many suggestions for classi-fying spreadsheet errors. Powell et al. [50] sum-marise the requirements for a satisfactory taxon-omy of error classification, and list some of the
problems with existing classifications. We willnot attempt to classify errors here. Instead wewill categorise the relevant literature and dividethem into the subsequent sections to reflect theirapproach to error detection and handling. Thesetechniques include smells [10, 59, 61, 62], dataclone detection and reparation [63], type systems[11, 14, 23, 64] and systems that use units, labelsor dimensions in the spreadsheet [16, 60, 65, 66,67, 68], and debugging and testing [21, 51, 52,69, 70, 71].
4.1 Smells
Code smells are yet another concept borrowedfrom the world of software development. Firstidentified by Fowler [72], they are a collectionof indications of bad practices and patterns thatmay warrant a refactoring of code. They makethe code “smell” wrong, hence the name. Re-search has attempted to translate existing codesmells to spreadsheets or define new smells [10,59, 61]. We will collectively refer to these asspreadsheet smells.
Dou et al. [59] created AmCheck for detect-ing and repairing ambigous computation smells,which occur when a group of cells have differentcomputational semantics in their formulas. Sucha group is called a cell array and is a frequentconstruct in spreadsheets. The smell can occurwhen a cell formula is copy-pasted to other cells,initially retaining its computational semantics,but later on modifications change the semantics.The authors define two types of smells: Themissing formula smell occurs when some cellsin a cell array are not defined by any formula,and the inconsistent formula smell occurs whencells have differing formulas. The system ana-lyses the spreadsheet and tries to detect thesetypes of errors using a two-step process: First,cell arrays are identified. This involves a prelim-inary step of finding isolated regions (snippets inthe text) using the same approach suggested byAbraham et al. [11] using soft and hard fences(see section 4.3.3). Second, it tries to find acommon pattern, and if that fails, the programsynthesis method from [73] is employed to createa common pattern that satisfies the constraintsimposed by the collective formulas of the cell ar-ray. The user is then presented with suggestionsfor correcting identified mistakes. Their exper-iments on the EUSES corpus [74] showed that
8

2016
44.7% of the spreadsheets that contained cell ar-rays, also contained at least one smell (and 27.3%of spreadsheets with formulas). They also reportsome cases of false positives, but AmCheck al-lows users to reject such cases through manualinspection. They also report false negatives thatare caused by cell arrays not being detected prop-erly. AmCheck does not handle conditionals informulas which was one source of the false neg-atives. This was left as future work. Dou et al.remark that some smells will go undetected usingsystems such as UCheck [11] that check consis-tency using user-defined labels, or systems thatuse dimension inference [60, 66, 67] if the smellsare not part of the erroneous cells detected bythose systems.
Zhang et al. [58] evaluate the precision, recallrate, efficiency and scope of AmCheck, UCheck[11] and Dimension [60], and found that Am-Check outperformed them both, although theother two systems could find different types ofanomalies. Suggestions for improvements aregiven for all systems.
In later work, Dou et al. [75] cre-ated CACheck based on AmCheck, yieldinghigher precision in detecting smelly cell arrays.CACheck differs from AmCheck in the followingways: CACheck can detect inhomogeneous cellarrays. A cell array is homogeneous if all cellformulas in the array refer to cells in the samerow/column for column- and row-based cell ar-rays respectively (a row-based cell array is a rowof consecutive cells). On the other hand, a cellarray is inhomogeneous if there exists a cell in thecell array whose formula does not abide by thecriteria of homogeneity. New observations aboutcell arrays enable CACheck to identify cell arrayswith higher precision. For instance, if two sets ofcell arrays, one row-based and one column-based,can describe the same region, one is selected andthe other removed from consideration. CACheckis evaluated on both the EUSES corpus [74] andthe Enron corpus [76], and not just the former.
Dou et al. [61] also developed the TableChecksystem for detecting clones of and smells in ta-bles with the same or similar computational se-mantics. Here, tables refer to rectangular areasof cells and the smells refer to missing or incon-sistent computations between table clones. Thisis much like the cell arrays defined by AmCheckand CACheck. More specifically, a table clone isa pair of tables whose corresponding cells share
the same headers and have the same computa-tional semantics. They are also required to haveat least two rows and columns. We now give aterse description of the algorithm. TableCheckproceeds by first determining the types of allcells using the methods described in [77] and[78], it then infers table headers and creates alookup table with headers as keys and cell ref-erences that are covered by the given header asvalues. Table headers are identified by scanningleft and up, for row and column headers respec-tively, and finding the first label cell (a cell con-taining text barring cases such as error valueslike #N/A etc.). This lookup table is then usedto identify table clones by creating groups of ta-ble clones that satisfy the requirements for ta-bles being clones. Each group of table clonesis then examined for smells such as the missingformula smell for cells that are missing formulaswhen other cells in the table have formulas, orthe inconsistent formula smell for cells that havedifferent computational semantics. The algo-rithm is also extended to suppress false positives.The authors state that TableCheck outperformsAmCheck [59], CACheck [75], CUSTODES [62],UCheck [11], Dimension [60] and Excel, detect-ing table clones and smells in the EUSES spread-sheet corpus [74] with 92.2% and 85.5% precisionrespectively, while those frameworks only achieveat most a 35.6% smell detection rate. Also, someof the aforementioned frameworks were built todetect different smells, for instance, UCheck wasdeveloped as a type checker for spreadsheets, notfor table clone detection. TableCheck found that21.8% (352 out of 1617 spreadsheets with for-mulas) in the EUSES corpus contain manuallyverified table clones.
Cheung et al. [62] developed the CUSTODESframework to detect smells using a clusteringtechnique that groups cells together based onstrong and weak features. Strong features areformulas and references between cells (dependen-cies), and their similarity with other cells. Weakfeatures are things such as labels, layouts andfonts. Labels are also used in checking consis-tency in spreadsheets, which we will discuss fur-ther in section 4.3.3. CUSTODES works as fol-lows: First, cell formulas are identified. Second,the identified formulas are then clustered basedon their strong and weak features. Finally, abootstrapping algorithm is applied to the results.Smells are detected by using a local outlier factor
9

2016
or LOF for each clustered cell, that finds out-liers using the density of the feature space of thecluster cells. LOF is based on the assumptionthat the density of an inlier should be similarto the density of its neighbours, while the den-sity of an outlier is lower. The LOF score ofeach cluster cell is the ratio of the local densityof the cell and the average local density of itsneighbours. Based on this detection, the out-liers are then categorised into four smell cate-gories: Missing formula smell, dissimilar refer-ence smell, Dissimilar operation smell and Hard-coded constant smell. Experiments showed thatCUSTODES outperforms existing smell detec-tion frameworks.
4.2 Data Clones
A data clone is created when users copy andpaste cells that contain formulas. If the userwishes to maintain consistency between all dataclones and their original, he or she needs to up-date all copies. This is problematic since it maynot be clear where a clone originated. This is re-lated to the don’t-repeat-yourself or DRY princi-ple from software engineering, where data clonesare also used to identify repeated code. Detec-tion of data clones can inform the user of theirpresence and he or she can take actions by e.g.employing alternative techniques to achieve asimilar goal such as linking where data clonesare automatically updated when their sourcechanges.
Hermans et al. [63] developed a technique fordetecting data clones in spreadsheets. They de-fine a clone as a copy of a cell and a clone clusteras a collection of clones that have the same val-ues as another cluster. Near-miss clone clustersare clusters where almost all values are the same,which can happen if a copy is modified, but theoriginal cluster is not. They are useful for de-tecting data clones that should be equal, but arenot, perhaps due to missing updates in the clone.The authors found that 86 of the spreadsheetsin EUSES corpus [74] (out of more than 4000spreadsheets) contained manually verified dataclones (for sensible, minimal algorithmic param-eters), yielding a precision of 54.8%. This sug-gests that data clones are somewhat prevalent inreal-world spreadsheets (data clones were foundin approximately 5% of the spreadsheets in theEUSES corpus that contain formulas).
In their algorithm, cells that contain numer-ical values or formulas are first identified (cellsthat contain string values are ignored since theyare usually copied as labels, e.g. “Total” to de-note a sum of values). A lookup table is createdfor all cell values with their values as keys andall their locations as values. Entries that occuronly once as either a constant or a formula can-not have clones because they were never copied,and are thus removed from the table. All cells inthe table are then clustered together with theirneighbours if the neighbours also occur in the ta-ble and are all either constants or formula cells.The clustering technique should be capable ofclustering irregular data layouts, similar to theCUSTODES framework in [62] that is also inde-pendent of existing layouts. However, the paperdoes not mention whether diagonal neighboursare considered, which would slightly limit itsability to detect irregular layouts. Whether thishas any implications in practice is doubtful sincecells are usually structured as rectangular areasconsisting of rows and columns without mean-ingful diagonals. In the final step, formula clus-ters are compared to each constant cluster. Twoclusters match if they contain the same values(and so are not near-miss clusters. The match-ing criteria can be configured to detect them).If the clusters differ in size, the smaller cluster’svalues must be a subset of the bigger cluster.
The algorithm finds some false positives dueto unforeseen use of data clones: E.g. studentgrades are all low numbers that are repeated, andvalues can denote labels, such as years, which arealso repeated as constants and in formulas acrossthe spreadsheet. The authors visualise the dataclones by generating a dataflow diagram (see sec-tion 6 for further details) and displaying pop-upsat each node of the diagram to distinguish a clonefrom an original. The visualisation is based onprevious work in [10] and [78].
Two real-word case studies were made to un-cover the implications of data clones. The au-thors found that the visualisation of data cloneshelp users identify copies of data that they werenot previously aware of, and that near-missclones help indicate clones that should have beenupdated.
10

2016
4.3 Type Systems
Type systems have long served to providecompile-time error detection of type misuse inprogramming languages, and today’s program-ming languages have rich and powerful type sys-tems. For example, it rarely makes sense to adda string to an integer. Type systems generallycome in two forms: static and dynamic. Lan-guages such as C/C++, C#, Java and Haskellare statically typed. Values must be explicitlyannotated with their type (barring cases where atype inference system can infer its type from con-text) and types are determined at compile-time.Furthermore, a value with one type cannot be as-signed to a variable with an incompatible type,although some systems relax this constraint e.g.in order to allow assignment of an integer to avariable of floating-point type. Languages suchas Python, Ruby and Smalltalk are dynamicallytyped. Their types are determined and checkedat runtime and do not need to be explicitly an-notated in the code (there are mixtures such asPerl). Thus assignments between variables ofdifferent types are usually allowed. Languageslike Scala and F# also boast a robust type infer-ence system to alleviate the task of type annota-tion. Type systems could bestow the same ben-efits onto spreadsheets as they do for imperativeand functional languages, especially consideringthat spreadsheets can be considered first-order,functional languages.
Most spreadsheet implementations use re-laxed variations of a type system to differen-tiate between integers, strings, dates etc. Mi-crosoft Excel does little type checking [14] whichin some cases can result in unexpected errors.For instance in Microsoft Excel, some compar-isons between an empty string and a numberalways results in false [23]. In Google spread-sheets, summing a range of cells containing num-bers with one cell containing a string, silentlyignores the string cell and sums the remainingvalues as shown in figure 3. Type checking couldhelp avoid such (presumably accidental) situa-tions. Whether this is actually an error dependson user perception and the design of the spread-sheet application, but in a programming lan-guage context this should definitely constitutean error.
Figure 3: Cell range summation in Googlespreadsheets. The cell range A1:A8 is summedin cell A9 using the SUM function. All cells ex-cept for cell A3, that contains a string, containintegers. Cell A3 is silently ignored in the sum-mation.
The introduction of such a system requires aninvestment from the end-users to learn how typesand type inference work, and the cost of such aprocess is likely why type systems are not foundas integrated systems in commercial spreadsheetapplications [16]. As a result, many researcherstend to draw on the principles of these systems toimplement their work, but keep the details trans-parent and provide explanatory and clear errormessages in a format that is understandable forend-users.
4.3.1 Template Inference
Abramson and Erwig [14] have developed a typesystem and type inference algorithm for spread-sheets that is used to guide the inference of accu-rate spreadsheet templates created using the Vi-sual Template Specification Language (VISTL)[47].
The type checking system is based on the no-tion of cp-similarity between cells. Two cells areconsidered cp-similar if the contents of one cellcould have resulted from a copy-paste from theother cell, much like data clones. This is a likelyscenario in spreadsheets, which support sophis-ticated copy operations. The authors introducebasic types and typing judgements for values, op-erations, cells, formulas, spreadsheets and tem-plates, as well as a complete typing system. The
11

2016
arguments for function types are explicitly givenbasic types to restrict functions to be first-order.Additionally, a type expectation is defined whichmaps cell addresses to constant types. Rows andcolumns in the template are then compressed iftheir types agree, in the same sense that a list ofintegers can be described as [Int] in functionallanguages. The authors use this definition to de-fine spreadsheet types as a set of column (androw) types that each contain a sequence of celltypes. Adjacent columns and rows of the sametype can then be compressed.
The template inference algorithm proceedsby annotating all cells in a spreadsheet by anequivalence function a to generate an extendedspreadsheet. Here, the equivalence function isthe definition of upstream type equivalent be-tween two cells, i.e. two cells are defined to be up-stream type equivalent if they have the same celltypes in a spreadsheet S. Since type-equivalenceis a stronger condition than cp-similarity, typeerrors are detected which would not have beencaught using the definition of cp-similarity alone.All columns are grouped according to this equiv-alence, and each group is maximally overlaid,i.e. grouped together as a single column in theresulting template. Lastly, the formulas are up-dated and the columns are shifted according tothe maximum possible overlay (maximal accord-ing to the numbers of columns that can be over-laid). The process repeats until there are nomore columns in S that can be overlaid and thealgorithm is repeated for all rows in the spread-sheet. The result is a compressed version of theoriginal spreadsheet S. A user can try to infera template from a spreadsheet and the inferencealgorithm will then report any type errors thatprohibit columns or rows from being overlaid.
We also mention ClassSheets by Engels et al.[79], which the authors describe as a more ex-pressive form of spreadsheet specification. In-stead of specifying templates in a visual lan-guage such as VISTL, it is specified in a di-agram language that borrows concepts fromthe object-oriented Unified Modeling Language(UML). However, ClassSheets are automaticallytransformed into VISTL templates. Similar to aUML diagram, the template is specified by, pos-sibly nested, relations that are annotated withnames for identification and can include cellsthat they refer to. If a spreadsheet sums a listof income values, its template might be specified
by a diagram called Income with a total of typeinteger and another diagram called Item witha one-to-many relation between them. Itemalso contains an integer called value that issummed in the Income diagram to compute thetotal income for a set of items. The sum canrefer to the values of Item using dot notation:Item.value. Formal definitions of ClassSheetsare also given in the paper and ensure thatClassSheets definitions are consistent and well-formed. The benefits of ClassSheets over VISTLtemplates include being more compositional instructure, explicit type annotations and reuse byreferring to other diagrams. However, VISTLshould be much more accessible for end-usersthan the UML-inspired layout of ClassSheets, es-pecially with the type annotations.
4.3.2 Static Type Systems
Cheng et al. [23] devised a method for staticanalysis of spreadsheets and associated programs(macros or VBA programs) in the more classicalsense. They define a core spreadsheet language,its syntax and semantics for the ensuing discus-sion. One such language expression is the eval-uation of an entire spreadsheet, where the au-thors define a topological order similar to Sestoft[2]. Interestingly, they do not define the topolog-ical order as total to permit parallel computationof the ordering (see section 3.2 for a discussionof parallel recalculation strategies). The systemties abstract predicates to zones in an abstractdomain, as defined in [64]. An abstract pred-icate is either a type or an abstract formula,while an abstract formula is defined as the ef-fect on types in the spreadsheet which can bepropagated through the spreadsheet e.g. (Z1,
float), which denotes a sheet zone Z1 with typefloat. Types are simplified like in [14]. For ex-ample, the type of the addition of two floats:float + float can be simplified to just float.Zones are thus compact representations of ab-stract formulas or types that carry type informa-tion through the spreadsheet, and are ultimatelyused in the static analysis. During static analy-sis, zones of equal type can be joined by a numberof operators. For instance, two adjacent zones oftype int can be joined into a single zone.
Cheng et al. implemented the static analy-sis in VBA and OCaml for Excel, and the toolwas tested on the EUSES spreadsheet corpus
12

2016
(spreadsheets that only contain constants wereconsidered trivial and excluded in the experi-ments since types can be directly inferred foreach cell) [74]. Their results indicate that theirtype system is reasonably effective at finding truepositives in the EUSES corpus, with a manuallyverified detection rate of 30% (45 true positivesout of 142 spreadsheets detected by the system).Some of the false positives were caused by in-tentional misuse of spreadsheet functions. Theauthors argue that these false positives wouldhave been hard to detect in a testing framework,and so the number of false positives is accept-able. However, as the user would still need tomanually verify each identified case, we disagreethat this is acceptable. Furthermore, other typesystems such as those that infer and use user-defined units and labels should also be able tocatch these kinds of errors. We discuss thesesystems later in section 4.3.3.
Cheng et al. are the only authors that con-sider data validation. In spreadsheets, a cellcan be augmented with data validation to ensurethat users fill in a name that is a string or a num-ber that is within a specific range. Such infor-mation is useful when devising a type system forspreadsheets. An interesting question is whetherthis would benefit other systems discussed in thissection. They also find that their assumptionsabout the initial state of a spreadsheet and tak-ing into account data verification information setby the user, faults are detected that would oth-erwise not be caught by testing frameworks suchas those presented in section 4.4.
Lastly, we briefly mention a type system im-plemented by Florian Biermann in the Funcalcproject [19]. As a spreadsheet is evaluated inthe order described in section 3, the type systemsimply checks the types for all function applica-tions and formulas, and raises appropriate errorsif the expected types do not match. This systemdoes not verify dynamic type errors that are onlyvisible at runtime, e.g. an IF statement in a for-mula. The system is still in development at thetime of writing and subject to change, so we willnot discuss it further.
4.3.3 Units and Labels
As remarked by Erwig et al. in [16], a statictyping may incur a high learning cost for end-users who are not acquainted with type systems.
This higher cost is similar to what is describedin the attention investment model discussed in[15], that models the likelihood of the investmentof programmers in an activity based on the ac-tivity’s expected payoff, cost and risk. Erwiget al. take a different approach to types whereunits are inferred from cells, that are then usedto perform unit checking. A unit is simply an ab-stract concept such as fruit. A cell may denotethe number of apples harvested by a company,although the type apple does not really existin the spreadsheet. One could easily imagine aspreadsheet where a user attempts to add twodifferent, abstract units. An ordinary type sys-tem would not be able to detect this, since theaddition of “apples” and “oranges” involve theaddition of two integers which would type check(unless of course units were embedded in the typesystems as types or can be defined by the user assuch [53]). The authors did not implement thesystem in this work, but discuss and flesh out thedetails for a fully fledged system. Their effortsare implemented in [11] which we discuss later.
Similar to the other literature discussed sofar, Erwig et al. define a calculus to reason aboutspreadsheets, but in the context of units. Unitexpressions are defined to allow for meaning-ful combinations of units: Dependent units andand and or units. In the context of the au-thors’ fruit harvesting example, dependent unitsrepresent units such as Fruit[Apple[Green]]
(or alternatively Fruit[Apple][Green]) be-cause an apple is a fruit and has a colour.The colour is also dependent on the Apple
unit as not all units may be green. Theother two expressions allow the system to ex-press units like Fruit[Orange]&Month[May] orFruit[Apple|Orange], which are both situa-tions that can arise in two-dimensional tables, inthis instance with fruits as columns and monthsas rows. They also define a context-free syn-tax, unit transformations for spreadsheet func-tions and operations, typing judgements, andunit simplification rules that allow complex unitsto be reduced to well-formed units. Failure toperform this reduction leads to a unit error in thespreadsheet which can be reported to the user.Although the authors avoid types entirely in thework described here, future work will attemptto consolidate their unit checking system with atype system by treating units as types.
Burnett and Erwig [65] implement the system
13

2016
described above in later work. A base layout ruleis given that is used to infer units based on thelayout of cells. The system allows the user tovisually reconfigure the inference if the inferredunits are not satisfactory, by inserting lines thatdelimit cells and help the system correctly dis-tinguish headers, borders and content. Bordersare denoted by blank cells. Compared to the sys-tems we have discussed thus far, this system isnot fully automated and requires some user in-tervention to define and refine the logical rulesthat govern the unit inference. The authors alsobriefly discuss how the system could incorporatedimensions (such as meters per second etc.) intheir system, which would need additional rulesto infer division of e.g. meters with square me-ters. They also suggest a “unit view” for Ex-cel, where the units for all cells are displayedinstead of their cell contents. This is similar tothe “formula view” where the formula definitionsare displayed. This is a very interesting sugges-tion, in part because no other paper has sug-gested a similar extension to the author’s knowl-edge. This would allow end-users to quickly getan overview of the inferred units to help definecustom rules or understand and correct mistakes.The next unit system we discuss, will feature anautomated unit inference system. As with anyother non-automated system for end-user devel-opment, one is inclined to ask how much workmust be done by the user, and if they are willingto invest resources into learning the system. Noempirical studies were done in this work, but isleft as future work.
In later work, Erwig et al. [11] define a newconcept of proxy headers and implement a set ofalgorithms for header and unit inference. Theirsystem is called UCheck. One benefit of auto-matic unit and header inference is that spread-sheets do not have to be manually annotatedwith units as some other work has done [53].Nevertheless, in the first example given (usingfruit harvesting), the Fruit unit is explicitlygiven as a unit in order to give the fruits in thespreadsheet a common ancestor. This is requiredsince the system has no notion of the concept offruits, and thus cannot infer this information it-self, and so the base unit must be introducedsomehow. A similar argument can be used forthe months given in another example. Althoughthe necessary amount of annotation is minimalin this example, the system still seems to require
some annotation, and whether the amount ofannotation will remain minimal in bigger, real-world spreadsheets is not known. The headerinference algorithm uses a combination of cellclassifications based on spatial and cell informa-tion. For example, a cell can be a header, a corecell that participates in some intermediate cal-culations, a footer that contains an aggregationformula or a filler cell used to separate tables.The system also uses cell distances and cell refer-ences to further classify cells. Configurable con-fidence levels are used to combine classificationinformation from different algorithms. Headersare also assigned a level, since one header canhave sub-headers. The inference algorithm alsoaccounts for individual preference in header po-sitioning. The system assumes sensible table lay-outs in spreadsheets. This is a fair assumption,but indicates that the system may fail in caseswhere an uncommon layout is used, but it wouldbe very difficult to design a system that couldaccount of all possible, arbitrary scenarios, so itmakes sense for UCheck to focus on common lay-outs.
In the evaluation of their system, a compar-ison between UCheck and a static type systemwith user-defined annotations [53] is made basedon a single case of unit error detection in only10 spreadsheets, and the systems are deemedequally effective. In our opinion, this is a some-what unfair comparison since the comparison ismade for a relatively small set of spreadsheets.The authors also remark the lack of a represen-tative set of spreadsheets is not available, thoughtwo years prior to their publication, the EU-SES spreadsheet corpus was published [74] whichmany systems in this literature review has usedin the evaluation of their work. The authorsmight not have been aware of this, but the setof spreadsheets used in their work (28 in to-tal) is relatively small. They suggest an exten-sion to the UCheck framework which can pro-vide context-specific examples and change sug-gestions to the user. The latter is something thatthe GoalDebug system provides and has been de-veloped by the same authors [69]. We will dis-cuss GoalDebug in section 4.4. The authors ar-gue that explicit type annotation is cumbersomefor users, especially in large spreadsheets wheremanual annotation might become extensive. Incontrast, their system requires fewer annotationsthat introduce the base units from which the re-
14

2016
maining units can be inferred. They also arguethat the system in [53] fails to detect some errorsthat their system does not.
Labels and dimensions can also be used incombination to locate errors in spreadsheets.Here, we mean labels similar to units as definedin UCheck [11] and dimensions as in units ofmeasure e.g. meters squared or m2. One couldimagine a user trying to add different currenciesor other units of measure. This is the approachtaken by Chambers et al. [60, 66], and has beensuccessfully implemented in F# [80]. They com-bine label and dimension inference [67] to checkfor errors that neither system would have dis-covered on their own. For example, adding theprice per item of two different items is perfectlylegal when considering only dimensions, but isillegal for labels as the addition is done usingtwo different items such as apples and oranges.Conversely, adding quantities of apples is fine forlabels, but if one quantity is specified in thou-sands, only dimension checking would catch theerror. The paper does not discuss dimensionsas ranges of cells, but as units of measurementsuch as those found in the SI unit system [81].One benefit to using an existing system is thatSI units can be combined and inferred based onpre-existing conventions, and so this system doesnot need additional annotation as was the casewith Abramson et al.’s UCheck system and asystem discussed later [53]. However, some an-notation might still be needed in order to avoidambiguous or dimensions that prove difficult toparse. On the other hand, units can be arbi-trary rather than confined to the definitions ofthe SI system. The combination and textual rep-resentation of labels are taken from Erwig et al.’swork in [16] with some simplified rules. The sys-tem follows five steps: First, headers are inferredas described in [11, 77], and then labels are in-terpreted from the strings found in the headers.The system then assigns the horizontal and verti-cal axes to dimension and label checking. This isa common pattern in spreadsheets, where one ta-ble header denote some properties and the otheraxis denotes some objects that possess said prop-erties. Dimension and label inference is thendetermined for each cell using a series of typ-ing judgements and rules given in the paper. Ifno errors occur in this step, all dimensions areconsidered fully qualified. For example, the di-mension {m, δ}, where m signifies meters and δ
signifies a missing dimension, can be both speedms and acceleration m
s2 based on the choice of δ.The most common choice is picked based on aheuristic.
Coblenz et al. [68] introduce their frame-work for error detection in spreadsheets calledSLATE, or A Spreadsheet Language for Accen-tuating Type Errors, which closely resembles thework by Erwig et al. [16, 65]. In this paper,dimensions such as acceleration m
s2 are referredto as units, while labels are properties such asan apple. To avoid confusion, we instead referto these as dimensions and units respectively.As in [16], units can be generalised into a com-mon ancestor type. For example, both applesand oranges are fruits. There are a few differ-ences however. Users must manually enter di-mension and unit information in parentheses incells, requiring them to learn the system, andbecause the annotation is simply added paren-theses, there is no highlighting or differentiationfrom actual cell content. Errors are propagatedthrough operations, and a resulting label from amultiplication or division retains all labels of itsoperands. This means that a multiplication ofapples and oranges results in the label: (apples,oranges) which is used to detect an error. Foraddition and subtraction, the label is instead thecommon ancestor of the labels of the operands:(fruit), since it is common in spreadsheets to addand subtract different objects.
Inspired by the theoretical foundations laidout by Erwig et al. in [16], Ahmad et al. [53]also developed a static type system. Their sys-tem differs from Erwig’s because it requires ex-plicit type annotations, and the former is also atype system based on units. The authors deviatefrom Erwig et al. by defining two relationshipssimilar to those known from object-oriented pro-gramming: is-a and has-a. The first relationshipdescribes units that are subcategories of someheader. For example, a Toyota is-a car. Thesecond describes unit properties, such as a carhas-a steering wheel. Unit notation, rules andformal typing judgements are also introduced toreduce unit expressions to well-formed ones thatthe system can reason about. Operators for join-ing unit declarations on common relationshipsare also defined. Two advantages to explicit typeannotation is that the system can accommodateuncommon spreadsheet layouts where it wouldbe harder for the UCheck system to infer the
15

2016
correct units and labels, and secondly the unitsare less prone to ambiguity since they are given.Although structured layouts are more common,this advantage should not be overlooked [11].The generated error messages require the userto understand the is-a and has-a relationships todecipher the error messages and correct the mis-takes. Constructing error messages that bridgethe gap between formal type systems and end-users is a difficult problem, which could limit thesystem’s commercial use. The authors note thatan automated system is planned in future work.
In their experimental evaluation, the authorsclaim that they did not need to understand theproblem domains to annotate the spreadsheets(23 spreadsheets in total from [82]). We arguethat this might not always be the case in com-mercial settings, where domain knowledge is es-sential to annotate cells with sensible unit names.We found the set of spreadsheets used for the ex-periments relatively small. Nonetheless, the au-thors find a single, true error in the spreadsheets.The authors do however mention a larger, moredetailed, empirical study as part of their futurework. They also suggest a header inference algo-rithm that uses natural language processing andmachine learning techniques that learn from userfeedback.
Ahmad et al. [16] also compare their workwith that of Erwig et al. [65]. They note thatthey describe a type system with weaker rulesand that the lack of a distinction between the is-aand has-a relationships leads to incorrect unit in-ference. To support their claim, they present twoexamples where their system would have failedbut Ahmad et al.’s system would not. On theother hand, Erwig et al. argue that their sys-tem catches errors that Ahmad et al.’s systemdoes not, and that while the has-a relationshipenables more fine-grained information, it compli-cates automatic header inference. Further workneeds to be done in order to fully compare theseworks. Finally, we suggest a combination of au-tomatic and manual type or unit annotation, toallow users to disambiguate cases where the au-tomatic inference fails.
Lastly, we touch on an interesting observa-tion. It would useful to have type systems thatcould be toggled, so that ordinary users arenot overencumbered by information and that thesystem would normally only be used by expertusers.
4.4 Testing
Testing is an essential and ubiquitous part ofsoftware development. It reassures us that theprograms we construct do what they are sup-posed to do and/or fail on the appropriate in-put, although they cannot prove the absence ofbugs. Given the large number of errors found inspreadsheets and the grave financial implicationsthey have, there is a lot of research in this area.Testing calculations in a spreadsheet is impor-tant in order to ensure proper results in criticalengineering and business applications. This re-emphasises the intuition that it is beneficial toapply software development principles to spread-sheets, as noted by Panko, and that spreadsheetdevelopment must embrace extensive testing inorder to be taken seriously as a profession [49].
Testing is especially important for spread-sheets as several of the commercial and non-profit applications exhibit behaviour that wouldconstitute an error in a software developmentcontext, but are nonetheless allowed. For ex-ample, summation across cell ranges silently ig-nore non-integer values (see figure 3 on page 11).Whether this should be treated as an error is upto the designers of the spreadsheet, but the re-viewed literature favours treating these as errors[22].
A focus of much research is the “What YouSee Is What You Test” or WYSIWYT approach[21, 83], where the user incrementally tests thespreadsheet as it is being developed, and test-ing is complemented by visual feedback to guidethe user through the process [14, 21, 69]. Thisenables errors to be caught earlier and recti-fied rather than later. The methodology isbased on dataflow analysis and testing criteriaof imperative programs. Rothermel et al. intro-duce the notion of definition-use-adequacy or du-adequacy. A definition is the location of a cell’svalue and a use is the location of the usage ofthat cell. Together they form a du-pair, and acell can have multiple du-pairs associated withit if there is more than one cell using its defini-tion. The du-adequacy of a cell is thus the de-gree of exercised du-pairs that directly or tran-sitively reference a cell’s definition and so con-tributes to its output value. This is extrapolatedto include all du-pairs such that each pair is ex-ercised and they influence a given output cell.Du-associations and execution traces are com-
16

2016
bined in order to determine the degree to whicha cell is tested. The du-associations are given bythe cell relation graph, which resembles the sup-port graph defined by Sestoft in [2], but whoseedges are only defined by the relation betweenformulas. To invoke the system, a user clicks ona validation tab in a cell to tell the system thatthe cell’s value is correct. This action is prop-agated through the cells that contribute to thiscell’s output. The validation tab contains a ques-tion mark if a cell’s output was previously tested,but a change in the spreadsheet requires that itbe retested. If the cell is fully tested, it contains acheckmark instead. The degree to which this ad-equacy criterion is satisfied determines the bor-der colours of cells in the spreadsheet. Cells thatare more tested appear bluer and less tested cellsappear redder. The border colours of these cellsare therefore similar to the degree of test cover-age, a term found in software development whereit denotes the percentage of code paths that havebeen tested in a project. For example, cells us-ing non-strict functions such as IF will only befully tested if both branches have been taken.The authors’ choice of colours can be drawn intoquestion. In our opinion, the combination of redand green provide a better notion of contrast andmeaning for end-users as these colours are com-monly found in our everyday lives (e.g. trafficlights and entrance-exit signs.). However, this isalso a matter of taste and aesthetics, so there isno inherently “correct” choice. Another issue iscells that have a range of correct values where asingle test may not be representative of its cor-rectness: The test might succeed for a couple ofvalues within the range, but fail for others. Oth-ers have investigated automatic test case gener-ation for spreadsheets which could be combinedwith the WYSIWYT methodology [70, 71, 84].
Property-based testing has seen much inter-est since the invention of the Haskell libraryQuickCheck [85] for automatically generating in-put values for tests, alleviating the burden of de-vising test cases. Property-based testing wouldbe attractive in a spreadsheet context as well, es-pecially when considering user-defined functions,which we explore in section 5.
Fisher et al. [71] have developed a systemfor automatic test case generation based on theWYSIWYT methodology, and implemented inthe Forms/3 spreadsheet language [20]. The sys-tem only handles integer values. Untested cells
are initially marked by a red border. The userselects one or more cells to test, and the cellis tested with the current input and marked astested by a check mark. In addition, the colourof its border, and that of all other cells thattransitively helped produce the final result, ischanged to a shade of blue to reflect their testcoverage, where opaque blue represents full cov-erage. This is very similar to the work in [21,83]. The system keeps track of test coverage viacell references. The system can optionally en-hance the visual feedback by displaying dataflowarrows, which is found in most spreadsheet ap-plications, using the colouring scheme just de-scribed. Any modification to a tested cell willemit a change of the colour if some cells subse-quently need to be retested. The end-user thushas a highly intuitive, visually enhanced, testingframework available which can be used incremen-tally during spreadsheet development. The testcase generation process is initiated by pressing a“Help Me Test” button, and the user can refinethe test case generation by selecting a subset ofcells that he or she wishes to test. The systemthen attempts to generate test cases that exer-cise the du-associations that are involved in theselected output cells. Although not explained indetail in the paper, it is assumed that the userwill then validate the outputs resulting from thegenerated tests with the WYSIWYT methodol-ogy.
The authors present two approaches to testcase generation. A straight-forward randomapproach, where sample input values to cellsare generated randomly, and a more intelligent,goal-oriented approach that uses constraints andbranch functions to generate more meaningfultest cases. For random test case generation itmay be difficult to generate appropriate inputvalues that ensure that user-selected cells aretested properly, but on the other hand it is sim-pler to implement and may provide satisfactoryresults for most trivial scenarios. Conversely,the goal-oriented approach is more complex, butmay provide better test cases. The goal-orientedmethod is a simplified version of the Chainingapproach by Ferguson et al. [70]. Both ap-proaches were extended with range informationwhich the authors included themselves based oninspection of the formulas in the spreadsheets.Ultimately, the goal-oriented approach provesmost effective according to a series of empiri-
17

2016
cal studies without any range information fortest input data providing the best percentage oftest case generation coverage with a 100% cov-erage on feasible du-associations on half of thespreadsheets (10 in total), and the same methodwith range information having the better per-formance. In general, the two Chaining ap-proaches outperformed the random test case gen-eration strategy. We make one crucial observa-tion: Since property-based testing relies heavilyon a solid type system to infer appropriate testcases, it would be sensible to assume that a ro-bust type system for spreadsheets would benefitsuch a testing framework.
The papers discussed thus far have been con-cerned with testing spreadsheets. In contrast,Abraham et al. lay the theoretical groundworkfor a system for debugging spreadsheets calledGoalDebug [86] and substantiate it in [69]. Theframework lets users input the expected valuefor a cell that outputs an incorrect value and arethen given a list of suggested changes that willyield the expected value in that cell. The list isranked using heuristics to provide the user withthe best solutions first.
The system provides a graphical interface,from which the GoalDebug system can be ini-tialised. Different types of change suggestionscan be achieved using different strategies definedby the authors, and different heuristics are usedfor different suggestions. Examples of a changesuggestion would be changing a reference to an-other or replacing a constant. Constraints aresimplified as much as possible to simplify con-straint solving.
The authors define copy-equivalence wheretwo formulas contain the same relative refer-ences and one could therefore have been createdfrom the other by copy. This is analogous tothe cp-similarity defined by Abramson and Er-wig in [14] and clones defined by Hermans et al.[56]. Copy-equivalence is considered more pre-cise than structural equivalence and is used torank suggestions. References that are closer byManhattan distance are also ranked higher bythe assumption that proximity and relevance arecorrelated.
The GoalDebug system is interesting becauseit deals with guiding the user through solvinghis or her mistakes (as one would expect froma software debugger) while the other literaturein this section informs the user that something
is wrong, but not necessarily what the cause isor how the problems should be rectified. Forexample, a message: “Type conflicts: In D8: ex-pected Num, found Undef” from [14] does nottell the user how to fix the conflict nor does ittell him or her where the problem originates inthe spreadsheet. This observation is not meantto devalue the research in the other papers, butsimply highlights an important difference fromthe viewpoint of end-users. The authors inte-grate the UCheck system from [11] to rank sug-gestions that keep units intact higher than thosewho do not. Presumably using the UCheck sys-tem, all change suggestions are type-checked inorder to ensure that they do not introduce typeconflicts if they are introduced.
The paper reports that GoalDebug is effec-tive at generating suggestions that correctly re-cover from spreadsheet errors and at rankingchange suggestions. The authors intend to con-duct empirical studies with end-users to evaluatethe system’s usability, and also suggest combin-ing WYSIWYT with GoalDebug.
4.5 Assertions
Assertions are usually used in tests or to ensurethat the program never enters an illegal state.They test some condition and if that conditionproves false, the program is terminated. For ex-ample, assert (x == 1) will terminate the pro-gram if x is not equal to one. In this section, wewill look at how assertions can be used in spread-sheets.
To start things off, we examine a simplisticapproach used in the Funcalc project. A par-ticular worksheet is used for testing, where cer-tain cells contain a 1 if the output matched theexpected output, 0 otherwise, similar to asser-tions but without terminating the program. Thespreadsheet then needs to be manually inspectedin order to assess the result of the tests. In soft-ware development, it is commonplace for a testtool to automatically collect all tests in a project,execute them and then output a report that re-capitulates the results as well as a multitude ofother useful features. The lack of a standard-ised testing tools may be one reason as to whysoftware developers frown upon spreadsheets. Aslightly more sophisticated approach is taken byGnumeric [6], where a collection of Perl scriptscheck one or more cell values after a spreadsheet
18
2016
has been evaluated [87]. In this sense, testingis slightly more automated but test spreadsheetsstill need to be created and tests are created inan external language with a steep learning curvefor end-users. The simplistic approaches takenby Funcalc and Gnumeric are effective from anend-user usability perspective since they can in-spect and verify values themselves without anytraining.
Burnett et al. [51] implement assertions forspreadsheets in the Forms/3 spreadsheet lan-guage [20]. Contrary to the two previous ap-proaches, these assertions are an integrated partof the spreadsheet and are specifically geared to-wards end-user development. Assertions on cellvalues can be defined by the user, and these as-sertions are automatically propagated throughthe implicit dataflow graph in the spreadsheetusing logical reasoning and interval arithmetic(the authors do not explain this process in de-tail). Consequently, the system can also reportassertion conflicts due to propagated assertionsthat do not agree on an output, apart from acell’s assertions that report an erroneous valuein that cell. The propagation takes cell formu-las into account: If cell A has the assertion thatits value must be in the interval [1, 10] and cellB contains the formula A − 1, then the propa-gated assertion on cell B is [0, 9]. This is veryuseful as assertions can be defined on input cellsthat are part of a long set of dependent cellsthat use these inputs for intermediate computa-tion. Otherwise, the user would need to defineall these assertions manually. In software termi-nology, a cell’s own assertion is its postconditionthat must hold after the cell’s contents has beenevaluated, while the upstream assertions that af-fect the cell are its preconditions that must holdbefore the cell is evaluated. Empirical studieshave shown that users were comfortable with us-ing assertions and that they discouraged over-confidence in users, something that behaviouralscience denotes as common in software develop-ment and end-user programming, and in humansin general.
5 Functional Spreadsheets
5.1 User-defined Functions
Most modern spreadsheet applications alreadyallow users to define their own functions. Forexample, Excel permits user-defined functionsthrough Visual Basic and can interface withother external languages, and attempts haveeven been made to embed programs in cells [18].Visual Basic can also be slow [15]. However,writing and debugging functions in an externallanguage requires end-users to understand a pro-gramming language and thus requires a high in-vestment. Many of the implementations in theliterature use an external language to interfacewith the spreadsheet application. Cheng et al.used VBA as glue between an OCaml implemen-tation of their type system and Excel [23]. Ofcourse, IT professionals can write the requiredfunctions for the end-users at the cost of effi-ciency and control [2]. Research has thus at-tempted to find alternative ways of letting end-user programmers define their own functions, butwhat are some of the benefits to user-definedfunctions? First, they embody the don’t-repeat-yourself or DRY principle from software devel-opment that discourages unnecessary repetitionof code, which in turn lowers the risk of errors.Second, they create a logical and physical lo-cation for function code and its accompanyingdocumentation that is easy to distribute. Third,functions can be compiled to high-performancebyte- or machine code, and in fact this is whathappens in Funcalc [19].
5.2 Sheet-defined Functions
Research has investigated user-defined functionsthat can be defined directly in the spreadsheet [2,15]. Peyton-Jones describes these as user-definedfunctions and argues that functions must be de-fined in the spreadsheet “because it is the onlycomputational paradigm understood by our tar-get audience” [15], but this is not a suitable termas it uses the same name for referring to func-tions defined in an external language. Sestoftcoined the term sheet-defined functions for thisexact purpose, so to avoid confusion, we hence-forth refer to functions defined directly in thespreadsheet as sheet-defined functions and thosethat are defined in an external language as user-
19

2016
defined functions.Sheet-defined functions are a relatively new
concept, first introduced in the Forms/3 spread-sheet language [15, 20]. There are additionalbenefits to sheet-defined functions [2, 15]: Func-tions are defined directly in the spreadsheet us-ing the concepts that end-users are already fa-miliar with, and so require a lower investmentthan using user-defined functions, and bestowssome self-documenting qualities to the functions.Additionally, documentation can be localised tothe function definition. It is also more straight-forward to add sheet-defined functions to olderspreadsheets that lack them, and can be done byend-users. Sharing functions is a matter of shar-ing the function definitions in worksheets andnot binary files such as shared libraries (althoughthis would certainly be possible). Sheet-definedfunctions also do not have any side effects likesome external languages, because they must re-spect the restriction that you cannot modify acell from another cell. Immutability has long beheralded by functional programming advocatesas promoting correctness, among other things[26]. The function bodies can be separated ondifferent lines to make it easier to understandthe purpose of the function, and avoids single-cell monolithic formulas. The programming lan-guage equivalent would be a function with inter-mediate calculations on separate lines versus aone-liner. Finally, they do not break the audittrail, i.e. the list of recorded changes to a cell.
To further emphasise the advantages of sheet-defined functions, consider a programming lan-guage where you cannot define your own func-tions. This reflects the lack of functions in end-user development in spreadsheets. As eloquentlyput by Peyton-Jones et al.:
“Can you imagine programming inC without procedures, however cleverthe editor’s copy-and-paste technol-ogy?” [15]
One of Casimir’s criticisms [17] of the Lo-tus 1–2–3 spreadsheet software was its lack ofuser-defined functions which he argued would in-crease memory consumption because copies offormulas must be stored in each cell. A singlecopy stored in a sheet-defined function would bemuch more sensible and less error-prone as wehave already mentioned. Sheet-defined functions
also complicate matters. How should higher-order functions be represented in a primarilyfirst-order language? Should recursive functionsbe allowed? Are these concepts too difficult forend-users to understand? In the following discus-sion of the literature we will attempt to answersome of these questions.
Peyton-Jones et al. [15] proposed a design ofsheet-defined functions. Functions are defined inspecial function instance sheets that represent asingle instance of the function. As the name im-plies, function instance sheets are instances ofthe function invocations. This means that eachinvocation has a copy of the function definition;there is no single definition of a function. Theauthors argue that this lowers the learning costas function instances behave like ordinary work-sheets. Consequently, when a user edits a func-tion, a pop-up appears that prompts the user forediting this single function instance or all func-tion instances. This is reminiscent of some calen-der systems and repeated events, where you canchoose to modify a single instance of the eventor all of its repetitions. They can also be definedusing a graphical interface and defined based onexisting formula in the spreadsheet. When edit-ing the function, graphical user interface toolsare provided to easily navigate up and down thecall tree. This approach raises some interestingquestions. If a user changes a single functioninstance but not its name, there are now twoor more functions where one single function be-haves differently from the rest. However, thesystem then changes all the invocations of thefunction. While this is fine, it breaks the sep-aration of the function instances, yet the alter-native (having multiple functions with the samename but different behaviour) would increasememory consumption and unnecessarily compli-cate future edits because the system now hasto distinguish different functions with the samename. They incorporate program usability stud-ies from human-computer interaction research,namely the Cognitive Dimensions of Notations[88, 89] and Attention Investment models [90],to assess multiple criteria of their proposed de-sign of sheet-defined functions and to determinethe likelihood of users adopting their approach.It is a known problem that end-users do not wishto expend too much time and energy when try-ing to learn a new system, so this criterion iscrucial for the success of sheet-defined functions.
20

2016
Letting end-users define functions with the toolsthey already know, lowers their entry-barrier.
Inspired by the work of Peyton-Jones et al.,Sestoft [91] implemented sheet-defined functionsin Funcalc [19]. One significant inspiration wasthe performance aspect mentioned by Peyton-Jones et al.: That functions could be compiled tobyte code or executed by a just-in-time compiler.While Peyton-Jones et al. implement their de-sign in VBA, sheet-defined functions in Funcalcare compiled to efficient .NET bytecode, morespecifically the Common Intermediate Languageor CIL, by an internal compiler using the run-time code generation facilities of C#. VBA isboth interpreted and compiled to Microsoft p-code (pseudo-code) [92], and but initial experi-ments indicate that executing .NET bytecode iscomparable to or faster than VBA[91]. In con-trast to the design of Peyton-Jones et al., func-tions have a single definition and are cached andreused. Functions are defined in function sheets,worksheets whose names are prefixed with an @sign and whose tabs are pink. Since each func-tion instance sheet in Peyton-Jones et al. is sep-arate, function parameters use inter-worksheetreferences. In Sestoft’s function sheets, a call tothe DEFINE function defines a new function, e.g.=DEFINE("F", out, input1, ..., inputn) de-fines the function F with an output cell and zeroor more input cells. An example is depicted infigure 4. Performance results show competitiveand even improved runtime performance overfunctions in Microsoft Excel [2].
Figure 4: A example of a sheet-defined func-tion in Funcalc that calculates a random valueusing an n-sided die [2]. The call to DEFINE ison the first line along with a short description,and the in- and output parameters are definedon the next couple of lines.
In a video presentation at the 2009 Commer-cial Users of Functional Programming or CUFPconference, Lee Benfield [93] presents the Func-tional Model Deployment or FMD framework forExcel that attempts to retain the expressive-ness of spreadsheets while provided users withauto-generated code for communicating with ex-
ternal libraries without resorting to VBA, orany other external language. It allows vari-able declarations and function handles. For ex-ample, variable("date") creates a single vari-able called “date”, and @@11 refers to a functionhandle. Once available, functions can be eval-uated with arguments using an eval function.Like Sestoft’s sheet-defined functions, FMD in-troduces functions from functional programmingsuch as map as an alternative to copy-pastingcell formulas, which we have already discussedis a source of errors in section 4. Like Peyton-Jones and Sestoft, FMD also introduces higher-order functions, but unlike them, FMD providestuples, an important concept in functional pro-gramming. When Excel traverses the under-lying graph of cells, FMD generates the boil-erplate code that communicates with other li-braries, thus removing the need for VBA gluecode that would normally be needed to use theselibraries in Excel.
The major conceptual difference in Benfield’swork, lies in his more direct approach to im-plementing functional programming in spread-sheets. This means that the power and expres-siveness of functional programming can be lever-aged by users and variables encourage additionalreuse alongside functions. The downside is theinvestment people have to make in order to learnconcepts such as map. Hoon takes a similar ap-proach [22] which we discuss later. Peyton-Jonesand Sestoft take a more user-oriented approachwhere they attempt to reuse the already familiarspreadsheet concepts to implement higher-orderfunctions.
Sheet-defined functions introduce new chal-lenges. We mentioned earlier that spreadsheetsare first-order functional languages, but func-tional languages support higher-order functionsthat greatly increase expressiveness. Shouldhigher-order functions be allowed in spread-sheets? Will their introduction cause more con-fusion than good? Their advantages should beclear. For example, a sheet-defined functioncan be passed to functions such as COUNTIF andSUMIF to obtain new, more advanced function-ality, particularly when combined with partialfunction evaluation. Modifying such a functionwould involve a single edit in its correspond-ing function sheet, while modifying the formulawould need to be done for all instances. Peyton-Jones et al. do not discuss higher-order functions.
21

2016
Sestoft implements this using the CLOSURE andAPPLY functions. A closure for the NDIE functionin figure 4 is defined by CLOSURE("NDIE", 20)
and returns a function value, which can then becalled using APPLY(ca) where ca is the cell ad-dress containing the closure. Alternatively, theclosure can be given directly in a call to a func-tion such as COUNTIF. It is also possible to definepartially applied functions.
Hoon et al. implemented a spreadsheet ap-plication in the functional, lazy and higher-order language Clean [94] in order to evaluate aspreadsheet with such functional properties [22],as well as a symbolic evaluator for equationswhich would be useful for the financial and scien-tific communities. The resulting application wascalled FunSheet. While functional concepts arecertainly powerful, there are things such as map
and variations of fold that will demand a highinvestment cost from end-users. Since Clean al-ready uses term graph rewriting systems underthe hood, cyclic references are easy to express,and so all function applications are thus replacedwith their definition or with a predefined func-tion as necessary.
Another aspect is recursion. Is it possiblefor these types of functions to support recursion,and should they? Casimir claims that recursionis problematic because it may require many re-calculations to iteratively compute a result [17].Yoder et al. [18] dispute this claim, and arguethat natural-order recalculation, i.e. calculatingall dependencies of a cell before evaluating thecell itself akin to topological sorting, elegantlysolves this problem. They do note though thatthe lack of formula-local variables can lead toconsiderable memory usage as intermediate val-ues can only be stored in the “global” memory ofthe spreadsheet cells. Let us assume for now thatrecursion can be implemented efficiently in thespreadsheet paradigm, then the question remainsif it should. Recall that a substantial amountof the discussed literature attempts to use prin-ciples from the software development and com-puter science fields in a manner that is transpar-ent or at least easier for the user to understandsince they lack a formal education in IT. Anexample is using units instead of types to detecterrors [16, 65]. Recursion is a useful tool for solv-ing problems that can be defined recursively butrequires that end-users can grasp the concept inorder to use it. Regardless, it would undoubt-
edly be invaluable for more advanced users orthose with an IT background. Peyton-Jones etal. also argue that the lack of inductive types(besides the integer) means that recursion mightnot be as expressive as it is in functional lan-guages [15]. In the case of Hoon et al.’s work,their spreadsheet is already defined using a func-tional language and recursion is readily available.They deal with recursion similarly to how the Y-combinator is used in lambda calculus. Sestoft’ssheet-defined functions are fully capable of re-cursion and are also tail-recursive, but there iscurrently no guard against infinite recursion al-though this is a purely practical problem.
As described in section 4.3.3, Burnett et al.[65] suggested a unit view for spreadsheets, sim-ilar to how one can view formulas in a formulaview. This would be very useful in general, butalso in combination with sheet-defined functionsas one can more accurately determine the sourceof type errors. In Funcalc [19], a type error ina sheet-defined function is signalled by the errorvalue #ERR: ArgType. The user has no informa-tion about the position or expected type of theerroneous argument. A unit view that is aware ofsheet-defined functions would help in this case.
6 Visualisation
Visualisation techniques are important due tothe invaluable and intuitive feedback that theycan provide to end-users. Visual feedback is im-portant for most, if not all, aspects of spread-sheets since a big part of spreadsheets is theirvisual representation of data. It provides visiblefeedback for errors and dataflow through cellsand worksheets, and their very nature makesthese types of tools easy to grasp.
We do not discuss visualisation in terms ofthe graphical user interface or its enhancementsin spreadsheet applications, nor graphical re-porting facilities such as graphs or charts. Weonly discuss visualisation in terms of tools thatare specific to spreadsheets and provide somebenefit to spreadsheet end-users in terms of thecategories we have previously discussed.
Dataflow diagrams have been used to give ahigh-level view of the inter-worksheet relationsof a spreadsheet, to allow end-users to reasonwhat the structure of a spreadsheet and moreclearly explain their intentions. Hermans et al.
22

2016
[95] developed such a tool called Breviz. Itis common that end-users inherit spreadsheetsfrom co-workers within an organisation and mustspend some time deciphering the spreadsheet.Dataflow diagrams are a means to alleviate thisprocess. The dataflow diagrams are annotatedwith arrows to depict the inter-worksheet ref-erences. The thickness of the arrows are pro-portional to the number of cell references be-tween worksheets. This is a style related tothe dataflow that is used for program analy-sis. Hermans et al. completed a series of em-pirical studies at the Dutch asset managementcompany Robeco. They found that almost allof their interviewees understood the dataflowdiagrams and there was a 80% consensus thatdataflow diagrams would be beneficial in theirdaily work. Some participants noted that thediagrams lacked information such as the filter-ing of data from one worksheet to another, whileothers felt that they needed more time to studythe diagrams to assess their merit. One partic-ipant wanted the visualisation to be within Ex-cel to get a better overview. The authors alsofound that when a spreadsheet was transferredbetween people, Breviz helped give the recipienta high-level layout of the spreadsheet and its in-tended purpose. The same was true for a casestudy with spreadsheet auditors. In later work,Hermans et al. enhance the dataflow diagrams inBreviz with inter-worksheet code smells [56], asdescribed in section 4.1.
We briefly mention a commercial counter-part to Breviz, SLATE [96], not to be confusedwith the testing framework we discussed in sec-tion 4.4 with the same name [68]. It is an Ex-cel plugin and provides added features to Breviz.SLATE opens a new window with its visualisa-tion. SLATE shows you formula dependenciesand highlights its relevant parts when the mouseis hovered above the formula’s subsections. Forexample, when hovering over the condition in anIF function, SLATE will highlight the cell or cellsthat are used to determine the condition. Press-ing a cell address in SLATE will take you backto Excel and momentarily highlight that cell.
7 Related Work
To the author’s knowledge, no comprehensive lit-erature review of spreadsheet technology exists.
Sestoft’s book on spreadsheet technology [2] de-scribes many different aspects, but its main fo-cus is on the implementation details of spread-sheet technology, notably Funcalc, and is not in-tended to serve as a general literature review ofspreadsheet technology. Biermann [97] surveysapproaches to declarative parallel programmingin spreadsheets using array programming, butdoes not cover general spreadsheet technology.It is the intention of this paper to provide sucha review with a satisfactory coverage of existingspreadsheet technology, and bring readers up tospeed on spreadsheet technology.
8 Conclusion
In this study, we have examined the current chal-lenges in spreadsheets and the research that hastried to overcome them. The main challengeshave been weak type systems, unruly error re-porting, and a lack of standardised tools fortesting and debugging, best practice guidelinesand strong type systems. The cumulative effectof these shortcomings is likely the reason whysoftware developers do not seem to hold spread-sheets in high regard, and even regard spread-sheets as boring [17]. We believe that the sur-veyed research not only makes spreadsheets moresophisticated and usable, but could help changehow software developers view spreadsheets be-cause it draws on principles of software develop-ment and computer science that they are famil-iar with. Burnett and others have coined thisas end-user software engineering [98, 99] whereend-user programming and development incor-porate the principles from traditional softwareengineering which ensure the same level of re-liability, efficiency and usability [100] as foundin software development. This is usually donein a manner that is user-friendly or even fullytransparent to the user, so that they can takefull advantage of the system, while lowering theinvestment required to learn it. One notablestrategy for achieving this is the use of (immedi-ate) visual feedback such as with the WYSIWYTmethodology [21, 83] or dataflow diagrams [10,78, 95]. Furthermore, Burnett et al. remark thattheir approach has been “. . . to gently alert them[end-users] to dependability problems, to assistthem with their explorations into those problemsto whatever extent they choose to pursue such ex-
23

2016
plorations, and to work within the contexts withwhich they are familiar” [98]. This approach hasbeen adopted by the majority of the covered lit-erature and is a combination of the best of bothworlds.
Another notable example of end-user soft-ware engineering is sheet-defined functions thatpromise to give end-users a higher degree of ex-pressiveness, e.g. through the use of higher-orderfunctions, and modularity and reuse of functionsdefined in a paradigm that they are already ac-quainted with, steering clear of the often incon-venient need for collaboration with an IT depart-ment.
We conclude with a summarising list of high-level observations.
• Efficient data structures are vital for effi-cient recalculation and spatial representa-tion of cells (section 2).
• Lazy evaluation of cell expressions is an at-tractive prospect in terms of performanceand visualisation, but more work needs tobe done in order to evaluate this strategyand identify challenges (section 3).
• Parallel recalculation promises to speed upthe recalculation process, but has seen lessinterest than expected in relation to othersubjects (section 3.2).
• Templates ensure spreadsheets that arefree from errors and provide a common ba-sis for a set of similar spreadsheets (sec-tion 3.3).
• Bugs in spreadsheets are abundant (sec-tion 4)
• Bug detection and elimination is by far themost prominent subject for spreadsheets interms of research activity, due to the previ-ous point (section 4 and the following sec-tions).
• Error and smell classification is not stan-dardised (section 4.1).
• Most type systems in spreadsheet applica-tions are weak and afford few guaranteesabout the correctness of expressions (sec-tion 4.3).
• There seems to be a balance to be struckbetween static and dynamic (i.e. inferred)type systems (section 4.3).
• A “unit view” for types, similar to a for-mula view, is an interesting idea thatshould be investigated further, especiallyin combination with sheet-defined func-tions section 4.3.3.
• An interesting direction for future workwould be to explore how different type sys-tems and error detection systems can beintegrated and work in harmony.
• A majority of the surveyed literature usessoftware development and computer sci-ence techniques as a foundation for theirwork.
• Sheet-defined functions show promise inbridging the gap between IT profession-als and end-users, and allowing the lat-ter group to create powerful functions.They also bring about new challenges (sec-tion 5.2).
9 Acknowledgements
The author would like to thank Peter Sestoft forhis guidance and helpful suggestions during thewriting of this literature review.
References
[1] Christopher Scaffidi, Mary Shaw andBrad Myers. “Estimating the numbers ofend users and end user programmers”.In: Visual Languages and Human-CentricComputing, 2005 IEEE Symposium on.IEEE. 2005, pp. 207–214.
[2] Peter Sestoft. “Spreadsheet Implementa-tion Technology”. The MIT Press, 2014.isbn: 9780262526647.
[3] Tomas Isakowitz, Shimon Schocken andHenry C. Lucas Jr. “Toward a Logi-cal/Physical Theory of Spreadsheet Mod-eling”. In: ACM Trans. Inf. Syst. 13.1(Jan. 1995), pp. 1–37. issn: 1046-8188.doi: 10 . 1145 / 195705 . 195708. url:http://doi.acm.org/10.1145/195705.
195708.
24

2016
[4] D. J. Power. “A Brief Historyof Spreadsheets”. url: http :
/ / www . dssresources . com /
history / sshistory . html (visited on06/21/2016).
[5] The Document Foundation. “LibreOf-fice Calc”. url: https : / / www .
libreoffice.org/discover/calc/ (vis-ited on 05/09/2016).
[6] The GNOME Project. “Gnumeric”. url:http://www.gnumeric.org/ (visited on06/02/2016).
[7] Apple Inc. “Apple Numbers”. url: http://www.apple.com/dk/mac/numbers/
(visited on 05/09/2016).
[8] Dan Bricklin and Bob Frankston. “Visi-Calc: Information from its creators, DanBricklin and Bob Frankston”. url: http:/ / www . bricklin . com / visicalc . htm
(visited on 06/16/2016).
[9] Google Inc. “Google Spreadsheets”. url:https : / / www . google . com / sheets /
about/ (visited on 06/02/2016).
[10] F. Hermans, M. Pinzger and A. vanDeursen. “Detecting and visualizing inter-worksheet smells in spreadsheets”. In:2012 34th International Conference onSoftware Engineering (ICSE). June 2012,pp. 441–451. doi: 10.1109/ICSE.2012.6227171.
[11] Robin Abraham and Martin Erwig.“UCheck: A spreadsheet type checker forend users”. In: Journal of Visual Lan-guages & Computing 18.1 (2007), pp. 71–95. issn: 1045-926X. doi: http : / /
dx . doi . org / 10 . 1016 / j . jvlc .
2006 . 06 . 001. url: http : / / www .
sciencedirect.com/science/article/
pii/S1045926X06000383.
[12] Brian Harvey and Matthew Wright.“Simply Scheme: introducing computerscience”. Mit Press, 1999.
[13] Brian Harvey and Matthew Wright.“Simply Scheme: Introducing ComputerScience Website”. url: https : / /
people.eecs.berkeley.edu/~bh/ss-
toc2.html (visited on 06/15/2016).
[14] Robin Abraham and Martin Erwig.“Type Inference for Spreadsheets”. In:Proceedings of the 8th ACM SIGPLANInternational Conference on Principlesand Practice of Declarative Programming.PPDP ’06. New York, NY, USA: ACM,2006, pp. 73–84. isbn: 1-59593-388-3. doi:10.1145/1140335.1140346. url: http:/ / doi . acm . org / 10 . 1145 / 1140335 .
1140346.
[15] Simon Peyton-Jones, Alan Blackwell andMargaret Burnett. “A User-centred Ap-proach to Functions in Excel”. In: Pro-ceedings of the Eighth ACM SIGPLANInternational Conference on FunctionalProgramming. ICFP ’03. New York, NY,USA: ACM, 2003, pp. 165–176. isbn: 1-58113-756-7. doi: 10 . 1145 / 944705 .
944721. url: http://doi.acm.org/10.1145/944705.944721.
[16] Martin Erwig and Margaret Burnett.“Adding apples and oranges”. In: Prac-tical Aspects of Declarative Languages.Springer, 2002, pp. 173–191.
[17] Rommert J. Casimir. “Real Program-mers Don’t Use Spreadsheets”. In: SIG-PLAN Not. 27.6 (June 1992), pp. 10–16.issn: 0362-1340. doi: 10.1145/130981.130982. url: http://doi.acm.org/10.1145/130981.130982.
[18] A. G. Yoder and D. L. Cohn. “Realspreadsheets for real programmers”. In:Computer Languages, 1994., Proceedingsof the 1994 International Conference on.May 1994, pp. 20–30. doi: 10 . 1109 /
ICCL.1994.288396.
[19] Peter Sestoft. “Corecalc and FuncalcSpreadsheet Technology in C#”. In:(2014). url: http : / / www . itu . dk /
people/sestoft/funcalc/ (visited on06/01/2016).
[20] Allen Ambler. “Forms: Expanding the vi-sualness of sheet languages”. In: 1987Workshop on Visual Languages. 1987,pp. 105–117.
[21] Gregg Rothermel et al. “What You Seeis What You Test: A Methodology forTesting Form-based Visual Programs”.In: Proceedings of the 20th Interna-tional Conference on Software Engineer-
25

2016
ing. ICSE ’98. Washington, DC, USA:IEEE Computer Society, 1998, pp. 198–207. isbn: 0-8186-8368-6. url: http://dl.acm.org/citation.cfm?id=302163.
302183.
[22] Walter A.C.A.J. de Hoon, Luc M.W.J.Rutten and Marko C.J.D van Eekelen.“Implementing a Functional Spreadsheetin Clean”. In: Journal of Functional Pro-gramming 5 (1995), pp. 383–414.
[23] Tie Cheng and Xavier Rival. “StaticAnalysis of Spreadsheet Applications forType-Unsafe Operations Detection”. In:European Symposium On Programming(ESOP’15).
[24] Morten Poulsen and Poul Peter Serek.“Optimized Recalculation For Spread-sheets With the Use of Support Graph”.Master Thesis. IT University of Copen-hagen, 2007.
[25] Hildur Uffe Flemberg and Martin JeantyLarsen. “Optimizing Spreadsheet Com-putations on Multi-Core Architectures”.Master Thesis. IT University of Copen-hagen, Sept. 1, 2014.
[26] John Backus. “Can Programming Be Lib-erated from the Von Neumann Style?: AFunctional Style and Its Algebra of Pro-grams”. In: Commun. ACM 21.8 (Aug.1978), pp. 613–641. doi: 10 . 1145 /
359576.359579. url: http://doi.acm.org/10.1145/359576.359579.
[27] Arvind and R.S. Nikhil. “Executinga program on the MIT tagged-tokendataflow architecture”. In: Computers,IEEE Transactions on 39.3 (Mar. 1990),pp. 300–318. issn: 0018-9340. doi: 10 .
1109/12.48862.
[28] C.H. van Berkel, M.B. Josephs and S.M.Nowick. “Applications of asynchronouscircuits”. In: Proceedings of the IEEE87.2 (Feb. 1999), pp. 223–233. issn: 0018-9219. doi: 10.1109/5.740016.
[29] Vivek Sarkar. “Partitioning and Schedul-ing Parallel Programs for Multiproces-sors”. Research Monographs In Paralleland Distributed Computing. Cambridge,Massachusetts: MIT Press, 1989. isbn:0262691302.
[30] Vivek Sarkar and John Hennessy.“Compile-time Partitioning and Schedul-ing of Parallel Programs”. In: SIGPLANNot. 21.7 (July 1986), pp. 17–26. issn:0362-1340. doi: 10.1145/13310.13313.url: http://doi.acm.org/10.1145/13310.13313.
[31] Vivek Sarkar and John Hennessy.“Compile-time Partitioning and Schedul-ing of Parallel Programs”. In: Proceed-ings of the 1986 SIGPLAN Symposium onCompiler Construction. SIGPLAN ’86.New York, NY, USA: ACM, 1986, pp. 17–26. isbn: 0-89791-197-0. doi: 10.1145/12276.13313. url: http://doi.acm.
org/10.1145/12276.13313.
[32] David Cann. “Retire Fortran? A debaterekindled”. In: Communications of theACM 35.8 (Aug. 1992), pp. 81–89.
[33] Vivek Sarkar and David Cann. “POSC-a Partitioning and Optimizing SISALCompiler”. In: SIGARCH Comput. Ar-chit. News 18.3b (June 1990), pp. 148–164. issn: 0163-5964. doi: 10 . 1145 /
255129.255152. url: http://doi.acm.org/10.1145/255129.255152.
[34] Gilles Kahn. “The semantics of a simplelanguage for parallel programming”. In:In Information Processing ′74: Proceed-ings of the IFIP Congress. Vol. 74. 1974,pp. 471–475.
[35] N. Halbwachs et al. “The synchronousdata flow programming language LUS-TRE”. In: Proceedings of the IEEE 79.9(Sept. 1991), pp. 1305–1320. issn: 0018-9219. doi: 10.1109/5.97300.
[36] Vivek Sarkar and John Hennessy.“Compile-time Partitioning and Schedul-ing of Parallel Programs”. In: SIGPLANNot. 21.7 (July 1986), pp. 17–26. issn:0362-1340. doi: 10.1145/13310.13313.url: http://doi.acm.org/10.1145/13310.13313.
[37] Microsoft. “Task Parallel Library”. url:https : / / msdn . microsoft . com / da -
dk/library/dd460717.aspx (visited on08/12/2016).
26

2016
[38] David Abramson et al. “ActiveSheets:Super-computing with spreadsheets”. In:2001 High Performance Computing Sym-posium (HPC ‘01), Advanced SimulationTechnologies Conference. Citeseer. 2001,pp. 22–26.
[39] Krishna Nadiminti et al. “ExcelGrid:A .NET plug-in for outsourcing Excelspreadsheet workload to enterprise andglobal grids”. In: Proceedings of the 12thInternational Conference on AdvancedComputing and Communication (AD-COM 2004). 2004.
[40] D. Abramson et al. “Nimrod: a tool forperforming parametrised simulations us-ing distributed workstations”. In: HighPerformance Distributed Computing,1995., Proceedings of the Fourth IEEEInternational Symposium on. Aug. 1995,pp. 112–121. doi: 10.1109/HPDC.1995.518701.
[41] Axcelon Inc. “EnFuzion”. url: http://www . axceleon . com / prod - enfuzion/
(visited on 07/27/2016).
[42] SpreadsheetGear LLC. “Spreadsheet-Gear”. url: http : / / www .
spreadsheetgear.com/company/about.
aspx (visited on 06/30/2016).
[43] Microsoft. “HPC Services For Excel”.url: https : / / technet . microsoft .
com/en-us/library/ff877820(v=ws.
10).aspx (visited on 06/30/2016).
[44] M. Erwig et al. “Automatic generationand maintenance of correct spreadsheets”.In: Proceedings. 27th International Con-ference on Software Engineering, 2005.ICSE 2005. May 2005, pp. 136–145. doi:10.1109/ICSE.2005.1553556.
[45] Martin Erwig et al. “Gencel: A Pro-gram Generator for Correct Spread-sheets”. In: J. Funct. Program. 16.3 (May2006), pp. 293–325. issn: 0956-7968. doi:10 . 1017 / S0956796805005794. url:http : / / dx . doi . org / 10 . 1017 /
S0956796805005794.
[46] Robin Abraham and Martin Erwig. “In-ferring Templates from Spreadsheets”.In: Proceedings of the 28th Interna-tional Conference on Software Engineer-ing. ICSE ’06. New York, NY, USA:
ACM, 2006, pp. 182–191. isbn: 1-59593-375-1. doi: 10.1145/1134285.1134312.url: http://doi.acm.org/10.1145/1134285.1134312.
[47] Robin Abraham et al. “Visual specifica-tions of correct spreadsheets”. In: VisualLanguages and Human-Centric Comput-ing, 2005 IEEE Symposium on. IEEE.2005, pp. 189–196.
[48] Raymond R. Panko. “What we knowabout spreadsheet errors”. In: Journal ofOrganizational and End User Computing(JOEUC) 10.2 (1998), pp. 15–21.
[49] Raymond R. Panko. “What we dont knowabout spreadsheet errors today”. 2015.
[50] Stephen G. Powell, Kenneth R. Bakerand Barry Lawson. “A Critical Reviewof the Literature on Spreadsheet Errors”.In: Decis. Support Syst. 46.1 (Dec. 2008),pp. 128–138. issn: 0167-9236. doi: 10 .
1016/j.dss.2008.06.001. url: http://dx.doi.org/10.1016/j.dss.2008.
06.001.
[51] M. Burnett et al. “End-user software en-gineering with assertions in the spread-sheet paradigm”. In: Software Engineer-ing, 2003. Proceedings. 25th InternationalConference on. May 2003, pp. 93–103.doi: 10.1109/ICSE.2003.1201191.
[52] James Reichwein, Gregg Rothermel andMargaret Burnett. “Slicing Spreadsheets:An Integrated Methodology for Spread-sheet Testing and Debugging”. In: SIG-PLAN Not. 35.1 (Dec. 1999), pp. 25–38.issn: 0362-1340. doi: 10.1145/331963.331968. url: http://doi.acm.org/10.1145/331963.331968.
[53] Y. Ahmad et al. “A type system for stat-ically detecting spreadsheet errors”. In:Automated Software Engineering, 2003.Proceedings. 18th IEEE InternationalConference on. Oct. 2003, pp. 174–183.doi: 10.1109/ASE.2003.1240305.
[54] “Report of JPMorgan Chase & Co. man-agement task force regarding 2012 CIOlosses”. Jan. 16, 2013.
[55] EuSpRiG. “EuSpRiG Horror Stories”.url: http : / / eusprig . org / horror -
stories.htm (visited on 06/14/2016).
27

2016
[56] Felienne Hermans et al. “Data CloneDetection and Visualization in Spread-sheets”. In: Proceedings of the 2013 In-ternational Conference on Software Engi-neering. ICSE ’13. Piscataway, NJ, USA:IEEE Press, 2013, pp. 292–301. isbn:978-1-4673-3076-3. url: http : / / dl .
acm.org/citation.cfm?id=2486788.
2486827.
[57] S. E. Kruck. “Testing Spreadsheet Ac-curacy Theory”. In: Inf. Softw. Technol.48.3 (Mar. 2006), pp. 204–213. issn: 0950-5849. doi: 10.1016/j.infsof.2005.
04.005. url: http://dx.doi.org/10.1016/j.infsof.2005.04.005.
[58] Ruiqing Zhang et al. “How effectivelycan spreadsheet anomalies be detected:An empirical study”. In: Journal of Sys-tems and Software (2016). issn: 0164-1212. doi: http : / / dx . doi . org / 10 .
1016/j.jss.2016.03.061. url: http://www.sciencedirect.com/science/
article/pii/S0164121216300103.
[59] Wensheng Dou, Shing-Chi Cheungand Jun Wei. “Is Spreadsheet Ambi-guity Harmful? Detecting and Repair-ing Spreadsheet Smells due to Ambigu-ous Computation”. In: 36th Interna-tional Conference on Software Engineer-ing (ICSE 2014). ACM. 2014, pp. 848–858.
[60] Chris Chambers and Martin Erwig. “Au-tomatic Detection of Dimension Errors inSpreadsheets”. In: J. Vis. Lang. Comput.20.4 (Aug. 2009), pp. 269–283. issn: 1045-926X. doi: 10.1016/j.jvlc.2009.04.002. url: http : / / dx . doi . org / 10 .
1016/j.jvlc.2009.04.002.
[61] Wensheng Dou et al. “Detecting TableClones and Smells in Spreadsheets”. In:24th ACM SIGSOFT International Sym-posium on the Foundations of SoftwareEngineering (FSE 2016). FSE 2016. Seat-tle, WA, USA: ACM, 2016, pp. 787–798.isbn: 978-1-4503-4218-6. doi: 10.1145/2950290.2950359. url: http://doi.
acm.org/10.1145/2950290.2950359.
[62] Shing-Chi Cheung et al. “CUSTODES:Automatic Spreadsheet Cell Clusteringand Smell Detection Using Strong and
Weak Features”. In: Proceedings of the38th International Conference on Soft-ware Engineering. ICSE ’16. New York,NY, USA: ACM, 2016, pp. 464–475.isbn: 978-1-4503-3900-1. doi: 10.1145/2884781.2884796. url: http://doi.
acm.org/10.1145/2884781.2884796.
[63] Felienne Hermans et al. “Data CloneDetection and Visualization in Spread-sheets”. In: Proceedings of the 2013 In-ternational Conference on Software Engi-neering. ICSE ’13. Piscataway, NJ, USA:IEEE Press, 2013, pp. 292–301. isbn:978-1-4673-3076-3. url: http : / / dl .
acm.org/citation.cfm?id=2486788.
2486827.
[64] Tie Cheng and Xavier Rival. In: StaticAnalysis: 19th International Symposium,SAS 2012, Deauville, France, September11-13, 2012. Proceedings. Ed. by An-toine Mine and David Schmidt. Berlin,Heidelberg: Springer Berlin Heidelberg,2012. Chap. An Abstract Domain to InferTypes over Zones in Spreadsheets, pp. 94–110. isbn: 978-3-642-33125-1. doi: 10 .
1007 / 978 - 3 - 642 - 33125 - 1 _ 9. url:http://dx.doi.org/10.1007/978-
3-642-33125-1_9.
[65] M. Burnett and M. Erwig. “Visually cus-tomizing inference rules about apples andoranges”. In: Human Centric ComputingLanguages and Environments, 2002. Pro-ceedings. IEEE 2002 Symposia on. 2002,pp. 140–148. doi: 10.1109/HCC.2002.1046366.
[66] Chris Chambers and Martin Erwig.“Reasoning about spreadsheets with la-bels and dimensions”. In: Journal of Vi-sual Languages & Computing 21.5 (2010).Part Special issue on selected papers fromVL/HCC’09, pp. 249–262. issn: 1045-926X. doi: http://dx.doi.org/10.
1016/j.jvlc.2010.08.004. url: http://www.sciencedirect.com/science/
article/pii/S1045926X10000455.
[67] C. Chambers and M. Erwig. “Dimen-sion inference in spreadsheets”. In: 2008IEEE Symposium on Visual Languagesand Human-Centric Computing. Sept.
28

2016
2008, pp. 123–130. doi: 10.1109/VLHCC.2008.4639072.
[68] Michael J Coblenz, Andrew Jensen Koand Brad A Myers. “Using objects ofmeasurement to detect spreadsheet er-rors”. In: 2005 IEEE Symposium onVisual Languages and Human-CentricComputing (VL/HCC’05). IEEE. 2005,pp. 314–316.
[69] R. Abraham and M. Erwig. “GoalDe-bug: A Spreadsheet Debugger for EndUsers”. In: 29th International Conferenceon Software Engineering (ICSE’07). May2007, pp. 251–260. doi: 10.1109/ICSE.2007.39.
[70] Roger Ferguson and Bogdan Korel.“The Chaining Approach for SoftwareTest Data Generation”. In: ACM Trans.Softw. Eng. Methodol. 5.1 (Jan. 1996),pp. 63–86. issn: 1049-331X. doi: 10 .
1145 / 226155 . 226158. url: http : / /
doi.acm.org/10.1145/226155.226158.
[71] Marc Fisher et al. “Automated Test CaseGeneration for Spreadsheets”. In: Pro-ceedings of the 24th International Con-ference on Software Engineering. ICSE’02. New York, NY, USA: ACM, 2002,pp. 141–153. isbn: 1-58113-472-X. doi:10.1145/581339.581359. url: http://doi.acm.org/10.1145/581339.581359.
[72] “Refactoring: Improving the Design ofExisting Code”. Boston, MA, USA:Addison-Wesley Longman PublishingCo., Inc., 1999. isbn: 0-201-48567-2.
[73] Susmit Jha et al. “Oracle-guidedComponent-based Program Synthesis”.In: Proceedings of the 32Nd ACM/IEEEInternational Conference on Software En-gineering - Volume 1. ICSE ’10. NewYork, NY, USA: ACM, 2010, pp. 215–224.isbn: 978-1-60558-719-6. doi: 10.1145/1806799.1806833. url: http://doi.
acm.org/10.1145/1806799.1806833.
[74] Marc Fisher and Gregg Rothermel. “TheEUSES Spreadsheet Corpus: A SharedResource for Supporting Experimentationwith Spreadsheet Dependability Mecha-nisms”. In: Proceedings of the FirstWorkshop on End-user Software Engi-neering. WEUSE I. New York, NY, USA:
ACM, 2005, pp. 1–5. isbn: 1-59593-131-7. doi: 10 . 1145 / 1082983 . 1083242.url: http://doi.acm.org/10.1145/1082983.1083242.
[75] Wensheng Dou et al. “CACheck: Detect-ing and Repairing Cell Arrays in Spread-sheets”. In: IEEE Transactions on Soft-ware Engineering (TSE) (2016).
[76] Felienne Hermans and Emerson Murphy-Hill. “Enron’s Spreadsheets and RelatedEmails: A Dataset and Analysis”. In:Proceedings of the 37th InternationalConference on Software Engineering -Volume 2. ICSE ’15. Florence, Italy:IEEE Press, 2015, pp. 7–16. url: http:/ / dl . acm . org / citation . cfm ? id =
2819009.2819013.
[77] R. Abraham and M. Erwig. “Headerand Unit Inference for SpreadsheetsThrough Spatial Analyses”. In: VisualLanguages and Human Centric Comput-ing, 2004 IEEE Symposium on. Sept.2004, pp. 165–172. doi: 10.1109/VLHCC.2004.29.
[78] Felienne Hermans, Martin Pinzger andArie van Deursen. “Supporting Profes-sional Spreadsheet Users by GeneratingLeveled Dataflow Diagrams”. In: Proceed-ings of the 33rd International Conferenceon Software Engineering. ICSE ’11. NewYork, NY, USA: ACM, 2011, pp. 451–460.isbn: 978-1-4503-0445-0. doi: 10.1145/1985793.1985855. url: http://doi.
acm.org/10.1145/1985793.1985855.
[79] Gregor Engels and Martin Erwig.“ClassSheets: Automatic Generation ofSpreadsheet Applications from Object-oriented Specifications”. In: Proceedingsof the 20th IEEE/ACM InternationalConference on Automated Software Engi-neering. ASE ’05. Long Beach, CA, USA:ACM, 2005, pp. 124–133. isbn: 1-58113-993-4. doi: 10.1145/1101908.1101929.url: http://doi.acm.org/10.1145/1101908.1101929.
[80] Andrew Kennedy. “Programming lan-guages and dimensions”. 391. Univer-sity of Cambridge, Computer Laboratory,1996.
29
2016
[81] BIPM: Bureau International des Poidset Mesures. “BIPM: Bureau Internationaldes Poids et Mesures”. url: http : / /
www.bipm.org/en/measurement-units/
(visited on 06/05/2016).
[82] Gordon Filby. “Spreadsheets in Scienceand Engineering”. Springer, 1995.
[83] Gregg Rothermel et al. “A Methodol-ogy for Testing Spreadsheets”. In: ACMTrans. Softw. Eng. Methodol. 10.1 (Jan.2001), pp. 110–147. issn: 1049-331X. doi:10.1145/366378.366385. url: http://doi.acm.org/10.1145/366378.366385.
[84] R. Abraham and M. Erwig. “AutoTest:A Tool for Automatic Test Case Gener-ation in Spreadsheets”. In: Visual Lan-guages and Human-Centric Computing(VL/HCC’06). Sept. 2006, pp. 43–50.doi: 10.1109/VLHCC.2006.11.
[85] Koen Claessen and John Hughes.“QuickCheck: A Lightweight Tool forRandom Testing of Haskell Programs”.In: SIGPLAN Not. 46.4 (May 2011),pp. 53–64. issn: 0362-1340. doi: 10 .
1145 / 1988042 . 1988046. url: http :
/ / doi . acm . org / 10 . 1145 / 1988042 .
1988046.
[86] R. Abraham and M. Erwig. “Goal-directed debugging of spreadsheets”. In:2005 IEEE Symposium on Visual Lan-guages and Human-Centric Computing(VL/HCC’05). Sept. 2005, pp. 37–44.doi: 10.1109/VLHCC.2005.42.
[87] The GNOME Project. “Gnumeric tests”.url: https : / / git . gnome . org /
browse/gnumeric/tree/test (visited on06/02/2016).
[88] Alan Blackwell and Thomas Green. “No-tational systems–the cognitive dimensionsof notations framework”. In: HCI Models,Theories, and Frameworks: Toward anInterdisciplinary Science. Morgan Kauf-mann (2003).
[89] T.R.G. Green and M. Petre. “UsabilityAnalysis of Visual Programming Environ-ments: A ‘Cognitive Dimensions′ Frame-work”. In: Journal of Visual Languages &Computing 7.2 (1996), pp. 131–174. issn:1045-926X. doi: http://dx.doi.org/
10.1006/jvlc.1996.0009. url: http://www.sciencedirect.com/science/
article/pii/S1045926X96900099.
[90] A. F. Blackwell. “First steps in program-ming: a rationale for attention investmentmodels”. In: Human Centric ComputingLanguages and Environments, 2002. Pro-ceedings. IEEE 2002 Symposia on. 2002,pp. 2–10. doi: 10 . 1109 / HCC . 2002 .
1046334.
[91] Peter Sestoft and Jens Zeilund. “Sheet-defined functions: implementation andinitial evaluation”. Report. Version 1.1.IT University of Copenhagen, Rued Lang-gaards Vej 7, DK-2300 Copenhagen S,Denmark, Jan. 16, 2013.
[92] Microsoft. “ACC: Visual/Access Basic IsBoth a Compiler and an Interpreter”.url: https : / / support . microsoft .
com / da - dk / kb / 109382 (visited on06/28/2016).
[93] Lee Benfield. “FMD: Functional Devel-opment in Excel”. In: Proceedings ofthe 2009 Video Workshop on Commer-cial Users of Functional Programming:Functional Programming As a Means,Not an End. CUFP ’09. New York, NY,USA: ACM, 2009. isbn: 978-1-60558-943-5. doi: 10 . 1145 / 1668113 . 1668121.url: http://doi.acm.org/10.1145/1668113.1668121.
[94] Rinus Plasmeijer, Marko van Eekelenand John van Groningen. “Clean Lan-guage Report”. Version 2.2. Dec. 2011.
[95] Felienne Hermans, Martin Pinzger andArie van Deursen. “Breviz: Visualizingspreadsheets using dataflow diagrams”.In: arXiv preprint arXiv:1111.6895(2011).
[96] Chris Ashby and Fraser Atkins.“SLATE”. url: www.useslate.com (vis-ited on 06/21/2016).
[97] Florian Biermann. “Declarative Paral-lel Programming in Spreadsheet End-User Development: A Literature Review”.Tech. rep. IT University of Copenhagen.
30

[98] Margaret Burnett. “What Is End-UserSoftware Engineering and Why Does ItMatter?” In: End-User Development: 2ndInternational Symposium, IS-EUD 2009,Siegen, Germany, March 2-4, 2009. Pro-ceedings. Ed. by Volkmar Pipek et al.Berlin, Heidelberg: Springer Berlin Hei-delberg, 2009, pp. 15–28. isbn: 978-3-642-00427-8. doi: 10 . 1007 / 978 - 3 - 642 -
00427-8_2. url: http://dx.doi.org/10.1007/978-3-642-00427-8_2.
[99] Margaret Burnett, Curtis Cook andGregg Rothermel. “End-user SoftwareEngineering”. In: Commun. ACM 47.9
(Sept. 2004), pp. 53–58. issn: 0001-0782.doi: 10.1145/1015864.1015889. url:http : / / doi . acm . org / 10 . 1145 /
1015864.1015889.
[100] Andrew J. Ko and Brad A. Myers. “De-signing the Whyline: A Debugging Inter-face for Asking Questions About ProgramBehavior”. In: Proceedings of the SIGCHIConference on Human Factors in Com-puting Systems. CHI ’04. New York, NY,USA: ACM, 2004, pp. 151–158. isbn: 1-58113-702-8. doi: 10 . 1145 / 985692 .
985712. url: http://doi.acm.org/10.1145/985692.985712.
31

Appendix
Sheet
Repre
senta
tion
Recalc
ula
tion
Para
llel
Recalc
ula
tion
Tem
pla
tes
Bugs
Sm
ells
Data
Clo
nes
Typ
eSyst
em
s
Unit
s,L
ab
els
and
Dim
ensi
ons
Sheet-
defined
Functi
ons
Vis
ualisa
tion
Test
ing
and
Debuggin
g
End-u
ser
Pro
gra
mm
ing
Abraham [69] XAbraham [14] XAbraham [11] XAbraham [46] XAbraham [84] XAbraham [86] XAbraham [77] XAbraham [47] XAbramson [38] XAhmad [53] XAshby [96] XBenfield [93] XBurnett [51] XBurnett [65] X XBurnett [98] XBurnett [99] XChambers [66] XChambers [67] XChambers [60] XCheng [23] XCoblenz [68] XDou [61] XDou [75] XDou [59] XEngels [79] XErwig [16] XErwig [45] XFerguson [70] XFisher [71] XFlemberg [25] XHermans [10] X XHermans [95] XHermans [56] X XHermans [78] XHoon [22] XNadiminti [39] XPeyton [15] X
32

Sheet
Repre
senta
tion
Recalc
ula
tion
Para
llel
Recalc
ula
tion
Tem
pla
tes
Bugs
Sm
ells
Data
Clo
nes
Typ
eSyst
em
s
Unit
s,L
ab
els
and
Dim
ensi
ons
Sheet-
defined
Functi
ons
Vis
ualisa
tion
Test
ing
and
Debuggin
g
End-u
ser
Pro
gra
mm
ing
Panko [48]† XPanko [49]† XPowell [50]† XReichwein [52] XRothermel [21] XScaffidi [1] XSerek [24] XSestoft [2] X X X X XZhang [58]† X
Table 1: An overview of the surveyed literature and their respective categorisation within spread-sheet technology, sorted by authors. Not all literature has an entry in this table. For example,[55] is a list of reports of erroneous spreadsheets on the EuSpRiG website, but does not constitutea paper that examines a particular aspect of spreadsheets per se. The † symbol signifies that thepaper is a survey or provides an overview of some subject.
33