a-living smart city services co., ltd. - agile
TRANSCRIPT

FY2020 Annual Results
A-Living Smart City Services Co., Ltd.(3319.HK)
March 2021

Disclaimer
This presentation may contain forward-looking statements. Any such forward-looking statements are based on a number of assumptions about theoperations of the A-Living Smart City Services Co., Ltd. (the “Company”) and factors beyond the Company's control and are subject to significant risksand uncertainties, and accordingly, actual results may differ materially from these forward-looking statements.
The Company undertakes no obligation to update these forward-looking statements for events or circumstances that occur subsequent to such dates.The information in this presentation should be considered in the context of the circumstances prevailing at the time of its presentation and has notbeen, and will not be, updated to reflect material developments which may occur after the date of this presentation. The slides forming part of thispresentation have been prepared solely as a support for oral discussion about background information about the Company. This presentation alsocontains information and statistics relating to the China and property development industry. The Company has derived such information and data fromunofficial sources, without independent verification. The Company cannot ensure that these sources have compiled such data and information on thesame basis or with the same degree of accuracy or completeness as are found in other industries. You should not place undue reliance on statementsin this presentation regarding the property development industry. No representation or warranty, express or implied, is made as to, and no relianceshould be placed on, the fairness, accuracy, completeness or correctness of any information or opinion contained herein. It should not be regarded byrecipients as a substitute for the exercise of their own judgment. Information and opinion contained in this presentation may be based on or derivedfrom the judgment and opinion of the management of the Company. Such information is not always capable of verification or validation. None of theCompany or financial adviser of the Company, or any of their respective directors, officers, employees, agents or advisers shall be in any wayresponsible for the contents hereof, or shall be liable for any loss arising from use of the information contained in this presentation or otherwise arisingin connection therewith. This presentation does not take into consideration the investment objectives, financial situation or particular needs of anyparticular investor. It shall not to be construed as a solicitation or an offer or invitation to buy or sell any securities or related financial instruments. Nopart of it shall form the basis of or be relied upon in connection with any contract or commitment whatsoever. This presentation may not be copied orotherwise reproduced.
This presentation does not constitute an offer to sell or the solicitation of an offer to buy any securities in the United States or any other jurisdiction inwhich such offer, solicitation or sale would be unlawful prior to registration or qualification under the securities laws of any such jurisdiction. Nosecurities may be offered or sold in the United States absent registration or an applicable exemption from registration requirements. Any publicoffering of securities to be made in the United States will be made by means of a prospectus. Such prospectus will contain detailed information aboutthe company making the offer and its management and financial statements. No public offer of securities is to be made by the Company in the UnitedStates.
2
Results
Highlights
01

Results Highlights
Revenue 10,026 mn +95.5%
Gross profit 2,973 mn +57.9%
Net profit 1,973 mn +52.7%
Core profit
attributable to
shareholders
1,800 mn +43.5%
Total contracted GFA reached 718 mn sq.m.; total
GFA under management reached 569 mn sq.m.*
Fruitful results in third-party expansion: newly obtained
46 mn sq.m. of contracted GFA from third-party
expansion and increased the proportion of contracted
GFA from third-party developers to 74.1%.
Developed a comprehensive business portfolio and
established advantages in niche markets. Among GFA
under management: residential properties – 40.4%;
public buildings – 46.5%; commercial and office
buildings: 13.1%
*Incl. GFA of New CMIG PM, associates and consultant projects
Strategically upgraded into a full-scenario integrated
service platform and officially renamed as “A-Living
Smart City Services Co., Ltd.”
Established City Services segment and rapidly
complemented the nationwide business layout
through market expansion and M&A
The Group currently manages a total of 130 projects
under city services segment, with a total contract
value of RMB13 bn and a total annualized contract
value of RMB2 bn#
Further optimized revenue mix with a significant
rise in non-cyclical business.
In terms of three business lines, property mgt
services accounted for 64.7% of total revenue,
property owners VAS 10.5%, and extended VAS
24.8%
Developed innovative services and delivered
standardized products that drove property owners
VAS to grow by 116.9% YoY
Upgraded post-acquisition management platform,
overhauled business segments and business
lines and integrated branding and marketing
resources to achieve collaborative development.
Realized a shared business platform with deep
integration through Group’s lean management
Joined hands with Huawei and SenseTime to
develop smart service platforms to enhance
service level with technologies
A leading player in the industry ranked 4th of “2020
Top 100 Property Management Companies in China”,
driving A-Living’s brand value to nearly RMB10 bn.
Upholding the vision of “lifelong caring”, the Group
increased the overall satisfaction rate for the third
consecutive year to 91.1%
Included in the HSCI (mid-cap) and eligible stocks for
Shanghai-Hong Kong Stock Connect and Shenzhen-
Hong Kong Stock Connect
^
Remark: for the year ended 31 December 2020
(Currency: RMB)
^ Excluding the effect of the amortisation of intangible assets and depreciation of
appraised appreciation of fixed assets due to the M&A
4
Annual dividend
per share
RMB0.52
Basic earnings
per share
RMB1.32
^ Incl. associates, as at 22/3/2021
Results
Summary
02

Results Overview
Revenue
RMB10,026 mn
+95.5% YoY
Gross Profit
RMB2,973 mn
+57.9% YoY
Net Profit
RMB1,973 mn
+52.7% YoY
Profit Attributable to
Shareholders
RMB1,754 mn
+42.5% YoY
6
2,830
1,812
485
6,482
2,491
1,053
0
2,000
4,000
6,000
8,000
Property Mgt Services Extended VAS Property Owners VAS
2019 2020
Revenue and Growth Rate (by Business Lines)
(RMB mn)
715
903
264
1,414
999
560
25.3%
49.8%54.4%
21.8%
40.1%
53.2%
0
500
1,000
1,500
Property Mgt Services Extended VAS Property Owners VAS
2019 GP 2020 GP 2019 GP Margin 2020 GP Margin
Gross Profit and Gross Profit Margin (by Business Lines)
(RMB mn)

7
Financial Highlights
RMB mn 2020% of
revenue2019
% of
revenueChange
Revenue 10,026 5,127 +95.5%
Cost of sales (7,053) (70.3) (3,244) (63.3%) +117.4%
Gross profit 2,973 1,883 +57.9%
Gross profit margin 29.7% 36.7% (7.0 p.p.)
Selling and marketing
costs(77) (0.8%) (43) (0.8%) -
Administrative
expenses(548) (5.5%) (295) (5.8%) (0.3 p.p.)
Income tax rate 20.7% 23.8% (3.1 p.p.)
Net profit 1,973 1,292 +52.7%
Net profit margin 19.7% 25.2% (5.5 p.p.)
Profit attributable to
the shareholders of
the Company
1,754 1,231 +42.5%
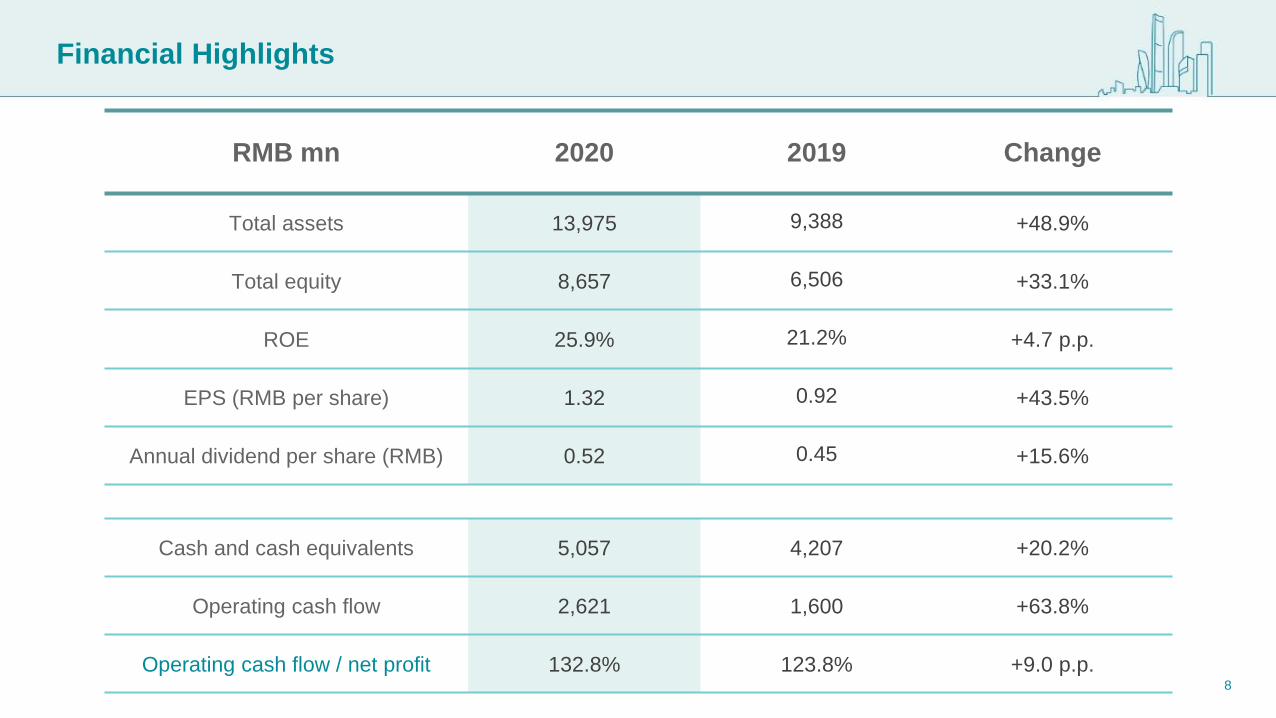
RMB mn 2020 2019 Change
Total assets 13,975 9,388 +48.9%
Total equity 8,657 6,506 +33.1%
ROE 25.9% 21.2% +4.7 p.p.
EPS (RMB per share) 1.32 0.92 +43.5%
Annual dividend per share (RMB) 0.52 0.45 +15.6%
Cash and cash equivalents 5,057 4,207 +20.2%
Operating cash flow 2,621 1,600 +63.8%
Operating cash flow / net profit 132.8% 123.8% +9.0 p.p.8
Financial Highlights

Business & Operation
Review
03
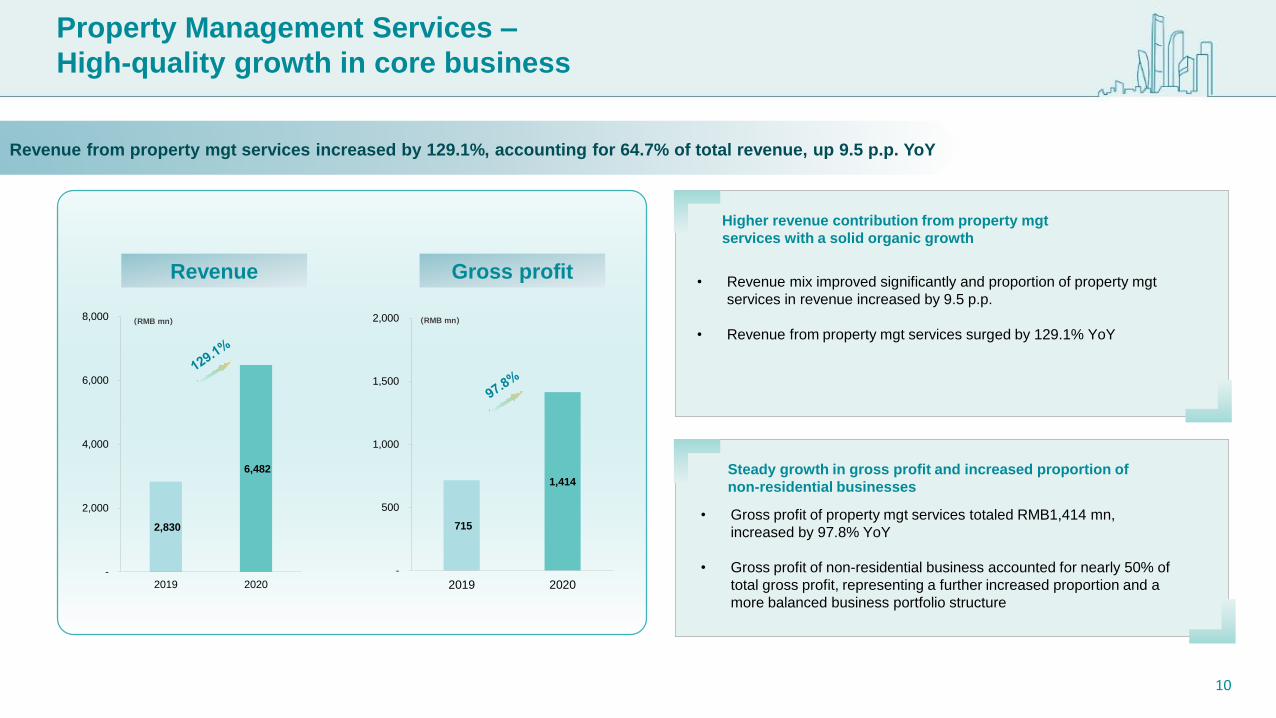
715
1,414
-
500
1,000
1,500
2,000
2019 2020
2,830
6,482
-
2,000
4,000
6,000
8,000
2019 2020
(RMB mn)
Revenue Gross profit
Higher revenue contribution from property mgt
services with a solid organic growth
• Revenue mix improved significantly and proportion of property mgt
services in revenue increased by 9.5 p.p.
• Revenue from property mgt services surged by 129.1% YoY
Steady growth in gross profit and increased proportion of
non-residential businesses
• Gross profit of property mgt services totaled RMB1,414 mn,
increased by 97.8% YoY
• Gross profit of non-residential business accounted for nearly 50% of
total gross profit, representing a further increased proportion and a
more balanced business portfolio structure
Revenue from property mgt services increased by 129.1%, accounting for 64.7% of total revenue, up 9.5 p.p. YoY
Property Management Services –
High-quality growth in core business
(RMB mn)
10

Property Management Services –
Ever-expanding scale and comprehensive business portfolio
298.8
181.7
77.1 40.1
522.6
387.4
82.1 53.1
0
100
200
300
400
500
600
700
31/12/2019 31/12/2020
176.6
114.2
53.8
8.6
374.8
301.1
59.8
13.9
0
100
200
300
400
50031/12/2019 31/12/2020
GFA Under Management(mn sq.m.) Contracted GFA
Third-party# Agile GreenlandTotal GFA under mgt
(80.3%) (16.0%) (3.7%)(64.7%) (30.5%) (4.8%)(% of Total)
Agile GreenlandTotal Contracted GFA
(15.7%) (10.2%)(25.8%) (13.4%)(% of Total)
Third-party#
(74.1%)(60.8%)
Over 569 mn^ Over 718 mn^
* Excl. GFA of consultant projects
# Incl. M&A
^ Incl. New CMIG PM, associates and consultant projects
*
*
*
*
Breakdown of Projects Under Management Reserved GFA
By GFA Under Management By Segment Revenue
43.1%56.9%
Residential
Non-residential
(mn sq.m.)
Contracted GFA/GFA under mgt 1.39x 1.12x1.63x
328
195201174
Residential andcommercialproperties
Public buildings
523
375
Total
Contracted GFA
GFA under mgt
(mn sq.m.)
40.4%
46.5%
13.1%Residential properties
Public buildings
Commercial buildingsand complex
Reserved GFA as at 31/21/2020 148 21127
11

• Newly entered into 74 cities, establishing
presence in 167 cities and realizing a full
coverage of all provincial-level administrative
regions in China
• Largely concentrated in economically developed
regions with 80% of projects under management
distributed in first and second-tier cities
Regional penetration under
a nationwide layout
• In terms of market expansion, newly obtained approx. 46 mn
sq.m. of contracted GFA from third-party developers. Average
management fee of newly obtained projects is approx.
RMB2.5/sq.m./month
• Backed by shareholder, newly added contracted GFA from
Greenland Group reached 13 mn sq.m., with an annualized
contract value of over RMB500 mn. Average management
fee of such projects is approx. RMB3.2/sq.m./month
• Achieved breakthroughs in business portfolio, strengthened
the advantages in niche markets, and obtained approx. 30
projects each with an annualized contract value of over
RMB10 mn
Encouraging news on
market expansion
City
Services
Breakthroughs
in business
portfolios
Leading
positions in
niche markets
Operation and maintenance of small
public restrooms in Shenzhen
- Market expansion of city services
High-end
commercial
buildings
300m super high-rise Greenland
Energy IFC (Xi’an)
- One of the super high-rise
landmark projects
城市服务
Ecological restoration of Dingtang River
- The Group’s river cleaning project
River
Cleaning
Dayun AI Town
- A featured town project with a
contract value of over RMB10 mn
Featured
Towns
More than 10 railway projects in Shanghai,
Nanjing, Xi’an and other cities
- Advantages in niche markets of public
buildings
Railways
Agricultural Bank of China – R&D Center
(Shanghai)
- Offered further and customized
services to existing clients
Customized
services for
enterprises
Wellness property project at Qinghaihu in
Xiangyun County, Dali City
- A large-scale multi-portfolio project
Wellness
real estate
Mega
residential
project
Greenland Hangzhou Bay
- One of the mega residential
projects obtained during the year
Property Management Services –
All-out efforts in market expansion and completed nationwide coverage
29.9%
23.8%
26.3%
20.0%
Tier 1
New Tier 1
Tier 2
Tier 3 & 4 orbelow
Business
Coverage by
City Tier
System
35.7%
25.0%
9.5%
8.1%
3.6%
3.0%15.1%
Yangtze River DeltaRegion
Greater Bay Area
Chengdu-Chongqingcity cluster
Lanzhou-Xining citycluster
Northern Bay citycluster
Harbin-Changchuncity cluster
Others
Business
Coverage by
Region
12
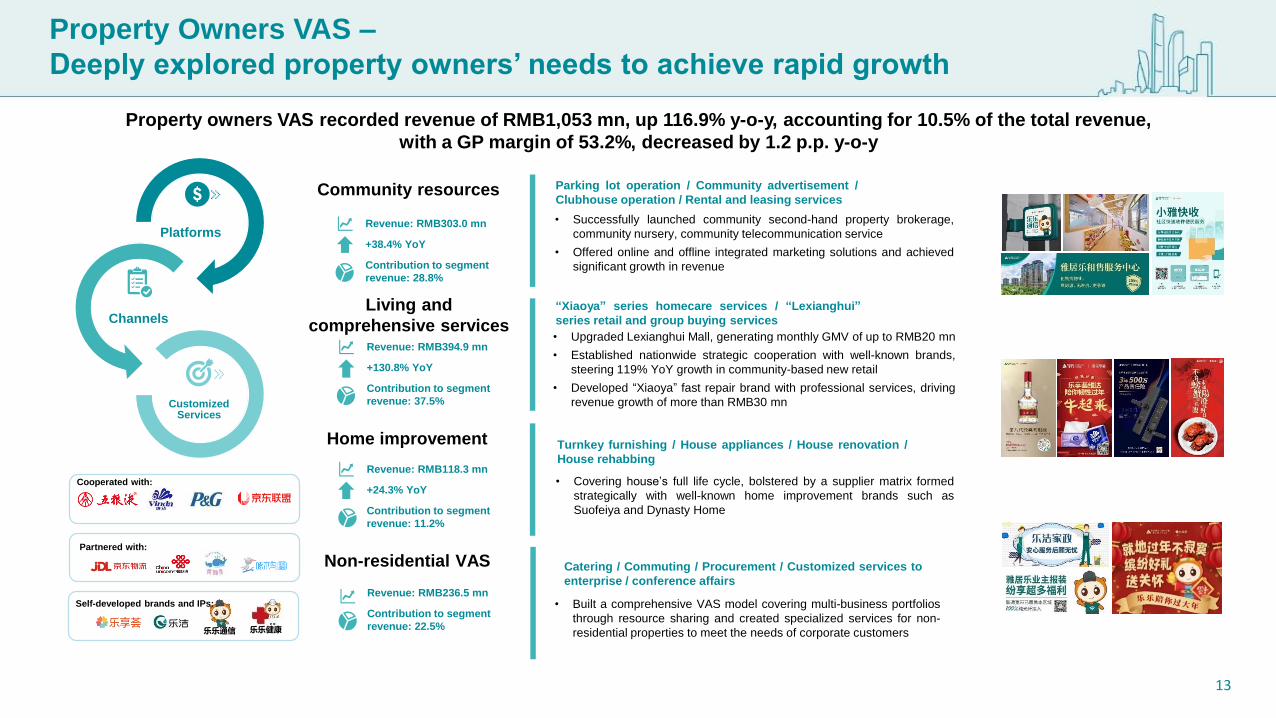
Community resources Parking lot operation / Community advertisement /
Clubhouse operation / Rental and leasing services
Living and
comprehensive services
• Successfully launched community second-hand property brokerage,
community nursery, community telecommunication service
• Offered online and offline integrated marketing solutions and achieved
significant growth in revenue
Home improvement Turnkey furnishing / House appliances / House renovation /
House rehabbing
“Xiaoya” series homecare services / “Lexianghui”
series retail and group buying services
• Upgraded Lexianghui Mall, generating monthly GMV of up to RMB20 mn
• Established nationwide strategic cooperation with well-known brands,
steering 119% YoY growth in community-based new retail
• Developed “Xiaoya” fast repair brand with professional services, driving
revenue growth of more than RMB30 mn
• Covering house’s full life cycle, bolstered by a supplier matrix formed
strategically with well-known home improvement brands such as
Suofeiya and Dynasty Home
Platforms
Channels
Customized Services
Revenue: RMB303.0 mn
+38.4% YoY
Contribution to segment
revenue: 28.8%
Revenue: RMB394.9 mn
+130.8% YoY
Contribution to segment
revenue: 37.5%
Revenue: RMB118.3 mn
+24.3% YoY
Contribution to segment
revenue: 11.2%
Non-residential VAS Catering / Commuting / Procurement / Customized services to
enterprise / conference affairs
• Built a comprehensive VAS model covering multi-business portfolios
through resource sharing and created specialized services for non-
residential properties to meet the needs of corporate customers
Revenue: RMB236.5 mn
Contribution to segment
revenue: 22.5%
Cooperated with:
Partnered with:
乐乐通信 乐乐健康
Self-developed brands and IPs:
Property Owners VAS –
Deeply explored property owners’ needs to achieve rapid growth
Property owners VAS recorded revenue of RMB1,053 mn, up 116.9% y-o-y, accounting for 10.5% of the total revenue,
with a GP margin of 53.2%, decreased by 1.2 p.p. y-o-y
13

24.8%
Extended VAS recorded revenue of RMB2,491 mn, up 37.5% y-o-y, accounting for 24.8% of the total
revenue, decreased by 10.5 p.p. y-o-y; GP margin was 40.1%
35.3% Proportion of
cyclical business to
revenue dropped
significantly
Full-cycle managementReception / Security / Venue maintenance / Equipment maintenance
Asset-light modelMarketing /Sales agency / Referral Marketing
One-stop property developer VASHouse inspection / Technology support / Other consulting services
Revenue from extended VAS / Total revenue
Extended VAS –
Focused on core businesses while offering full-cycle services
701.8
1,110.5 990.9
1,500.4
Sales center mgt services Other extended VAS
2019
2020
(RMB mn)
2019 2020
14
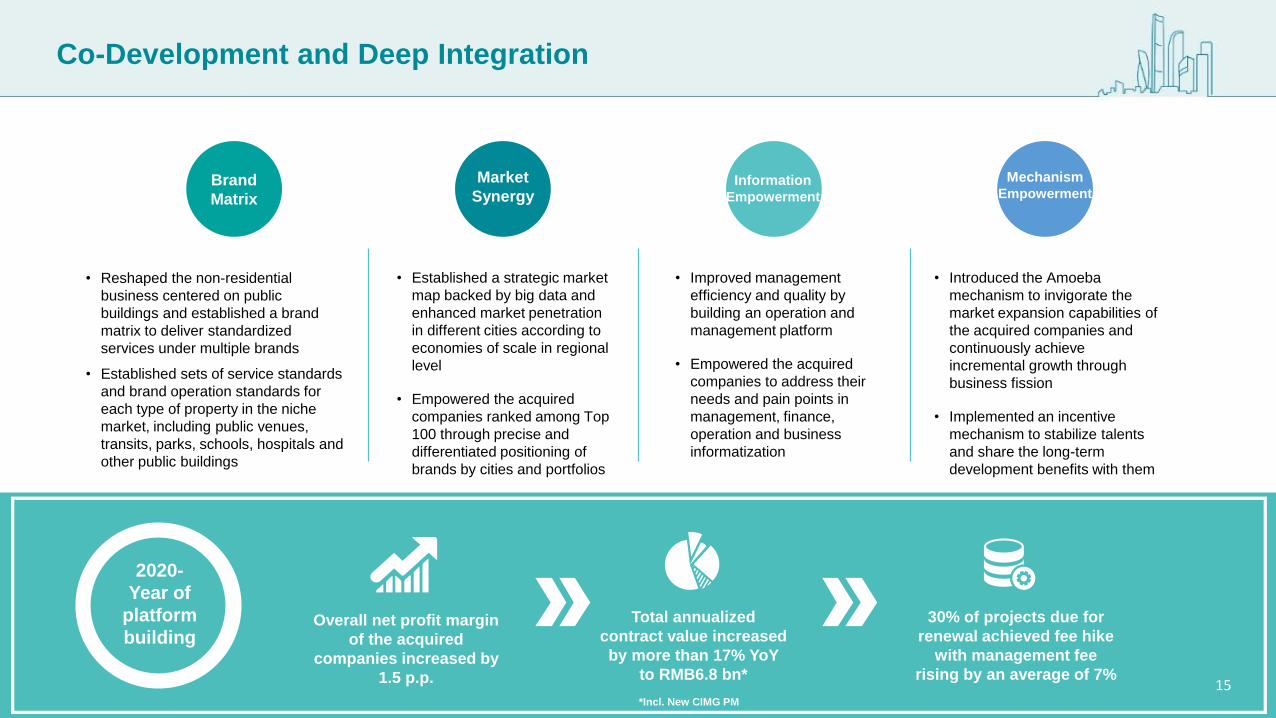
Co-Development and Deep Integration
Brand
Matrix
2020-
Year of
platform
buildingOverall net profit margin
of the acquired
companies increased by
1.5 p.p.
Total annualized
contract value increased
by more than 17% YoY
to RMB6.8 bn*
• Reshaped the non-residential
business centered on public
buildings and established a brand
matrix to deliver standardized
services under multiple brands
• Established sets of service standards
and brand operation standards for
each type of property in the niche
market, including public venues,
transits, parks, schools, hospitals and
other public buildings
• Established a strategic market
map backed by big data and
enhanced market penetration
in different cities according to
economies of scale in regional
level
• Empowered the acquired
companies ranked among Top
100 through precise and
differentiated positioning of
brands by cities and portfolios
• Improved management
efficiency and quality by
building an operation and
management platform
• Empowered the acquired
companies to address their
needs and pain points in
management, finance,
operation and business
informatization
• Introduced the Amoeba
mechanism to invigorate the
market expansion capabilities of
the acquired companies and
continuously achieve
incremental growth through
business fission
• Implemented an incentive
mechanism to stabilize talents
and share the long-term
development benefits with them
30% of projects due for
renewal achieved fee hike
with management fee
rising by an average of 7%
Market
SynergyInformation
Empowerment
Mechanism Empowerment
*Incl. New CIMG PM
15

Quality First and Brand Upgrade
• A-Living’s ranking in terms of comprehensive strengths
reached a record high with its advantages in the niche
markets
• Ranks the 4th of the “Top 100 Property Management Companies
in China”, and its seven brands have also been listed in the Top
100, with a brand value reaching RMB9.796 bn
• Awarded as the “2020 Leading Specialized Property
Management Company in China – A Leading Brand in the
Provision of Comprehensive Public Building Services”
• Actively participated in the innovation and reform of
capital market, becoming the first batch of listed
companies to complete H share full circulation, which
strengthened the foundation for long-term development
• Included in the HSCI (mid-cap) and eligible stocks for
Shanghai-Hong Kong Stock Connect and Shenzhen-Hong
Kong Stock Connect
• Awarded as the “Most Honored Companies” by Institutional
Investor
• Officially changed the company name to “A-Living Smart
City Services Co., Ltd.” in a move to realize strategic
upgrade
• Launched a brand upgrade plan to refine brand positioning
and overhaul brand matrix strategy, aiming at creating
differentiated advantages
A shield for
communities
A guardian for
property owners
Unveiled a corporate IP -
Xiaoya
• Upheld the vision of “lifelong caring for
property owners” to create “heart-warming
communities”, with annual management fee
collection rate hitting 94.1%
• Property owners’ satisfaction rate increased
for the third consecutive year to 91.1%, 7.8%
higher than the average of TOP20 peers
• Stood on the front-line of epidemic prevention
to safeguard the lives and health of millions of
property owners; upgraded protection
standards and normalized epidemic prevention
and control measures
• Participated in the formulation of industry
standards and took lead in compiling
guidelines for epidemic prevention and
specifications for public facilities and
equipment
16

City Services Layout
04

Dalian MingriAcquired 51% equity interest
Ranked 16th out of Top 100
environmental sanitation service
enterprises in China*
ZH SanitationAcquired 30% equity interest
Ranked 10th out of Top 100
environmental sanitation service
enterprises in China*
Anhui YurunIntended to acquire 51% equity
interest
One of Top 100 cleaning
services brands in China
Shaanxi MingtangAcquired 60% equity interest
One of Top 100 environmental
sanitation service enterprises in
China
Mapping Out a Nationwide Layout for City Services
Business layout of
city services
Strategy implementation: Mapped out a development
strategy for city services to further extend industry value chain
and enhance the anti-cyclicality and growth ability of business
Brand upgrade: Acquired the Top 10, Top 100 or regional
dominant brands through equity acquisition to form a strong
alliance and enhance the market influence
Leading scale: Currently manages over 130 projects with a
total annualized contract value of over RMB10 bn#, lifting A-
Living as a leading city services enterprise
Nationwide layout: Seven regional offices will collaborate
with the acquired companies to form a nationwide layout and
establish a dominant position in each regional market
Expansion capability: Extensive experience and
qualifications together lay a solid foundation for further market
expansion
Source: Huanjingsinan, 2020 Top 100 Enterprises *According to total contract value ^According to annualized contract value #Incl. associates as at 31 Dec 2020
• City services business is making some headway with more than 130 projects under management, covering 53 cities in 20 provinces, autonomous
regions and municipalities, representing a total annualized contract value of over RMB2 bn and total contract value of over RMB13 bn#
• Following the strategy, A-Living recently acquired 5 leading city integrated services enterprises for a total of RMB1.18 bn at a roughly 10 times P/E
ratio, and rapidly mapped out a city services layout by adding Top 10 and Top 16 environmental sanitation service companies to the Group
YahaoA subsidiary of A-Living
specialized in city services
business
Beijing HuifengAcquired 51% equity interest
Ranked 28th out of Top 100
environmental sanitation service
enterprises in China^
City Services SegmentCollaborative development of
seven regions to shape a
nationwide layout
18

Large-scale projects with
long-term contracts
• The acquired companies are expected to hit a revenue of
over RMB2.5 bn as a whole in 2021, given their solid track
records of profitability. Their average GP margin was
24.7% and average NP margin was 12.5%.
• The average contract duration of projects under
management is 5.73 years and the renewal rate in 2020
was higher than 95%.
Large-
scale
Diversified
partnership with
asset-light DNA
• Government’s bidding and procurement process is
transparent, and the business model is asset-light.
• PPP (public-private partnership) project only accounts
for 7% of total projects, which has a manageable
investment amount and can secure contracts with higher
contract value and longer duration.
Asset-light
A non-cyclical and
defensive business
• As a rigid demand, city services' development is less
affected by macroeconomic factors without obvious
cyclical fluctuations.
• With such a steadily growing business and a relatively
flexible pricing mechanism, the annualized contract
value of acquired companies grew at a CAGR of over
53% from 2017 to 2020.
ResilienceHigh collection rate
and solid cash flow
• Low risk of default as city services is included in the
government budget and enjoy a priority in payment with
settlement cycle usually no longer than one quarter.
• The past fee collection rate of acquired companies has
been remained stable above 95%. Their cash flow is in
healthy condition with controllable investment.
Stability
A Good Business with Stable Performance
Unaudited figures for the year ended 31 December 2020. Incl. subsidiaries and associates19

Outlook
05
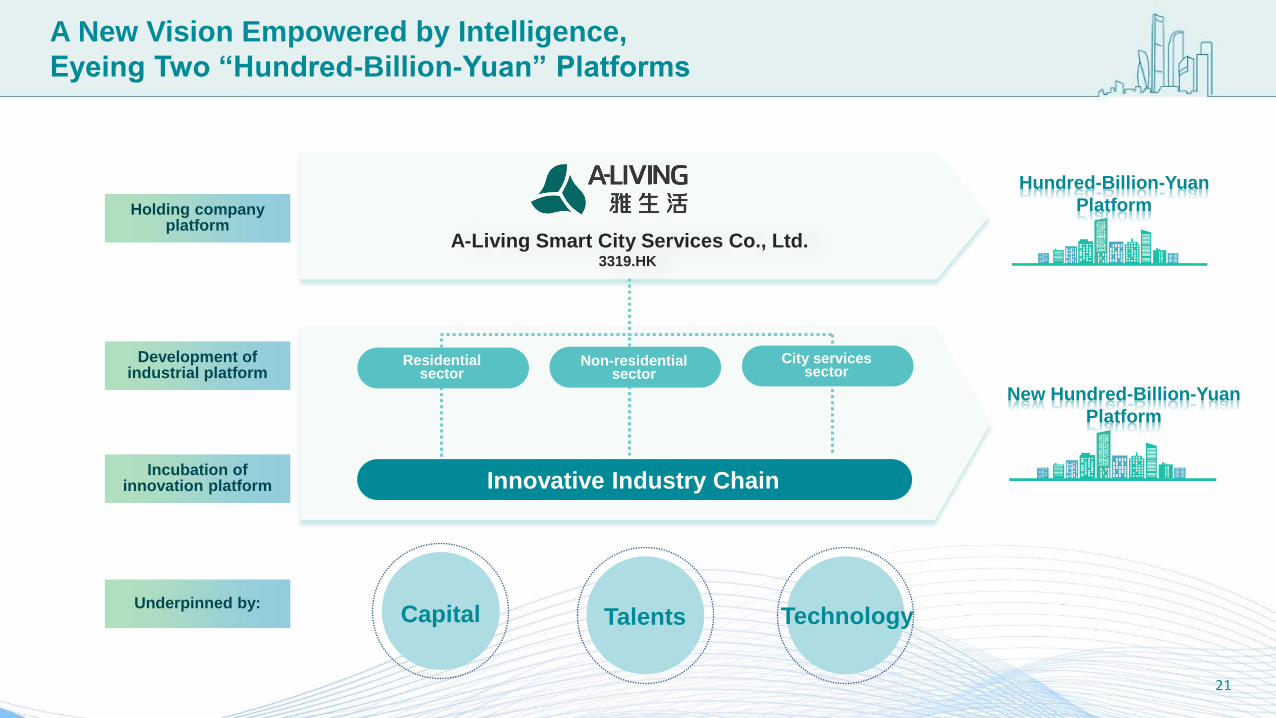
Holding company platform
Development of industrial platform
Incubation of innovation platform
Hundred-Billion-Yuan
Platform
A New Vision Empowered by Intelligence,
Eyeing Two “Hundred-Billion-Yuan” Platforms
Capital Talents TechnologyUnderpinned by:
A-Living Smart City Services Co., Ltd.3319.HK
Residential sector
Innovative Industry Chain
Non-residential sector
City services sector
New Hundred-Billion-Yuan
Platform
21
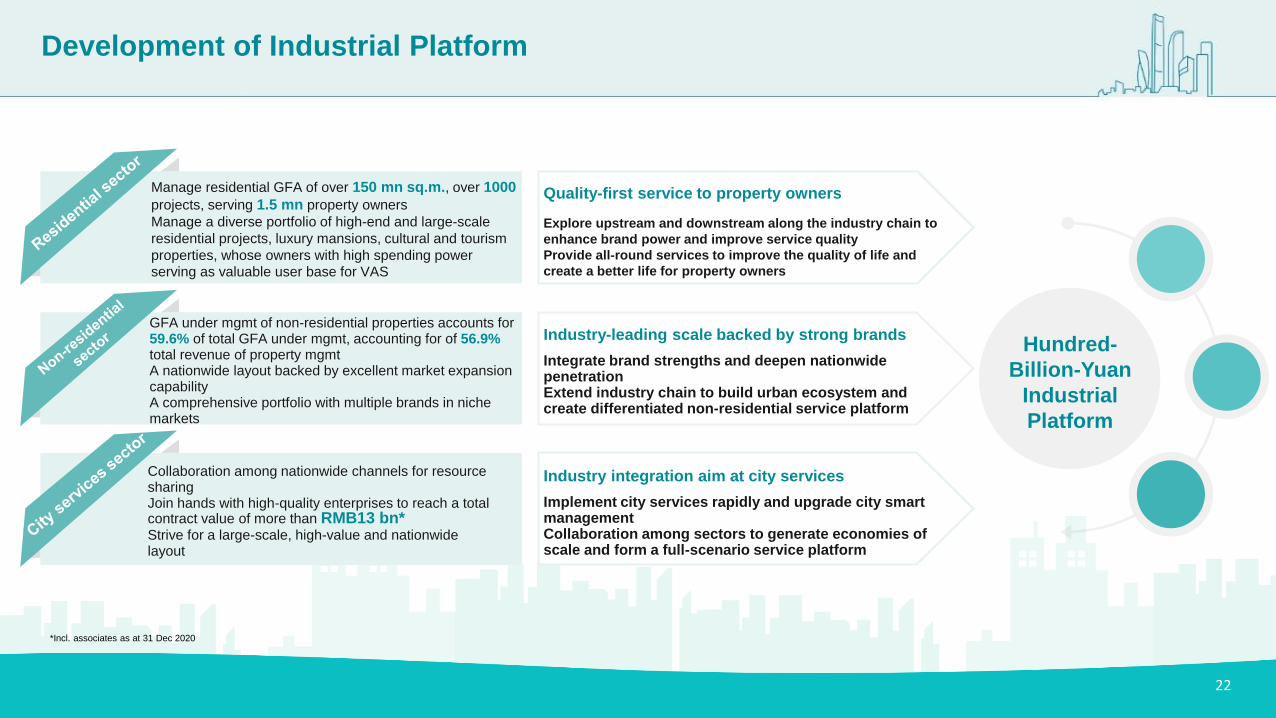
Quality-first service to property owners
Explore upstream and downstream along the industry chain to
enhance brand power and improve service quality
Provide all-round services to improve the quality of life and
create a better life for property owners
Industry-leading scale backed by strong brands
Integrate brand strengths and deepen nationwide penetrationExtend industry chain to build urban ecosystem and create differentiated non-residential service platform
Industry integration aim at city services
Implement city services rapidly and upgrade city smart managementCollaboration among sectors to generate economies of scale and form a full-scenario service platform
Hundred-
Billion-Yuan
Industrial
Platform
Development of Industrial Platform
Manage residential GFA of over 150 mn sq.m., over 1000
projects, serving 1.5 mn property owners
Manage a diverse portfolio of high-end and large-scale
residential projects, luxury mansions, cultural and tourism
properties, whose owners with high spending power serving as valuable user base for VAS
GFA under mgmt of non-residential properties accounts for 59.6% of total GFA under mgmt, accounting for of 56.9%total revenue of property mgmtA nationwide layout backed by excellent market expansion capabilityA comprehensive portfolio with multiple brands in niche markets
Collaboration among nationwide channels for resource sharingJoin hands with high-quality enterprises to reach a total contract value of more than RMB13 bn*Strive for a large-scale, high-value and nationwide layout
*Incl. associates as at 31 Dec 2020
22

Build an innovation platform through strategic business layout and diversified cooperation to incubate upstream and downstream
businesses and build a full-scenario service platform for urban life
Team up with leading companies in different fields to improve service in niche markets, enhance diversified development and
provide differentiated comprehensive services to property owners
Industry chain of property mgt services Industry chain of VAS Industrial chain of urban ecology
• Focus on property management’s
upstream and downstream
industries and build a centralized
cost management platform for key
areas and businesses to bring
economies of scale into play
• Improve the consistency in service
delivery and break through the
boundaries of service area
• Focus on urban life scenarios and
explore the possibility of
developing cross-sector
comprehensive services
• Broaden the market of
comprehensive city services
through extension of business and
cross-sector cooperation
Innovation of Industry Layout and
Discovery of Diversified Businesses
• Notice on Strengthening and Improving Residential Property Management
The government encourages property management companies to explore the development of fields such as elderly care,
childcare, housekeeping, culture, healthcare, leasing, express delivery, information technology, etc.
• Opinions of the General Office of the State Council on Promoting the Healthy Development of Elderly Care and Childcare
Services [2020] (No.52)
The government encourages property management companies to vigorously develop elderly care, childcare, house rehabbing
(incl. house rehabbing for the elderly and the young, urban re-development, etc.), group meal, leasing, medical
treatment, healthcare and other businesses
Policy tailwinds
Incubation of Innovative Platform
• Focus on the upstream and downstream
of supply chain to identify and fill the
blanks of business and strive for flexible
and innovative deployment for VAS
business
• Focus on VAS strongly encouraged by the
government and create a VAS service
platform for “property services + living
services”23

Lifelong Caring for A Better You
A-Living Smart City Services Co., Ltd.