a long stokes shift red fluorescent ca2& indicator protein...
TRANSCRIPT

ARTICLE
Received 23 May 2014 | Accepted 12 Sep 2014 | Published 31 Oct 2014
A long Stokes shift red fluorescent Ca2þ indicatorprotein for two-photon and ratiometric imagingJiahui Wu1, Ahmed S. Abdelfattah1, Loıs S. Miraucourt2, Elena Kutsarova2, Araya Ruangkittisakul3,
Hang Zhou1, Klaus Ballanyi3, Geoffrey Wicks4, Mikhail Drobizhev4, Aleksander Rebane4,5,
Edward S. Ruthazer2 & Robert E. Campbell1
The introduction of calcium ion (Ca2þ ) indicators based on red fluorescent proteins (RFPs)
has created new opportunities for multicolour visualization of intracellular Ca2þ dynamics.
However, one drawback of these indicators is that they have optimal two-photon excitation
outside the near-infrared window (650–1,000 nm) where tissue is most transparent to light.
To address this shortcoming, we developed a long Stokes shift RFP-based Ca2þ indicator,
REX-GECO1, with optimal two-photon excitation at o1,000 nm. REX-GECO1 fluoresces at
585 nm when excited at 480 nm or 910 nm by a one- or two-photon process, respectively.
We demonstrate that REX-GECO1 can be used as either a ratiometric or intensiometric Ca2þ
indicator in organotypic hippocampal slice cultures (one- and two-photon) and the visual
system of albino tadpoles (two-photon). Furthermore, we demonstrate single excitation
wavelength two-colour Ca2þ and glutamate imaging in organotypic cultures.
DOI: 10.1038/ncomms6262
1 Department of Chemistry, University of Alberta, Edmonton, Alberta, Canada T6G 2G2. 2 Department of Neurology and Neurosurgery, Montreal NeurologicalInstitute, Neuroengineering Program, McGill University, Montreal, Quebec, Canada H3A 2B4. 3 Department of Physiology, University of Alberta, Edmonton,Alberta, Canada T6G 2H7. 4 Department of Physics, Montana State University, Bozeman, Montana 59717, USA. 5 National Institute of Chemical Physics andBiophysics, Tallinn, Estonia 12618. Correspondence and requests for materials should be addressed to R.E.C. (email: [email protected]).
NATURE COMMUNICATIONS | 5:5262 | DOI: 10.1038/ncomms6262 | www.nature.com/naturecommunications 1
& 2014 Macmillan Publishers Limited. All rights reserved.

The development of genetically encoded Ca2þ indicatorshas proven to be a great benefit to cell biology, as thesetools have enabled the robust visualization and quantifica-
tion of this key cytosolic second messenger in a diverse array ofcell types and tissues1,2. The two most important classes ofgenetically encoded Ca2þ indicators are the Forster resonanceenergy transfer-type (that is, cameleon)3, and the GCaMP-type4,5.GCaMP-type indicators are composed of the calmodulin (CaM)Ca2þ binding protein and the CaM-binding region of chickenmyosin light chain kinase (M13), fused to the C and N termini ofa circularly permuted (cp) fluorescent protein (FP). Theprototypical mechanism for a GCaMP-type indicator involvesthe Ca2þ -dependent association of CaM and M13, causing amodification of the environment of the tyrosine-derivedchromophore such that the fluorescent brightness or hue ismodulated. Most typically, this modulation is attributable tochanges in the effective pKa of the chromophore and concomitantchanges in the relative populations of the protonated phenol anddeprotonated phenolate forms6. Among the various GCaMP-typeindicators reported in recent years are green fluorescent variantshighly optimized for in vivo neuronal imaging7, photoconvertiblevariants8, and various new colours, including blue, cyan, yellowand red9–12. Of these new colours, red fluorescent indicators havethe greatest potential to challenge the latest generation of highlyoptimized GCaMP variants7 as the preferred tools for in vivoimaging. The versatility of currently available red FP-based Ca2þ
indicators has been demonstrated in various tissues andorganisms including the retinotectal system in zebrafish13,mushroom body neurons in Drosophila14,15 and chicken spinalcord16.
Relative to more blue-shifted fluorophores, red fluorophoreshave the intrinsic advantages of improved tissue penetration forboth the excitation and emission light, and lower autofluores-cence and phototoxicity due to longer wavelength excitation.These favourable trends continue for wavelengths extending intothe near-infrared (NIR) optical window (B650–1,000 nm), wherelight penetrates the furthest into mammalian tissue due tominimal absorption by haemoglobin and water17,18. Despitesubstantial efforts to push RFPs19 and RFP-based Ca2þ
indicators10 to ever-longer excitation and emission wavelengths,even the most red-shifted fluorophores of the RFPs havenegligible one-photon absorbance at wavelengths of 650 nm orabove. An alternative approach to excite visible fluorophores istwo-photon excitation20 at NIR wavelengths that areapproximately double (half the energy) the one-photonexcitation maximum. However, as RFPs tend to have one-photon excitation peaks at 580–600 nm, their two-photon cross-section maxima typically lie beyond 1,000 nm21. At thesewavelengths, absorption by water can lead to undesirable tissueheating, and, importantly, these wavelengths are out of tuningrange of many commercial Ti-sapphire lasers.
One effective solution to this problem is to exploit long Stokesshift RFPs, such as mKeima22, which have one-photon excitationmaxima at wavelengths o500 nm and optimal two-photon cross-section at o1,000 nm. The ground state chromophore of a longStokes shift RFP primarily exists in the protonated form.Typically, a proximal acidic group (that is, the carboxylate sidechain of Asp or Glu) acts to destabilize the anionic phenolateform (absorbance B580 nm; fluorescence B600 nm) andstabilize the neutral phenol form (absorbance B460 nm;typically non-fluorescent). Illumination leads to formation ofthe excited state of the phenol form, which is associated with adecreased pKa. Excited state proton transfer (ESPT) occurs andthe proton is transferred from the phenol moiety to the proximalacidic group, producing the phenolate form of the chromophorethat emits its characteristic red fluorescence23. It has been
reported that ESPT (and long Stokes shift spectral characteristics)can be engineered into RFPs, such as mKate, by introducing anacidic Glu or Asp residue at position 160, which is in closeproximity to the phenol group of the chromophore24.
Inspired by the X-ray crystal structure of the red fluorescentCa2þ indicator R-GECO1 (PDB ID 4I2Y)9, we reasoned thatwe could engineer it to undergo Ca2þ -dependent ESPT.We expected that this would produce a long Stokes shift redfluorescent Ca2þ indicator with a two-photon excitationmaximum in the NIR window. Here, we describe our successfuleffort to develop, characterize and validate a genetically encodedlong Stokes shift red fluorescent Ca2þ indicator.
ResultsInitial engineering of REX-GECO0.1. Our design for engi-neering a ratiometric red Ca2þ indicator was inspired by reportsof engineered monomeric RFPs with large Stokes shift23,24.Inspection of the X-ray crystal structure of R-GECO1 (PDB ID4I2Y)9 (Fig. 1a) revealed three residues (Ser64, Lys80 and Ile116;GCaMP numbering as in the PDB file 3EVR6; SupplementaryFig. 1) that were near the phenolate moiety of the chromophoreof R-GECO1 in the Ca2þ -bound state. We reasoned that each ofthese residues could potentially serve to stabilize the phenol formand act as an excited state proton acceptor if mutated to an acidicresidue. Lys80 was the most promising position owing to its directelectrostatic interaction with the phenolate moiety. To test ourhypothesis, we created a genetic library in which the codons forSer64, Lys80 and Ile116 were simultaneously randomized using acodon subset that encoded for a total of 624 different variants.This library was expressed in the pTorPE periplasmic expressionvector11 and thoroughly screened in a colony-imaging format bylooking for clones that exhibited long Stokes shift redfluorescence (excitation at 438/24 nm and emission 609/57 nm).
Image A Image BA X B
438/24 nmexcitation
542/27 nmexcitation
R-GECO1
Image C
Lys80
Ser64Ile116
Figure 1 | Structure of R-GECO1 and screening scheme for REX-GECO.
(a) Overall structure of R-GECO1 (PDB ID 4I2Y) and zoom in on its
chromophore. The side chains of three proximal residues, Ser64, Lys80 and
Ile116, are shown in stick format9. Residue numbering is consistent with the
crystal structure of G-CaMP2 (PDB ID 3EVR)6. (b) Screening scheme to
identify excitation ratiometric red fluorescent variants. E. coli colonies
expressing REX-GECO variants were illuminated using either 438/24 nm or
542/27 nm light, and a red fluorescent image using 609/57 nm filter was
acquired. The two resulting images were then multiplied to generate a third
image in which colonies with strong moderate to strong intensity under
both illumination conditions had the highest combined intensity. These
colonies were selected for further testing.
ARTICLE NATURE COMMUNICATIONS | DOI: 10.1038/ncomms6262
2 NATURE COMMUNICATIONS | 5:5262 | DOI: 10.1038/ncomms6262 | www.nature.com/naturecommunications
& 2014 Macmillan Publishers Limited. All rights reserved.
This screening led to the identification of an excitationratiometric variant, designated as REX-GECO0.1, whichharboured the Lys80Glu mutation. REX-GECO0.1 exhibits anexcitation peak at B575 nm (that is, the phenolate form) in theCa2þ -free state and, on binding to Ca2þ , this peak diminishesand a long Stokes shift excitation peak arises at B480 nm (that is,the phenol form). The excitation ratio (R¼ red intensitywith excitation at 450 nm divided by the red intensity withexcitation at 580 nm) increases 6.5-fold (RþCa/R�Ca–1) onbinding to Ca2þ .
Optimization of REX-GECO0.1 for improved function.REX-GECO0.1’s fluorescence brightness and maturation rate, inthe context of Escherichia coli colonies, were greatly reducedcompared with R-GECO1. To engineer a variant with brighterfluorescence and a larger response to Ca2þ , we applied bothrational design and directed evolution. Based on our previousexperience, the linker between M13 and the cpFP domain has animportant role in the protein-folding efficiency and response toCa2þ (refs 10,11). In an effort to identify the optimalcomposition of this linker, we created a library by fullyrandomizing linker positions 60 and 61 (Pro and Val,respectively, in REX-GECO0.1). Screening of this library forbright long Stokes shift red fluorescence led to the identificationof a variant with mutations Pro60Arg and Val61Trp (REX-GECO0.2). REX-GECO0.2 showed approximately threefoldimproved fluorescence brightness and improved maturation ratein Escherichia coli relative to REX-GECO0.1, while retaining asimilar excitation ratio change on binding Ca2þ .
To further optimize REX-GECO0.2, we turned to a directedevolution strategy that involved multiple rounds of librarycreation by random mutagenesis and screening by fluorescenceimaging of bacterial colonies. After each round the brightestclones were cultured, purified and subjected to a secondary screenin microplate format to determine their Ca2þ response. Amixture of the 4–8 variants with the brightest fluorescence andlargest responses to Ca2þ was used as the template for the nextround of library creation by random mutagenesis. For the first sixrounds of this procedure, we screened libraries only on the basisof the brightness of their long Stokes shift red fluorescence incolonies. For the last two rounds of directed evolution, weswitched to screening for proteins that exhibited a combinationof bright long Stokes shift and short Stokes shift (excitation at542/27 nm and emission 609/57 nm) fluorescence (Fig. 1b). Theend products of these eight rounds of directed evolution were twoimproved variants: REX-GECO0.9 and REX-GECO1 with 15 and14 mutations, respectively, relative to R-GECO1 (Fig. 2a;Supplementary Figs 1 and 2a; Supplementary Table 1).
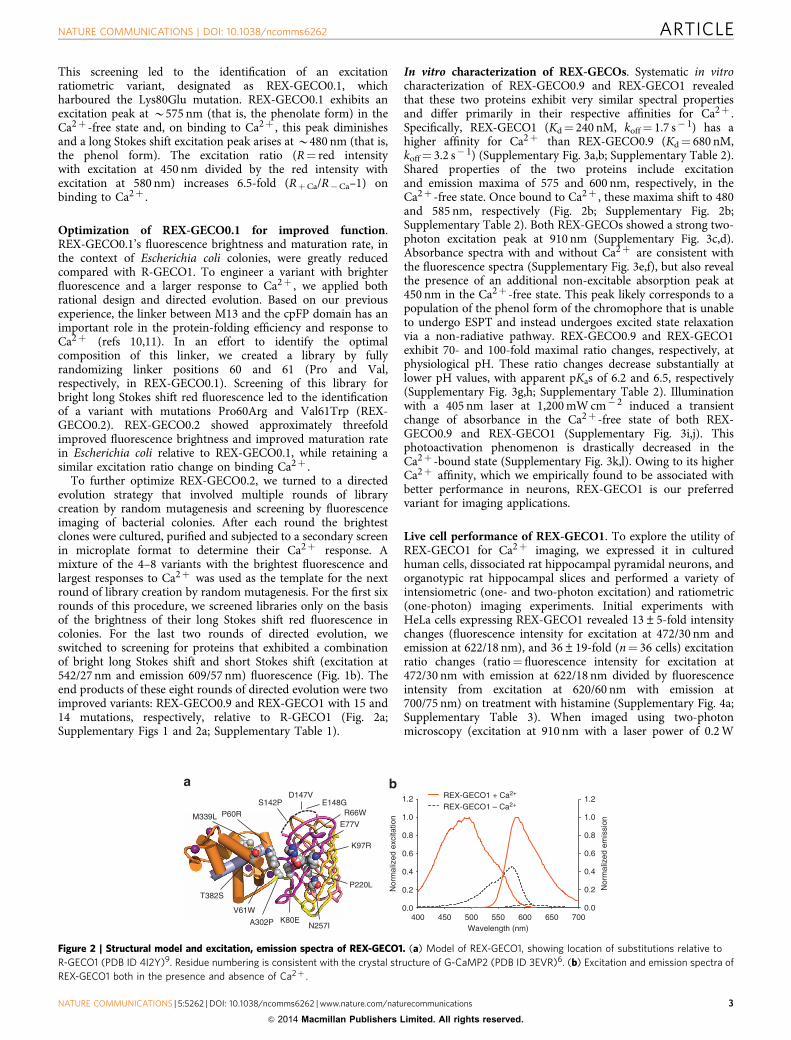
In vitro characterization of REX-GECOs. Systematic in vitrocharacterization of REX-GECO0.9 and REX-GECO1 revealedthat these two proteins exhibit very similar spectral propertiesand differ primarily in their respective affinities for Ca2þ .Specifically, REX-GECO1 (Kd¼ 240 nM, koff¼ 1.7 s� 1) has ahigher affinity for Ca2þ than REX-GECO0.9 (Kd¼ 680 nM,koff¼ 3.2 s� 1) (Supplementary Fig. 3a,b; Supplementary Table 2).Shared properties of the two proteins include excitationand emission maxima of 575 and 600 nm, respectively, in theCa2þ -free state. Once bound to Ca2þ , these maxima shift to 480and 585 nm, respectively (Fig. 2b; Supplementary Fig. 2b;Supplementary Table 2). Both REX-GECOs showed a strong two-photon excitation peak at 910 nm (Supplementary Fig. 3c,d).Absorbance spectra with and without Ca2þ are consistent withthe fluorescence spectra (Supplementary Fig. 3e,f), but also revealthe presence of an additional non-excitable absorption peak at450 nm in the Ca2þ -free state. This peak likely corresponds to apopulation of the phenol form of the chromophore that is unableto undergo ESPT and instead undergoes excited state relaxationvia a non-radiative pathway. REX-GECO0.9 and REX-GECO1exhibit 70- and 100-fold maximal ratio changes, respectively, atphysiological pH. These ratio changes decrease substantially atlower pH values, with apparent pKas of 6.2 and 6.5, respectively(Supplementary Fig. 3g,h; Supplementary Table 2). Illuminationwith a 405 nm laser at 1,200 mW cm� 2 induced a transientchange of absorbance in the Ca2þ -free state of both REX-GECO0.9 and REX-GECO1 (Supplementary Fig. 3i,j). Thisphotoactivation phenomenon is drastically decreased in theCa2þ -bound state (Supplementary Fig. 3k,l). Owing to its higherCa2þ affinity, which we empirically found to be associated withbetter performance in neurons, REX-GECO1 is our preferredvariant for imaging applications.
Live cell performance of REX-GECO1. To explore the utility ofREX-GECO1 for Ca2þ imaging, we expressed it in culturedhuman cells, dissociated rat hippocampal pyramidal neurons, andorganotypic rat hippocampal slices and performed a variety ofintensiometric (one- and two-photon excitation) and ratiometric(one-photon) imaging experiments. Initial experiments withHeLa cells expressing REX-GECO1 revealed 13±5-fold intensitychanges (fluorescence intensity for excitation at 472/30 nm andemission at 622/18 nm), and 36±19-fold (n¼ 36 cells) excitationratio changes (ratio¼ fluorescence intensity for excitation at472/30 nm with emission at 622/18 nm divided by fluorescenceintensity from excitation at 620/60 nm with emission at700/75 nm) on treatment with histamine (Supplementary Fig. 4a;Supplementary Table 3). When imaged using two-photonmicroscopy (excitation at 910 nm with a laser power of 0.2 W
0.0
0.2
0.4
0.6
0.8
1.0
1.2
0.0
0.2
0.4
0.6
0.8
1.0
1.2
400 450 500 550 600 650 700
REX-GECO1 + Ca2+
REX-GECO1 – Ca2+
Nor
mal
ized
em
issi
on
Wavelength (nm)
Nor
mal
ized
exc
itatio
n
E148GP60R
V61W
R66W
E77V
K80E
K97R
S142PD147V
P220L
N257IA302P
M339L
T382S
Figure 2 | Structural model and excitation, emission spectra of REX-GECO1. (a) Model of REX-GECO1, showing location of substitutions relative to
R-GECO1 (PDB ID 4I2Y)9. Residue numbering is consistent with the crystal structure of G-CaMP2 (PDB ID 3EVR)6. (b) Excitation and emission spectra of
REX-GECO1 both in the presence and absence of Ca2þ .
NATURE COMMUNICATIONS | DOI: 10.1038/ncomms6262 ARTICLE
NATURE COMMUNICATIONS | 5:5262 | DOI: 10.1038/ncomms6262 | www.nature.com/naturecommunications 3
& 2014 Macmillan Publishers Limited. All rights reserved.

(180 mW, when measured at the front of the objective), andemission at 642.5/75 nm), REX-GECO1 photobleached to 50% ofits initial fluorescence after 294 s of continuous illumination(Supplementary Fig. 4b). On treatment of cells with histamine,REX-GECO1 showed a 5±2-fold (n¼ 30 cells) intensity change(Supplementary Fig. 4c), which is consistent with our results fromone-photon excitation (Supplementary Table 3).
To compare the fluorescent brightness of REX-GECO1 andR-GECO1 (ref. 11) under two-photon excitation, transfectedHeLa cells (treated with CaCl2 (10 mM) and ionomycin (5 mM))were imaged by two-photon microscopy with excitation at 910and 1,040 nm. When excited at 910 nm (laser power of 0.1 W(90 mW, when measured at the front of the objective), withemission at 642.5/75 nm), HeLa cells expressing REX-GECO1showed high red fluorescence intensity (Supplementary Fig. 4d),whereas the R-GECO1-expressing cells were barely detectable(Supplementary Fig. 4e). Reasoning that 910 nm is not theoptimal wavelength for two-photon excitation of R-GECO1, wealso used 1,040 nm and the maximal laser power of 0.61 W(1,200mW, when measured at the front of the objective)with emission at 642.5/75 nm. Even at this longer wavelength,a robust red fluorescent signal was not observed for R-GECO1(Supplementary Fig. 4f). Overall, REX-GECO1 showed signifi-cantly higher brightness compared with R-GECO1 when imagedwith two-photon excitation.
Next, we investigated the performance of REX-GECO1 indissociated rat hippocampal neurons. REX-GECO1 has a Kd of240 nM, making it suitable for detection of neuronal Ca2þ
oscillations (typically from B50 to 250 nM)25. In this context,neurons expressing REX-GECO1 gave more than twofold ratiochanges for spontaneous Ca2þ changes using the same one-photon imaging conditions used for HeLa cells (SupplementaryFig. 4g,h).
To compare the performance of REX-GECO1 with the currentRFP-based Ca2þ indicators, we expressed REX-GECO1,RCaMP1h9 and R-GECO1 (ref. 11) in neurons in organotypichippocampal brain slices by ex vivo electroporation. After 3–6days, transfected neurons were imaged following field stimulationusing an extracellular electrode. Peak DF/F0 was extracted fromfluorescence signals of individual neurons and the averageresponse to each field stimulus was plotted for each indicator(Fig. 3d). REX-GECO1 showed detectable fluorescence response(3±1%) following a minimum of three field stimuli and reachinga maximum response of 291±27% following 150 field stimuli.RCaMP1h started to show fluorescence response following aminimum of five field stimuli and reached a maximumresponse of 128±12% following 150 stimuli. R-GECO1 showedfluorescence response to single-field stimulation (4±1%) andreached a maximum response of 656±25% following 150 fieldstimuli.
We further tested the performance of REX-GECO1 inhippocampal neurons and glial cells in rat organotypic hippo-campal slices using two different plasmids with differentpromoters (Fig. 3a,f). Human synapsin I promoter was used forpreferential expression of REX-GECO1 in neurons26,27
(Supplementary Fig. 5a). A cytomegalovirus (CMV) promoterwas used to drive preferential expression of REX-GECO1 in glialcells28 (Supplementary Fig. 5b). Hippocampal slices weretransiently transfected by ex vivo electroporation, and werecultured for 8–12 days (5–7 days post transfection). Expression ofREX-GECO1 in the cytoplasm of neural cells led to visualizationof both the cell bodies and processes (Figs 3a,f and 4a;Supplementary Movies 1,2 and 3). Transfected cells werehealthy on the basis of their morphology (SupplementaryFig. 5) and responsive as they showed expected pharmaco-logically induced Ca2þ rises. During imaging, we did notice a few
intracellular puncta in the cell bodies of some neurons and glialcells, but this did not affect the health or response of those cells.
When expressed in neurons, REX-GECO1 exhibited brightbaseline fluorescence when excited by a 543 nm laser. For imagingof dynamic Ca2þ oscillations, we switched to a 488 nm laser forexcitation and used theophylline (10 mM) to pharmacologicallyexcite neurons in organotypic brain slices. Theophylline,at low millimolar concentration, blocks both adenosine andGABAA receptors and has been shown to evoke sustainedrhythmic seizure-like activities in different neural networksincluding hippocampal neurons29–33. Indeed, on treatment withtheophylline, REX-GECO1 (under synapsin I promoter)successfully detected neuronal Ca2þ transients and oscillationswith large fluorescence intensity changes (cell bodies: 2.2±0.5-fold, n¼ 8 cells; cell processes: 4.9±0.6-fold, n¼ 9 cells)(Figs 3b,c and 4c,d; Supplementary Movie 1). We placed anextracellular electrode in close proximity to the cells being imagedto simultaneously record the local field potential (LFP) inresponse to theophylline treatment. Simultaneous recordings ofthe LFP and REX-GECO1 fluorescence showed that REX-GECO1was able to faithfully report neural activity in response totheophylline treatment (Fig. 3e). Under identical conditions,GCaMP6s7, one of the most highly optimized GFP-derivedCa2þ indicators, exhibits fluorescence changes in response totheophylline (cell bodies: 4.8±0.9-fold, n¼ 5 cells; cell processes:11±3-fold, n¼ 5 cells) that are approximately double that ofREX-GECO1 (Fig. 3b). Depolarization of REX-GECO1-expessingneurons with 30 mM KCl, which activates voltage-gated Ca2þ
channels to promote Ca2þ influx34,35, increased fluorescenceintensity by 12±3-fold (n¼ 8 cells).
Bath application of glutamate was used to evoke Ca2þ rises inhippocampal glial cells expressing REX-GECO1 (under the CMVpromoter). Activation of the glutamate receptors on glial cellsleads to an increase in intracellular Ca2þ levels mostly due to‘metabotropic’ release from endoplasmic reticulum36–38. ThisCa2þ increase has been described as oscillatory waves of elevatedintracellular Ca2þ concentration spreading across glial cells39,40,including those of the rat hippocampus41. REX-GECO1successfully detected Ca2þ rises in both glial cell bodies (2±1-fold, n¼ 4 cells) and their processes (3.7±0.9-fold, n¼ 10 cells)with sufficient spatial and temporal resolution to allow us tovisualize Ca2þ waves across the cells as described previously(Fig. 3f,g; Supplementary Movie 2). Overall, REX-GECO1 showedrobust responses to the activities of neural cells.
REX-GECO1 for dual-colour imaging in rat organotypic slice.We next investigated the utility of REX-GECO1 in multicolourimaging together with a second genetically encoded indicator. AsREX-GECO1 has a Ca2þ -dependent excitation peak at 480 nm,we reasoned that it could also be used as an intensiometric redCa2þ indicator with a large Stokes shift, and thereby combinedwith an intensiometric green indicator for multicolour imagingusing a single excitation wavelength. To demonstrate this, we setout to image both Ca2þ and glutamate responses in organotypicrat hippocampal slice cultures. We reasoned that because pyr-amidal hippocampal neurons are glutamatergic42, one would beable to simultaneously detect Ca2þ transients and glutamaterelease when they are excited. We co-expressed REX-GECO1 inthe cytosol and a green glutamate indicator, iGluSnFR43, on theplasma membrane of neurons using a synapsin I promoter forboth indicators (Fig. 4a,b) and used theophylline to induceseizure-like activity in hippocampal neurons as described above.Using one-photon excitation at 488 nm, we successfully recordedsimultaneous glutamate release (green channel) and Ca2þ
transients (red channel). REX-GECO1 revealed Ca2þ rises in
ARTICLE NATURE COMMUNICATIONS | DOI: 10.1038/ncomms6262
4 NATURE COMMUNICATIONS | 5:5262 | DOI: 10.1038/ncomms6262 | www.nature.com/naturecommunications
& 2014 Macmillan Publishers Limited. All rights reserved.

both the cell bodies and processes (Fig. 4c,d; SupplementaryMovie 3) of hippocampal neurons with large signal magnitude(cell bodies: 2.2±0.5-fold, n¼ 7 cells; cell processes: 4.9±0.6-fold, n¼ 7 cells). In neurons that were only transfected withREX-GECO1 but not iGluSnFR, we did not observe any crosstalkfrom REX-GECO1 into the green channel (Supplementary Fig. 6).A short lasting (B0.5 s) increase in glutamate (SupplementaryMovie 4), as released from surrounding neurons44, was followed
by a longer (B10–20 s) Ca2þ rise in neurons expressing bothREX-GECO1 and iGluSnFR, indicating that the Ca2þ influxwas induced by glutamate. Similar results were obtained usingtwo-photon excitation at 940 nm for both REX-GECO1 andiGluSnFR (Fig. 5; Supplementary Movie 5). Overall, these resultsdemonstrate that REX-GECO1 can be combined with GFP-basedindicators to create new opportunities for simultaneousmulticolour one- and two-photon imaging.
KClGCaMP6sREX-GECO1
Cell bodies Cell processes
12
9
6
3
0
100 s
50 s
RCaMP1hR-GECO1REX-GECO1
1 3 5 10 20 50 100 150
Field stimuli
0
1
2
3
7
60 s
REX-GECO1
LFP
50 s
ΔF/F
0
ΔF/F
0
500%
ΔF/F
min
200%
ΔF/F
min
200
mV
100%
ΔF/F
0
200%
ΔF/F
min
Figure 3 | Confocal imaging of REX-GECO1 in neurons and glial cells in organotypic brain slices. (a) An average intensity projection of a 3D Z-stack of
images acquired for an organotypic rat hippocampal brain slice in which neurons are expressing REX-GECO1 under the synapsin I promoter. Scale bar
represents 30 mm. (b) Comparison of REX-GECO1 and GCaMP6s in organotypic hippocampal brain slices. Response shown owing to theophylline excitation
of brain slices transfected with REX-GECO1 or GCaMP6s (cell bodies: 2.2±0.5 and 4.8±0.9-fold, respectively, Po0.001; cell processes: 4.9±0.6 and
11±3-fold, respectively, Po0.001). Data are mean fluorescence change (DF/F0)±s.d. (c) Fluorescence versus time traces for single cells as indicated in
(a) on treatment with 10 mM theophylline, followed by 30 mM KCl. The trace colour corresponds to regions marked in (a). Inset: Zoom in on theophylline-
induced fluorescence oscillations as marked by black borderline. (d) Characterization of REX-GECO1 (n¼8 cells), R-GECO1 (n¼ 7 cells), and RCaMP
(n¼ 7 cells) in cultured organotypic hippocampal slices. Data points are mean fluorescence change (DF/F0)±s.d. in response to 100 Hz field stimulation
induced action potential trains. (e) Simultaneous recording of both REX-GECO1 fluorescence change (DF/F0) (red) and the local field potential (LFP)
(black) in response to theophylline treatment in rat organotypic hippocampal brain slice. (f) An average intensity projection of a 3D Z-stack of glial cells
expressing REX-GECO1 under CMV promoter in an organotypic rat hippocampal slice. Scale bar represents 30mm. (g) Glutamate-induced Ca2þ
oscillations in glial cell bodies and processes as indicated in (f). Colours of the traces correspond to the colors of the regions marked in (f).
NATURE COMMUNICATIONS | DOI: 10.1038/ncomms6262 ARTICLE
NATURE COMMUNICATIONS | 5:5262 | DOI: 10.1038/ncomms6262 | www.nature.com/naturecommunications 5
& 2014 Macmillan Publishers Limited. All rights reserved.

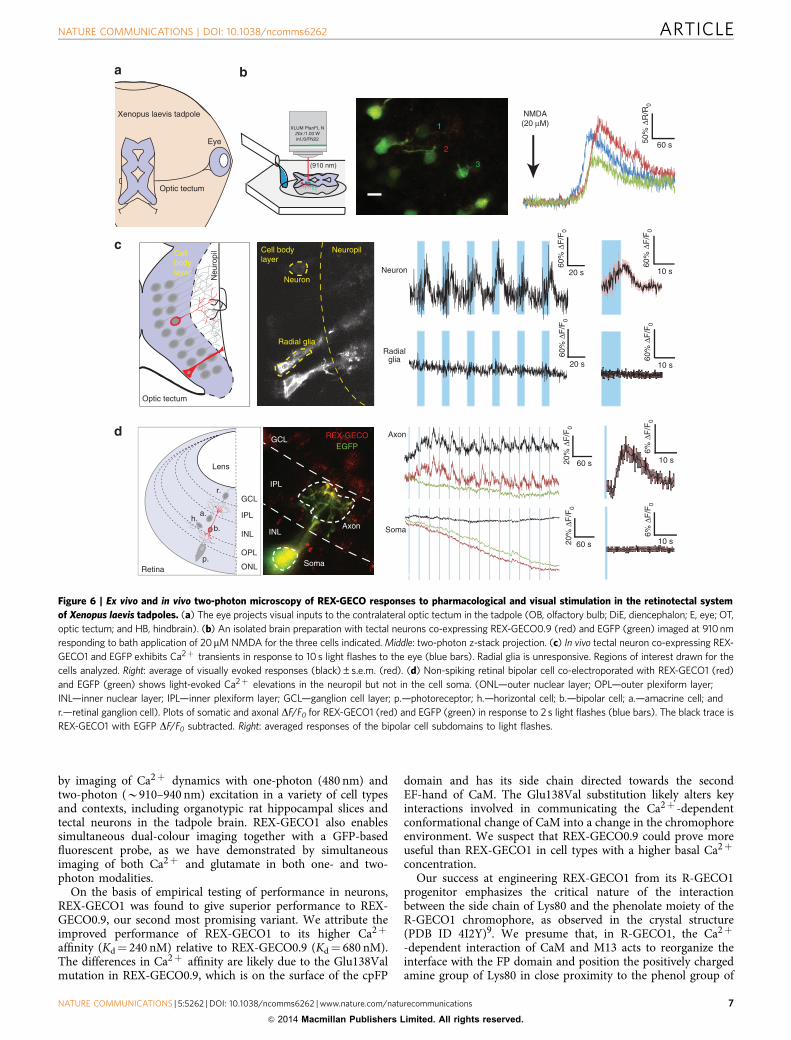
REX-GECO1 for in vivo imaging. One of the most powerfulapplications of genetically encoded Ca2þ indicators is minimallyinvasive monitoring of neuronal activity in vivo. We used DNAelectroporation to drive expression of REX-GECO under theCMV promoter, co-expressed with EGFP, in the eye and optictectum of albino Xenopus laevis tadpoles (Fig. 6a). Animals wereimaged by two-photon microscopy at least 2 days after electro-poration to allow sufficient protein expression. We first used anex vivo isolated brain preparation to the monitor Ca2þ elevationin optic tectal neurons co-expressing REX-GECO0.9 and EGFP inresponse to pharmacological activation of NMDA (N-methyl-D-aspartate) type ionotropic glutamate receptors (Fig. 6b). Bathapplication of 20mM NMDA resulted in a robust increase in theratio of red to green fluorescence in these cells (2.2±0.4-fold,n¼ 6 cells). We next tested whether REX-GECO1 could be usedto detect neuronal responses to more physiological stimuli,by presenting brief pulses of light to activate neurons in thevisual system of the intact animal. Neurons in the optic tectum,the primary visual area in the tadpole brain, are readilydistinguishable from radial glial cells on the basis oftheir position and morphology. Figure 6c shows an example ofREX-GECO1 fluorescence changes in the cell body of a tectalneuron in response to 10-s light flashes presented to the con-tralateral eye (max DF/F0 of mean response¼ 71%). As expected,
the neighbouring radial glia cell showed no light-evoked responseabove noise for this experiment, despite higher levels ofexpression. In the retina, light modulates glutamate release fromphotoreceptors onto bipolar cells, driving a change in theirmembrane potential. Unlike tectal neurons, bipolar cells do notfire action potentials, but instead rely on voltage-dependent Ca2þ
influx at their axon terminals to continuously modulate neuro-transmitter release. Consequently, 1-s light flashes evoked smallbut consistent increases in REX-GECO1 fluorescence in the axonterminals (max DF/F0 of mean response¼ 10.3%) but not at thebipolar cell soma (max DF/F0 of mean signal¼ 0.7%) (Fig. 6d).EGFP fluorescence did not respond to visual stimulation, makingit useful for correcting for gradual specimen drift that can be acommon problem when imaging in the intact animal. Theseresults demonstrate that REX-GECO1 can be used to detectphysiological subcellular Ca2þ changes in neurons in vivo.
DiscussionBy utilizing rational design and directed evolution, we havedeveloped a red fluorescent Ca2þ indicator, REX-GECO1, within vitro intensiometric changes of 35-fold (480 nm excitation) andratiometric changes of 100-fold (585 nm excitation/480 nmexcitation). We have demonstrated the versatility of REX-GECO1
100 s
100 s 25%
ΔF/F
min
25%
ΔF/F
min
300%
ΔF/F
min
300%
ΔF/F
min
Figure 4 | One-photon confocal dual-color imaging of REX-GECO1 co-expressed with a green glutamate indicator (iGluSnFR) in organotypic rat
hippocampal slices. (a) An average intensity projection of a 3D Z-stack of neurons expressing REX-GECO1 under synapsin I promoter in a hippocampal
slice, Scale bar represents 30 mm. (b) An average intensity projection of a 3D Z-stack of the neurons in (a) expressing iGluSnFR under synapsin I promoter
in a hippocampal slice, Scale bar represents 30 mm. (c,d) Simultaneous imaging of theophylline-induced Ca2þ oscillations and glutamate transients in
(c) neuron cell bodies and (d) neuron processes as highlighted in (a) and (b). Colours of the traces correspond to the colours of the highlighted regions.
The glutamate signal is shown in green in both graphs.
100 s100%
ΔF/F
min
Figure 5 | Two-photon dual-color imaging of neurons co-expressing REX-GECO1 and iGluSnFR in organotypic rat hippocampal brain slices.
(a) A neuron expressing cytoplasmic REX-GECO1 under synapsin I promoter in a hippocampal slice (emission 605–680 nm), Scale bar represents 20 mm.
(b) The same neuron as in (a) co-expressing iGluSnFR on the plasma membrane (emission 460–500 nm). (c) Theophylline-induced Ca2þ (red) and
glutamate (green) transients and oscillations in the neuron in (a) and (b) excited at 940 nm.
ARTICLE NATURE COMMUNICATIONS | DOI: 10.1038/ncomms6262
6 NATURE COMMUNICATIONS | 5:5262 | DOI: 10.1038/ncomms6262 | www.nature.com/naturecommunications
& 2014 Macmillan Publishers Limited. All rights reserved.
by imaging of Ca2þ dynamics with one-photon (480 nm) andtwo-photon (B910–940 nm) excitation in a variety of cell typesand contexts, including organotypic rat hippocampal slices andtectal neurons in the tadpole brain. REX-GECO1 also enablessimultaneous dual-colour imaging together with a GFP-basedfluorescent probe, as we have demonstrated by simultaneousimaging of both Ca2þ and glutamate in both one- and two-photon modalities.
On the basis of empirical testing of performance in neurons,REX-GECO1 was found to give superior performance to REX-GECO0.9, our second most promising variant. We attribute theimproved performance of REX-GECO1 to its higher Ca2þ
affinity (Kd¼ 240 nM) relative to REX-GECO0.9 (Kd¼ 680 nM).The differences in Ca2þ affinity are likely due to the Glu138Valmutation in REX-GECO0.9, which is on the surface of the cpFP
domain and has its side chain directed towards the secondEF-hand of CaM. The Glu138Val substitution likely alters keyinteractions involved in communicating the Ca2þ -dependentconformational change of CaM into a change in the chromophoreenvironment. We suspect that REX-GECO0.9 could prove moreuseful than REX-GECO1 in cell types with a higher basal Ca2þ
concentration.Our success at engineering REX-GECO1 from its R-GECO1
progenitor emphasizes the critical nature of the interactionbetween the side chain of Lys80 and the phenolate moiety of theR-GECO1 chromophore, as observed in the crystal structure(PDB ID 4I2Y)9. We presume that, in R-GECO1, the Ca2þ
-dependent interaction of CaM and M13 acts to reorganize theinterface with the FP domain and position the positively chargedamine group of Lys80 in close proximity to the phenol group of
p.
b.h.
a.
r.GCL
INL
OPL
ONLRetina
IPL
Lens
Eye
Optic tectum
Xenopus laevis tadpole
NeuropilCell bodylayer
Neuron
Radial glia
Neuron
Radialglia
60%
ΔF
/F0
20 s
Axon
Soma
20%
ΔF
/F0
60 s
60%
ΔF
/F0
10 s
6% Δ
F/F
0
10 s
Optic tectum
XLUM PlanFL N20x /1.00 Winf./0/FN22
(910 nm)
1
2
3
NMDA(20 μM)
60%
ΔF
/F0
20 s
INL
IPL
GCL
Axon
Soma
Neu
ropi
lCellbodylayer
20%
ΔF
/F0
60 s
6% Δ
F/F
0
10 s
60%
ΔF
/F0
10 s
60 s50%
ΔR
/R0
EGFPREX-GECO
Figure 6 | Ex vivo and in vivo two-photon microscopy of REX-GECO responses to pharmacological and visual stimulation in the retinotectal system
of Xenopus laevis tadpoles. (a) The eye projects visual inputs to the contralateral optic tectum in the tadpole (OB, olfactory bulb; DiE, diencephalon; E, eye; OT,
optic tectum; and HB, hindbrain). (b) An isolated brain preparation with tectal neurons co-expressing REX-GECO0.9 (red) and EGFP (green) imaged at 910 nm
responding to bath application of 20mM NMDA for the three cells indicated. Middle: two-photon z-stack projection. (c) In vivo tectal neuron co-expressing REX-
GECO1 and EGFP exhibits Ca2þ transients in response to 10 s light flashes to the eye (blue bars). Radial glia is unresponsive. Regions of interest drawn for the
cells analyzed. Right: average of visually evoked responses (black)±s.e.m. (red). (d) Non-spiking retinal bipolar cell co-electroporated with REX-GECO1 (red)
and EGFP (green) shows light-evoked Ca2þ elevations in the neuropil but not in the cell soma. (ONL—outer nuclear layer; OPL—outer plexiform layer;
INL—inner nuclear layer; IPL—inner plexiform layer; GCL—ganglion cell layer; p.—photoreceptor; h.—horizontal cell; b.—bipolar cell; a.—amacrine cell; and
r.—retinal ganglion cell). Plots of somatic and axonal DF/F0 for REX-GECO1 (red) and EGFP (green) in response to 2 s light flashes (blue bars). The black trace is
REX-GECO1 with EGFP DF/F0 subtracted. Right: averaged responses of the bipolar cell subdomains to light flashes.
NATURE COMMUNICATIONS | DOI: 10.1038/ncomms6262 ARTICLE
NATURE COMMUNICATIONS | 5:5262 | DOI: 10.1038/ncomms6262 | www.nature.com/naturecommunications 7
& 2014 Macmillan Publishers Limited. All rights reserved.

the chromophore. The electrostatic interaction serves to decreasethe pKa of the chromophore, thereby increasing the proportionof the protein in the bright fluorescent phenolate form11. In theabsence of Ca2þ , the conformation of the Lys80 side chain ispresumably less restrained and it is directed away from thechromophore and towards the bulk solvent. This mechanism issimilar to that proposed for GCaMP, in which the protonationstate of the chromophore is modulated by interaction withArg377 of CaM6.
As described in this work, the dramatically modified spectralcharacteristics bestowed on the protein by the Lys80Glusubstitution are the defining feature of the REX-GECO series ofvariants. By analogy with the mechanism of R-GECO1, Ca2þ
binding to REX-GECO1 leads to a positioning of the negativelycharged carboxylate moiety close to the phenol group of thechromophore. As the pKa of the carboxylate is lower than that ofthe chromophore, this interaction is expected to stabilize theneutral phenol. On excitation, the pKa of the chromophore dropsbelow that of the carboxylate and ESPT produces the carboxylicacid and the red fluorescent phenolate form of the chromophore.In the Ca2þ -free state, REX-GECO1 exists as a mixture of boththe phenol and phenolate forms of the chromophore. Althoughthe phenolate form does produce red fluorescence if excited, thephenol form is incapable of ESPT and therefore non-fluorescent(Fig. 2b). This result is consistent with our proposed mechanism,and indicates that, just like with Lys80 of R-GECO1, the sidechain of Glu80 is directed away from the chromophore andexposed to the bulk solvent in the absence of Ca2þ . Notably, theself-contained fluorescence modulation mechanisms of R-GECO1and REX-GECO1 (that is, not dependent on specific interactionswith CaM, as is the case for GCaMP) make the cpFP domains ofthese proteins particularly promising templates for combinationwith other sensing domains to engineer new types of geneticallyencoded reporters.
Most GCaMP-type indicators, and all of the red fluorescentones reported to date, respond to Ca2þ with an intensiometricresponse. However, for many applications it is desirable to have aratiometric response where an increase in intensity at onewavelength is associated with a decrease at another. Indeed, aratiometric response is inherent to all Forster resonance energytransfer-based Ca2þ indicators with a fluorescent acceptor3,45,and excitation and emission ratiometric green fluorescentGCaMP-type indicators have been reported4,11. As we havedemonstrated in this work, REX-GECO1 responds to Ca2þ withan excitation ratiometric response. However, we did find that thebroad excitation peak associated with the Ca2þ -bound state,together with the very short 3 nm wavelength difference betweenthe excitation maximum for the Ca2þ -free state and the emissionmaximum for the Ca2þ -bound state, introduce some technicalchallenges for ratiometric imaging. To achieve satisfactoryratiometric imaging, we resorted to using a relatively longwavelength Cy5 filter set (excitation at 620/60 nm with emissionat 700/75 nm) for the Ca2þ -free state. Although this filter set isnot an optimal match for the Ca2þ -free REX-GECO1 spectralprofile, it did minimize excitation of the Ca2þ -bound state of thechromophore while still providing sufficient fluorescenceintensity. An additional benefit of the ratiometric fluorescenceresponse of REX-GECO1 is that it facilitates the identification oftransfected cells in their resting state. When imaging sparselytransfected organotypic slice cultures, we found that REX-GECO1exhibits dim baseline fluorescence with 488-nm laser excitationbut bright red fluorescence with 543-nm laser excitation.Although we observed a transient change of absorbance in bothpurified REX-GECO0.9 and REX-GECO1 proteins on strong(1,200 mW cm� 2) violet-light illumination (SupplementaryFig. 3i-l), this photoactivation phenomenon is unlikely to occur
under typical imaging conditions. In our fluorescence imaging ofREX-GECO, we have not observed any artifactual differences influorescent intensity between the first and subsequent acquiredimages, as would be expected if the initial illumination wasinducing photoconversion.
The availability of REX-GECO1 provides new possibilities forone- and two-photon Ca2þ imaging using genetically encodedindicators with high sensitivity. We expect that REX-GECO1 willhave broad appeal as the preferred Ca2þ indicator for use incombination with any of the plethora of GFP-based probes andindicators currently available.
MethodsEngineering and screening of REX-GECO. For the engineering of REX-GECO,R-GECO1 in pTorPE11 was used as a template. Point mutations to R-GECO1were performed using QuikChange II Site-Directed Mutagenesis Kit (AgilentTechnologies). Random mutagenesis was generated by error-prone polymerasechain reaction (PCR) amplification. In the first generation library, the codon forresidue 64 was mutated to BMM (where B¼ guanine and cytosine and thymineand M¼ adenine and cytosine; encoding Ala, Asp, Gln, Glu, His, Pro, Ser and Tyr),the codon for residue 80 was mutated to VAN (where V¼ guanine and adenineand cytosine and A¼ adenine and N¼ guanine and adenine and thymine andcytosine; encoding Asn, Asp, Gln, Glu, His, and Lys) and the codon for residue 116was mutated to VHM (where H¼ adenine and thymine and cytosine; encodingAla, Asn, Asp, Gln, Glu, His, Ile, Leu, Lys, Met, Pro, Thr, and Val).
For REX-GECO variants screening, the imaging system used has been describedin detail46. PTorPE plasmids containing REX-GECO variants were electroporatedinto E. coli strain DH10B (Invitrogen). These E. coli were then cultured on 10-cmLysogeny broth (LB)-agar Petri dishes supplemented with 400 mg ml� 1 ampicillin(Sigma) and 0.0004% (wt/vol) L-arabinose (Alfa Aesar) at 37 �C overnight. Duringscreening, a 609/57 nm emission filter was used to capture the fluorescenceemission. Two images, image A and image B, were captured by using excitationfilter of 438/24 nm or 542/27 nm to illuminate E. coli colonies expressing REX-GECO variants on Petri dishes. These two images were then multiplied to generatea third image C. Colonies that showed the highest 0.1% emission intensities inimage C were picked and cultured in 4 ml liquid LB with 100 mg ml� 1 ampicillinand 0.0016% (wt/vol) L-arabinose at 37 �C overnight. Proteins were then extractedfrom the liquid LB culture and subjected to a secondary screen by using a Safire2fluorescence microplate reader (Tecan).
Characterization of REX-GECO1. REX-GECO1 proteins were purified aspreviously described11. To measure the fluorescence and absorbance spectraof REX-GECO, a QuantaMaster spectrofluorometer (Photon TechnologyInternational), and a DU-800 UV-visible spectrophotometer (Beckman) were used,respectively. REX-GECO1’s extinction coefficient (e), quantum yield (F), pKa andKd were determined as previously described11 with mCherry and LSS-mKate2serving as standards. A SX20 stopped-flow spectrometer (Applied Photophysics)was used to measure koff. Briefly, Protein samples with 10 mM CaCl2 (in 10 mMMOPS, 100 mM KCl pH 7.2) were rapidly mixed with a solution with 10 mMEGTA (in 10 mM MOPS, 100 mM KCl pH 7.2) at room temperature.The koff was determined by fitting the fluorescence decay curve to a singleexponential equation. Each protein sample was measured five times, and theaveraged value was taken as koff. For characterization of photoactivation ofREX-GECOs, purified proteins were diluted to an absorbance value in the rangeof 0.1–0.5 in a buffered solution. Spectra were recorded using a UV–visiblespectrometer (Agilent 8453 spectrophotometer) with or without illumination froma 150 mW (1,200 mW cm� 2) 405 nm laser (Changchun New IndustriesOptoelectronics Tech.).
Two-photon absorption spectra were measured using fluorescence femtosecondsetup, described previously21. Briefly, it comprises a tunable parametric amplifier(550–2,000 nm) producing B100 fs pulses with 1 kHz repetition rate. Rhodamine Bin methanol was used as a reference standard47 for both the spectral shape andabsolute cross section evaluations. The cross-sections were measured at 900, 1,000and 1,130 nm. The quadratic power dependence of fluorescence signal was checkedat several wavelengths across the spectrum. The concentration of proteins withmatured chromophore was evaluated spectrophotometrically by using theextinction coefficients measured by alkaline denaturation method (see above) andpresented in Supplementary Table 2. Note that Supplementary Fig. 3 presents theeffective two-photon cross-section weighted with the relative fractions of neutral(protonated), n(n), and anionic (deprotonated), n(a), forms: s2(l)¼ n(n)
s2(n)(l)þ n(a) s2
(a)(l), where s2(n)(l) and s2
(a)(l) are the molecular two-photonabsorption cross-sections of the neutral and anionic forms, respectively, andn(n)þ n(a)¼ 1.
Plasmids for mammalian cell imaging. For REX-GECO1 plasmid with a CMVpromoter, template (REX-GECO1 in pTorPE11) was cloned into a modifiedpcDNA3 plasmid by PCR as previously described10. This vector was used in one-
ARTICLE NATURE COMMUNICATIONS | DOI: 10.1038/ncomms6262
8 NATURE COMMUNICATIONS | 5:5262 | DOI: 10.1038/ncomms6262 | www.nature.com/naturecommunications
& 2014 Macmillan Publishers Limited. All rights reserved.

photon, two-photon imaging of HeLa cells and one-photon imaging of dissociatedrat hippocampal neurons. For REX-GECO1 plasmid with a human synapsin Ipromoter, template (REX-GECO1 in pTorPE) was cloned into an AAV2 plasmidflanked by restriction sites BamH1 and HindIII by PCR using following primers:BamH1_fw (50-GAGGATCCACCATGGTCGACTCATCACGTC-30) andHindIII_rv (50-GCGATGAAGCTTCTACTTCGCTGTCATCATTTGTACAAACTCTTCGTAGTTT-30). For iGluSnFR plasmid with a human synapsin Ipromoter, iGluSnFR (Addgene plasmid 41732) was used as a template and clonedinto an AAV2 plasmid flanked by restriction sites BamH1 and HindIII by PCRusing following primers: BamH1_iGlu_fw (50-CGAGGATCCGCCACCATGGAGACAG ACACACTCCTGCTATGGGTAC-30) and HindIII_iGlu_rv (50-CCCTTATCATCCTCATCA TGCTTTGGCAGAAGAAGCCACGTTAGAAGCTTCGATCC-30). For GCaMP6s R-GECO1 and RCaMP1h plasmid (with a humansynapsin I promoter) used in comparison with REX-GECO1 in rat hippocampalorganotypic brain slices, GCaMP6s (Addgene plasmid 40753), R-GECO1 andRCaMP1h (Addgene plasmid 42874) were used as a template and cloned into thesame AAV2 plasmid, respectively.
Cell culture. HeLa cells (CCL2 line; ATCC) were cultured on collagen-coated35-mm glass bottom dishes (Matsunami) until they reached 40–60% confluency.Transfection was performed by incubating HeLa cells with the mixture of 1 mg ofplasmid DNA and 3 ml of Lipofectamine 2000 (Life Technologies) for 2 h. Afterincubation, the medium was exchanged to DMEM (supplemented with 10% fetalbovine serum (FBS; Sigma), 2 mM GlutaMax (Invitrogen) and penicillin-strepto-mycin) and the cells were incubated for 48 h at 37 �C in a CO2 incubator. Beforeimaging, culture medium was changed to HEPES (25 mM) buffered Hanks’balanced salt solution (HBSS).
Dissociated E18 Sprague Dawley Hippocampal Cells in Hibernate EB CompleteMedia were purchased from BrainBits LLC. The cells were grown on (In VitroScientific) 35 mm glass bottom dish containing NbActiv4 (BrainBits LLC)supplemented with 2% FBS, penicillin-G potassium salt (50 units ml� 1), andstreptomycin sulfate (50mg ml� 1). Half of the culture media is replaced every4–5 days. Neuronal cells were transfected on day 7 with plasmids containingconstructs of interest using Lipofectamine 2000.
Transfection of rat hippocampal organotypic brain slices. Horizontal brainslices (250 mm thickness) from a 0-day-old (P0) Sprague Dawley rat were generatedin ice-cold HBSS containing 1.3 mM CaCl2 and 1 mM MgSO4 with a vibratingmicrotome (Leica VT1000S, Leica Microsystems, Richmond Hill, ON, Canada) asdescribed previously30. All procedures were carried out in compliance with theguidelines of the Canadian Council for Animal Care and with the approval of theUniversity of Alberta Animal Care and Use Committee for Health Science.Hippocampal regions were cut from horizontal brain slices and placed on a sterile0.4-mm-pore-membrane cell culture insert (Millipore PICMORG50). The insertand slice were then placed in a Petri dish containing 1.5 ml of NbActiv4 (BrainBits)supplemented with 5% FBS, penicillin-G potassium salt (50 units ml� 1), andstreptomycin sulfate (50mg ml� 1). Slices are cultured at 37 �C and 5% CO2 for 24 hbefore transfection by electroporation. The insert and slice are then placed directlyabove a Platinum Plate Petri dish electrode (CUY700-P2E, Nepa Gene, Japan) andthe gap between the electrode and the membrane is filled with electroporationbuffer (EB) (HBSS with 1.5 mM MgCl2 and 10 mM D-glucose). Plasmids(pcDNA3.1, Life Technologies and AAV2 plasmid) for expression of the gene ofinterest are dissolved in EB at a concentration of 1 mg ml� 1 and sufficient volume isadded to just cover the slice. A square platinum electrode (CUY700-P2L, NepaGene, Japan) is then placed directly above the hippocampus slice and a powersupply is used to apply five 20 V pulses (5 ms each, 1 Hz). The direction of electricalfield is reversed and a second set of five pulses with the same settings is applied.The EB is carefully replaced with supplemented NbActiv4 and slices are returned toincubator at 37 �C with 5% CO2.
Microscopes for fluorescence imaging. Widefield imaging was performed on aninverted Nikon Eclipse Ti microscope equipped with a 200 W metal halide lamp(PRIOR Lumen), � 20 and � 40 objectives (Nikon), and a 16-bit QuantEM 512SCelectron-multiplying charge-coupled device (CCD) camera (Photometrics). A filterset of 472/30 nm (excitation), 622/18 nm (emission) and 495 nm (dichroic) wasused for long Stokes shift excitation. Another filter set of 620/600 nm (excitation),700/75 nm (emission) and 666 nm (dichroic) was used for short Stokes shiftexcitation. For time-lapse imaging, HeLa cells were treated with 5 mM (final con-centration) histamine, 4 mM EGTA (with 5 mM ionomycin) and 10 mM CaCl2(with 5 mM ionomycin) in chronological order. Regions of interest (ROIs) corre-sponding to visually identifiable and healthy cells (based on their morphology)were selected for analysis.
For one-photon imaging, we used an upright FV1000 confocal microscope(OlympusCanada, Markham, ON, Canada) equipped with software(FluoView1000, Olympus Canada), a � 20 XLUMPlanF1 water immersionobjective (numerical aperture (NA)¼ 1.00), or a � 60 XLUMPlanF1 waterimmersion objective (NA¼ 0.90), and connected to multi-line argon lasers(457, 488 and 515 nm) and HeNe lasers (543 and 633 nm) (Olympus Canada). Fortwo-photon imaging, we used a similar confocal system connected to a MaiTai
DeepSee Ti:sapphire laser with a tunable excitation range from 690–1,040 nm(Spectra Physics, Santa Clara, CA, USA). For measuring photostability ofREX-GECO1 with two-photon excitation, HeLa cells expressing REX-GECO1(treated with CaCl2 (10 mM) and ionomycin (5 mM)) were imaged by two-photonmicroscopy with a � 20 XLUMPlanF1 water immersion objective (NA¼ 1.00),and with excitation at 910 nm. Red fluorescent emission was acquired via a605–680 nm bandpass filter (Semrock Inc, Rochester, NY, USA) with a frameresolution of 256� 256 and a 10 ms per pixel scanning rate for 500 s. All imageswere processed and analyzed using ImageJ.
Imaging of rat organotypic hippocampal slices. The brain slice on the Milliporeinsert was placed in a custom-made chamber to hold it in place during imaging.Immediately before imaging, the slices were perfused with artificial cerebrospinalfluid (ACSF) containing: 120 mM NaCl, 3 mM KCl, 1 mM CaCl2, 2 mM MgSO4,26 mM NaHCO3, 1.25 mM NaH2PO4 and 10 mM D-glucose (pH adjusted to 7.4 bygassing with 95% O2, 5% CO2), at 5 ml� 1min using a peristaltic pump (Watson-Marlow Alitea-AB, Sin-Can, Calgary, AB, Canada) and kept at room temperature.Imaging was started within 10 min following activation of the perfusion system.
For single-colour one-photon imaging of REX-GECO1, the hippocampal slicewas excited with 488 nm laser and emission was collected from 550 nm to 650 nmusing a variable barrier filter. For single-colour one-photon imaging of Ca2þ usingR-GECO1 or RCaMP1h, the hippocampal slice was excited with 543 nm laser andemission was collected from 550 nm to 650 nm using a variable barrier filter. Fordual-colour imaging of Ca2þ using REX-GECO1 and glutamate using iGluSnFR,the slice was excited with 488 nm laser and emission was collected simultaneouslyin two channels from 500 to 520 nm for iGluSnFR and 590 to 690 nm for REX-GECO1 using variable barrier filters. In all cases, images were acquired at � 1–3digital zoom at a reduced frame resolution (256� 256) and with a 4 ms per pixelscanning rate. This allowed image acquisition to be 2–3 frame s- to detect Ca2þ
and glutamate oscillations in neurons (Figs 3a,c and 4) and glial cells (Fig. 3f,g).For one-photon imaging of theophylline-induced Ca2þ and/or glutamate rises
in neurons, images were acquired every 0.5 s. Approximately 30 s after the start ofthe experiment, the superfusate was changed from control ACSF to ACSFcontaining 10 mM theophylline (Sigma-Aldrich, directly dissolved in ACSF).Approximately 10 min later, the superfusate was changed back to control ACSF.For KCl-evoked depolarization, 10 ml of (2.5 M) KCl was added to raise theconcentration of KCl in the recording buffer to 30 mM instantaneously and thenleft to wash out at the regular rate of the perfusion system at 5 ml min� 1.
For one-photon imaging of glutamate-induced Ca2þ dynamics in glial cells,images were acquired every 0.5 s. Approximately 30 s after the start of theexperiment, the superfusate was changed from control ACSF to ACSFcontaining 100 mM glutamate (Sigma-Aldrich, 1 M stock in dH2O, diluted tofinal concentration in control ACSF) for 10 min and then switched back tocontrol ACSF.
For two-colour two-photon imaging of REX-GECO1 and iGluSnFR, the laserwavelength was set at 940 nm. Fluorescence emission was collected using twophotomultiplier tube detectors, one of which was equipped with a 460–500 nmbandpass filter, and the other equipped with a 605–680 nm bandpass filter(Semrock Inc, Rochester, NY, USA). Images were acquired every 0.25 s.
Field potential recording. LFP was recorded using a large-diameter patch pipette(outer tip diameter 5–15 mm, d.c. resistance 2–3 MO) micropipette pulled fromborosilicate glass capillaries. The micropipette was filled with ACSF solution andplaced B100 mm away from a REX-GECO1 transfected neuron. Electrode signalswere amplified (� 10 k) and bandpass filtered (0.3–1 kHz) (A-M systems, 1700,Carlsborg, WA, USA). Signals were then integrated (t: 15 ms) and digitally sampledat 1 kHz (Powerlab/8SP, ADInstruments, Colorado Springs, CO, USA), and storedon a computer using LabChart7 software (ADInstruments). REX-GECO1 fluor-escence (imaged at 2 Hz) was imaged simultaneously using the same imaging setupdescribed for imaging organotypic brain slices. Fluorescence images were processedand analyzed using ImageJ software.
Electrical field stimulation of organotypic brain slices. To stimulate hippo-campal neurons in organotypic brain slices, a borosilicate glass capillary electrode(outer tip diameter 30–40 mm) attached to an ISO-Flex pulse stimulator (A.M.P.I.)was placed B500 mm away from the transfected neurons. The electrode wasmanoeuvered using a ROE-200 micromanipulator (Sutter Instruments, Novato,CA, USA). Field stimulation pulses (4 V, 1 ms, 100 Hz) were delivered in trains of 1,3, 5, 10, 20, 50 and 150 pulses using Powerlab/8SP (ADInstruments) to control thepulse stimulator. Each field stimulation pattern was repeated twice. Fluorescencesignals (imaged at 2 Hz) induced by field electrode stimulation was recorded usingthe same imaging setup described for imaging organotypic brain slices. Fluores-cence images were processed and analyzed using ImageJ software.
In vivo experimental animals. Albino X. laevis tadpoles were bred by humanchorionic gonadotropin-induced mating. Embryos were reared at roomtemperature in 0.1� modified Barth’s saline with HEPES (MBSH). Tadpoleswere developmentally staged according to the standard criteria of Nieuwkoopand Faber48. Experiments were approved by the Montreal Neurological Institute
NATURE COMMUNICATIONS | DOI: 10.1038/ncomms6262 ARTICLE
NATURE COMMUNICATIONS | 5:5262 | DOI: 10.1038/ncomms6262 | www.nature.com/naturecommunications 9
& 2014 Macmillan Publishers Limited. All rights reserved.

Animal Care Committee in accordance with Canadian Council on AnimalCare guidelines.
In vivo electroporation. Cells in the retina and optic tectum were bulk electro-porated as described previously49. In brief, glass micropipettes made fromborosilicate capillaries pulled on a PC-10 puller (Narishige, Japan) were loadedwith DNA plasmid solution (0.5–5 mgml� 1) and attached to a custom-madepressure injection system. Plasmid solution was then pressure-injected in the eye orbrain ventricle and current was locally delivered across custom-made platinumplate electrodes placed on either side of the eye, or the tectum using three pulses(36 V, 1.6 ms) in each polarity using a constant voltage stimulator (Grass SD-9)with a 3 mF capacitor placed in parallel.
In vivo imaging of Xenopus tadpoles. Stage 40 tadpoles for retinal electroporationand stage 43 for tectal electroporation were transfected with plasmids encodingREX-GECO1 mixed with EGFP-encoding plasmid, and given at least 48 h toexpress the protein. Stage 45–47 tadpoles were immobilized by bath application ofpancuronium bromide (2 mM, Sigma) and placed in a custom-madeimaging chamber, embedded in 1% low-melting point agarose, and then immersedin modified Barth s saline with HEPES (MBSH) solution for tectal cell imaging andwith ACSF external solution for retinal imaging. The ACSF solution contains115 mM NaCl, 2 mM KCl, 5 mM HEPES, 3 mM CaCl2, 1.5 mM MgCl2, 10 mM D-glucose, 5 mM glycine; 250 mOsm; pH 7.2. In vivo two-photon images of tectal cellsor retinal cells were acquired at 2 and 5 Hz, respectively, using a Thorlabs multi-photon microscope with resonant scanner and Olympus � 20 1.0 NA immersionobjective, A MaiTai-BB Ti:sapphire femtosecond pulsed laser set to excite at910 nm was used for fluorescence excitation. Green (500–550 nm) and red(584–676 nm) emission filters were used for fluorescence detection. For visualstimulation, an A310 Accupulser (WPI) was used to drive a blue LED (447.5 nm,royal-blue Luxeon Star) to present trains of light flashes.
Ex vivo imaging of tadpole brains. Stage 45–47 tadpoles were anesthetised byimmersion in 0.02% MS-222 and the brain was dissected and perfused withMg-free external solution containing 115 mM NaCl, 2 mM KCl, 5 mM HEPES,3 mM CaCl2, 10 mM D-glucose, 10mM glycine; 250 mOsm; pH 7.2. Imaging wascarried out at 910 nm using an Olympus FV300 confocal microscope converted formultiphoton use, with a � 40 1.0 NA immersion objective. For pharmacologicalactivation of N-methyl-D-aspartate receptors (NMDARs), 20 mM NMDA wasapplied to the bath. To visualize fluorescence intensity changes, images of thetectum were acquired at 2 Hz simultaneously on green (500–550 nm) and red(593–668 nm) channels. At the end of each experiment, z-series stacks at 1 mminteval were collected to obtain full three-dimensional cellular morphologies.
Fluorescence intensity change analysis. Ellipsoid ROIs were selected manuallyaround visually identifiable somata, or complex ROIs were drawn around axons ordendrites and the mean intensity of the ROIs in both the green and the red channelwas determined for each frame from the time series using ImageJ (NIH). Thebackground intensity was measured by calculating the mean intensity of a largeROI in an area without any fluorescent structures. For each frame, the backgroundintensity was subtracted from the intensity of the ROI of the cell compartmentof interest. For the in vivo visual stimulation, F0 was calculated as an average ofthe (ROI intensity� background intensity) for the initial 25 frames baselineperiod before the beginning of the light flashes. The change in fluorescence wasmeasured as DF/F0, where DF¼ F(t)� F0. For the ex vivo pharmacologicalpreparation for each time point the following ratio (R) was calculated:R ¼ ðROI� backgroundÞred=ðROI� backgroundÞgreen . R0 was calculated as anaverage of R during the initial 37 s baseline before application of drug. The changeof fluorescence intensity was measured as DR/R0, where DR¼R(t)–R0.
Statistics. Two-tailed Student’s t-tests were used to determine significance.
References1. Kotlikoff, M. I. Genetically encoded Ca2þ indicators: using genetics and
molecular design to understand complex physiology. J. Physiol. 578, 55–67(2007).
2. Grienberger, C. & Konnerth, A. Imaging calcium in neurons. Neuron 73,862–885 (2012).
3. Miyawaki, A. et al. Fluorescent indicators for Ca2þ based on green fluorescentproteins and calmodulin. Nature 388, 882–887 (1997).
4. Nagai, T., Sawano, A., Park, E. S. & Miyawaki, A. Circularly permuted greenfluorescent proteins engineered to sense Ca2þ . Proc. Natl. Acad. Sci. USA 98,3197–3202 (2001).
5. Nakai, J., Ohkura, M. & Imoto, K. A high signal-to-noise Ca2þ probecomposed of a single green fluorescent protein. Nat. Biotechnol. 19, 137–141(2001).
6. Wang, Q., Shui, B., Kotlikoff, M. I. & Sondermann, H. Structural basis forcalcium sensing by GCaMP2. Structure 16, 1817–1827 (2008).
7. Chen, T.-W. et al. Ultrasensitive fluorescent proteins for imaging neuronalactivity. Nature 499, 295–300 (2013).
8. Hoi, H., Matsuda, T., Nagai, T. & Campbell, R. E. Highlightable Ca2þ
indicators for live cell imaging. J. Am. Chem. Soc. 135, 46–49 (2012).9. Akerboom, J. et al. Genetically encoded calcium indicators for multi-color
neural activity imaging and combination with optogenetics. Front. Mol.Neurosci 6, 2 (2013).
10. Wu, J. et al. Improved orange and red Ca2þ indicators and photophysicalconsiderations for optogenetic applications. ACS Chem. Neurosci. 4, 963–972(2013).
11. Zhao, Y. et al. An expanded palette of genetically encoded Ca2þ indicators.Science 333, 1888–1891 (2011).
12. Carlson, H. J. & Campbell, R. E. Circular permutated red fluorescent proteinsand calcium ion indicators based on mCherry. Protein Eng. Des. Sel. 26,763–772 (2013).
13. Walker, A. S., Burrone, J. & Meyer, M. P. Functional imaging in the zebrafishretinotectal system using RGECO. Front. Neural Circuits 7, 1–10 (2013).
14. Pech, U. et al. Mushroom body miscellanea: transgenic Drosophila strainsexpressing anatomical and physiological sensor proteins in Kenyon cells. Front.Neural Circuits 7, 1–14 (2013).
15. Li, H., Li, Y., Lei, Z., Wang, K. & Guo, A. Transformation of odor selectivityfrom projection neurons to single mushroom body neurons mapped withdual-color calcium imaging. Proc. Natl. Acad. Sci. USA 110, 12084–12089(2013).
16. Benjumeda, I. et al. Uncoupling of EphA/ephrinA signaling and spontaneousactivity in neural circuit wiring. J. Neurosci. 33, 18208–18218 (2013).
17. Schenkman, K. A., Marble, D. R., Feigl, E. O. & Burns, D. H. Near-infraredspectroscopic measurement of myoglobin oxygen saturation in the presence ofhemoglobin using partial least-squares analysis. Appl. Spectrosc. 53, 325–331(1999).
18. Tromberg, B. J. et al. Non-invasive in vivo characterization of breast tumorsusing photon migration spectroscopy. Neoplasia 2, 26–40 (2000).
19. Chu, J. et al. Non-invasive intravital imaging of cellular differentiation with abright red-excitable fluorescent protein. Nat. Methods 11, 572–578 (2014).
20. Denk, W., Strickler, J. H. & Webb, W. W. Two-photon laser scanningfluorescence microscopy. Science 248, 73–76 (1990).
21. Drobizhev, M., Makarov, N. S., Tillo, S. E., Hughes, T. E. & Rebane, A.Two-photon absorption properties of fluorescent proteins. Nat. Methods 8,393–399 (2011).
22. Kogure, T. et al. A fluorescent variant of a protein from the stony coralMontipora facilitates dual-color single-laser fluorescence cross-correlationspectroscopy. Nat. Biotechnol. 24, 577–581 (2006).
23. Piatkevich, K. D., Malashkevich, V. N., Almo, S. C. & Verkhusha, V. VEngineering ESPT pathways based on structural analysis of LSSmKate redfluorescent proteins with large Stokes shift. J. Am. Chem. Soc. 132,10762–10770 (2010).
24. Piatkevich, K. D. et al. Monomeric red fluorescent proteins with a large Stokesshift. Proc. Natl. Acad. Sci. USA 107, 5369–5374 (2010).
25. Maravall, M., Mainen, Z. F., Sabatini, B. L. & Svoboda, K. Estimatingintracellular calcium concentrations and buffering without wavelength ratioing.Biophys. J. 78, 2655–2667 (2000).
26. Glover, C. P. J., Bienemann, A. S., Heywood, D. J., Cosgrave, A. S. & Uney, J. B.Adenoviral-mediated, high-level, cell-specific transgene expression: A SYN1-WPRE cassette mediates increased transgene expression with no loss of neuronspecificity. Mol. Ther. 5, 509–516 (2002).
27. Kugler, S., Kilic, E. & Bahr, M. Human synapsin 1 gene promoter confers highlyneuron-specific long-term transgene expression from an adenoviral vector inthe adult rat brain depending on the transduced area. Gene. Ther. 10, 337–347(2003).
28. Betley, J. N. & Sternson, S. M. Adeno-associated viral vectors for mapping,monitoring, and manipulating neural circuits. Hum. Gene Ther. 22, 669–677(2011).
29. Thummler, S. & Dunwiddie, T. V. Adenosine receptor antagonists inducepersistent bursting in the rat hippocampal CA3 region via an NMDA receptor-dependent mechanism. J. Neurophysiol. 83, 1787–1795 (2000).
30. Panaitescu, B. et al. Methylxanthines do not affect rhythmogenic preBotCinspiratory network activity but impair bursting of preBotC-drivenmotoneurons. Neuroscience 255, 158–176 (2013).
31. Klishin, A., Tsintsadze, T., Lozovaya, N. & Krishtal, O. Latent N-methyl-D-aspartate receptors in the recurrent excitatory pathway between hippocampalCA1 pyramidal neurons: Ca2þ -dependent activation by blocking A1 adenosinereceptors. Proc. Natl. Acad. Sci. USA 92, 12431–12435 (1995).
32. Brundege, J. M. & Dunwiddie, T. V. Modulation of excitatory synaptictransmission by adenosine released from single hippocampal pyramidalneurons. J. Neurosci. 16, 5603–5612 (1996).
33. Sugimoto, T., Sugimoto, M., Uchida, I., Mashimo, T. & Okada, S. Inhibitoryeffect of theophylline on recombinant GABA(A) receptor. NeuroReport 12,489–493 (2001).
ARTICLE NATURE COMMUNICATIONS | DOI: 10.1038/ncomms6262
10 NATURE COMMUNICATIONS | 5:5262 | DOI: 10.1038/ncomms6262 | www.nature.com/naturecommunications
& 2014 Macmillan Publishers Limited. All rights reserved.
34. Grienberger, C. et al. Sound-evoked network calcium transients in mouseauditory cortex in vivo. J. Physiol. 590, 899–918 (2011).
35. Garaschuk, O., Milos, R.-I. & Konnerth, A. Targeted bulk-loading of fluorescentindicators for two-photon brain imaging in vivo. Nat. Protoc. 1, 380–386(2006).
36. Shelton, M. K. & McCarthy, K. D. Mature hippocampal astrocytes exhibitfunctional metabotropic and ionotropic glutamate receptors in situ. Glia 26,1–11 (1999).
37. Carmignoto, G., Pasti, L. & Pozzan, T. On the role of voltage-fependent calciumchannels in calcium signaling of astrocytes in situ. J. Neurosci. 18, 4637–4645(1998).
38. Pasti, L., Volterra, A., Pozzan, T. & Carmignoto, G. Intracellular calciumoscillations in astrocytes: a highly plastic, bidirectional form of communicationbetween neurons and astrocytes in situ. J. Neurosci. 17, 7817–7830 (1997).
39. Harris-White, M. E., Zanotti, S. A., Frautschy, S. A. & Charles, A. C. Spiralintercellular calcium waves in hippocampal slice cultures. J. Neurophysiol. 79,1045–1052 (1998).
40. Venance, L., Stella, N., Glowinski, J. & Giaume, C. Mechanism involved ininitiation and propagation of receptor-induced intercellular calcium signalingin cultured rat astrocytes. J. Neurosci. 17, 1981–1992 (1997).
41. Latour, I., Gee, C. E., Robitaille, R. & Lacaille, J.-C. Differential mechanisms ofCa2þ responses in glial cells evoked by exogenous and endogenous glutamatein rat hippocampus. Hippocampus 11, 132–145 (2001).
42. Megıas, M., Emri, Z., Freund, T. F. & Gulyas, A. I. Total number anddistribution of inhibitory and excitatory synapses on hippocampal CA1pyramidal cells. Neuroscience 102, 527–540 (2001).
43. Marvin, J. S. et al. An optimized fluorescent probe for visualizing glutamateneurotransmission. Nat. Methods 10, 162–170 (2013).
44. Clark, M. & Dar, M. S. Release of endogenous glutamate from rat cerebellarsynaptosomes: Interactions with adenosine and ethanol. Life Sci. 44, 1625–1635(1989).
45. Miyawaki, A., Griesbeck, O., Heim, R. & Tsien, R. Y. Dynamic and quantitativeCa2þ measurements using improved cameleons. Proc. Natl. Acad. Sci. USA 96,2135–2140 (1999).
46. Cheng, Z. & Campbell, R. E. Assessing the structural stability of designedb-hairpin peptides in the cytoplasm of live cells. Chembiochem. 7, 1147–1150(2006).
47. Makarov, N. S., Drobizhev, M. & Rebane, A. Two-photon absorption standardsin the 550-1600 nm excitation wavelength range. Opt. Express 16, 4029–4047(2008).
48. Nieuwkoop, P. D. & Faber, J. Normal Table of Xenopus Laevis (Daudin)164–188 (North-Holland, 1956).
49. Ruthazer, E. S. et al. Bulk electroporation of retinal ganglion cells in liveXenopus tadpoles. Cold Spring Harb. Protoc. 8, 771–775 (2013).
AcknowledgementsWe thank the University of Alberta Molecular Biology Services Unit, Yidan Ding, YiShen and Wei Zhang for technical support, Andy Holt and Christopher W. Cairo forproviding access to instrumentation, Alan Fine for valuable discussion, and Eric Schreiterand Loren Looger for sharing the R-GECO1 coordinates. Support is also acknowledgedfor the Canada Foundation of Innovation/Alberta Advanced Education & Technology(K.B.) and Alberta Innovates and Alberta Innovates Health Solutions (Scientist award toK.B.). G.W., M.D. and A.R. were supported by the NIH grant R01 GM 098083. E.S.R. wassupported by grants from NSERC (RGPIN 402265-2011) and CIHR (MOP-123514,MOP-77567, MOP-126192). A.S.A. was supported by a Vanier Canada GraduateScholarship and an Alberta Innovates Health Solutions (AIHS) Studentship. R.E.C. is aTier II Canada Research Chair and research in his lab was supported by grants fromCIHR (MOP-123514) and NSERC (RGPIN 288338-2010).
Author contributionsJ.W. performed rational design, directed evolution, the majority of in vitro character-ization and imaging in HeLa cells and dissociated neurons. A.S.A. performed culture,electroporation, field stimulation, one-photon and two-photon imaging of organotypicslices. E.K. performed imaging of Xenopus ex vivo brain preparation and L.S.M. per-formed in vivo imaging of visually evoked responses. A.R. performed rat hippocampusdissection and provided support regarding one- and two-photon imaging. H.Z. per-formed protein purification and measured extinction coefficient and quantum yield.G.W., M.D. and A.R. acquired the two-photon spectra. R.E.C., K.B. and E.S.R. directedresearch, devised experiments. J.W., A.S.A., E.S.R. and R.E.C. wrote the manuscript.
Additional informationSupplementary Information accompanies this paper at http://www.nature.com/naturecommunications
Competing financial interests: The authors declare no competing financial interests.
Reprints and permission information is available online at http://npg.nature.com/reprintsandpermissions/
How to cite this article: Wu, J. et al. A long Stokes shift red fluorescent Ca2þ
indicator protein for two-photon and ratiometric imaging. Nat. Commun. 5:5262doi: 10.1038/ncomms6262 (2014).
NATURE COMMUNICATIONS | DOI: 10.1038/ncomms6262 ARTICLE
NATURE COMMUNICATIONS | 5:5262 | DOI: 10.1038/ncomms6262 | www.nature.com/naturecommunications 11
& 2014 Macmillan Publishers Limited. All rights reserved.