a longitudinal study of the effects of cognitive awareness
TRANSCRIPT

University of South FloridaScholar Commons
Graduate Theses and Dissertations Graduate School
October 2017
A Longitudinal Study of the Effects of CognitiveAwareness Training on Transaction ProcessingAccuracy: An Introduction to the ACE TheoreticalConstructJohn TownsendUniversity of South Florida, [email protected]
Follow this and additional works at: http://scholarcommons.usf.edu/etd
Part of the Business Administration, Management, and Operations Commons, NeurosciencesCommons, and the Social and Behavioral Sciences Commons
This Dissertation is brought to you for free and open access by the Graduate School at Scholar Commons. It has been accepted for inclusion inGraduate Theses and Dissertations by an authorized administrator of Scholar Commons. For more information, please [email protected].
Scholar Commons CitationTownsend, John, "A Longitudinal Study of the Effects of Cognitive Awareness Training on Transaction Processing Accuracy: AnIntroduction to the ACE Theoretical Construct" (2017). Graduate Theses and Dissertations.http://scholarcommons.usf.edu/etd/7101

A LONGITUDINAL STUDY OF THE EFFECTS OF COGNITIVE AWARENESS TRAINING
ON TRANSACTION PROCESSING ACCURACY
AN INTRODUCTION TO THE ACE THEORETICAL CONSTRUCT
by
John Townsend
A dissertation submitted in partial fulfillment of the requirements for the degree of
Doctor of Business Administration Department of Business
MUMA College of Business University of South Florida
Co-Major Professor: Anand Kumar, Ph.D. Co-Major Professor: Paul Spector, Ph.D.
Moez Limayem, Ph.D. Richard Plank, Ph.D. Richard Will, Ph.D.
Date of Approval:
September 15, 2017
Keywords: ACE, Error Management Culture, Inattentional Blindness
Copyright © 2017, John Townsend

i
TABLE OF CONTENTS
List of Tables ................................................................................................................... iii List of Figures .................................................................................................................. iv Abstract ............................................................................................................................ v Chapter One: Introduction ................................................................................................ 1 Chapter Two: Literature Review ....................................................................................... 4 Chapter Three: Study Design .......................................................................................... 9 Longitudinal Study Design Using Quantitative Data .............................................. 9 Cognitive Awareness Training Protocol Design .................................................. 12 Constructing the Introduction Section ....................................................... 13 Constructing Learning Module I: Awareness of Triggers .......................... 15 Constructing Learning Module II: Awareness of Cognitive Functions ...... 19 Constructing Learning Module III: Awareness of Behavioral Mechanisms ....................................................................................... 21 Constructing the Conclusion and Review of Cognitive Awareness Training .............................................................................................. 22 Experiment Design & Implementation ................................................................. 24 Chapter Four: Methodology ............................................................................................ 28 Baseline ............................................................................................................... 28 Positive EOQ Dimensions ........................................................................ 29 Negative EOQ Dimensions ....................................................................... 30 Chapter Five: Results ..................................................................................................... 31 Pre-Treatment Analysis ....................................................................................... 32 Post-Treatment Analysis ..................................................................................... 36 Analysis of Change Between Pre- and Post-Treatment States and the Relationship Between Accuracy and EOQ .................................... 42 Chapter Six: Discussions ............................................................................................... 51 H1: A Targeted Treatment of Cognitive Awareness Training Programs Will Have a Positive Effect on Transaction Processing Accuracy ....................... 51 H2: A Targeted Treatment of Cognitive Awareness Training Programs Will Have a Positive Effect on Error Orientation Culture ...................................... 54 H3: Improved Accuracy and Increased Error Orientation Are Positively Correlated ..................................................................................................... 55

ii
Chapter Seven: Conclusions…………………………………………………………………57 Chapter Eight: Appendix- Definition of a Transaction.....................................................58 Citations ......................................................................................................................... 62
iii
LIST OF TABLES Table 1: Example of Data Coding ................................................................................ 28 Table 2: Example of Accuracy Data Sample ................................................................ 29 Table 3: Pre-Treatment Measures of Accuracy ........................................................... 32 Table 4: Pre-Treatment Accuracy ANOVA Results by Location, Gender, and Tenure ............................................................................................................ 34 Table 5: Pre-Treatment EOQ ANOVA Results by Location, Gender, and Tenure ............................................................................................................ 36 Table 6: Post-Treatment Accuracy Results by Location and Tenure ........................... 37 Table 7: Post-Treatment Accuracy ANOVA Results……..………………. .................... 39 Table 8: Post-Treatment Accuracy ANOVA results for SITE-1, SITE-2 and SITE-3 ............................................................................................................ 39 Table 9: Post-Treatment EOQ ANOVA Results by Location, Tenure, and Gender ........................................................................................................... 41 Table 10: Differences between Pre- and Post-Treatment Means for Accuracy ............. 43 Table 11: Differences between Pre- and Post-Treatment Accuracy Means by Location, Tenure, and Gender ....................................................................... 45 Table 12: Differences between Pre- and Post-Treatment EOQ Scores ......................... 46 Table 13: ANOVA of EOQ Score Change by Location, Tenure, and Gender for Population Available in Both Pre- and Post-Treatment States ....................... 47 Table 14: Pearson Correlation Analysis of Accuracy and EOQ Scores for CAT
Financial ......................................................................................................... 48 Table 15: Pearson Correlation Analysis of Accuracy and EOQ Scores ......................... 48 Table 16: Pearson Correlation Analysis of Accuracy and EOQ Scores for Female Population ...................................................................................................... 49

iv
LIST OF FIGURES
Figure 1: The ACE Theoretical Construct ....................................................................... 2
Figure 2: Pre-Treatment Accuracy Rate by Tenure ...................................................... 33
Figure 3: Pre-Treatment Accuracy Rates by Location & Tenure ................................... 33
Figure 4: Pre-Treatment Accuracy Rates by Location & Gender .................................. 34
Figure 5: Pre-Treatment EOQ Cumulative Scores by Location .................................... 35
Figure 6: Pre-Treatment EOQ cumulative scores by Location & Gender ..................... 35
Figure 7: Post-Treatment Accuracy Results by Location and Tenure ........................... 38
Figure 8: Post-Treatment EOQ ANOVA results for SITE-1, SITE-2, and SITE-3 ......... 42
Figure 9: Differences between Pre- and Post-Treatment EOQ Scores ......................... 46
v
ABSTRACT
This study examines the impact of Cognitive Awareness training on transaction
processing accuracy rates within the US Financial Services Industry. Grounded in the
theories of Inattentional Blindness and Error Management Culture, this paper supports
and extends both theories through the development of a new theoretical construct. The
ACE Construct is a novel approach that combines cognitive science, organizational
development, and operational efficiency practices into a single approach designed to
improve transaction processing accuracy. The study involved the design and
implementation of a novel training program, with performance data observations
sampled over seven months, to evaluate the impact of Cognitive Awareness training on
accuracy.
The researcher was able to partner with a global financial services firm to
conduct experiments within three of their US based locations. It involved over 150
agents as they processed live-client transactions requests in real time. The similarities
between agent populations, training practices, systems and procedures, and work
types, allowed for analysis and interpretation of independent variables related to
gender, proficiency/experience of the agent, and location.
As expected, analysis of pre-treatment conditions suggest that accuracy is
largely dependent on experience. Analysis of post-treatment accuracy results favor
improvement in both accuracy measures and organization climate and culture dynamics
as a result of Cognitive Awareness Training. Statistically significant improvements to

vi
both accuracy and organizational climate, related to type of Cognitive Awareness
treatment introduced, and tenure, were discovered in the agent populations who were
present during the entirety of the study.
However, there was an absence of statistical support for a direct relationship
between Cognitive Awareness Training as an independent variable and accuracy
improvement. Furthermore, I was unable to detect a correlation between improvements
in Error Management Culture and transaction processing accuracy.
The results suggest the possibility of positive effects on transaction processing
accuracy in practice, and open the door for continued research in this field.
1
CHAPTER ONE:
INTRODUCTION
The fundamental motivation for my research stems from two-plus decades of
practitioner experience in the US financial services industry. Established industry
practice suggests that increased post-production sampling is the only way to monitor
and improve transaction processing accuracy. However, my direct observation of these
practices led me to the conclusion that post-production sampling rates are decidedly
uncorrelated to accuracy outcomes. If post-production sampling practices are not an
effective practice for improving transaction processing accuracy, what is?
A thorough review of the available academic literature on quality management
practices such as TQM, Six Sigma, Lean, and others, did not provide sufficient answers
to the primary research question. Though ample research exits on these theories, their
application remains focused on mechanical and processes oriented approaches to
accuracy. While these certainly have relevance in practice, and are important for
transaction processing activity in financial services, they fail to address the central actor
in this process, the transaction processing agent.
I then began to investigate the social sciences in an effort to identify other
possible explanations that targeted the human agent and their abilities related to
transaction processing. In so doing, I discovered a wealth of research covering a
variety of distinct and independent fields ranging from neuroscience and cognitive
2
theories, to organizational and management oversight theories, to evaluation and
sampling frequency theories.
However, none of the research looked at the entire process and the combined
effects of each. The effects of these theories would certainly be present simultaneously
throughout the act of completing a financial transaction. Could then, a new theory
emerge that would tie these disciplines together in a manner that informs and advances
both academia and practice? This question led to the development of the ACE
construct for improving transaction accuracy performance.
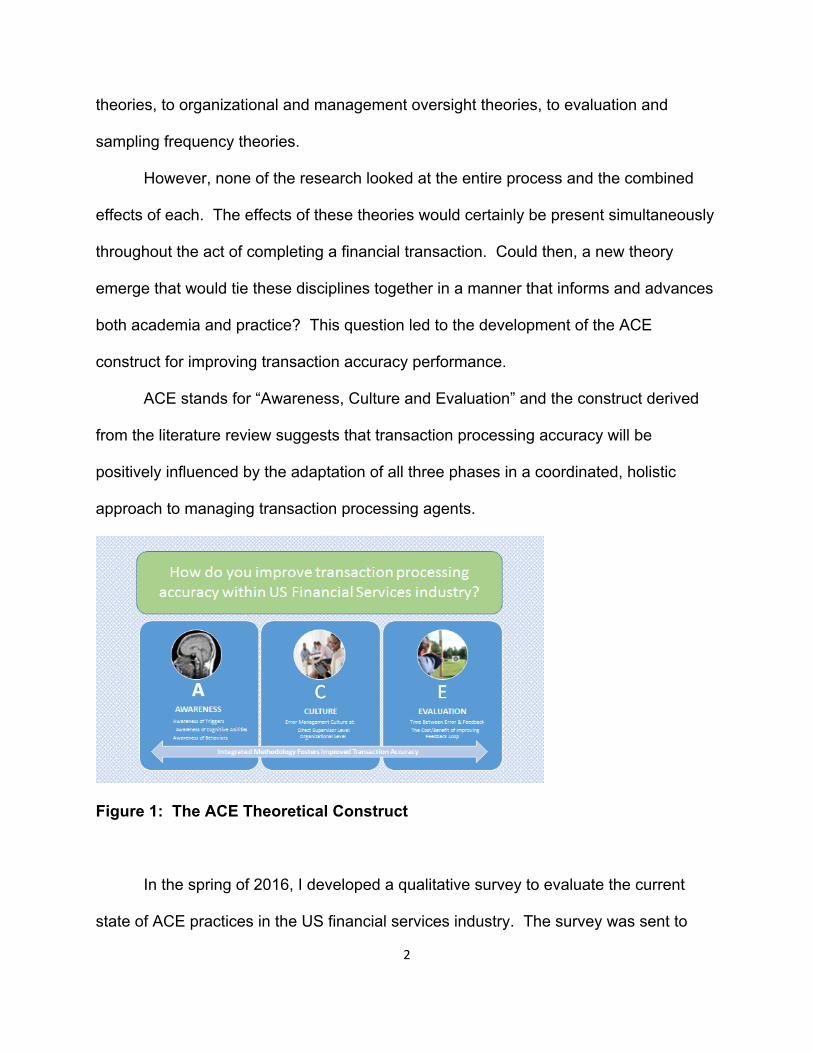
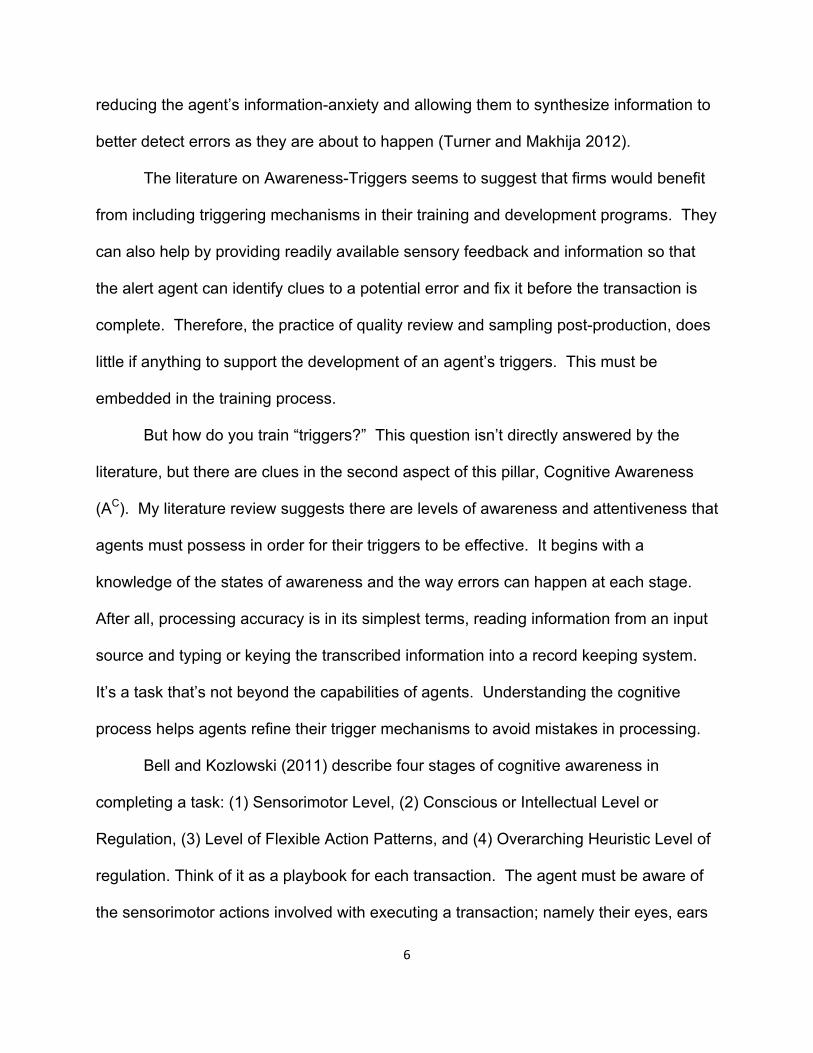
ACE stands for “Awareness, Culture and Evaluation” and the construct derived
from the literature review suggests that transaction processing accuracy will be
positively influenced by the adaptation of all three phases in a coordinated, holistic
approach to managing transaction processing agents.
Figure 1: The ACE Theoretical Construct
In the spring of 2016, I developed a qualitative survey to evaluate the current
state of ACE practices in the US financial services industry. The survey was sent to

3
operational managers of 12 US based financial services organizations and complete
responses were received from 6 firms. The results were analyzed and the conclusion
was that “Evaluation” practices were well developed and extensively used across the
industry. Furthermore, about half of the respondents indicated that they were aware of
and attempting to create cultures consistent with Error Management Culture, though
none indicated proficiency of completeness of these practices.
The survey further indicated the absence of Cognitive Awareness training, as
well as the possible positive impact of such on performance, in any of these
organizations. As a result of this industry wide survey, the methodology of my research
program became more clearly defined. My research would focus exclusively on the
impact of Cognitive Awareness training as a means of contributing to the broader
question of, “What drives transaction processing accuracy in US financial services
firms?”
The research question led to the design of three hypotheses:
H1: A targeted treatment of cognitive awareness training programs will have a
positive effect on transaction processing accuracy.
H2: A targeted treatment of cognitive awareness training programs will increase
the Error Orientation of transaction processing agents.
H3: Improved accuracy and increased Error Orientation are positively correlated.
Chapter 8 is included as an Appendix. For those unfamiliar with the problem
space of financial services transaction processing, this section provides additional detail
into the nature of the work and its dependence on human agents and cognition.

4
CHAPTER TWO:
LITERATURE REVIEW
There is significant depth in the social sciences literature covering various
dimensions of human psychology and the influencers of accurate task performance.
However, there is an absence of literature focusing specifically on the Financial
Services industry and the accuracy of transaction processing groups.
So what drives quality in a processing environment? The research literature
tends to be very consistent and focused on three key themes; (A) Awareness, (C)
Culture, and (E) Evaluation, or the “ACE” Construct. Academic literature is spread
across a variety of industries and the research covers many dynamics of performance.
But with very minor exceptions, the consensus of researchers is centered on the
principles of ACE. That is not to say there aren’t subtle nuances in the literature for
each subject – there are. In fact, each component of ACE is multi-faceted with each
sub-genre representing its own branch of research.
To better understand the literature, I systematically reviewed each component of
ACE in attempt to create an overall narrative in response to the main research question.
I then investigated and reviewed the literature behind the Cognitive Awareness Training
experiment. The Cognitive Awareness training is grounded in the Awareness literature,
but the scientific underpinnings that describe brain functions and neuroscience are
central to the training design.

5
To properly assess the impact of Cognitive Awareness training on performance,
we must first explore the literature on cognitive awareness and how it relates to
transaction processing.
Awareness, simply stated, is the general state of mind of mental capabilities of the
agent/processor. There are three Awareness themes, or pillars, emerging from the
literature; Awareness of Triggers (AT), Awareness of Cognitive Process or Abilities (Ac),
and Awareness of Behavior (AB). The research suggests that firms who focus on all
three elements can vastly improve quality output and performance among its agents.
The Awareness of Triggers (AT) pillar is described in three papers located in the
research. Specifically, AT refers to an agent’s ability to develop and sense errors as
they are happening or immediately after they have happened (but before the transaction
is completed). Have you ever driven away from your house and turned back because
you weren’t sure if you unplugged the iron before leaving? This is an example of a
trigger. We learn these triggers very early on as a means of insuring personal safety
and overall fitness. To some extent, the process is embedded deep within our genetic
makeup as we long ago developed adaptations that kept us alert and vigilant against
people, places, things or activities that could harm us. The key is tapping into that
ability to help agents sense when they are in danger of making an error. Ohlsson’s
(1996) research concludes that agents must be equipped with these triggers to learn
from and improve their own performance. Allwood’s (1984) research draws the same
conclusions, stressing that agents must be equipped with the ability to diagnose and
correct their own errors through well-developed triggers. This practice is supported by
organizations who create environments where information is readily accessible, thereby
6
reducing the agent’s information-anxiety and allowing them to synthesize information to
better detect errors as they are about to happen (Turner and Makhija 2012).
The literature on Awareness-Triggers seems to suggest that firms would benefit
from including triggering mechanisms in their training and development programs. They
can also help by providing readily available sensory feedback and information so that
the alert agent can identify clues to a potential error and fix it before the transaction is
complete. Therefore, the practice of quality review and sampling post-production, does
little if anything to support the development of an agent’s triggers. This must be
embedded in the training process.
But how do you train “triggers?” This question isn’t directly answered by the
literature, but there are clues in the second aspect of this pillar, Cognitive Awareness
(AC). My literature review suggests there are levels of awareness and attentiveness that
agents must possess in order for their triggers to be effective. It begins with a
knowledge of the states of awareness and the way errors can happen at each stage.
After all, processing accuracy is in its simplest terms, reading information from an input
source and typing or keying the transcribed information into a record keeping system.
It’s a task that’s not beyond the capabilities of agents. Understanding the cognitive
process helps agents refine their trigger mechanisms to avoid mistakes in processing.
Bell and Kozlowski (2011) describe four stages of cognitive awareness in
completing a task: (1) Sensorimotor Level, (2) Conscious or Intellectual Level or
Regulation, (3) Level of Flexible Action Patterns, and (4) Overarching Heuristic Level of
regulation. Think of it as a playbook for each transaction. The agent must be aware of
the sensorimotor actions involved with executing a transaction; namely their eyes, ears
7
and hands. Next, there needs to be awareness of their own cognitive state. Are they
blocking out distractions and clearing their mind so that full attention can be leveraged
on the transaction at hand? Third, are they familiar with the playbook? Have they
processed this type of transaction before and do they understand what needs to happen
to complete the transaction accurately? Lastly, there’s the overall awareness of all
three of the prior phases operating concurrently to produce an accurate transaction;
almost an omniscient point of view of the entire process.
There’s also the awareness of the forces working against cognitive awareness.
Automation of data feeds and transactions can lead agents to become spectators in
their own transactions, slowing down and dulling awareness of triggers (Hollenbeck, et
al, 1995). In today’s computer driven world, many actions of a processor are semi-
automated and thus can create a false sense of security. One way to counter this
phenomenon is to create an environment where agents enjoy their work and feel safe in
their environment (Leonard & Weitz 1971). This leads us to the third and final
Awareness pillar, Awareness of Behaviors (AB). Behavioral awareness speaks to how
firms equip agents to be aware of and respond positively to their processing
environment, and in many ways, serves as a bridge to our second theme of “Culture” in
responding to the research question of what actually drives quality.
AB is an awareness of how humans are given to behave in the context of
completing their transactions and how they respond psychologically to errors when they
occur. Agents who are confident in their work environment feel as though the task at
hand is well within their proverbial wheelhouse. They feel as though they are in control
of their environment and that they have the ability to dictate the outcomes of their work

8
(Rotter 1996). This also means that agents must have autonomy to conduct their
activities in the manner which they see fit. By keeping agents focused on work that’s
within their realm of mastery, they tend to be more aware of their abilities and limitations
and thus are more willing to learn from mistakes when they inevitably occur, and feel
confident that they can correct them going forward (Feather 1969).
In summary, each of the pillars of Awareness are well covered in the literature. When
assembled together, they create a powerful reference for practitioners who seek
improved transaction processing accuracy. The literature favors the argument that firms
who focus on developing awareness among their agents will improve accuracy and
performance.

9
CHAPTER THREE:
STUDY DESIGN
Longitudinal Study Design Using Quantitative Data
Given the lessons learned from the literature review, the goal was to design a
cognitive awareness training program and find a practitioner partner who would permit
the training to be administered. Additionally, quantitative measures for gathering data
related to the training would need to be developed. Lastly, methods for analysis of the
data would need to be identified and applied.
However, in developing the training, I discovered multiple studies on the relative
ineffectiveness of “brain training” games or programs on sustained learning. Simons, et
al, conducted extensive research of commercially available “brain training” games and
applications and conclude that while the trainings appear to have a direct effect on
improving performance in the targeted area of brain cognition, there was no evidence to
support this learning could generalize to other areas. (Simons, et al, 2016) (Kreitz, et al,
2015).
It’s important to note that my experiment design targets awareness of cognitive
functions, and is not intended to mimic a Brain training program. By design, my
intervention seeks to measure the impact of increased awareness of brain functions,
coupled with a self-guided and intentional program for developing one’s own unique and
targeted brain training design that they can practice and apply to the transaction

10
processing task. In summary, my experiment is unique and will provide new information
to the existing knowledge base related to cognitive abilities related to successful task
performance.
Thus, a study was devised whereby a host firm would allow for a controlled
experiment involving the introduction of a Cognitive Awareness training program to a
treatment group, with a representatively equivalent control group who would not receive
the training. Transaction processing outcomes (accuracy rates) would then be
observed Pre- and Post-experiment to create data sets for further observation.
Transaction processing as a function, yields a rich repository of qualitative data.
Businesses regularly measure the number of transactions processed per hour, the rate
at which items are selected for secondary review, and the resulting error/accuracy rates
at an individual, group, and department level.
I presented the idea to a large US-based financial services firm (which we will
refer to as CAT or CAT Financial) in January of 2017 and they granted permission to
conduct my experiment within their organization. CAT agreed to provide the researcher
with transaction processing data sets for both Pre- and Post-experiment. Given the
richness and availability of CAT Financial’s data, I decided to create a longitudinal study
of the effectiveness of Cognitive Awareness training on transaction processing
accuracy. CAT would provide the researcher with anonymized transaction process
accuracy over a seven-month period including four months’ worth of pre-treatment
performance data, and three months of post-treatment data. These data sets would
provide for quantitative analysis of the impact of Cognitive Awareness training on
transaction processing accuracy, thereby addressing the first hypothesis:

11
H1: A targeted treatment of cognitive awareness training programs will have a
positive effect on transaction processing accuracy.
Additionally, the literature review had revealed the existence of a quantitative
survey methodology, known as an Error Orientation Questionnaire or EOQ (Rybowiak,
Garst, et al., 1999). EOQ was discovered as part of the “Cultural” pillar of the ACE
construct, but was relevant to the “Awareness” pillar due to the behavioral dynamics
associated with cognitive functions. EOQ measures agents’ perceptions and feelings
towards errors that occur in the workplace. Measuring these perceptions and any
changes over time, would be directly relevant to the assessment of cognitive awareness
training. Analysis of these data would also address the second hypothesis:
H2: A targeted treatment of cognitive awareness training programs will increase
the Error Orientation of transaction processing agents.
CAT Financial also adopted EOQ as a means of measuring the overall health of
their quality (accuracy) environment. They further agreed to provide the researcher with
the data sets from four distinct applications of the EOQ survey; one pre-Cognitive
Awareness training treatment, one at the end of the 90-day post-treatment cycle, and
two more at 30 and 60 days post-treatment. The data sets would be coded in such a
way as to protect the identities of the individual agents, but in such a way that they
could be cross-referenced at the individual agent level with quantitative data sets from
transaction processing accuracy.
Lastly, both quantitative and qualitative data sets would be utilized to address the
third hypothesis:
H3: Improved accuracy and increased Error Orientation are positively correlated.
12
Cognitive Awareness Training Protocol Design
As there are no existing models for training Cognitive Awareness in financial
services transaction processing groups, new materials needed to be constructed. As a
practitioner, I have over 25 years’ worth of professional experience in leading, coaching,
training, and developing practitioners in the financial services industry. I therefore
began designing an original training program based on my knowledge and experience
with similar practice in related subject matters.
First, I knew that all training programs needed to be engaging and interactive to
be successful with adult professional learners. There needed to be clear relevance to
the lessons from training; trainees need to know that the material is portable; which is to
say that it can be easily translated from theory into practice; that it’s obtainable,
meaning that the knowledge will be easy for them to grasp and understand; and that
there are low barriers to entry, meaning that the material will have an immediate impact
on their performance.
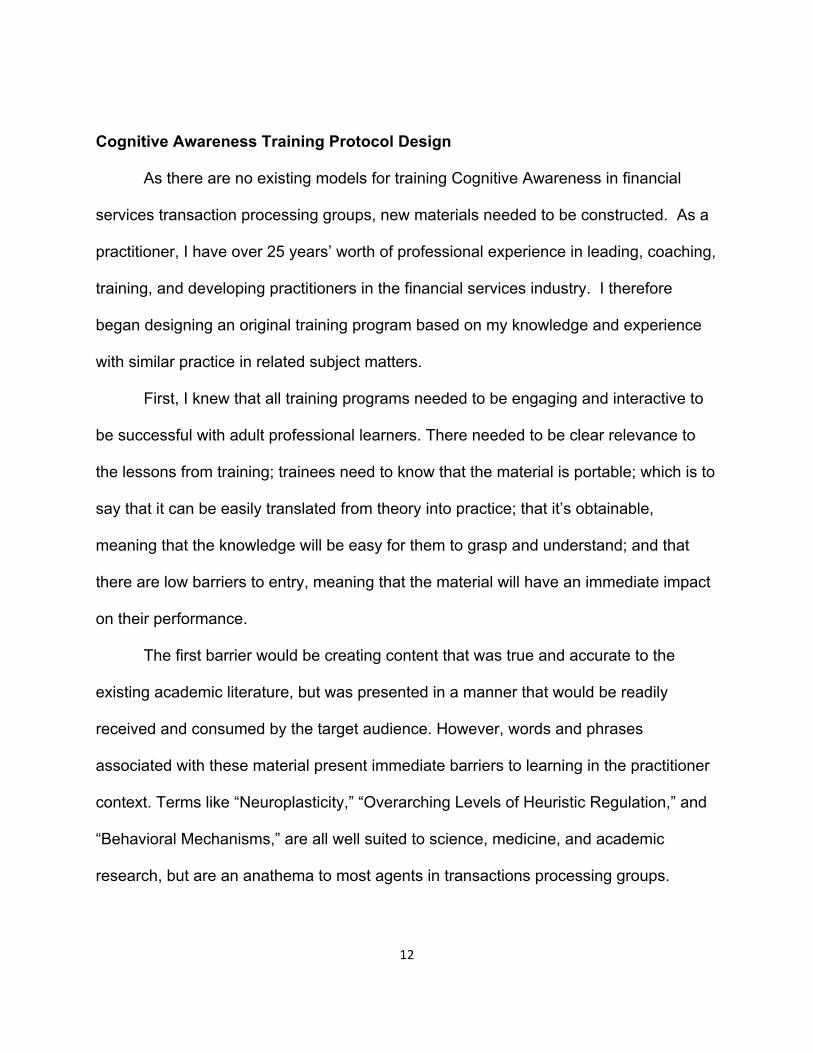
The first barrier would be creating content that was true and accurate to the
existing academic literature, but was presented in a manner that would be readily
received and consumed by the target audience. However, words and phrases
associated with these material present immediate barriers to learning in the practitioner
context. Terms like “Neuroplasticity,” “Overarching Levels of Heuristic Regulation,” and
“Behavioral Mechanisms,” are all well suited to science, medicine, and academic
research, but are an anathema to most agents in transactions processing groups.

13
The literature for the “Awareness” pillar suggests that there are three distinct sub-
concepts associated with Cognitive Awareness: Awareness of Triggers (AT),
Awareness of Cognitive Functions (AC), and Awareness of Behavioral Mechanisms (AB).
The training materials would therefore need to consist of three distinct learning modules
dedicated to each of the sub-concepts. The training program would also need an
introduction providing context around the learning concepts in such a way that it would
answer the following questions:
1. WHO is administering this training? (Is it credible? Is the instructor credible?)
2. WHAT is Cognitive Awareness? (What does it mean to practice?)
3. WHY are we learning about this when we have so many other things to do?
(What’s the relevance to my job and my performance? What’s in it for me?)
4. WHEN will I use it? (Will I see immediate results? How will it take for me to see
results? Will the results last?)
5. WHERE will I use it? (Does this help me process better, faster? Will it work for
some transactions but not others?)
6. HOW will I apply this to improve my performance? (How do I easily translate the
learning into practice? How will I know it’s working?)
Lastly, the training program would need a conclusion and call to action.
Exposure to the materials is only the first part of learning new behaviors. Cognitive
Awareness training would need a conclusion that provided some prescriptive method for
carrying forth the lessons learned and turning them into practice. The training program
would therefore be developed with the following structure:
14
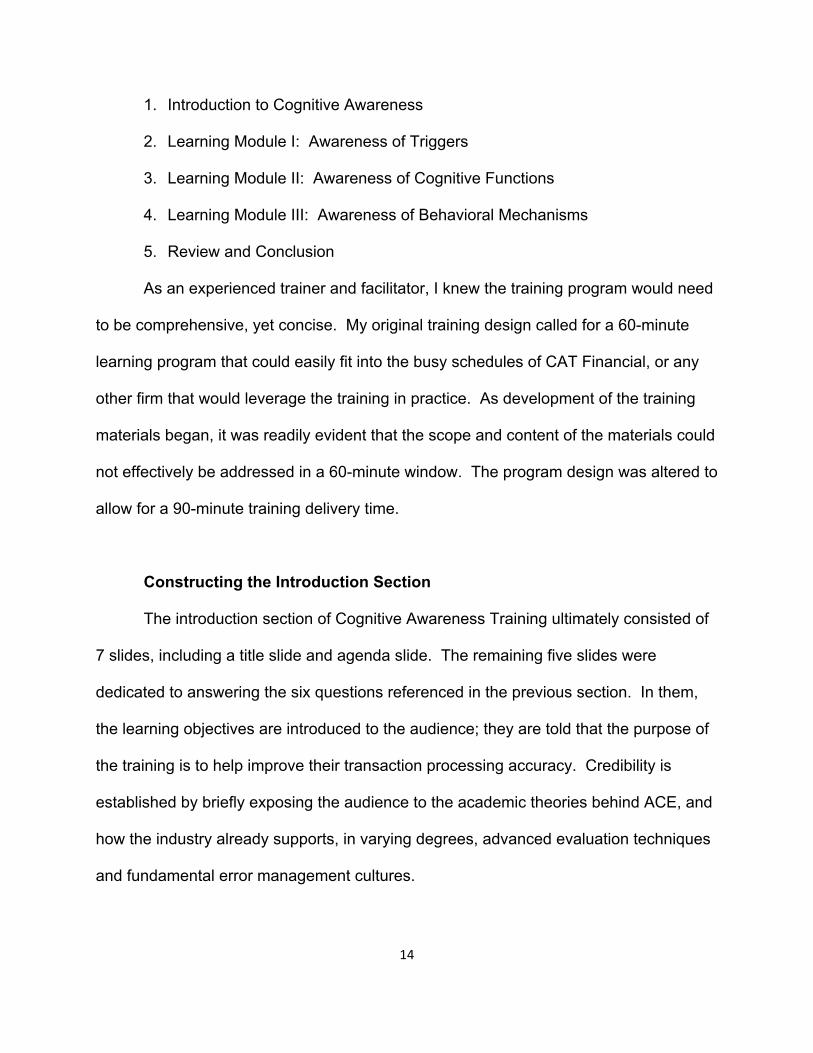
1. Introduction to Cognitive Awareness
2. Learning Module I: Awareness of Triggers
3. Learning Module II: Awareness of Cognitive Functions
4. Learning Module III: Awareness of Behavioral Mechanisms
5. Review and Conclusion
As an experienced trainer and facilitator, I knew the training program would need
to be comprehensive, yet concise. My original training design called for a 60-minute
learning program that could easily fit into the busy schedules of CAT Financial, or any
other firm that would leverage the training in practice. As development of the training
materials began, it was readily evident that the scope and content of the materials could
not effectively be addressed in a 60-minute window. The program design was altered to
allow for a 90-minute training delivery time.
Constructing the Introduction Section
The introduction section of Cognitive Awareness Training ultimately consisted of
7 slides, including a title slide and agenda slide. The remaining five slides were
dedicated to answering the six questions referenced in the previous section. In them,
the learning objectives are introduced to the audience; they are told that the purpose of
the training is to help improve their transaction processing accuracy. Credibility is
established by briefly exposing the audience to the academic theories behind ACE, and
how the industry already supports, in varying degrees, advanced evaluation techniques
and fundamental error management cultures.

15
Audience expectations related to “what” the content is, “why” it’s important to
their work and performance, and “where” they will use it to improve performance are
also addressed. Lastly, the audience is informed that they will receive both a Job-Aid
for quick reference of key aspects of Cognitive Awareness training, and a performance
improvement plan that will be used after training to embed the learning into practice.
This addresses the “how” question.
With the primary needs of the audience met, the training program turns to content and
learning modules sections. At this stage, the audience has a clear understanding of
what information will be coming their way over the 90-minute program, why it’s
important, and how it will be used for their benefit. They are primed for exposure to new
learning content.
Constructing Learning Module I: Awareness of Triggers
In the first of three learning modules, the goal is to orient the audience to the
fundamental workings of the brain, and how the brain’s features contribute to and
detract from seeing and performing with perfect attention to detail. After all, transaction
processing in practice involves reading and sense-making of written instructions
provided by a customer, applying business and industry rules to interpret the client’s
request and determine a course of action, then taking action (normally by keying a
transaction request into a trading or recordkeeping system). All of these steps take
place multiple times a day and thousands of times a year in financial services
transaction processing groups.
Additionally, being the first learning module and the introduction to the entire
learning suite, it is important to capture the audience’s attention and interest, to help
16
them relate to the problem space at an individual and personal level, so that they are
motivated to learn and pay closer attention to the content. Learning Module I’s attention
to Triggers needed to do just that.
Learning Module I consists of six slides. In order to bring the lessons alive in an
easy to grasp and engaging manner, I chose to leverage brain-teaser exercises and
videos. Through an internet search using Google, I discovered two quick and easy
exercises. The goal of both is to spot a minute detail – or outlier – in an image. The
image would flash for only ten seconds, then disappear. The purpose of these slides is
to start energizing the audience with a simple and fun exercise. Regardless of the
results, the intent is to make them aware that seeing detail is hard and can be missed or
overlooked (just like detail in a financial services transaction request). Everyone has
Triggers that enable them to see anomalies, but only some of the time. Why?
From there, the training program introduces the term, “Triggers” as a general
reference to the ability to sense and interpret detail in our environment. Ohlsson’s
(1996) research suggests that agents who are not equipped with “mechanisms” to
detect their own errors are unable to learn from their actions and improve performance.
Allwood’s (1984) research suggests that agents need to be equipped with the ability to
identify their own errors before they occur, and that a greater emphasis needs to be
placed on developing error detection triggers. Therefore, the motivation of Learning
Module I needs to build on the agent’s ability to detect triggers. In order to do that, they
must first understand how errors can occur.
To that end, the next slide playfully illustrates the concept of the human’s “old
brain” which developed earlier in our evolutionary cycle to protect us from danger and
17
increase chances for survival. Next, I found three videos on YouTube that further
develop the dichotomy of the Old Brain/New Brain. The first video from AsapScience
entitled, “Brain Tricks – this is how your brain works.” In just four minutes, this
illustrative video covers the separate functions of the Old/Fast brain and the New/Slow
brain, and how their functions can lead to being either too hyper focused on a specific
detail and thereby missing other equally important details, or being too focused on
problem solving to miss anomalies in the environment.
Next, there’s a video called the “Monkey Business Illusion” where the viewer gets
further exposure to the cognitive challenges presented by Old/Fast and New/Slow brain
thinking. (Simons 2010). This video is intended to get the audience to further consider
the impact of old and new brain functions so that they are primed to discover their own
triggers.
Lastly, there’s another video from Dr. Simons called, “Seeing the World as It
Isn’t” that goes a bit deeper into explaining how we often get the impression that we’re
seeing the entire picture in complete detail, when in fact we are not. (Simons 2011).
Again, the purpose of this video is to further convince the audience that they are aware
of the gaps in their cognitive process and the need to develop triggers to help identify
illusions and mistakes as they are happening. They now are aware of the need for
triggers, but have not yet been equipped with the methodology of how to do so. That
will come in Modules II & III.
With the videos chosen, I then proceeded to search the academic literature for
evidence of existing studies that would support and validate the use of these videos in
the given context. First, I searched for the works of Daniel Simons and found extensive

18
references to a term called Inattentional Blindness or IB, which is described as, “When
people attend to objects or events is a visual display, they often fail to notice an
additional, unexpected, but fully visible object of event in the same display.” (Most, et al.
2001)
Both of the videos from Dan Simons are grounded further in academic
publishings on inattentional blindness. In them, the research concludes that our visual
system can work against our ability to see the full picture in detail, the extent of this
impact being dependent on the type and frequency of visual stimulation related to task.
(Simons & Levin 1997; Krietz, et al, 2017; Stothart, et al, 2016; Simons, 2010).
Additional support for the training content regarding interactions between
Old/Fast and New/Slow brain functions is evident in the works of several researchers,
most notably in the works of Nillie Lavie (Lavie 2005; Cartwright-Finch & Lavie, 2006;
Milner & Goodale, 1998; New & German, 2015).
Learning Module I concludes with a brief review of the key terms discussed in the
section and an acknowledgement that this new awareness may be unsettling for the
audience. They now have awareness of basic cognitive functions and the ways they can
negatively impact performance, but don’t yet have the knowledge or ability to behave
differently.
Ohlsson and Allwood posit that agents must be equipped with their own triggers
to better learn from and avoid errors. To learn, one must first have awareness of the
problem space and develop a sense of urgency for addressing the problem space with
new solutions. The concepts introduced in Learning Module I are designed to prime
them for tackling the more complex concepts introduced in Learning Module II so that
19
they will be inclined to pay full attention. The concepts in Learning Module II are the
foundation for building knowledge and capabilities to produce and master one’s own
Triggers.
Constructing Learning Module II: Awareness of Cognitive Functions
Hollenbeck, et al, describe how modern advances in automation have dulled the
senses and perhaps the ability to effectively leverage triggers to avoid errors.
(Hollenbeck, et al. 1995). Certainly, today’s financial services organizations have
adopted a myriad of technology all aimed at improving speed and accuracy among their
transaction processing agents. While most of these advances are effective, they come
with the unintended consequence of dulling the agent’s senses to the point where
triggers are no longer active. To rebuild these triggers, one must reconstruct them from
the ground up. Agents will also need to learning plan to sustain the development of
triggers in the future.
With this in mind, Learning Module II introduces two related concepts to the
audience. First, there exists a need to convince the audience that their brains, in fact all
brains – regardless of past performance or current state, have the ability to learn, evolve
and grow. Once must believe that they have the ability and capacity to change if they
are to embark on a course of action that will lead to that change.
Upon an extensive search on Google using terms like, “brain change,” “brain
growth” and “cognitive function growth,” I discovered a fourteen-minute video from Dr.
Lara Boyd on the concept of “Neuroplasticity.” (Boyd 2015). Neuroplasticity did not
emerge directly from the literature review, however, for the purposes of encouraging the
learning audience that they could master their brain’s development to build their own

20
triggers, it has been included in Learning Module I. In addition to playing the video,
there is a slide that covers seven key themes from the video in easy to understand and
apply terms.
Next, drawing from Bell and Kozlowski’s (2011) research, the audience is
exposed to the four levels of cognitive function:
1. Sensorimotor Level
2. Conscious or Intellectual of Regulation
3. Level of Flexible Action Patterns
4. Overarching Heuristic Level of Regulation
This research provides a taxonomy for mastering complex tasks. Understanding
each stage, and the opportunity for errors in the part of the agent at each particular
level, may lead to a better understanding of how to prevent such errors in the future. In
short, this research provides the initial basis for rebuilding a set of triggers. However,
given the practitioner audience, these terms need to be introduced in more digestible
and relatable terms. To that end, for the purposes of Cognitive Awareness training,
they have been relabeled as:
1. The Engine
2. The Thinking Brain
3. The Playbook
4. The Director
Learning Module II discusses the four stages of cognitive function using these
simplistic terms as a reference or anchor. The stages are translated into functions that
are more accessible to the practitioner audience. For example, the fourth cognitive

21
function is described by Bell and Kozlowski as “Overarching Heuristic Level of
Regulation,” but for the training, we use more familiar imagery of a movie-set director
who sits back and observes the actors, the action, and the set as a whole, offering
guidance and input to all three systems so that the scene is perfected.
Similar to the approach taken with Learning Module 1, I conducted additional
literature reviews to support the learning concepts related to Neuroplasticity and the
multiple levels of brain function and their contribution to learning. Dr. Boyd’s assertions
in the video are grounded in a literature that supports the notion that the brain is
capable of continuous learning and restructuring. Additionally, there is sufficient
evidence to support that intentional practice can lead to changes in brain function and
composition to support improved performance. (Stothart, et al, 2015) (Voss, et al, 2011)
(Most, et al, 2005) (Boyd, et al, 2010) (Boyd, et al, 2003).
This module concludes with a summary of the two themes; Neuroplasticity and
the Four Stages of Cognitive Function. They are introduced as the formation of building
cognitive awareness and triggers to improve performance. Before the module
concludes, the audience is reminded that they will be supplied with learning tools that
will help them construct their own improved performance. Before they can begin
however, they must also learn about behavioral mechanisms and their impact on
performance.
Constructing Learning Module III: Awareness of Behavioral Mechanisms
The third and final Learning Module is dedicated to the Awareness of Behavioral
Mechanisms. Leonard and Weitz’s research speaks to the importance of feeling safe
and confident in one’s environment to perform at optimal levels. (Leonard & Weitz 1971)
22
Rotter contributes to this by describing the importance of task confidence in performing
at optimal levels. (Rotter 1996). Feather’s work introduces that agents can further
benefit from both mastery and confidence in their operating environment, balanced with
a healthy respect for their own limitations, as a means of learning from errors and
improving performance. (Feather 1969)
Following the more strenuous and complex information presented in the previous
module, Learning Module III is constructed simply. It introduces common emotions and
behaviors such as “confidence,” “fear,” and “anger” as easily identifiable emotional
states. These emotions are tied back to the lessons from Module I where we remember
that old/fast brain systems are happening automatically. They are only controlled or
inhibited by our new/slow brain functions who consciously determine whether the
perceived stimulus and corresponding emotion is justified and to what extent.
Agents are then exposed to the positive and negative ways that emotions can
impact performance before concluding that both positive and negative emotions are
useful to understanding and controlling the functions of the brain. In doing so, we are
addressing the key themes uncovered from the academic literature review. Learning
Module III concludes with a brief overview of the impact of behavioral mechanisms on
performance, tying them directly to the learnings from the prior two modules. (Pessoa,
et al, 2002)
Constructing the Conclusion and Review of Cognitive Awareness Training
The conclusion of training begins with a review of the basic learning themes from
each of the three modules. The themes are presented in a manner consistent with a
Job Aid that learners will take away from the training. Job Aids have proven useful in
23
my past training experience because they provide a readily accessible, and visible
reinforcement of the learning content. For Cognitive Awareness Training, I designed a
1-page, laminated Job Aid that is intended to be displayed at the agents’ cubicle when
they return to their work station.
Agents are also provided with a recommended strategy for enabling ongoing
learning and the formation of their own unique triggers. In Learning Module II, they
learned about the concepts of Neuroplasticity and how one can intentionally work to
build a better, more effective brain. To that end, I also designed a Cognitive Awareness
Personal Action Plan. This two-page document provide a page for the associate to
commit to by writing down the specific steps they will take to support a lasting
development of Triggers. There is also a page with recommendations on how to
leverage this plan in coaching sessions with their Supervisors to maintain learning and
development.
Additionally, knowing that adult learning takes place over time and is optimized
through collaboration with a trusted partner, I designed a Supervisor Job aid that
discusses how Supervisors can coach their agents through the development and
mastery of their own individual Triggers. As a prerequisite to Cognitive Awareness
training, all Supervisors must also complete the training program in advance of their
agents’ participation so that they are prepared to coach and reinforce the lessons
immediately upon their conclusion of training. The Supervisor Job Aid provides them
with the necessary reminders of the learning content, along with suggestions on how to
implement coaching programs to better assist the long-term development of triggers
among their agents.

24
I then designed a five-question learning assessment survey. The survey was
administered by the training facilitator at the conclusion of Cognitive Awareness training
or immediately upon returning to the agent workstation. The results of this survey
provided immediate feedback as to the effectiveness of the training content and delivery
by identifying retention of several key terms and concepts. Variations on performance
on the learning assessment may have pointed to opportunities to improve training
delivery.
Lastly, I designed a Facilitator’s guide. The facilitator’s guide describes the
talking points associated with each slide of the Cognitive Awareness Training
presentation deck. It has been designed so that professional trainers can quickly come
up to speed on the learning content, and effectively deliver Cognitive Awareness
Training, without any prior knowledge or experience with the material.
These materials are essential to the total design of the Cognitive Awareness
training program. They address the key learning terms, provide agent and Supervisor
with action plans designed to embed the learning into performance, and a facilitator’s
guide to insure consistent and effective delivery of the training content.
Experiment Design & Implementation
My primary research question is, “Will the interjection of cognitive awareness
training have a positive effect on transaction processing accuracy?” By obtaining
approval from CAT Financial to conduct my research with their transaction processing
organization, I have the opportunity conduct a controlled experiment in practice, and
obtain relevant data sets for analysis.

25
CAT Financial has transaction processing duties spread across multiple locations
in the US. They apply consistent measures across all locations which helps ensure that
geographic location are the only discernable differences between the different locations.
Agents are hired using the same recruiting tactics, and have identical job profiles. They
have a consistent on-boarding process, use the same training materials, have the same
operating systems and share a consistent environmental design. They also process
identical types of work, share the same performance expectations and coaching
programs, and are subject to identical sampling and quality review practices.
CAT Financial agreed to allow data collection from agents operating in three of
their US locations. Given the overall similarities in the populations across all three
geographic locations, my treatment protocol calls for a targeted treatment location that
received training on specific aspects of cognitive awareness, while the other two sites
did not receive the treatment and served as control groups.
As the researcher, I had access to the accuracy performance data of everyone in
the study parameters; both the treatment and control groups. I established a 120-day
Pre-treatment measurement of performance data as a benchmark, and observed the
treatment group for 90 days Post-treatment. The results of both the treatment and
control groups were analyzed to determine the likelihood of a positive effect from the
treatment protocol.
Simultaneously, I administered a survey to the entire study population. The
survey was designed to measure the respondents’ Error Orientation, using a scale
proposed by Rybowiak, Garst, Frese, and Batinic. The survey was given at the onset of
the experiment to both control and treatment populations to establish a baseline for how
26
they felt about errors that occur in the workplace. The survey was then administered at
30, 60 and again at 90-days Post-treatment. The results of the surveys were analyzed
to determine if the treatment protocol had a measurable impact on participants relative
to their error orientation; i.e., does the treatment of Cognitive Awareness Training reflect
changes in the error orientation of the respondents, or more simply, were we able to
positively increase “awareness”?
Lastly, CAT Financial conducted post-training learning assessments as part of
their standard operating procedures. The results of the post-training learning
assessments for the treatment group were anonymized and provided to the researcher
and used as a measure of the effectiveness of the training intervention (in other words,
did the training intervention have an immediate result on increasing awareness of
Cognitive states.)
These measures were necessary because it is possible the results could have
been equally confirmatory of the treatment protocol, equally dismissive of the treatment
protocol, or mixed. If the results are mixed, the difference between the two may indicate
whether an increase in awareness can exist, even when the treatment plan is
ineffective. Or, conversely, it may indicate that a successful treatment protocol can
improve performance, even when awareness is unchanged. Either way, the two studies
provided ample data sets which were of interest and relevance.
There would be great value to practice if a learning protocol can definitively
improve transaction processing accuracy without improving costs. Existing training
protocols are already embedded in the onboarding and continuing education programs
of financial services firms, but none have indicated that they are employing cognitive

27
awareness training. Should the results of my study indicate positive effect, and the
results are further replicatable across CAT Financial, the Financial Services industry,
and the investing public they serve, will reap significant benefits.

28
CHAPTER FOUR:
METHODOLOGY
Baseline
CAT Financial provided 120-days’ worth of performance data for all agents
located in the three targeted sites. The dependent variable for this study was the agent
accuracy rates over the entire 120-day Pre-experiment timeframe. Though
anonymized, the data set was coded such that each unique operator could be identified
by an individual 3-digit code randomly assigned by CAT Financial. Additionally, the
data set was encoded to identify location, tenure, and gender.
Location / Site Key Tenure Key Gender Key 1 – Site A / Treatment Site 1 – Apprentice (0-12 months) 1 - Female
2 – Site B / Modified Control
Site
2 – Novice (13-36 months) 2 - Male
3 – Site C / Control Site 3 – Expert (37+ months)
Table 1: Example of Data Coding
CAT Financial also provided total transactions processed, total selected for post-
production accuracy review, total errors identified from post-production sample set, and
the Accuracy Rate (percentage of transactions sampled without error, divided by total
transactions selected for sampling review). For example:

29
Agent ID Total Processed
Total Sampled
Errors Detected
Accuracy Rate %
001 1,000 30 02 93.3%
Table 2: Example of Accuracy Data Sample
Accuracy data sets – for both Pre-treatment 120-day samples and Post-
treatment 90-day samples – used two criteria for inclusion in the analyzed data sets.
First, agents must have completed at least 100 items during the Pre-treatment period.
Second, agents needed to have a minimum of 1.5% of their completed work sampled
for review. One hundred thirty-seven agents met these criteria.
The Error Orientation Questionnaire (EOQ) was developed from the work of
Rybowiak, et al. (1999) and implemented at 30-day intervals during the study. EOQ
measures how people feel about errors in the workplace. The 37 questions breakdown
into 8 dimensions of feeling or attitudes; 5 are positive attributes while 3 are negative
attributes:
Positive EOQ Dimensions:
1. Error Competence: Do I feel confident in my skills and abilities
2. Learning from Errors: My ability and openness to learning from my mistakes
3. Error Anticipation: Level of alertness, watchfulness, and ability to sense
danger
4. Communication about Errors: Level of comfort discussing my mistakes with
others
5. Thinking about Errors: Reflective state where we internally process mistakes

30
Negative EOQ Dimensions:
1. Error Risk Taking: Overconfidence – taking risks and acting while uncertain
2. Error Strain: Overly concerned with the possibility of making an error
3. Error Cover-up: Seeking to hide or obscure the errors you make
Responses for each of the 37 questions were assigned a numerical value from 1-
5 and the values of these answers were summed and averaged for each of the eight
dimensions. Scores for the three negative dimensions were reversed for scoring, such
that any survey response of “5” would receive a value of “1”, responses of “4” would
receive value of “2” and so on. This allows for total scores to be calculated with Positive
and Negative dimensions contributing to the final EOQ score consistently. The total
sum of scores for the eight dimensions represents the cumulative EOQ score where the
highest possible overall score was 40 and the lowest was 8. The 50% mark would
therefore be a score of 24.
31
CHAPTER FIVE:
RESULTS
Data gathered throughout the experiment is used to test the validity of the three
hypotheses proposed in this study. The first dependent variable is accuracy, where
differences in Pre- and Post-treatment transaction processing rates will be evaluated.
The second dependent variable will be Error Orientation Questionnaire (EOQ)
cumulative scores which indicate how agents feel about errors in the workplace.
Additionally, three independent variables are evaluated to identify their influence
on dependent variables; gender, tenure and location. I tracked differences between
male and female throughout the experiment, and CAT Financial provided access to their
transaction processing agents in three locations that were geographically separated by
a minimum of 1,000 miles:
1. Site-1: Received full Cognitive Awareness Training treatment protocol
2. Site-2: Received only a one-page hand-out reinforcing CAT Financial’s
accuracy coaching principles
3. Site-3: Control group – received no treatment of any kind.
Tenure, or time in role, served as a proxy for task proficiency and is divided into
three groups:
1. Apprentice: 0-12 months tenure at the beginning of the experiment
2. Novice: 13-36 months tenure at the beginning of the experiment

32
3. Expert: 37+ months tenure at the beginning of the experiment
Location Tenure Mean Accuracy Standard Deviation All Sites ALL 89.31% 12.71% Apprentice 83.54% 17.36%
Novice 89.42% 8.07%
Expert 94.30% 6.34%
Site-1 ALL 90.02% 9.70% Apprentice 81.49% 8.83%
Novice 87.44% 10.94%
Expert 95.67% 4.71%
Site-2 ALL 87.40% 16.59% Apprentice 79.28% 27.80%
Novice 88.74% 6.83%
Expert 92.22% 6.70%
Site-3 ALL 91.07% 8.53% Apprentice 88.17% 8.17%
Novice 91.74% 8.45%
Expert 95.07% 7.34%
Table 3: Pre-Treatment Measures of Accuracy
Pre-Treatment Analysis
Overall, Site-3 had the highest overall accuracy during the pre-treatment period,
with Site-2 the lowest, and Site-1 in between.
33
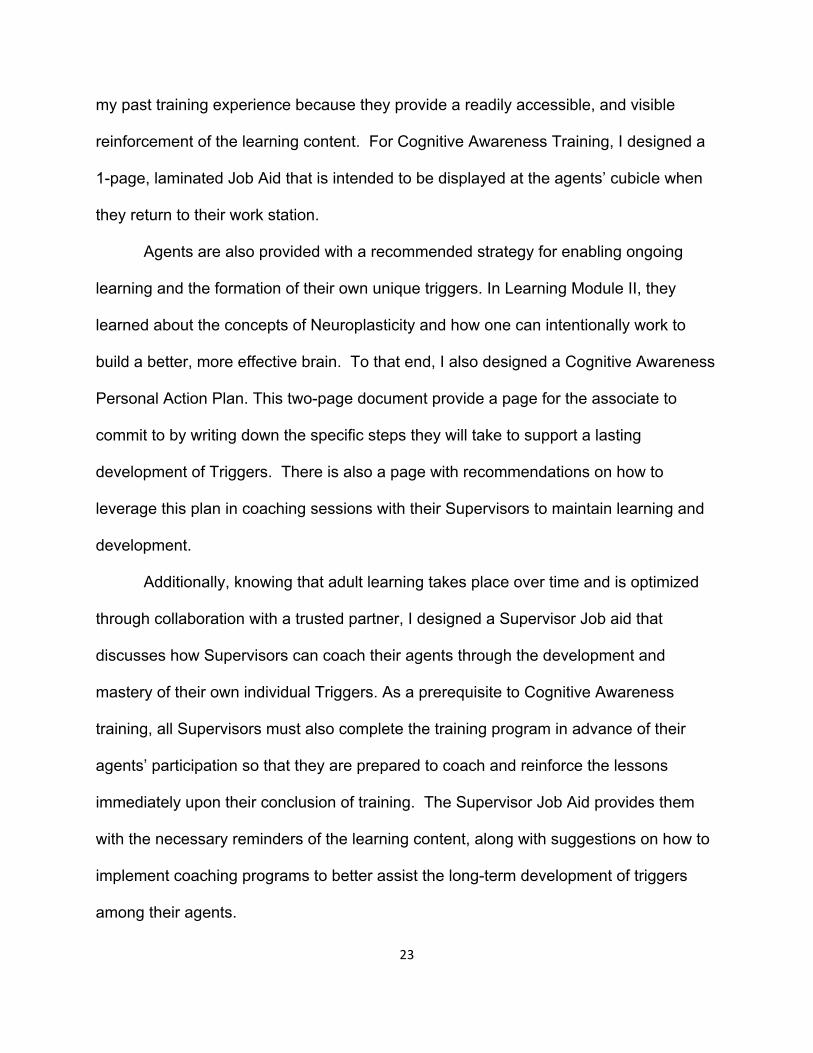
Figure 2: Pre-Treatment Accuracy Rate by Tenure
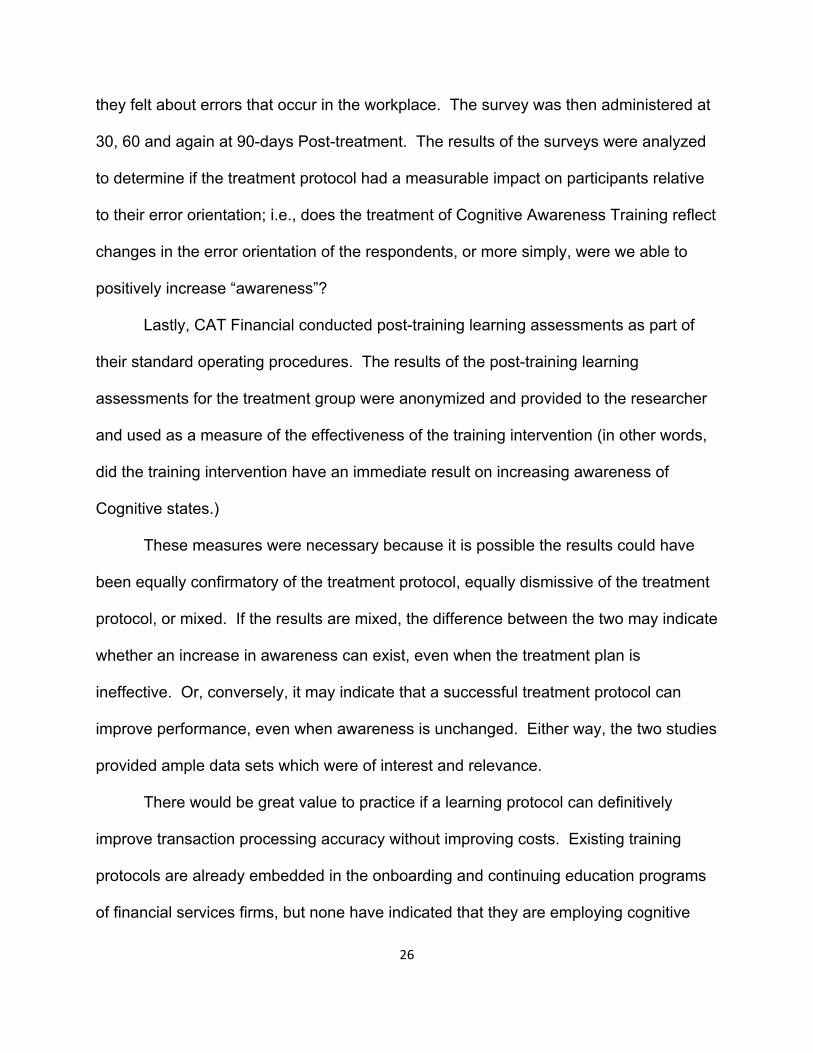
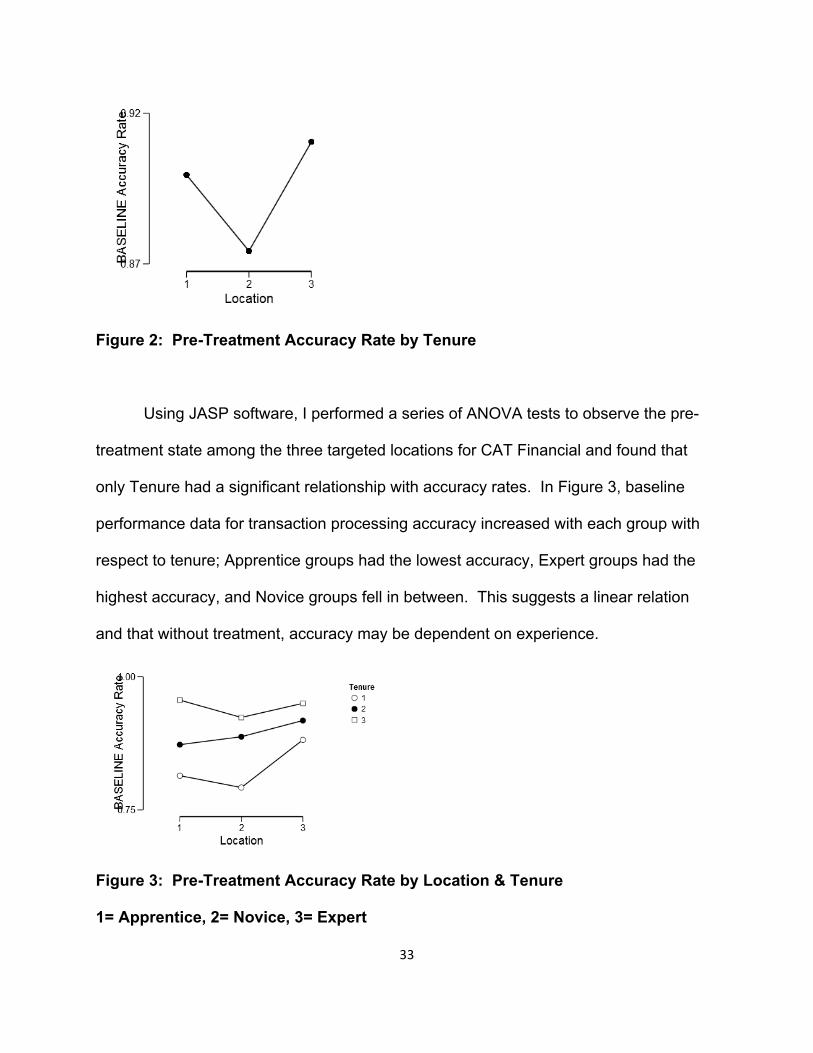
Using JASP software, I performed a series of ANOVA tests to observe the pre-
treatment state among the three targeted locations for CAT Financial and found that
only Tenure had a significant relationship with accuracy rates. In Figure 3, baseline
performance data for transaction processing accuracy increased with each group with
respect to tenure; Apprentice groups had the lowest accuracy, Expert groups had the
highest accuracy, and Novice groups fell in between. This suggests a linear relation
and that without treatment, accuracy may be dependent on experience.
Figure 3: Pre-Treatment Accuracy Rate by Location & Tenure
1= Apprentice, 2= Novice, 3= Expert

34
Next, I observed differences relating to gender (Figure 4). In all three sites,
Female agents had a higher mean performance than their male counterparts, but this
difference was not statistically significant.
Figure 4: Pre-Treatment Accuracy Rate by Location & Gender
1 = Female, 2 = Male
Cases Sum of Squares
df Mean Square
F p
Location 0.019 2 0.01 0.674 0.512
Tenure 0.201 2 0.1 7.008 0.001
Gender 0.026 1 0.026 1.83 0.179
Location ✻ Tenure 0.021 4 0.005 0.367 0.832
Location ✻ Gender 0.01 2 0.005 0.357 0.701
Tenure ✻ Gender 0.055 2 0.027 1.921 0.151
Location ✻ Tenure ✻ Gender 0.03 4 0.007 0.523 0.719
Residual 1.703 119 0.014

35
Table 4: Pre-Treatment Accuracy ANOVA Results by Location, Gender, and
Tenure
Lastly, I compared the results of the baseline EOQ survey, issued at the beginning of
March prior to treatment initiation. There were 81 valid and complete responses.
Interestingly, I found an inverse relationship to pre-treatment accuracy levels (Figure 5).
At this juncture, Site-2 had the highest EOQ scores, with Site-3 the lowest, and Site-1 in
the middle.
Figure 5: Pre-Treatment EOQ cumulative scores by Location
Running ANOVA tests on pre-treatment EOQ survey results, I also found no
significant differences by location, tenure, or any interactions. Figures 6 shows wide
variation in EOQ scores when observing the relationship between of tenure and
location. Table 5 shows the ANOVA results where none of the independent variables
have a relationship to EOQ.

36
Figure 6: Pre-Treatment EOQ cumulative scores by Location & Tenure
1 = Apprentice, 2= Novice, 3= Expert
Cases Sum of Squares
df Mean Square
F p
Location 28.55 2 14.274 1.599 0.211
Gender 18.96 1 18.962 2.124 0.151
Tenure 21.22 2 10.611 1.189 0.312
Location ✻ Gender 18.41 2 9.205 1.031 0.363
Location ✻ Tenure 63.78 4 15.945 1.786 0.145
Gender ✻ Tenure 15.85 2 7.924 0.888 0.417
Location ✻ Gender ✻ Tenure 27.29 2 13.645 1.528 0.226
Residual 499.97 56 8.928
Table 5: Pre-Treatment EOQ ANOVA Results by Location, Gender, and Tenure
Post-Treatment Analysis
For the post-treatment data sets, I applied the same criteria for accuracy data set
inclusion. Agents needed to have a minimum of 100 transactions processed and 1.5%
of work sampled to be qualified for inclusion. There were 128 agents who met these
criteria during the post-treatment evaluation period (Table 6).

37
Location Tenure Mean Accuracy Standard Deviation All Sites ALL 90.01% 9.35% Apprentice 85.80% 9.71%
Novice 87.93% 7.56%
Expert 93.26% 8.73%
Site-1 ALL 91.47% 8.27% Apprentice 84.90% 8.76%
Novice 84.03% 5.06%
Expert 95.48% 5.51%
Site-2 ALL 90.24% 9.19% Apprentice 86.16% 11.64%
Novice 89.09% 7.53%
Expert 94.53% 5.33%
Site-3 ALL 88.62% 10.23% Apprentice 86.08% 5.52%
Novice 88.22% 7.96%
Expert 89.74% 12.19%
Table 6: Post-Treatment Accuracy Results by Location and Tenure
Mean accuracy across all three locations was 90.01%, a minimal overall change
from the Pre-Treatment mark of 89.31%. At this juncture, Site-1 had the highest overall
accuracy, followed by Site-2 and Site-3. Similar to the Pre-Treatment analysis, there
appears to be a relationship between the dependent variable of accuracy and
independent variables of location and tenure. Sites 1 & 2 continued to have the highest
overall accuracy present in their Expert populations, however the relationships between
tenure and accuracy changed during the Post-Treatment period.
In the Pre-Treatment state, accuracy had a linear relationship with tenure across
all locations; Apprentice had the lowest accuracy, Novice were better, and Experts were

38
the best. In the Post-Treatment state, only Site-2 retained this linear relationship. In
Site-1, Experts continued to have the highest accuracy, but Apprentice accuracy was
slightly better than Novice accuracy. In Site-3, the Novice population had the highest
overall accuracy, followed by Expert, and lastly, the Apprentice population. (Figure 7)
Figure 7: Post-Treatment Accuracy Results by Location and Tenure
I performed ANOVA test to evaluate the statistical significance and found that
tenure appears to have a relationship with accuracy. Location alone has no interaction.
While the combination between tenure and location is not statistically significant for the
total population, the improved p-values offer the possibility of an interaction that may be
worth further exploration and evaluation. (Table 7)

39
Cases Sum of Squares
df Mean Square
F p
Location 0.014 2 0.007 0.911 0.405
Tenure 0.075 2 0.038 4.778 0.010
Gender 0.006 1 0.006 0.701 0.404
Location ✻ Tenure 0.060 4 0.015 1.902 0.115
Location ✻ Gender 0.029 2 0.014 1.825 0.166
Tenure ✻ Gender 0.003 2 0.001 0.166 0.847
Location ✻ Tenure ✻ Gender 0.015 4 0.004 0.490 0.743
Residual 0.864 110 0.008
Table 7: Post-Treatment Accuracy ANOVA results
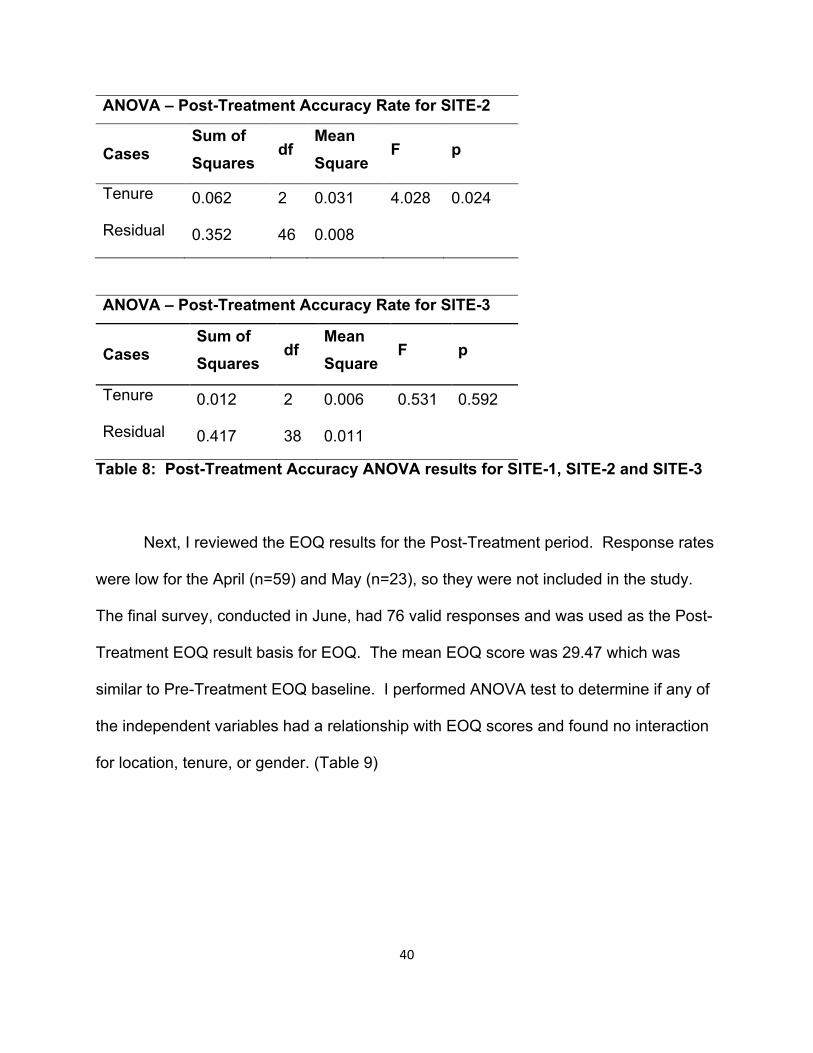
Given these results, I also performed a 1-way ANOVA test for interaction
between tenure and accuracy within each independent location. I found that Site-1 had
a statistically significant relationship between tenure and accuracy. Site-2 had a weaker
but still significant relationship, while Site-3 had no relationship. (Table 8)
ANOVA – Post-Treatment Accuracy Rate for SITE-1
Cases Sum of Squares
df Mean Square
F p
Tenure 0.105 2 0.053 11.87 < .001
Residual 0.155 35 0.004
40
ANOVA – Post-Treatment Accuracy Rate for SITE-2
Cases Sum of Squares
df Mean Square
F p
Tenure 0.062 2 0.031 4.028 0.024
Residual 0.352 46 0.008
ANOVA – Post-Treatment Accuracy Rate for SITE-3
Cases Sum of Squares
df Mean Square
F p
Tenure 0.012 2 0.006 0.531 0.592
Residual 0.417 38 0.011
Table 8: Post-Treatment Accuracy ANOVA results for SITE-1, SITE-2 and SITE-3
Next, I reviewed the EOQ results for the Post-Treatment period. Response rates
were low for the April (n=59) and May (n=23), so they were not included in the study.
The final survey, conducted in June, had 76 valid responses and was used as the Post-
Treatment EOQ result basis for EOQ. The mean EOQ score was 29.47 which was
similar to Pre-Treatment EOQ baseline. I performed ANOVA test to determine if any of
the independent variables had a relationship with EOQ scores and found no interaction
for location, tenure, or gender. (Table 9)

41
Cases Sum of
Squares df
Mean
Square F p
Location 0.705 2 0.352 0.044 0.957
Tenure 14.041 2 7.021 0.868 0.425
Gender 10.162 1 10.162 1.257 0.267
Location ✻ Tenure 2.883 3 0.961 0.119 0.949
Location ✻ Gender 4.61 2 2.305 0.285 0.753
Tenure ✻ Gender 18.785 2 9.392 1.162 0.32
Location ✻ Tenure ✻ Gender 1.345 2 0.673 0.083 0.92
Residual 493.135 61 8.084
Table 9: Post-Treatment EOQ ANOVA results by location, tenure, and gender
I also observed that when evaluating EOQ results by each independent location,
EOQ scores decreased in a linear fashion with tenure. Site-1’s Apprentice population
was absent from the Tenure analysis of EOQ as they had been rotated to a different
assignment by CAT Financial prior to the administration of the final EOQ survey.

42
TENURE Populations: 1= Apprentice, 2= Novice, 3=Expert
SITE-1 POST-TREATMENT EOQ BY TENURE
SITE-2 POST-TREATMENT EOQ BY TENURE
SITE-3 POST-TREATMENT EOQ BY TENURE
Figure 8: Post-Treatment EOQ ANOVA results for SITE-1, SITE-2, and SITE-3
Analysis of Change Between Pre- and Post-Treatment States and the Relationship
Between Accuracy and EOQ
In calculating the differences between Pre- and Post-Treatment periods for
accuracy, I observed only the populations who had met the minimum criteria of 100+
items processed and a minimum 1.5% sample rate for both Pre- and Post-Treatment
periods. In terms of accuracy, there were 114 agents who met these criteria.
43
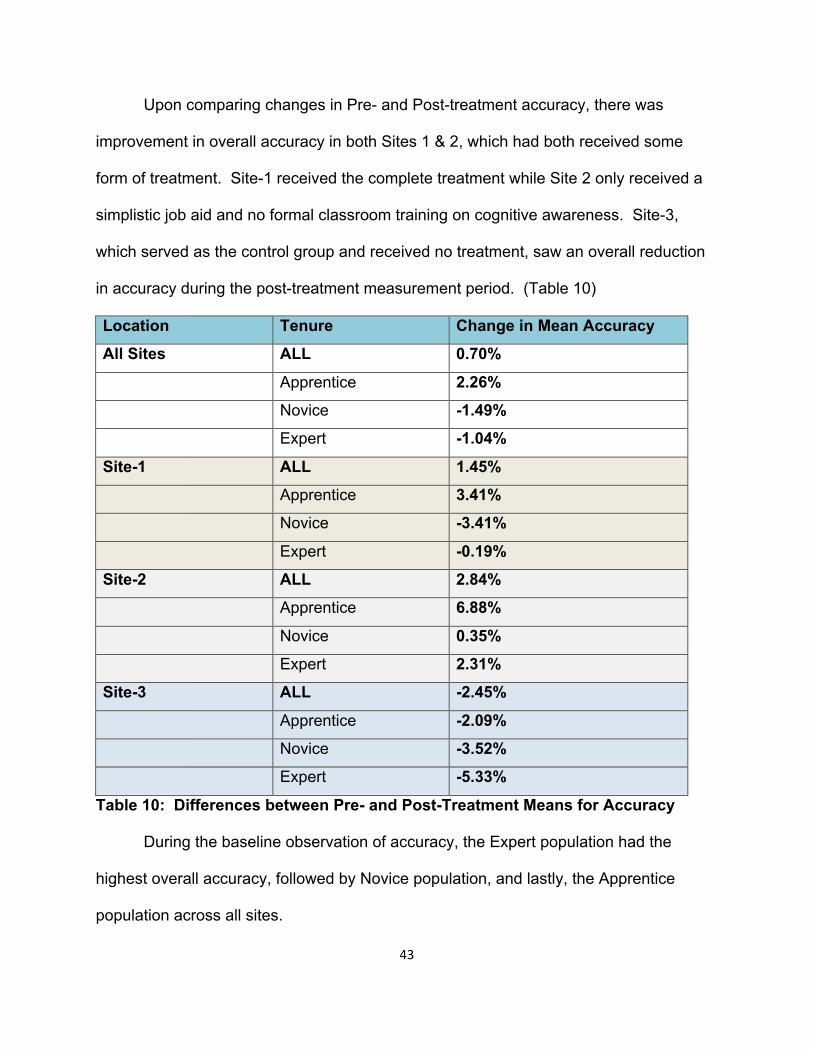
Upon comparing changes in Pre- and Post-treatment accuracy, there was
improvement in overall accuracy in both Sites 1 & 2, which had both received some
form of treatment. Site-1 received the complete treatment while Site 2 only received a
simplistic job aid and no formal classroom training on cognitive awareness. Site-3,
which served as the control group and received no treatment, saw an overall reduction
in accuracy during the post-treatment measurement period. (Table 10)
Location Tenure Change in Mean Accuracy All Sites ALL 0.70% Apprentice 2.26% Novice -1.49% Expert -1.04% Site-1 ALL 1.45% Apprentice 3.41% Novice -3.41% Expert -0.19% Site-2 ALL 2.84% Apprentice 6.88% Novice 0.35% Expert 2.31% Site-3 ALL -2.45% Apprentice -2.09% Novice -3.52% Expert -5.33%
Table 10: Differences between Pre- and Post-Treatment Means for Accuracy
During the baseline observation of accuracy, the Expert population had the
highest overall accuracy, followed by Novice population, and lastly, the Apprentice
population across all sites.
44
Site-2, which received the minimal treatment protocol, and which had the highest
EOQ scores for both Pre- and Post-Treatment periods, saw improvement across all
tenure populations. The coaching form they were provided with was based off of CAT-
Financial’s core training and served as a reinforcement of commonly discussed
accuracy principles. Site-1, who received the full Cognitive Awareness Training
protocol, saw an increase in the Apprentice population’s accuracy, but decreases in the
Novice and Expert population’s accuracy.
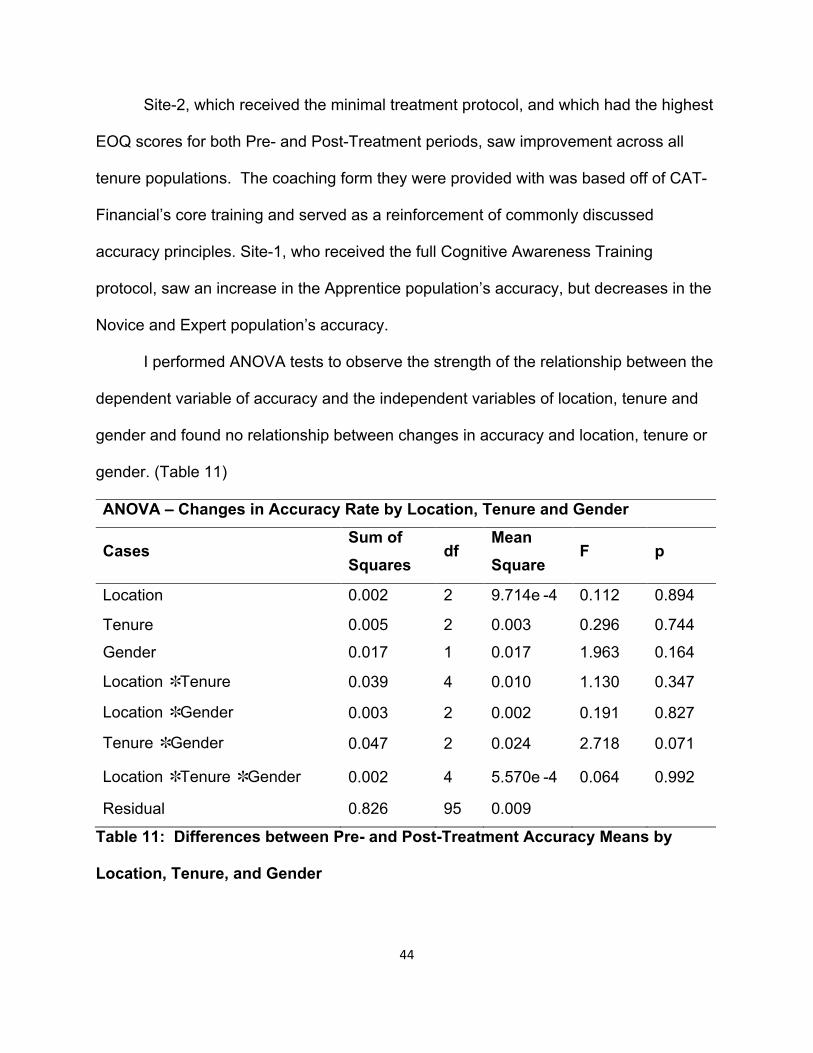
I performed ANOVA tests to observe the strength of the relationship between the
dependent variable of accuracy and the independent variables of location, tenure and
gender and found no relationship between changes in accuracy and location, tenure or
gender. (Table 11)
ANOVA – Changes in Accuracy Rate by Location, Tenure and Gender
Cases Sum of Squares
df Mean Square
F p
Location 0.002 2 9.714e -4 0.112 0.894
Tenure 0.005 2 0.003 0.296 0.744
Gender 0.017 1 0.017 1.963 0.164
Location ✻ Tenure 0.039 4 0.010 1.130 0.347
Location ✻ Gender 0.003 2 0.002 0.191 0.827
Tenure ✻ Gender 0.047 2 0.024 2.718 0.071
Location ✻ Tenure ✻ Gender 0.002 4 5.570e -4 0.064 0.992
Residual 0.826 95 0.009
Table 11: Differences between Pre- and Post-Treatment Accuracy Means by
Location, Tenure, and Gender
45
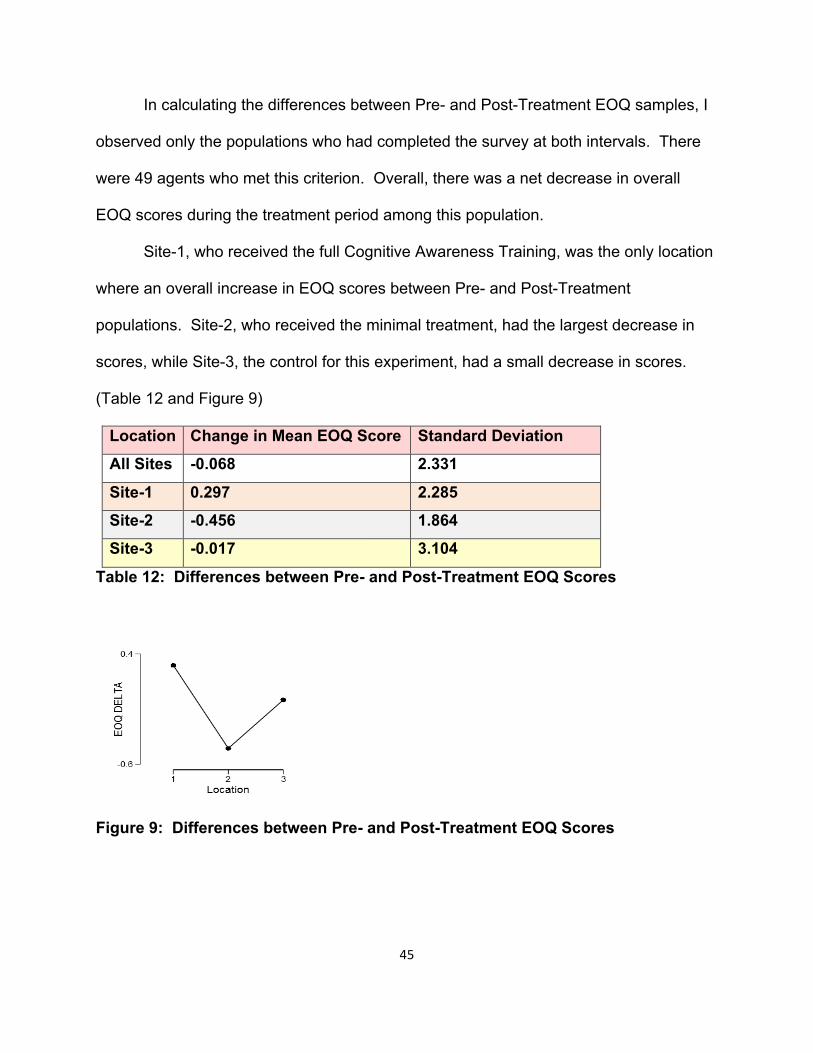
In calculating the differences between Pre- and Post-Treatment EOQ samples, I
observed only the populations who had completed the survey at both intervals. There
were 49 agents who met this criterion. Overall, there was a net decrease in overall
EOQ scores during the treatment period among this population.
Site-1, who received the full Cognitive Awareness Training, was the only location
where an overall increase in EOQ scores between Pre- and Post-Treatment
populations. Site-2, who received the minimal treatment, had the largest decrease in
scores, while Site-3, the control for this experiment, had a small decrease in scores.
(Table 12 and Figure 9)
Location Change in Mean EOQ Score Standard Deviation All Sites -0.068 2.331 Site-1 0.297 2.285 Site-2 -0.456 1.864 Site-3 -0.017 3.104
Table 12: Differences between Pre- and Post-Treatment EOQ Scores
Figure 9: Differences between Pre- and Post-Treatment EOQ Scores

46
I then performed an ANOVA test of these variables and found significant effects
for location, gender, location by tenure, and location by gender. (Table 13) Population
samples were limited due to staff attrition throughout the life of the survey. It is
therefore impractical to perform additional analysis of the sub-populations to determine
the nature and direction of the effects of EOQ surveys on the populations. With that
said, the impact of error management culture as measured by EOQ surveys points
toward a general effect, which is of interest.
Cases Sum of Squares
df Mean Square
F
Location 28.4 2 14.2 3.499 0.041
Tenure 10.396 2 5.198 1.281 0.29
Gender 23.101 1 23.101 5.693 0.022
Location ✻ Tenure 36.29 3 12.097 2.981 0.044
Location ✻ Gender 27.852 2 13.926 3.432 0.043
Tenure ✻ Gender 6.607 1 6.607 1.628 0.210
Location ✻ Tenure ✻ Gender 0.618 1 0.618 0.152 0.699
Residual 146.084 36 4.058
Table 13: ANOVA of EOQ Score Change by Location, Tenure, and Gender for
Population Available in Both Pre- and Post-Treatment States
I looked for correlation between changes in accuracy rates and EOQ scores
using Pearson Correlation analysis. In all, there were 40 CAT Financial agents who met
the criteria of having 100+ items processed and a minimum of 1.5% of their work
sampled during both Pre- and Post-treatment evaluations, and who had complete Pre-
and Post-EOQ surveys. There was a negative correlation between accuracy rates and

47
EOQ scores for the entire sample but the relationship was not statistically significant.
(Table 14)
Accuracy Delta
EOQ DELTA
Accuracy
Delta
Pearson's r — -0.166
p-value — 0.269
EOQ
DELTA
Pearson's r —
p-value —
Table 14: Pearson Correlation Analysis of Accuracy and EOQ Scores for CAT
Financial
I also tested sub populations by location, tenure and gender and found no relationship
between accuracy and EOQ. (Table 15).
Accuracy Delta
EOQ DELTA
Accuracy
Delta
Pearson's r — -0.355
p-value — 0.075
EOQ
DELTA
Pearson's r —
p-value —
Table 15: Pearson Correlation Analysis of Accuracy and EOQ Scores
I also observed the data sets from Site-1’s population. There were 18 agents
from Site-1 who met the following criteria; 100+ transactions processed in both Pre- and
Post-Treatment periods, EOQ Survey responses from both Pre- and Post-treatment
periods, and completion of the Post-Training Learning Assessment (PTLA) issued by

48
the trainer immediately upon completion of Cognitive Awareness Training. The data
suggests an interaction between independent variables of Gender and PTLA with the
dependent variable of change in accuracy rates, but no interaction between the same
and EOQ change. (Table 16)
ANOVA - Accuracy Delta
Cases Sum of Squares
df Mean Square
F p
Tenure 1.185e -4 1 1.185e -4 0.046 0.835
Gender 0.064 1 0.064 24.732 < .001
PTLA 0.052 3 0.017 6.761 0.011
Tenure ✻ Gender 0.022 1 0.022 8.479 0.017
Tenure ✻ PTLA 0 0
Gender ✻ PTLA 0.045 2 0.023 8.756 0.008
Tenure ✻ Gender ✻ PTLA 0 0
Residual 0.023 9 0.003
Table 16: Pearson Correlation Analysis of Accuracy and EOQ Scores for Female
Population

49
Cases Sum of Squares
df Mean Square
F p
Tenure 10.207 1 10.207 1.926 0.199
Gender 4.179 1 4.179 0.789 0.398
PTLA 3.821 3 1.274 0.240 0.866
Tenure ✻ Gender 0.084 1 0.084 0.016 0.903
Tenure ✻ PTLA 0 0
Gender ✻ PTLA 1.610 2 0.805 0.152 0.861
Tenure ✻ Gender ✻ PTLA 0 0
Residual 47.692 9 5.299
ANOVA - EOQ Delta
Lastly, I evaluated the qualitative data obtained from interviews with CAT
Financial’s Transaction Processing Group’s management team. Two consistent themes
of these interviews were “Overtime” and “Busy Season.” The volume and complexity of
CAT Financial’s transaction work increased dramatically in the first two months of the
Post-Treatment evaluation period (March and April) before falling off sharply in the final
month (May). This resulted in increased overtime and stress among all agents, but
particularly so amongst the Expert population.

50
CHAPTER SIX:
DISCUSSION
The purpose of this experiment was to determine if a targeted treatment of
Cognitive Awareness training could improve agents’ ability to process transactions
accurately and to determine if Error Management Culture had a mitigating effect on the
success of that training. The experiment collected baseline data from a large US-based
financial services firm for 120 days prior to the commencement of the experiment. After
treatment protocols were introduced, 90-days’ worth of accuracy data and measures of
Error Management Culture were gathered and analyzed.
H1: A Targeted Treatment of Cognitive Awareness Training Programs Will Have a
Positive Effect on Transaction Processing Accuracy.
Regarding the first hypothesis, that data does not support the hypothesis. In the
Pre-Treatment analysis of accuracy, there was a linear relationship between the
dependent variable of accuracy and tenure. That relationship was consistent across all
locations. Although the results are not statistically significant with respect to changes in
accuracy, the Post-Treatment analysis of accuracy favors improvements in the two
locations that received some form of Cognitive Awareness Training.
Site-1 received the complete training protocol, consisting of a 90-minute cognitive
awareness training program, a cognitive awareness job aid, and coaching guides for

51
both manager and agent. They had the highest overall accuracy in the Post-Treatment
period. The Apprentice population of Site-1 had an increase between Pre- and Post-
Treatment accuracy rates, while Novice and Expert populations saw a decrease. The
results of the experiment were, however, not significant to imply cause.
In Site-2, where the population only received a reinforcing coaching guide that
mirrored CAT Financial’s common coaching principles for accuracy, all populations had
an increase in accuracy rates during the experiment, with the largest overall increase of
any population during the study coming from Site-2’s Apprentice population.
Site-3, who served as a control, posted the lowest overall accuracy rate during
the Post-Treatment period. All three tenure groups experienced a decrease in their
accuracy rates with the largest coming from the Expert population, followed by Novice.
Although the ANOVA results of the change in accuracy don’t indicate a
relationship between location and accuracy, and thus Cognitive Awareness Training
and accuracy, the results are directionally aligned with the expected outcome.
Qualitative follow-up after the study indicated that the experiment took place during a
rather turbulent time for CAT Financial, where complexity of task and volume peaked.
Absent of any form of Cognitive Awareness Training, Site-3 experienced declines in
accuracy across all tenure groups and went from having the highest overall accuracy
across CAT Financial’s locations to the lowest overall accuracy. Conversely, Sites 1 & 2
saw improvement in their overall accuracy rates.
One possible explanation is that Cognitive Awareness Training may have
overcome the otherwise complex and intense environments experienced during the
Treatment period, allowing Sites 1 and 2 to maintain or improve their overall fitness
52
while Site 3, absent of any cognitive reinforcement, saw across the board declines in
accuracy.
Additionally, ANOVA tests of Post-Treatment accuracy data of all three locations
indicates that Tenure and Accuracy have the strongest interaction in Site-1, the location
of the full Cognitive Awareness Training, followed by Site-2, the location that received
only a modest treatment. In Site-3, the control location, there is no evidence to support
an interaction between tenure and accuracy during the Post-Treatment period. This
finding poses new questions as to whether or not Cognitive Awareness Training may
have a positive impact on maintaining the linear relationship between experience and
accuracy during periods of increased activity and complexity among the agents.
Apprentice populations in both treatment locations saw the largest overall
increase in accuracy during the experiment, while the same group in the Control
location saw a decrease in accuracy. Although Apprentice populations in all three
locations had the lowest accuracy both before and after Treatments, only the Apprentice
populations exposed to some form of Cognitive Awareness Training saw an increase in
accuracy. If accuracy alone is linearly dependent on tenure and experience, we would
expect to see similar results across the entirety of the Apprentice populations. The
differences in accuracy by location suggest that there is an additional variable
interacting with Tenure on overall Accuracy.
One limitation of this study was the variability of agents over the 5 months of
observation. The turnover in agent population left sub-optimal data sets for comparing
Pre- and Post-Treatment populations. Future studies should account for this by either
conducting the experiment within organizations with less variation and turnover among

53
their employee population, or by expanding the sample set to allow for sufficient
analysis of the populations throughout the duration of the study period.
Further research should be conducted to determine if Cognitive Awareness
Training programs, adjusted to match the agent’s level of task proficiency, produce
similar results.
H2: A targeted treatment of cognitive awareness training programs will increase the
Error Orientation of transaction processing agents.
The results of this experiment support H2. The Error Orientation Questionnaire
(EOQ) is a validated scientific instrument for measuring the overall health of the Error
Management Culture (EMC) within a population. With that said, there’s not a broad
enough body of evidence in the literature to compare CAT Financial’s results to and
determine if their existing ECM was healthy or not. This is a limitation of the experiment
design.
I did observe modest improvements in EOQ across all three locations during the
experiment. Site-1, the recipient of the full cognitive awareness training protocols
certainly had a positive increase in EOQ scores during the experiment, suggesting that
cognitive awareness training may have a positive effect on EMC dynamics. They also
were the only site who had positive gains in EOQ scores among agents who were
present throughout the experiment.
While serving as the control group, Site-3 had the largest improvement in EOQ
scores across its’ entire population at the time of the final sampling. However, Site-3’s
population of EOQ respondents who were present in the data throughout the life of the
experiment actually demonstrated a modest decrease in overall EOQ. This suggests

54
that changes in ECM are influenced by something other than the introduction of
cognitive awareness training, regardless of the level or intensity or presence of
Cognitive Awareness training.
The EOQ samples used as the basis of this experiment were not large enough or
consistent enough to allow for tabulation and analysis at the sub-category by gender,
tenure, and location dynamics. There were only 42 individual agents who voluntarily
participated in both Pre- and Post-treatment EOQ exercises. Additional surveys should
be offered to build a large enough sampling of Pre- and Post-treatment changes in
EOQ. This should be done to better determine the key influencers of ECM by breaking
down the eight sub-components of the EOQ model; Error Competence, Learning from
Errors, Error Risk Taking, Error Strain, Error Anticipation, Covering up Errors,
Communication about Errors, and Thinking about Errors.
H3: Improved Accuracy and Increased Error Orientation Are Positively Correlated
H3 is also not supported by the results of this experiment. Pearson Correlation
analysis indicates an absence of a relationship between improvements in accuracy and
EOQ scores.
Site-1, the primary recipient of cognitive awareness training had improvements in
both accuracy and EOQ during the experiment. However, underlying changes in the
population dynamics of Site-1 during the experiment failed to produce sufficient data for
analysis. Site-1’s Apprentice population had rotated to a new business area before the
final EOQ measurement was administered, and thus were not available for final
analysis.

55
Interestingly, the site with the highest Pre-Treatment EOQ score, Site-2, is also
the only location where an increase in accuracy across all three populations of tenure.
They also experienced the highest overall increase in accuracy across all three tenure
populations.
Though the data obtained from this experiment does not yield statistical
significance for this correlation, the study findings suggest that the direction of the
outcomes may yield more statistically significant values that support the hypothesis.
The data sets vary greatly across locations and thus fail to support the premise
that changes in transaction processing accuracy are affected by are not correlated to
the presence or absence of cognitive awareness training. The sample size for this
population was relatively small at 40 participants, and sub groups based on
independent variables of location, gender, and tenure do not bear significance.
Continued research and measurements are required to gain a large enough sample
size that would allow for meaningful interpretation of the correlation between
populations who received Cognitive Awareness Training and those who do not.
56
CHAPTER SEVEN:
CONCLUSIONS
The results of this research offer intriguing possibilities for both academics and
practitioners. While there was greater improvement in transaction accuracy among the
target group who received cognitive awareness training, the results were in fact, not
statistically significant. The experiment was hampered by the longitudinal design
because of the turnover within the total population over the seven months of the
program. This created smaller samples sizes of the sub-populations than expected.
Future experiments should account for this by either expanding the population sample
size, shortening the duration of the study, or both. A larger sample size may offer
stronger statistical significance that more clearly supports or refutes the hypotheses
offered in this study.
Practitioners should continue to explore ways where they can advance their agent
populations’ awareness of cognitive abilities and the positive impact of these behaviors
on performance.
This research contributes to the growing body of work of two existing research domains;
inattentional blindness and error management culture. Researchers should continue to
investigate the impact of cognitive awareness training protocols on performance, along
with the interrelated effects of error management culture and evaluation techniques as
proposed by the ACE construct.

57
CHAPTER EIGHT:
APPENDIX: DEFINITION OF A TRANSACTION
For readers who are unfamiliar with the world of transaction processing in
financial services, the key concept to understand is “variability.” While the nature of the
work may seem like a simplistic data entry process, it’s not. The realm of financial
services is dictated by multiple federal, state, and industry regulations, in addition to
each financial institution’s proprietary business rules.
What is permissible for one client, may not be permissible for another, given their
state of residence. Additionally, different account registrations require the application of
different rules. A transaction for an individually owned account will be different than a
joint ownership established under Joint Tenants with Rights of Survivorship, which is
different than Joint Tenants in Common, which is different for assets owned by a Trust
registration, Corporate Registration, Qualified Retirement Plan and Non-Qualified
Retirement Plan registration, and so on. Add in an additional layer of complexity due to
the nature of the assets being transacted (i.e., an open-end Mutual Fund, Exchange
Traded Mutual Fund, a Closed-End Mutual Fund, and individual corporate stock, a
municipal, government, foreign, or corporate bond, etc.) and the degrees of variability
are astounding.
For the purposes of this study and experiment, a transaction is defined as;
58
“The act of an agent interpreting written instructions from a client, evaluating the
instructions for accuracy and authenticity, applying appropriate business rules, entering
data into a system of record such that the client’s transaction is processed.”
Examples of the types of transactions are generally divided into two primary
categories; Financial and Non-Financial. Regulations require that most Financial
transactions must be completed same-day of receipt (due to the constant movement of
valuations in the open markets), while Non-Financial transactions may be completed
within several days of receipt.
Examples of Financial transactions include, but are not limited to; purchase of
asset shares, redemption or sales of asset shares, permissible contributions into
qualified retirement plans, permissible distributions from qualified retirement plans,
transfer of ownership of assets between two distinct registrations, exchange of assets
between identically registered accounts, transfer of assets between two distinct financial
services institutions, establishing or modifying systematic reoccurring financial
transactions (such as automatic purchase of sale of a specific dollar amount into/from
the same asset, or the systematic rebalancing of an entire portfolio to maintain a
specific ratio of portfolio asset composition), and tax-efficient transactions (transactions
designed to minimize the tax consequences of certain portfolio holdings.)
Examples of Non-Financial transactions include, but are not limited to; account
set-up, addition or maintenance of personal information (such as name, address,
beneficiary changes, etc.), establishing services (such as on-line trading authorization,
trading privileges, linking of bank accounts to facilitate money movement, etc.), various
demographic information (such as on-line passwords and User Names, phone numbers,

59
e-mail addresses, etc.), and regulatory oversight requirements (such as Patriot Act,
Anti-Money Laundering checks, Abandon Property rights and escheatment).
Lastly, there’s the transaction processing environment. For my experiment, I was
able to observe CAT Financial’s operating environment – the environment used by
agents in their daily work – but I have also been able to observe the same environment
in four other US Financial Services firms. In general, agent work queues are driven by
one system. Work queue systems generally image and categorize work requests so
that agents can access them on their desktop across multiple locations. Certainly, this
was also the case with CAT Financial.
Additionally, there are recordkeeping systems where the transactions are
completed and where the associated client account and portfolio records reside.
Depending on the type of registration or security being processed, agents may need to
navigate between one and three different systems to complete certain transactions.
Then, there’s the application of a set knowledge base. Firms like CAT Financial have
automated their knowledge base so that agents can more easily access procedure
guides and business rules to help them navigate the complex landscape of financial
services. Other firms still rely on paper manuals, notes and memos to maintain
compliance with appropriate business rules and regulations.
Throughout all of this, agents must seamlessly tie these various input sources
together (work image, system of record, knowledge base) to complete each transaction.
While some transactions “look” identical to one another, there are often minute
differences that need to be accounted for in each and every transaction. To that end,

60
agents who assume they know what they’re doing are more at risk of missing important
details that could mean the difference between getting it right and getting it wrong.
Given the complexity of this landscape, its easy to understand why human
agents are still required for processing many financial service transactions. Although
companies, like CAT Financial, have automated upwards of 90% of their transaction
volume, there still remains a critical and complex maze of transactions that require
human intervention. As computing technology advances, and artificial intelligence
becomes more accessible, transactions will continue to become more automated and
less dependent on humans. For the immediate and foreseeable future, firms will
continue to be reliant on talented human agents to complete the daily volume of
financial services transactions that their clients depend on.

61
CITATIONS
Allwood, Carl Martin (1984). Error Detection Processes in Statistical Problem Solving.
Cognitive Science, Vol 8, 413-437.
AsapSCIENCE. "Brain Tricks - This Is How Your Brain Works." YouTube. YouTube, 31
Jan. 2013. Web. 07 Feb. 2017. https://www.youtube.com/watch?v=JiTz2i4VHFw
Bell, Bradford, & Kozlowski, Steve W.J. (2011). Errors in Organizations. 113-141.
Brettel, Malte & Voss, Uwe (2013). Antecedents of Management Control Combinations
– An Explanation from Resource Dependence Theory. Schmalenbach Business
Review, Vol 65, 409-430.
Boyd, Lara, Dr. "After Watching This, Your Brain Will Not Be the Same." After Watching
This, Your Brain Will Not Be the Same. TEDx Vancouver. YouTube, 15 Dec. 2015.
Web. 30 Dec. 2016. https://www.youtube.com/watch?v=LNHBMFCzznE.
Boyd, Lara A., Eric D. Vidoni, and Brenda D. Wessel. "Motor learning after stroke: is
skill acquisition a prerequisite for contralesional neuroplastic change?" Neuroscience
letters 482.1 (2010): 21-25.
62
Boyd, Lara A., and Carolee J. Winstein. "Impact of explicit information on implicit motor-
sequence learning following middle cerebral artery stroke." Physical Therapy 83.11
(2003): 976.
Cannon, Mark D. & Edmondson, Amy C. (2005). Failing to Learn and Learning to Fail
(Intelligently): How Great Organizations Put Failure to Work to Innovate and Improve.
Long Range Planning Journal, Vol 38, 299-319.
Cartwright-Finch, Ula, and Nilli Lavie. "The role of perceptual load in inattentional
blindness." Cognition 102.3 (2007): 321-340.
Cekmeceliolglu, Hulya Gunduz, & Gunsel, Ayse (2011). Promoting Creativity Among
Employees of Mature Industries: The Effects of Autonomy and Role Stress on Creative
Behaviors and Job Performance. Procedia Social and Behavioral Sciences. Vol 24,
889-895.
Coelho, Filipe & Augusto, Mario & Lages, Luis Filipe (2011). Contextual Factors and the
Creativity of Front-Line Employees: The Mediating Effects of Role Stress and Intrinsic
Motivation. Journal of Retailing, Vol 87, Issue 1, 31-45.
Cohen, Michael A., George A. Alvarez, and Ken Nakayama. "Natural-scene perception
requires attention." Psychological science 22.9 (2011): 1165-1172.

63
Feather, N. T. (1969). Attribution of Responsibility and Valence of Success and Failure
in Relation to Initial Confidence and Task Performance. Journal of Personality and
Social Psychology. Vol 13, No. 2, 129-144.
Forster, Sophie, and Nilli Lavie. "Harnessing the wandering mind: The role of perceptual
load." Cognition 111.3 (2009): 345-355.
Frese, Michael & Keith, Nina (2015). Action Errors, Error Management, and Learning in
Organizations. Annual Review of Psychology, 661-687.
Heimbeck, Doerte & Frese, Michael, & Sonnentag, Sabine, & Keith, Nina (2003).
Integrating Errors Into the Training Process: The Function of Error Management
Instructions and the Role of Goal Orientation. Personnel Psychology, Vol 56, Issue 2,
333-361.
Hiroto, Donald S. & Seligman, Martin E.P. (1975). Generality of Learned Helplessness
in Man. Journal of Personality and Social Psychology. Vol. 31, No. 2, 311-327.
Hollenbeck, J.R., Ilgen, D.R., Tuttle, D.B., & Sego, D.J. (1995). Team Performance on
Monitoring Tasks: An Examination of Decision Errors in Contexts Requiring Sustained
Attention. Journal of Applied Psychology, Vol 80, 685-696.
64
Homsma, Gert J. & Van Dyck, Cathy & De Gilder, Dick & Koopman, Paul L. & Elfring,
Tom (2007). Overcoming Errors: A Closer Look at the Attributional Mechanism. Journal
of Business and Psychology, Vol 21, No 4, 559-583.
Jackson-Nielsen, Molly, Michael A. Cohen, and Michael A. Pitts. "Perception of
ensemble statistics requires attention." Consciousness and Cognition 48 (2017): 149-
160.
Knights, David & McCabe, Darren (1997). ‘How Would You Measure Something Like
That? Quality in a Retail Bank. Journal of Management Studies, Vol 34, Issue 3, 371-
388.
Kovach, Jamison V. & Fredendall, Lawrence D. (2014). Managerial Impacts of Learning
and Continuous Improvement Practices. Journal for Quality and Participation, Vol.37,
Issue 2 25-28.
Kreitz, Carina, et al. "Does working memory capacity predict cross-modally induced
failures of awareness?" Consciousness and cognition 39 (2016): 18-27.
Kreitz, Carina, et al. "Working-memory performance is related to spatial breadth of
attention." Psychological research 79.6 (2015): 1034-1041.

65
Kreitz, Carina, et al. "The influence of attention set, working memory capacity, and
expectations on inattentional blindness." Perception (2015): 0301006615614465.
Lavie, Nilli. "Distracted and confused? Selective attention under load." Trends in
cognitive sciences 9.2 (2005): 75-82.
Lavie, Nilli, et al. "Load theory of selective attention and cognitive control." Journal of
Experimental Psychology: General 133.3 (2004): 339.
Lavie, Nilli. "The role of perceptual load in visual awareness." Brain research 1080.1
(2006): 91-100.
Leonard, Skipton & Weitz, Joseph (1971). Task Enjoyment and Task Perseverance in
Relation to Task Success and Self-Esteem. Journal of Applied Psychology, Vol 55, No
5, 414-421.
Milner, David, and Mel Goodale. The visual brain in action. Oxford University Press,
2006.
Most, Steven B., et al. "How not to be seen: The contribution of similarity and selective
ignoring to sustained Inattentional blindness." Psychological Science 12.1 (2001): 9-17.

66
Most, Steven B., et al. "What you see is what you set: sustained inattentional blindness
and the capture of awareness." Psychological review 112.1 (2005): 217.
Most, Steven B., et al. "How not to be seen: The contribution of similarity and selective
ignoring to sustained Inattentional blindness." Psychological Science 12.1 (2001): 9-17.
New, Joshua J., and Tamsin C. German. "Spiders at the cocktail party: An ancestral
threat that surmounts inattentional blindness." Evolution and Human Behavior 36.3
(2015): 165-173.
Ohlsson, Stellan. (1996). Learning from Performance Errors. Psychological Review,
Vol.103, No. 2, 241-262.
Pessoa, Luiz, Sabine Kastner, and Leslie G. Ungerleider. "Attentional control of the
processing of neutral and emotional stimuli." Cognitive Brain Research 15.1 (2002): 31-
45.
Raffone, Antonino, and Narayanan Srinivasan. "Mindfulness and Cognitive Functions:
Toward a Unifying Neurocognitive Framework." 1-9.
Rosenfeld, Paul. (1990). Self-Esteem and Impression Management Explanations for
Self-Serving Biases. The Journal of Social Psychology. Vol 130, Issue 4, 495-500.
67
Rotter, Julian B. (1966). Generalized Expectancies for Internal Versus External Control
of Reinforcement. Psychological Monographs: General and Applied, Vol 80, No 1, 1-28.
Rybowiak, V., Garst, H., Frese, M., & Batinic, B. (1999). Error Orientation Questionnaire
(EOQ): Reliability, Validity, and Different Language Equivalence. Journal of
Organizational Behavior, 20(4), 527-547. Retrieved from
http://www.jstor.org/stable/3100388
Scheel, Tabea & Hausemann, Ulf (2013). Impact of Error Management Culture on
Knowledge Performance in Professional Services Firms. Psiholoska Obzorja / Horizon
Psycology, Vol 22, 66-79.
Simons, Daniel J., and Daniel T. Levin. "Change blindness." Trends in cognitive
sciences 1.7 (1997): 261-267.
Simons, Daniel. "The Monkey Business Illusion." YouTube. YouTube, 28 Apr. 2010.
Web. 07 Feb. 2017. https://www.youtube.com/watch?v=IGQmdoK_ZfY
Simons, Daniel J. "Monkeying around with the gorillas in our midst: familiarity with an
inattentional-blindness task does not improve the detection of unexpected events." i-
Perception 1.1 (2010): 3-6.

68
Simons, Daniel. "Seeing the World as It Isn't | Daniel Simons | TEDxUIUC." YouTube.
YouTube, 19 Mar. 2011. Web. 07 Feb. 2017
https://www.youtube.com/watch?v=9Il_D3Xt9W0
Simons, Daniel J., et al. "Do “brain-training” programs work?" Psychological Science in
the Public Interest 17.3 (2016): 103-186.
Stothart, Cary R., et al. "The costs (or benefits) associated with attended objects do little
to influence inattentional blindness." Acta Psychologica 173 (2017): 101-105.
Stothart, Cary, Walter Boot, and Daniel Simons. "Using Mechanical Turk to assess the
effects of age and spatial proximity on inattentional blindness." Collabra: Psychology 1.1
(2015).
Turner, Karynne L. & Makhija, Mona V. (2012). The Role of Individuals in the
Information Processing Perspective. Strategic Management Journal, Vol 33, 661-680
van Dyck, Cathy & Baer, Marcus & Frese, Michael & Sonnentag, Sabine (2005).
Organizational Error Management Culture and its Impact on Performance: A Two-
Study Replication. Journal of Applied Psychology, Vol. 90, No. 6, 1228-1240.
69
van Dyck, C. (2000). Putting Errors to Good Use: Error Management Culture and
Organizational Performance. Doctoral Dissertation: KLI Dissertation Series- University
of Amsterdam. 49-82.
Voss, Michelle W., et al. "Effects of training strategies implemented in a complex
videogame on functional connectivity of attentional networks." Neuroimage 59.1 (2012):
138-148.
Voss, Uwe & Brettel, Malte (2014). The Effectiveness of Management Control in Small
Firms: Perspectives from Resource Dependence Theory. Journal of Small Business
Management, Vol. 52, Issue 3, 569-587.
Wells, Carol V. & Kipnis, David. (2001). Trust, Dependency, and Control in the
Contemporary Organization. Journal of Business and Psychology, Vol.15, No. 4, 593-
603.