a majority of participants (n = 113, 58
TRANSCRIPT
TPB health behavior intervention 1
An Extended Theory of Planned Behavior Intervention to Promote Physical Activity and
Healthy Eating Among Older Adults Diagnosed with Type 2 Diabetes and Cardiovascular
Disease
Running Head: TPB health behavior intervention
Katherine M. Whitea*(PhD), Deborah J. Terryb (PhD), Carolyn Troupb (PhD), Lynn A.
Rempelc (PhD), Paul Normand (PhD), Kerry Mummerye (PhD), Malcolm Rileyf (PhD),
Natasha Posnerg (PhD), and Justin Kenardyb (PhD)
aSchool of Psychology and Counselling, Queensland University of Technology, Brisbane,
4001 Australia
bSchool of Psychology, The University of Queensland, St Lucia, Brisbane, 4072 Australia
cDepartment of Nursing, Brock University, St. Catharines, ON L2S 3A1 Canada
dDepartment of Psychology, University of Sheffield, Sheffield, S10 2TP UK
eCollege of Health and Human Services, Central Queensland University, Rockhampton, 4702
Australia
fDairy Australia, Level 5 IBM Centre, 60 City Road Southbank Victoria 3006 Australia
gUniversity of Birmingham, Edgbaston, Birmingham, B15 2TT, UK
*Corresponding author. Phone: +61 7 3138 4689; Fax: + 61 7 3138 0486;
Email: [email protected]
Acknowledgment of financial and/or other support: This study was conducted as part
of a grant to the second author from Queensland Health, Diabetes
Australia – Queensland and The Heart Foundation – Queensland.
12
1
2
3
4
5
6
7
8
9
10
11
12
13
14
15
16
17
18
19
20
21
22
23
24
25
3
TPB health behavior intervention 2
Acknowledgements
The authors would like to thank Kylie Burton and Barbara Sponza, at Diabetes Australia –
Queensland for their assistance in obtaining volunteers for this study. Thanks also to: Theresa
Collison, Jan Coad, Ruth Dukes, Ann Dyne, Helen Elliott, Claire Hyde, Rene Hinton, Debbie
McGrath, Betty Mulder, Susan Mylne, Cheryl Pearson, Gaylene Weir and Cindy Wood for
their assistance in data collection.
12
1
2
3
4
5
6
7
3

TPB health behavior intervention 3
Abstract
A randomized controlled trial evaluated the effectiveness of a 4-week extended Theory of
Planned Behavior (TPB) intervention to promote regular physical activity and healthy eating
among older adults diagnosed with Type 2 diabetes and/or cardiovascular disease (N = 183).
Participants completed TPB measures of attitude, subjective norm, perceived behavioral
control, and intention, as well as planning and behavior, at pre-intervention, 1-week, and 6-
weeks post-intervention for each behavior. No significant time by condition effects emerged
for healthy eating. For physical activity, significant time by condition effects were found for
behavior, intention, planning, perceived behavioral control, and subjective norm. In particular,
compared to control participants, the intervention group showed short-term improvements in
physical activity and planning with further analyses indicating that the effect of the
intervention on behavior was mediated by planning. The results indicate that TPB-based
interventions including planning strategies may encourage physical activity among older
people with these serious conditions.
12
1
2
3
4
5
6
7
8
9
10
11
12
13
14
15
3

TPB health behavior intervention 4
Over the past decade, the incidence of chronic diseases such as
diabetes and cardiovascular disease (CVD) has risen substantially in
developed countries. Between 2004 and 2005, approximately 18 percent
of the Australian population was diagnosed with CVD, placing enormous
costs on the health care system (Australian Institute of Health and
Welfare, 2006). Similarly, based on findings from the first national
diabetes lifestyle study, AusDiab, 1 in 4 individuals has diabetes or is at a
high risk of developing the disease within the next 5 to 10 years (Diabetes
Australia, 2004). As well as being an independent risk factor for CVD, Type
2 diabetes shares similar risk factors to CVD and many individuals suffer
from symptoms of both diseases. In further evidence for the similarities
between the two conditions of CVD and Type 2 diabetes, the American
Heart Association states that "from the point of view of cardiovascular
medicine, it may be appropriate to say, 'diabetes is a cardiovascular
disease’” (Grundy et al., 1999, p. 1134). Consequently, the need for
effective interventions and improved management of these conditions is
essential.
It is generally accepted that adherence to healthy eating patterns is central to the
prevention and optimal management of these two chronic conditions (e.g., Vessby, 2000).
Dietary guidelines for individuals with diabetes and CVD are usually the same as those
recommended for the general population. The Australian Guide to Healthy Eating published
by the Commonwealth Department of Health and Ageing (2001) recommends daily intake of
foods based on three general principles; namely, (1) reducing the dietary consumption of fat,
with an emphasis on decreasing saturated fat, (2) increasing the consumption of
carbohydrates, particularly those that are more slowly digested and, (3) increasing the intake
12
1
2
3
4
5
6
7
8
9
10
11
12
13
14
15
16
17
18
19
20
21
22
23
24
25
3

TPB health behavior intervention 5
of vegetables and fruit. There are a plethora of examples of interventions to encourage healthy
eating among the general population (e.g., Anderson et al., 1998), including some
focusing on healthy eating specifically among older people (e.g., Kelley &
Abraham, 2004), with varying degrees of success in meeting their
intervention goals.
In addition to healthy eating, improved physical activity is also important for the
prevention and optimal management of these two chronic conditions (Kavookjian, Elswick, &
Whetsel, 2007; Vessby, 2000; Warburton, Nicol, & Brenin, 2006). As with the general
population, individuals with diabetes and CVD are recommended to undertake 30 or
more minutes of moderate physical activity during their leisure time on 5
or more days of the week (Australian Government Department of Health
and Ageing, 2005). Numerous interventions to improve physical activity levels (Dishman
& Buckworth, 1996; Hillsdon, Foster, & Thorogood, 2005; Kahn et al., 2002; Muller-
Riemenschneider, Reinhold, Nocon, & Willich, 2008), including some specifically aimed at
people diagnosed with diabetes or CVD (Furber et al., 2008; Gleeson-Kreig, 2006; Graham-
Clarke & Oldenburg, 1994; Richardson et al., 2007; Steptoe, Doherty, Rink, Kerry, Kendrick,
& Hendrick, 1999; Wing, Vendetti, Jakicic, Polley, & Lang, 1998), have been developed
using a number of different approaches (e.g., pedometer wearing/diary recording, behavior
therapy, self-monitoring) to encourage positive changes in people’s physical activity levels.
However, while some improvements to people’s physical activity levels have been observed
(Page, Harnden, Cook, Turner, 1992; Simons-Morton, Calfas, Oldenburg, & Burton, 1998;
Steptoe et al., 1999; Wing et al., 1998) they have typically been, at best, only modest and
often not maintained. Furthermore, the randomized controlled trials that specifically target
physical activity in individuals at risk of, or with diabetes or CVD, often lack a theoretical
12
1
2
3
4
5
6
7
8
9
10
11
12
13
14
15
16
17
18
19
20
21
22
23
24
3
TPB health behavior intervention 6
basis that specifies the underlying process of decision-making for the desired behavior
change.
Previous researchers have drawn on a variety of social cognitive theories, such as the
theory of planned behavior (TPB; Ajzen, 1991), to engender health-related behavior change
(see Hardeman, Johnston, Johnston, Bonetti, Wareham, & Kimmonth, 2002). According to
the TPB (Ajzen, 1991), the immediate antecedent of behavior is intention. Intentions are
determined by attitude, subjective norm, and perceived behavioral control. Attitudes are an
individual’s overall positive or negative evaluation of performing the behavior. Subjective
norms represent perceived (dis)approval from significant others for behavioral performance.
Perceived behavioral control comprises the perceived extent to which the behavior is under
the person’s control and influences both intentions and behavior (when estimates of actual
control are accurate). Each of the TPB constructs is determined by underlying belief sets
focusing on the perceived outcomes of the behavior, beliefs of specific referents, and
facilitating and inhibiting factors. Much support has been provided for the TPB
across a range of behaviors (Armitage & Conner, 2001), and for health-
related behaviors specifically (McEachan, Conner, Taylor, & Lawton, in
press), including healthy eating (e.g., Conner, Norman, & Bell, 2002;
Payne, Jones, & Harris, 2004) and physical activity (Hagger, Chatzisarantis,
& Biddle, 2002; Hausenblas, Carron, & Mack, 1997). In addition, the TPB
has been used to predict physical activity (Boudreau & Godin, 2009;
Plotnikoff, Lippke, Courneya, Birkett, & Sigal, 2010) and healthy eating
(White, Terry, Troup, Rempel, & Norman, 2010) for people diagnosed with
Type 1 and Type 2 diabetes and/or CVD.
Despite this support, some researchers (Gollwitzer, 1993, 1999;
Sheeran, 2002) have argued that the TPB (and other social cognition
12
1
2
3
4
5
6
7
8
9
10
11
12
13
14
15
16
17
18
19
20
21
22
23
24
25
3
TPB health behavior intervention 7
models) should be expanded to include volitional variables (i.e., self-
regulatory strategies that encourage enactment of one’s intention) to aid
in the prediction of behavior. In this respect, Norman and Conner (2005)
suggest that planning is a key volitional variable that can aid the transition
from intention to behavior. Thus, specifying where, when, and how a
behavior is to be performed may ensure that strong intentions are
translated in behavior. In their study examining undergraduate students’
physical activity behavior, Norman and Conner found evidence to suggest
that the impact of intentions on behavior may be mediated by the extent
to which one undertakes planning activities (see also Gutiérrez-Doña,
Lippke, Renner, Kwon, & Schwarzer, 2009; Jones, Abraham, Harris, Schulz,
& Chrispin, 2001; Luszczynska & Schwarzer, 2003; van Osch, Beenackers,
Reubsaet, Lechner, Candel, & de Vries, 2009). Similarly, experimental
work has shown that forming implementation intentions (i.e., specific if-
then plans that link an appropriate behavioral response to a situational
cue) helps people to translate their goal intentions into behavior
(Gollwitzer & Sheeran, 2006). Adhering to healthy eating choices and
performing physical activity often requires a series of preparatory steps.
For healthy eating, these steps include selecting appropriate products,
purchasing the items, choosing recipes, and preparing and cooking meals
and, for physical activity, there are considerations such as what activity to
perform, acquiring the relevant clothing and/or equipment, and making
plans with others. Therefore, the role of planning as a potential mediating
variable between intentions and behavior in an extended TPB framework
was examined.
12
1
2
3
4
5
6
7
8
9
10
11
12
13
14
15
16
17
18
19
20
21
22
23
24
25
3
TPB health behavior intervention 8
Given that the TPB has been shown to strongly predict healthy eating choices and
physical activity in a range of contexts and for a variety of populations, and planning appears
to play an important role in the intention-behavior relationship, an extended TPB
(incorporating planning) should provide a good basis for the development of interventions to
improve levels of physical activity. In their review of 24 TPB-based behavioral interventions,
Hardeman et al. (2005) concluded that the TPB was mainly used to predict intentions and
behaviors and less commonly to develop intervention programs. Importantly, Hardeman et al.
reported that approximately half of the interventions were effective in changing intentions and
two-thirds in changing behavior, albeit with small effect sizes (where calculable). There are
several TPB-informed healthy eating (Gratton, Povey & Clark, 2007; Jemmott et al., 2011)
and physical activity (Chatzisarantis & Hagger, 2005; Parrott, Tennant, Olejnik, &
Pouderijne, 2008) interventions for non-clinical populations; however, only a few TPB
interventions have been reported for clinical populations (Jones, Courneya, Fairey, Mackey,
2005; Kelley & Abraham, 2004).
The Current Study
The aim of this research was to design, deliver, and evaluate an extended TPB-based
intervention. The intervention aimed to specifically target people diagnosed with Type 2
diabetes and/or CVD. This study aimed to determine the effect of an intervention targeting
people diagnosed with Type 2 diabetes and/or CVD on healthy eating and physical activity
and to compare the effect of the intervention with that of no intervention on outcomes at 1 and
6 weeks post-intervention.
The present study used an extended TPB for both the development of the content of
the intervention as well as for the purposes of measurement and intervention evaluation. The
healthy eating goal of the intervention was based on recommendations contained in the
Dietary Guidelines for Australians and the Australian Guide to Healthy Eating
12
1
2
3
4
5
6
7
8
9
10
11
12
13
14
15
16
17
18
19
20
21
22
23
24
25
3

TPB health behavior intervention 9
(Commonwealth Department of Health and Ageing, 2001). These recommendations include:
(1) using only low-fat dairy products, (2) using a monounsaturated or polyunsaturated
cooking oil and (3) trimming all visible fat from meats. The physical activity goal of the
intervention was based on the current Australian physical activity recommendations for adults
(Australian Government Department of Health and Ageing, 2005) as well as
recommendations of The Heart Foundation - Australia and Diabetes Australia which
recommend regular moderate physical activity be performed for individuals with diabetes
and/or CVD. The broad physical activity intervention goal for participants, then, was to
undertake 30 or more minutes of moderate physical activity during their leisure time on 5 or
more days of the week (with the 30 minutes of activity able to be done in bouts of at least 10-
minute blocks). However, it is also suggested that sedentary individuals should increase their
activity levels slowly, and it is recommended that elderly individuals increase their moderate
level activity by no more than 5% per week (Christmas & Anderson, 2000). Thus, a revised
target behavior based on previous recommendations (see Terry & Hogg, 1996) was defined as
engaging in moderate physical activity on a regular basis (i.e., ‘moderate physical activity’
was defined as any movement that causes a slight but noticeable increase in breathing and
heart rate and may cause light sweating in some people and ‘a regular basis’ was defined as at
least three 3 occasions per week).
It was hypothesized that, compared to a waitlist control group, participants in the
intervention group would show an improvement in their pre-intervention to 1 week post-
intervention ratings for (1) the extended TPB constructs of attitudes, subjective norm,
perceived behavioral control, intentions, and planning in relation to healthy eating and
engaging in regular physical activity and (2) self-report assessments of healthy eating and
physical activity, and that this improvement from pre-intervention to 1 week post-intervention
12
1
2
3
4
5
6
7
8
9
10
11
12
13
14
15
16
17
18
19
20
21
22
23
24
3
TPB health behavior intervention 10
would be maintained at 6 weeks post-intervention. It was also predicted that the effects of the
extended TPB intervention on behavior would be mediated by planning.
Methods
A randomized controlled trial was conducted to evaluate the effectiveness of a 4-week
extended Theory of Planned Behavior (TPB) intervention. The university ethics committee
and relevant government health district authorities approved the study.
Participants
Time 1 (pre-intervention) participants were 183 predominantly older adults diagnosed
with Type 2 diabetes and/or CVD recruited from 7 community health center sites in
Queensland, Australia. Participants were recruited voluntarily at an advertised information
session and provided their informed consent to participate in a 4-week intervention trial
designed to encourage healthy behaviors. Of the Time 1 participants, 116 provided data at all
three collection points (pre-intervention, 1 week post-intervention, and 6 weeks post-
intervention) on healthy eating, and 111 on physical activity. The participants comprised
primarily of (note there is a small amount of missing data for each demographic variable):
older (M = 61.17 years; SD = 8.81), Caucasian (n = 107, 99%), married (n = 83, 76%),
females (n = 67, 61%). The most commonly reported occupations were retired (n = 40, 39%)
and homemaker (n = 32, 31%). Half of the participants (n = 54, 49%) reported being
diagnosed with diabetes only, a further 45% (n = 49) had been diagnosed with both Type 2
diabetes and CVD, and 6% (n = 7) had a CVD only diagnosis. The average length of time
since diagnosis was 5.55 years (SD = 6.60) for people with a Type 2 diabetes diagnosis and
11.69 years (SD = 12.08) for people with a CVD diagnosis.
The flow of participants throughout the study is shown in Figure 1. Considering
responses to the healthy eating questionnaires, 27% of participants (intervention n = 33, 25%;
control n = 11, 32%) were lost to follow-up at 1-week post-intervention. This number
12
1
2
3
4
5
6
7
8
9
10
11
12
13
14
15
16
17
18
19
20
21
22
23
24
25
3
TPB health behavior intervention 11
increased to 37% (intervention n = 46, 35%; control n = 21, 40%) at 6-week follow-up. For
the physical activity questionnaires, 27% of participants (intervention n = 31, 24%; control n
= 18, 34%) were lost to follow-up at 1-week post-intervention and this number increased to
39% (intervention n = 47, 37%; control n = 23, 43%) at 6-week follow-up. No significant
differences were found between attrition rates for the intervention and control conditions at
both follow-up time points. Moreover, no significant differences were also found between
completers and non-completers at both follow-up time points on the demographic factors and
pre-intervention extended TPB variables.
<Insert Figure 1 about here>
Design and Procedure
The design of the study was a 2 (Condition: intervention vs. waitlist control) by 3
(Time: pre-intervention vs. 1-week post-intervention vs. 6-weeks post-intervention) mixed
measures design, with Time as the repeated measures factor. Participants were randomly
assigned via a color-coded draw into 2 groups; two thirds were assigned to an intervention
group and one third to the waitlist control group. The uneven design of the 2 groups was
based on the collaborating community health center sites requiring their patients/clients to
benefit from the intervention as early as possible and to avoid a large wait-list group. A pre-
intervention questionnaire assessing the extended TPB constructs (including planning and
past behavior), for healthy eating and physical activity was completed at the information
session held 1 week prior to the intervention. Follow-up questionnaires assessing the extended
TPB constructs, healthy eating, and physical activity were mailed to all participants at 1 and 6
weeks after completion of the 4-week intervention. Most of the data collection period
occurred across an annual holiday period (Australian Summer encompassing Christmas and
New Year).
12
1
2
3
4
5
6
7
8
9
10
11
12
13
14
15
16
17
18
19
20
21
22
23
24
3
TPB health behavior intervention 12
Control Group. Participants in the control group received no intervention during the
data collection phase. These participants completed the extended TPB questionnaire at the
three data collection points (pre-intervention, 1-week post-intervention, and 6-weeks post-
intervention). People in the control group were offered the opportunity to attend intervention
sessions once all follow-up questionnaires were returned.
Intervention Group. The intervention group received an extended TPB intervention
consisting of weekly 2-hour sessions held over a 4-week period. The intensity of the
intervention was based on the ability to be able to engage both participants and facilitators in
a brief, cost-effective program that may serve to complement other offerings available to
those individuals diagnosed with these chronic conditions The sessions were facilitated by
health professionals (e.g., diabetes educators, physiotherapists) trained in the program’s
delivery by research team members during a 1 or 2 day program, with intervention sessions
conducted in a primarily interactive mode with participants. The sessions were group-based;
approximately 5 to 12 participants attended each session across the multiple test sites. The
comprehension of the learning in each session was checked by the facilitators at the end of
each of the four sessions to ensure that participants understood the issues that were raised in
the workshop sessions. An important component of the extended TPB intervention was the
use of participants’ pre-intervention attitudes and beliefs about healthy eating and physical
activity. These beliefs were used as a basis for discussion and to assist in the development of
intentions to engage in healthy behaviors.
Intervention protocol. The weekly 2-hour intervention sessions held over a 4 week
period covered a series of TPB-related topics. Session 1 explored participants’
attitudes and beliefs about healthy eating and physical activity. Pre-
intervention information of the group’s overall attitudes and beliefs was
used as a basis to consider the perceived advantages (e.g., feeling
12
1
2
3
4
5
6
7
8
9
10
11
12
13
14
15
16
17
18
19
20
21
22
23
24
25
3
TPB health behavior intervention 13
healthy, losing weight) and disadvantages (e.g., reducing the taste of
food, feeling tired) of adhering to healthy eating choices and engaging in
physical activity. In Session 2, participants considered the barriers (e.g.,
cost, lack of time) that prevent them from making healthy eating choices
and engaging in regular physical activity and common triggers to
unhealthy behaviors and how unhealthy habits develop. Discussion also
focused on the group’s overall perceptions of social support from
significant others (subjective norms) adhering to healthy eating choices
and performing physical activity. Participants were encouraged to identify
people in their lives (e.g., spouse or partner) who impact upon their eating
choices and level of physical activity and to develop strategies for dealing
with unsupportive individuals or groups. The focus of Session 3 was the
role of planning to enact behavior change. Participants learnt and
practiced the steps of effective planning (including goal-setting) to bring
about achievable behavior change. Session 4 completed the intervention
with a focus on fostering a sense of control over behavior change.
Participants generated strategies to deal with barriers preventing them
from meeting their healthy eating and physical activity goals.
Measures
In addition to demographic information, the pre-intervention
questionnaire and follow-up questionnaires obtained measures of the
extended TPB constructs in relation to adhering to healthy eating choices
(i.e., consumption of foods low in saturated fats) and engaging in regular physical
activity. Participants completed all measures, as part of a larger
questionnaire, assessed at pre-intervention, 1- and 6-weeks post-
12
1
2
3
4
5
6
7
8
9
10
11
12
13
14
15
16
17
18
19
20
21
22
23
24
25
3

TPB health behavior intervention 14
intervention. All of the TPB items were constructed in line with guidelines
specified by Ajzen (1991). Some of these measures included negatively-
worded items to minimize response bias. Items were assessed on 7-point
Likert scales: 1 (strongly disagree) to 7 (strongly agree) unless otherwise
stated. The item examples below are for physical activity where the target
behavior was termed “engaging in moderate physical activity on a regular
basis during the next month”; for healthy eating, participants completed
identical items where the target behavior was termed “eating foods low in
saturated fats during the next month”.
Intention. Participants indicated the extent to which they agreed
that: “It is likely that I will engage in moderate physical activity on a
regular basis during the next month”.
Attitude. Attitude was assessed on four 7-point evaluative semantic differential items:
unpleasant/pleasant, good/bad, negative/positive and favorable/unfavorable, the average of
which served as a reliable measure of attitude across the three time points (healthy eating, s
= .82, .88 and .89; physical activity, s = .81, .82, and .81).
Subjective norm. Subjective norm was assessed using two items: “Most people who
are important to me would approve of my engaging in moderate physical activity on a regular
basis during the next month” and “Those people who are important to me would want me to
engage in moderate physical activity on a regular basis during the next month”. The two
items were averaged to create a subjective norm measure which were correlated significantly
(p < .001) across the three time points (healthy eating, rs = .72, .79, and .72; physical activity,
rs = .59, .87, and .87).
12
1
2
3
4
5
6
7
8
9
10
11
12
13
14
15
16
17
18
19
20
21
22
23
3

TPB health behavior intervention 15
Perceived behavioral control. One item assessed perceived behavioral control: “I am
confident that I could engage in moderate physical activity on a regular basis during the next
month”.
Planning. A planning index was formed based on items by Norman and Conner
(2005). For healthy eating, participants completed four items asking the extent to which they
had planned “what foods to buy to ensure that you eat foods low in saturated fats during the
next month”, “how to prepare meals to ensure that you eat foods low in saturated fats”,
“where to purchase food to ensure you eat foods low in saturated fats”, and “how you would
handle the situation if you don’t feel like eating foods low in saturated fats”. For physical
activity, participants completed six items asking the extent to which they had planned: “how
you will engage in moderate physical activity on a regular basis during the next month”,
“what physical activities you will engage in”, “when you will be physically active”, “where
you will be physically active”, “who you will be physically active with” and “how you will
handle the situation if you don’t feel like engaging in physical activity”. Items were
completed on 7-point Likert scales from 1 (completely) to 7 (not at all), but reversed scored
so that high values indicated high levels of planning. The items were averaged to form a scale
which was reliable across the three time points (healthy eating, s = .88, .85, and .86;
physical activity, s = .91, .90, and .91).
Behavior. Participants were provided with the relevant definitions for the target
behaviors. Eating foods low in saturated fats was defined as eating low fat dairy products, fat-
trimmed meat, and using mono- and poly-unsaturated oils. Engaging in moderate physical
activity on a regular basis was defined as any movement that causes a slight but noticeable
increase in breathing and heart rate and may cause light sweating in some people. A regular
basis was defined as at least three 3 occasions per week. For both target behaviors,
respondents indicated the extent to which they had performed the behaviors during the (1)
12
1
2
3
4
5
6
7
8
9
10
11
12
13
14
15
16
17
18
19
20
21
22
23
24
25
3

TPB health behavior intervention 16
past month (baseline and 6-week follow-up) or (2) past week (1-week follow-up). Responses
were rated on a 7-point scale, from 1 (a small extent) to 7 (a large extent). In an effort to
improve the accuracy of the behavior measures, a memory prompt required participants to
complete a checklist indicating their food consumption (including eating foods low in
saturated fats) and recreational activities they commonly performed (e.g., walking) during the
previous week/month.
Results
Overview of Data Analysis
To examine the utility of the extended TPB intervention, 2
(intervention/control) by 3 (pre-intervention/1-week follow-up/6-week
follow-up), mixed measures MANOVAs were performed on the extended
TPB predictor variables, intentions, and self-report behavior for both
healthy eating and physical activity. In addition, on the basis of the
MANOVA results for physical activity, correlational and regression analyses
were conducted to examine the extent to which the extended TPB
predictor variables including planning mediated any extended TPB
intervention effects on physical activity. Due to the preliminary nature of the
study and the relatively small sample size, alpha was adjusted to .10 for
the main analyses. Accordingly, all effects at p < .10 will be interpreted for
the main analyses.
Prior to the main analyses, two MANOVAs were performed to
determine if there were any baseline differences on the extended TPB
measures of (i) healthy eating and (ii) physical activity between
intervention and control participants, between males and females, or
based on diagnosis type (i.e., diabetes only, CVD only, or diabetes and
12
1
2
3
4
5
6
7
8
9
10
11
12
13
14
15
16
17
18
19
20
21
22
23
24
25
3
TPB health behavior intervention 17
CVD). For healthy eating, these analyses revealed no significant
differences as a function of group (intervention or control), F(6, 147) =
0.52, p = .80, gender, F(6, 147) = 0.50, p = .80, or diagnosis, F (12, 294)
= 1.31, p = .21. For physical activity, these analyses also revealed no
significant differences as a function of group (intervention or control), F(6,
133) = 0.76, p = .60, gender, F(6, 133) = 0.89, p = .51, or diagnosis, F(12,
266) = 1.58, p = .10. Therefore, a combined sample of men and women
and a combined diagnosis type sample (i.e., a combined sample of those
people diagnosed with diabetes only, CVD only or diagnosed with both
conditions) was used in the study’s analyses.
<Insert Table 1 about here>
The Utility of the TPB as an Intervention to Promote Healthy Eating and Regular
Physical Activity
For the 2 x 3 MANOVAs, the intervention Condition (intervention vs. waitlist control
group) was the between subjects factor and the within-subjects factor was Time (pre-
intervention, follow-up at 1 week, and 6 weeks). The extended TPB variables and behavior
served as the dependent variables. Table 1 displays the Ms and SDs for the extended TPB
measures at pre-intervention, 1-, and 6-week follow-up, for healthy eating and physical
activity.
Healthy Eating: Main and interaction effects
For healthy eating, there were no significant Time or Time by Condition effects. There
was a significant main effect for Condition, F(6, 72) = 2.78, p =.017, partial η2 = .188, with
significant univariate effects for behavior, F(1, 77) = 3.33, p =.072, partial η2 = .041,
intention, F(1, 77) = 4.14, p = .045, partial η2 = .05, and perceived behavioral control, F(1,
12
1
2
3
4
5
6
7
8
9
10
11
12
13
14
15
16
17
18
19
20
21
22
23
24
25
3
TPB health behavior intervention 18
77) = 9.81, p = .002, partial η2 = .113. These results showed that participants in the
intervention condition reported higher scores on average across all time points for behavior
(M = 6.03, SE = .14), intention (M = 6.25, SE = .09), and perceived behavioral control (M =
6.40, SE = .09) than participants in the control condition (M = 5.53, SE = .23 for behavior, M
= 5.88, SE = .16 for intention, and M = 5.85, SE = .15 for perceived behavioral control,
respectively). Given that there was no evidence for the impact of the intervention over time
for healthy eating, no further analyses were conducted.
Physical Activity: Main effects
For physical activity, there were no significant effects for Condition. A significant
effect of Time was found, F(12,63) = 3.10, p = .002, partial η2 = .371. Univariate analyses
revealed significant Time effects on intention, F(2, 74) = 6.51, p = .002, partial η2 = .081;
perceived behavioral control, F(2, 74) = 3.41, p = .036, partial η2 = .044; and subjective
norm, F(2, 74) = 8.02, p < .001, partial η2 = .098, although these effects were qualified by
significant Time x Condition effects.
Physical Activity: Interaction effects
Overall, there was a significant multivariate Time x Condition effect,
F(12, 63) = 1.70, p = .089, partial η2 = .244. Univariate tests were
conducted to examine these effects in more detail which revealed
significant Time x Condition effects on behavior, F(2, 74) = 2.81, p = .067,
partial η2 = .037; planning, F(2, 74) = 6.12, p = .004, partial η2 = .076;
intention, F(2, 74) = 8.36, p < .001, partial η2 = .101; perceived behavioral
control, F(2, 74) = 5.79, p = .004, partial η2 = .073; and subjective norm,
12
1
2
3
4
5
6
7
8
9
10
11
12
13
14
15
16
17
18
19
20
21
22
23
24
3
TPB health behavior intervention 19
F(2, 74) = 2.64, p = .077, partial η2 = .034. There was no significant Time
x Condition effect on attitude.
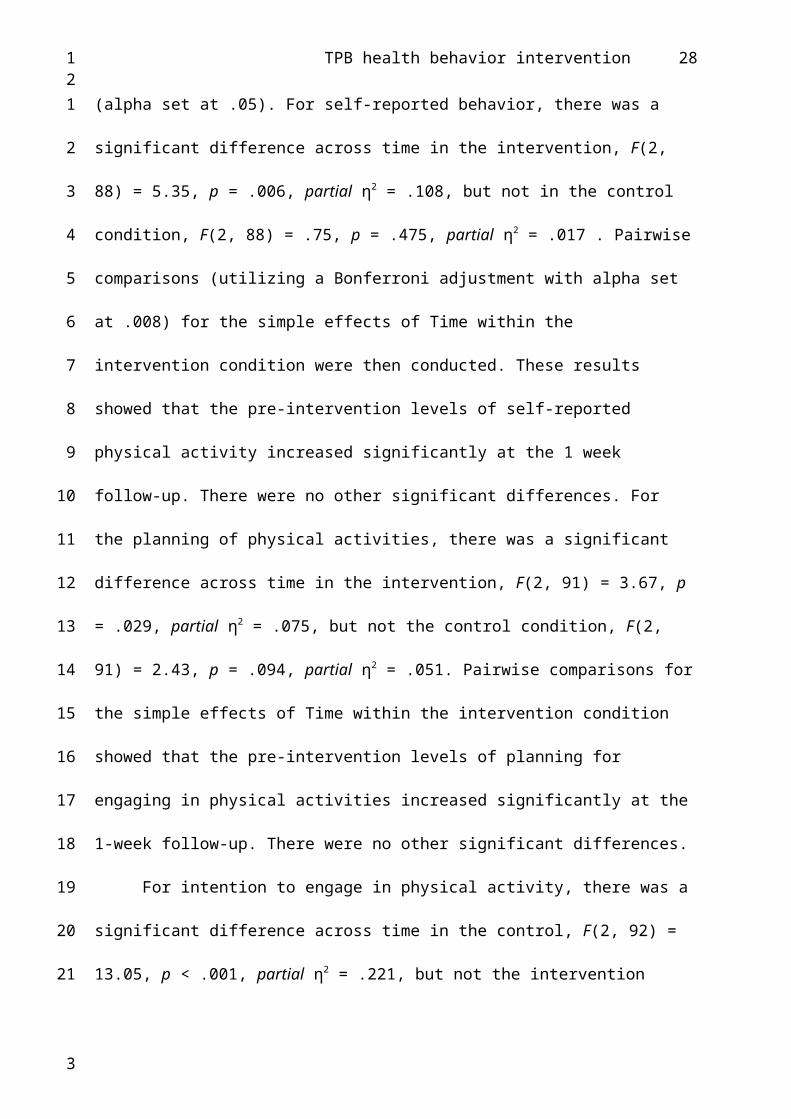
These Time x Condition interactions were examined further, with corrections to
control for the Type 1 error rate (alpha set at .05). For self-reported behavior, there was a
significant difference across time in the intervention, F(2, 88) = 5.35, p
= .006, partial η2 = .108, but not in the control condition, F(2, 88) = .75, p
= .475, partial η2 = .017 . Pairwise comparisons (utilizing a Bonferroni
adjustment with alpha set at .008) for the simple effects of Time within the
intervention condition were then conducted. These results showed that the
pre-intervention levels of self-reported physical activity increased
significantly at the 1 week follow-up. There were no other significant
differences. For the planning of physical activities, there was a significant
difference across time in the intervention, F(2, 91) = 3.67, p = .029,
partial η2 = .075, but not the control condition, F(2, 91) = 2.43, p = .094,
partial η2 = .051. Pairwise comparisons for the simple effects of Time
within the intervention condition showed that the pre-intervention levels of
planning for engaging in physical activities increased significantly at the 1-
week follow-up. There were no other significant differences.
For intention to engage in physical activity, there was a significant
difference across time in the control, F(2, 92) = 13.05, p < .001, partial η2
= .221, but not the intervention condition, F(2, 92) = .71, p = .50, partial
η2 = .015. Pairwise comparisons for the simple effects of Time within the
control condition revealed that pre-intervention physical activity intention
levels reduced significantly between baseline and the 1-week follow-up
and between baseline and the 6-week follow-up. There were no other
12
1
2
3
4
5
6
7
8
9
10
11
12
13
14
15
16
17
18
19
20
21
22
23
24
25
3
TPB health behavior intervention 20
significant differences. For perceived behavioral control, there was a
significant difference across time in the control, F(2, 91) = 8.80, p < .001,
partial η2 = .162, but not the intervention condition, F(2, 91) = .56, p
= .57, partial η2 = .012. Pairwise comparisons for the simple effects of
Time within the control condition showed a significant reduction in
perceived behavioral control levels for physical activity between pre-
intervention and 1-week follow-up. No other significant differences
emerged. For subjective norm, there was a significant effect of Time in the
control, F(2, 92) = 6.56, p = .002, partial η2 = .125, but not the
intervention condition, F(2, 92) = 1.87, p = .16, partial η2 = .039. Pairwise
comparisons for the simple effects of Time within the control condition
showed a significant reduction in levels of perceived pressure to engage in
physical activity (i.e., subjective norm) between pre-intervention and 1-
week follow-up. There were no other significant differences.
Physical Activity: Mediation Analyses
Given that all but one of the significant Time x Condition interactions for physical
activity were due to changes observed between baseline and 1-week follow-up, further
analyses were conducted focusing on the effect of the intervention from pre-intervention to
the 1-week follow-up only. These results revealed a significant Time x Condition effect, F(6,
101) = 3.93, p = .001, partial η2 = .189. This Time x Condition interaction was examined
further, with Bonferroni corrections. Importantly, for self-reported behavior, there was a
significant difference across time in the intervention condition, F(1, 126) = 9.44, p = .003,
partial η2 = .070, but not in the control condition, F(1, 126) = 2.17, p = .14, partial η2 = .017.
Participants in the intervention condition showed a significant increase in self-reported
12
1
2
3
4
5
6
7
8
9
10
11
12
13
14
15
16
17
18
19
20
21
22
23
24
25
3
TPB health behavior intervention 21
physical activity at the 1 week follow-up whereas control participants did not. The next
analysis assessed the extent to which the extended TPB variables at 1-week post-intervention,
especially planning, mediated the impact of the intervention on the target behavior at 1-week
follow-up where an improvement in self-reported behavior from pre-intervention ratings was
observed for experimental participants. As shown in Table 2 (showing variables at 1-week
post-intervention), all extended TPB predictors were significantly correlated with behavior,
with planning emerging as the strongest correlate, followed by intention. Procedures
developed by Preacher and Hayes (2008) were used to examine the mediational hypotheses.
Condition was entered along with all potential mediators (i.e., the extended TPB variables)
simultaneously and the pre-intervention behavior scores as a covariate. The analyses revealed
that Condition (IV) had a significant effect on behavior (DV), B = .80, SE = .35, p = .02.
However, this effect became non-significant, B = .26, SE = .33, p = .43, when the extended
TPB variables (i.e., the potential mediators) were controlled for, suggesting mediation (Baron
& Kenny, 1986). Using bootstrapping procedures, the total mediated effect was found to be
significant, B = .53, SE = .25, CI = .121 to 1.098. Inspection of the individual mediator
variables revealed that only planning significantly mediated the effect of Condition on
behavior, B = .25, SE = .15, CI = .041 to .681.
<Insert Table 2 about here>
Discussion
The present study tested the efficacy of an extended TPB-based intervention
including planning in relation to healthy eating and physical activity in predominantly older
adults diagnosed with Type 2 diabetes and/or CVD. The results of this study provided only
some support for the efficacy of the intervention to the extent that, for the intervention
participants, there was evidence of significant short-term improvement in their self-reported
physical activity behavior and degree of planning to engage in such activities following the
12
1
2
3
4
5
6
7
8
9
10
11
12
13
14
15
16
17
18
19
20
21
22
23
24
25
3

TPB health behavior intervention 22
conclusion of the intervention sessions. In contrast, participants in the control condition
maintained only moderate levels of planning and activity during this time. However,
intervention participants did not report any significant improvement (or maintenance) in their
level of planning and self-reported behavior at the 6-week post-intervention follow-up. As a
result, these somewhat encouraging findings for physical activity can only be described as
temporary as the positive shifts in planning and behavior are potentially reactive to
participation in an intervention targeting behavior change.
Effectiveness of the Intervention on Social Cognitions and Intention
There was no evidence that the intervention facilitated change for participants’ healthy
eating cognitions or intentions. It is possible that, as diabetes in particular is recognized as a
food-related condition, cognitions and intentions were already at or close to desired levels.
Inspection of the means for the extended TPB variables for healthy eating revealed high levels
of reported endorsement for the constructs for both conditions across the time-points.
In relation to physical activity, while not originally the source of change expected,
some support for the efficacy of the extended TPB intervention was evidenced by stability in
people’s perceptions of normative pressure from others, control, and behavioral intentions
across time for participants in the intervention condition compared to participants in the
control condition. The latter participants reported a decrease in scores on these constructs over
time (with this decrease significant only in the short term for subjective norm and perceived
behavioral control but significant between baseline and both 1- and 6- week follow-up time
points for intention). Participants in the control condition perceived less normative pressure,
less control, and had weaker intentions in relation to physical activity than participants
assigned to the intervention condition across time, whereas participants in the intervention
condition maintained their high levels of perceived normative pressure, a sense of control, and
strong intentions in relation to engaging in regular physical activity. This finding may be
12
1
2
3
4
5
6
7
8
9
10
11
12
13
14
15
16
17
18
19
20
21
22
23
24
25
3

TPB health behavior intervention 23
explained by the timing of the data collection period across the Australian Summer
(encompassing Christmas and New Year) holiday period which traditionally is a time when
healthy practices, such as physical activity, can be compromised by an increase in social
activities and changes from one’s usual daily routine while on leave or in non-familiar
settings if holidaying. Thus, the intervention may have helped participants maintain their
positive cognitions. Contrary to expectation, there was no significant improvement across
time on the measure of attitude for intervention, as opposed to control, participants. Across
the course of the study, intervention and control participants reported similarly very positive
attitudes towards engaging in physical activity, with these very favorable opinions leaving
little room for improvement on this construct for participants in either condition.
Effectiveness of the Intervention on Behavior
As was the case for social cognitions and intention, there was no evidence that the
intervention served to improve participants’ healthy eating behavior over time. As stated
above for cognitions and intention, reports of adherence to healthy eating choices for
consumption of foods low in saturated fats for all participants were high, indicating a strong
endorsement of recommended dietary guidelines for participants in the present study.
In a similar vein to the findings of Hardeman et al.’s (2002) review of
TPB-based interventions, the present study found support for an
improvement in reported physical activity behavior, albeit with a similarly
small effect size. As hypothesized, whereas there was no evidence of
change for participants in the control condition, there was a significant
increase in reported levels of physical activity for intervention participants
at the 1 week follow-up. This encouraging finding suggest some efficacy of
the intervention in promoting adherence to regular, moderate physical
activity, albeit over a short period of time.
12
1
2
3
4
5
6
7
8
9
10
11
12
13
14
15
16
17
18
19
20
21
22
23
24
25
3
TPB health behavior intervention 24
Mediation Effects of Planning
The present study also examined the extent to which the effects of the extended TPB
intervention on behavior would be mediated by planning. According to Norman and Conner
(2005), there is some evidence to suggest that the impact of cognitions on behavior is
mediated by the extent to which one undertakes sufficient planning for engagement in the
behavior (Jones et al., 2001; Luszczynska & Schwarzer, 2003; van Osch et al., 2009). The
results of the present study revealed that planning mediated the impact of the TPB-based
intervention on reported levels of physical activity at one-week follow-up, indicating that the
planning strategies people engage in serve as the means by which the positive impact of the
intervention translates into behavioral change. This role for planning highlights the
importance of examining variables comprising the factors proposed to serve as proximal
facilitators of behavior change (see also Gollwitzer, 1993, 1999, regarding implementation
intentions) and points to the value of considering theories that focus on self-regulation (e.g.,
including planning and goal-setting) as a basis for intervention (e.g., the action and coping
planning components of the Health Action Process Approach (HAPA) model; Schwarzer,
1992).
Study Strengths and Limitations
The study has a number of strengths as it addressed a number of
criticisms noted by Hardeman et al.’s (2002) review of TPB interventions
by (i) utilizing the model to inform the intervention, (ii) stating explicitly
which TPB components were targeted, (iii) using a randomized controlled
design, and (iv) employing standardized measures of TPB constructs as
process and outcome measures. Nonetheless, some limitations of the
study should be noted. Importantly, due to the preliminary nature of the study and
the relatively small sample size, marginal effects (adopting a p <.10 significance cutoff) were
12
1
2
3
4
5
6
7
8
9
10
11
12
13
14
15
16
17
18
19
20
21
22
23
24
25
3

TPB health behavior intervention 25
interpreted for the main analyses due to their theoretical significance but should be considered
cautiously, pending replication in future studies. In relation to methodological issues,
the majority of the sample was Caucasian and married, bringing into
question the generalizability of the findings. In addition, due to time
constraints, single-item measures for two of the study’s components
(intention and perceived behavioral control) were used. However, multi-
item measures of these constructs typically have very high levels of
internal reliability, suggesting that the use of single items in this context
may not have unduly impacted on issues of reliability. Further, the reliance
on self-report data may have inflated people’s assessment of their
performance of the two health behaviors. Baseline levels on behavior were
high which may indicate social desirability effects or the selectiveness of
the sample in terms of motivation to change. In the case of physical
activity, the use of objective measures may provide a more accurate level
of people’s accumulated physical activity, although self-report measures
of physical activity correlate significantly with maximum oxygen
consumption (VO2max) (Godin & Shephard, 1997). Nonetheless, the
present findings should be replicated using objective measures of physical
activity behavior (McAuley & Jacobson, 1991; Westerterp, 2009). It is
possible also that the mere measurement effect, whereby merely asking
questions about intentions to engage in healthy behaviors increases the
performance of healthy behavior (e.g., French & Sutton, 2010; Godin et al.,
2010; Godin, Sheeran, Conner, & Germain, 2008; Sandberg & Conner,
2009), may have reduced the size of the intervention effects.
12
1
2
3
4
5
6
7
8
9
10
11
12
13
14
15
16
17
18
19
20
21
22
23
24
3

TPB health behavior intervention 26
An additional limitation relates to the finding that the reported means on the
TPB measures were all high (Ms ≈ 6.00 on a 7 point scale) pre-intervention. As a result, there
was little room for improvement which meant that the intervention aimed to prevent
reductions over time on these variables. However, for planning, the mean pre-intervention
score was closer to the mid-point of the scale, providing greater scope for the intervention to
increase levels of planning. It should be noted also that stronger effects may have
occurred had all data collection taken place in a non-holiday season when sedentary and
unhealthy eating behavior may be less common. The timing of the data collection may have
provided a more conservative test of the intervention and may also explain the reduced
intervention effects and the direction of the findings, although this suggestion remains to be
tested. It is unclear, then, whether the intervention would have had similar
effects at other times of the calendar year. A further limitation when
considering the results of the study is the possibility that the effects of the
intervention may relate to the impact of others members within any given
intervention session given the group-based nature of the program.
A final limitation is that there was a substantial amount of attrition
for participants in the study which may have impacted on the power of the
analyses. In addition, previous research has indicated that program non-
completers in a physical activity intervention for older adults may be more
likely to be of a lower socioeconomic class, overweight, and less physically
active (Jancey, Lee, Howat, Clarke, Wang, & Shilton, 2007), although no
attrition biases were found in the current study. Future research should
continue to assess the utility of the intervention in larger samples
comprising other clinical and non-clinical groups of participants to examine
the extent to which the findings are generalizable across broader
12
1
2
3
4
5
6
7
8
9
10
11
12
13
14
15
16
17
18
19
20
21
22
23
24
25
3

TPB health behavior intervention 27
populations. Further, reasons for participant dropout should be collected
as a matter of course. Finally, studies should also seek to examine
cognitive and behavior change in data collection periods not coinciding
with holiday periods, although these times are noted for their difficulty in
maintaining healthy behaviors so are useful to examine in their own right.
Conclusions
Overall, the results of the study provide some limited, short-term, evidence for the
efficacy of an extended TPB-based intervention to increase physical activity among older
adults diagnosed with Type 2 diabetes and/or CVD; however, the intervention had no effect
on healthy eating. Nevertheless, there are some important implications for the context of
diabetes and chronic condition education. First, the findings suggest than an emphasis on
planning strategies (including goal-setting) would be most beneficial in encouraging healthy
lifestyle adherence in regular moderate physical activity among this cohort (i.e., developing
detailed plans of how to engage in regular moderate physical activity such as when, where
and with whom). Second, for physical activity behavior maintenance during often difficult
periods for adherence such as holidays, efforts focusing on the perceived approval from others
(e.g., partners, families) to be physically active and bolstering one’s self-confidence to be able
to maintain regular physical activity may prove helpful. It is likely to be less useful to target
people’s attitudes (i.e., highlighting the benefits and minimizing the costs of regular physical
activity) as positive attitudes towards behavioral performance appear to be already
established, at least in the present sample. Finally, given that the current intervention only had
a short term effect on physical activity behavior, it may be useful to supplement interventions
with “booster” reminders after the completion of the program in order to maintain early
changes in physical activity behavior.
12
1
2
3
4
5
6
7
8
9
10
11
12
13
14
15
16
17
18
19
20
21
22
23
24
3
TPB health behavior intervention 28
References
Ajzen, I. (1991). Theory of planned behavior. Organizational Behavior and Human Decision
Processes, 50, 179–211. doi:10.1016/0749-5978(91)90020-T.
Anderson, A. S., Cox, D. N., McKellar, S., Reynolds, J., Lean, M. E. J., & Mela, D. J. (1998).
Take five, a nutrition education intervention to increase fruit and vegetable intakes:
Impact on attitudes towards dietary change. British Journal of Nutrition, 80, 133-140.
Armitage, C. J., & Conner, M. (2001). Efficacy of the theory of planned behaviour: A meta-
analytic review. British Journal of Social Psychology, 40, 471–499.
doi:10.1348/014466601164939.
Australian Government Department of Health and Ageing. (2005). An active way to better
health: national physical activity guidelines. Canberra: Commonwealth of Australia.
Australian Institute of Health and Welfare (2006). Cardiovascular Disease FAQs. Retrieved
December 18, 2007 from http://www.aihw.gov.au/cvd/faqs.cfm.
Baron, R. M., & Kenny, D. A. (1986). The moderator-mediator variable
distinction in social psychological research: Conceptual, strategic,
and statistical considerations. Journal of Personality and Social
Psychology, 51, 1173-1182. doi:10.1037/0022-3514.51.6.1173.
Boudreau, F., & Godin, G. (2009). Understanding physical activity
intentions among French Canadians with type 2 diabetes: an
extension of Ajzen's theory of planned behavior. International Journal
of Behavioral Nutrition and Physical Activity, 6, 35-45.
doi:10.1186/1479-5868-6-35.
Chatzisarantis, N. L. D, & Hagger, M. S. (2005). Effects of a brief
intervention based on the theory of planned behaviour on leisure-
12
1
2
3
4
5
6
7
8
9
10
11
12
13
14
15
16
17
18
19
20
21
22
23
24
3
TPB health behavior intervention 29
time physical activity participation. Journal of Sport and Exercise
Psychology, 27, 470-487.
Christmas, K., & Anderson, R. A. (2000). Exercise and older patients:
Guidelines for the clinician. Journal of the American Geriatric Society,
48, 318-324.
Commonwealth Department of Health and Ageing (2001). The Australian guide to healthy
eating. Retrieved May 30, 2002, from www.health.gov.au/pubhlth/strateg/food/guide/.
Conner, M., Norman, P., & Bell, R. (2002). The theory of planned behavior and healthy
eating. Health Psychology, 21, 194-201. doi: 10.1037//0278-6133.21.2.194
Diabetes Australia (2004). AusDiab Preliminary Results (media release).
Retrieved November 17, 2004 from
http://www.diabetes.com.au/research/AusDiab.htm#media.
Dishman, R. K., & Buckworth, J. (1996). Increasing physical activity: A
quantitative synthesis. Medicine and Science in Sports and Exercise, 28, 706-719.
French, D. P., & Sutton, S. (2010). Reactivity of measurement in health
psychology: How much of a problem is it? What can be done about
it? British Journal of Health Psychology, 15, 453-468. doi:
10.1348/135910710X492341.
Furber, S., Monger, C., Franco, L., Mayne, D., Jones, L. A., Laws, R., &
Waters, L. (2008). The effectiveness of a brief intervention using a
pedometer and step-recording diary in promoting physical activity in
people diagnosed with type 2 diabetes or impaired glucose
tolerance. Health Promotion Journal of Australia, 19, 189-195.
12
1
2
3
4
5
6
7
8
9
10
11
12
13
14
15
16
17
18
19
20
21
22
23
3
TPB health behavior intervention 30
Gleeson-Kreig, J. M. (2006). Self-monitoring of physical activity. Effects on
self-efficacy and behavior in people with type 2 diabetes The
Diabetes Educator, 32, 69-77. doi: 10.1177/0145721705284285.
Godin, G., Sheeran, P., Conner, M., Delage., G., Germain, M., Belanger-
Gravel, A., & Naccache, H. (2010). Which survey questions changes
behavior? Randomized controlled trial of mere measurement
interventions. Health Psychology, 29, 636-644. doi:
10.1037/a0021131.
Godin, G., Sheeran, P., Conner, M., & Germain, M. (2008). Asking questions
changes behavior: Mere measurement effects on frequency of blood
donation. Health Psychology, 27, 179-184. doi: 10.1037/0278-
6133.27.2.179.
Godin, G., & Shephard, R. J. (1997). Godin leisure-time exercise
questionnaire. Medicine & Science in Sports & Exercise, 29, S36-8.
Gollwitzer, P. M. (1993). Goal achievement: The role of intentions. In W. Stroebe & M.
Hewstone (Eds.), European Review of Social Psychology (Vol. 4, pp. 141–185).
Chichester: Wiley.
Gollwitzer, P. M. (1999). Implementation intentions: Strong effects of simple plans. American
Psychologist, 54, 493–503. doi:10.1037/0003-066X.54.7.493.
Gollwitzer, P. M., & Sheeran, P. (2006). Implementation intentions and goal achievement: A
meta-analysis of effects and processes. Advances in Experimental Social Psychology,
38, 69-119.
Graham-Clarke, P., & Oldenburg, B. (1994). The effectiveness of a general
practice-based physical activity intervention on patient physical
activity status. Behaviour Change, 11, 132-144.
12
1
2
3
4
5
6
7
8
9
10
11
12
13
14
15
16
17
18
19
20
21
22
23
24
25
3

TPB health behavior intervention 31
Gratton, L., Povey, R., & Clark-Carter, D. (2007). Promoting children's fruit
and vegetable consumption: Interventions using the theory of
planned behaviour as a framework. British Journal of Health
Psychology, 12, 639-650. doi: 10.1348/135910706X171504.
Grundy, S. M., Benjamin, I. J., Burke, G. L., Chait, A., Eckel, R. H., Howard,
B. V.,
… & Sowers, J. R. (1999). Diabetes and cardiovascular disease: A
statement for healthcare professionals from the American Heart
Association. Circulation, 100, 1134-1146.
Gutiérrez-Doña, B., Lippke, S., Renner, B., Kwon, S., & Schwarzer, R. (2009). Self-
efficacy and planning predict dietary behaviors in Costa Rican and South
Korean women: Two moderated mediation analyses. Applied Psychology:
Health and Well-being, 1, 91-104.
Hagger, M. S., Chatzisarantis, N. L. D., & Biddle, S. J. H. (2002). A meta-
analytic review of the theories of reasoned action and planned
behavior in physical activity: Predictive validity and the contribution
of additional variables. Journal of Sport and Exercise Psychology, 24,
3-32.
Hardeman, W., Johnston, M., Johnston, D. W., Bonetti, D., Wareham, N. J.,
& Kimmonth, A. L. (2002). Application of the theory of planned
behaviour in behaviour change interventions: A systematic review.
Psychology &Health, 17, 123-158. doi: 10.1080/08870440290013644.
Hausenblas, H. A., Carron, A. V., & Mack, D. E. (1997). Application of the
theories of reasoned action and planned behavior to exercise
12
1
2
3
4
5
6
7
8
9
10
11
12
13
14
15
16
17
18
19
20
21
22
23
24
3
TPB health behavior intervention 32
behavior: A meta-analysis. Journal of Sport and Exercise Psychology,
19, 36-51.
Hillsdon, M., Foster, C., & Thorogood, M. (2005, January 24). Interventions
for promoting physical activity. Cochrane Database of Systematic
Reviews 2005(1), Article CD003180. Retrieved December 10, 2008,
from The Cochrane Library Database.
Jancey, J., Lee, A., Howat, P., Clarke, A., Wang., & Shilton, T. (2007).
Reducing attrition in physical activity programs for older adults.
Journal of Aging and Physical Activity, 15, 152-165.
Jemmott, J. B., Jemmott, L. S., O’Leary, A., Ngwane, Z., Icard, L., Bellamy,
S., … & Makiwane, M. B. (2011). Cognitive-behavioural health-
promotion intervention increases fruit and vegetable consumption
and physical activity among South African adolescents: A cluster-
randomised controlled trial. Psychology & Health, 26, 167-185. doi:
10.1080/08870446.2011.531573.
Jones, F., Abraham, C., Harris, P., Schulz, J., & Chrispin, C. (2001). From knowledge to
action regulation: Modeling the cognitive prerequisites of sun screen use in Australian
and UK samples. Psychology & Health, 16, 191-206. doi:
10.1080/08870440108405499.
Jones, L. W., Courneya, K. S., Fairey, A. S., & Mackey, J. R. (2005). Does the theory of
planned behaviour mediate the effects of an Oncologist’s recommendation to exercise
in newly diagnosed breast cancer survivors? Results from a randomised trial. Health
Psychology, 24, 189-197. doi: 10.1037/0278-6133.24.2.189.
Kahn, E. B., Ramsey, L. T., Brownson, R. C., Heath, G. W., Howze, E. H., Powell, K. E., …
the Task Force on Community Preventive Services. (2002). The effectiveness of
12
1
2
3
4
5
6
7
8
9
10
11
12
13
14
15
16
17
18
19
20
21
22
23
24
25
3

TPB health behavior intervention 33
interventions to increase physical activity: A systematic review. American Journal of
Preventive Medicine, 22, S73-S107. doi:10.1016/S0749-3797(02)00434-8.
Kavookjian, J., Elswick, B. M., & Whetsel, T. (2007). Interventions for being
active among individuals with diabetes. The Diabetes Educator, 33, 962-988.
doi: 10.1177/0145721707308411.
Kelley, K., & Abraham, C. (2004). RCT of a theory-based intervention promoting healthy
eating and physical activity amongst out-patients older than 65 years. Social Science
& Medicine, 59, 787-797. doi:10.1016/j.socscimed.2003.11.036.
Luszczynska, A., & Schwarzer, R. (2003). Planning and self-efficacy in the adoption and
maintenance of breast self-examination: A longitudinal study on self-regulatory
cognitions. Psychology & Health, 18, 93-108. doi: 10.1080/0887044021000019358.
McAuley, E., & Jacobson, L. (1991). Self-efficacy and exercise participation in sedentary
adult females. American Journal of Health Promotion, 5, 185-191.
McEachan, R. R. C., Conner, M., Taylor, N. J., & Lawton, R. J. (in press). Prospective
prediction of health-related behaviours with the theory of planned behaviour: A meta-
analysis. Health Psychology Review. doi: 10.1080/17437199.2010.521684.
Müller-Riemenschneider, F., Reinhold, T., Nocon, M., & Willich, S. N. (2008). Long-term
effectiveness of interventions promoting physical activity: A systematic review.
Preventive Medicine, 47, 354-368. doi:10.1016/j.ypmed.2008.07.006.
Norman, P., & Conner, M. (2005). The theory of planned behavior and exercise: Evidence for
the mediating and moderating roles of planning on intention-behavior relations.
Journal of Sport and Exercise Psychology, 27, 488-505.
Page, R. C., Harnden, K. E., Cook, J. T., & Turner, R. C. (1992). Can lifestyles of subjects
with impaired glucose tolerance be changed? A feasibility study. Diabetic Medicine,
9, 562-566. doi: 10.1111/j.1464-5491.1992.tb01839.x.
12
1
2
3
4
5
6
7
8
9
10
11
12
13
14
15
16
17
18
19
20
21
22
23
24
25
3

TPB health behavior intervention 34
Payne, N., Jones, F., & Harris, P. R. (2004). The role of perceived need within the
theory of planned behaviour: A comparison of exercise and healthy eating.
British Journal of Health Psychology, 9, 489-504.
Parrott, M. W., Tennant, L. K., Olejnik, S., & Pouderijne, M. S. (2008). Theory of planned
behavior: Implications for an email-based physical activity intervention. Psychology of
Sport and Exercise, 9, 511-526. doi:10.1016/j.psychsport.2007.07.002.
Plotnikoff, R. C., Lippke, S., Courneya, K., Birkett, N., & Sigal, R. (2010).
Physical activity and diabetes: An application of the theory of
planned behaviour to explain physical activity for Type 1 and Type 2
diabetes in an adult population sample. Psychology & Health, 25, 7-
23. doi: 10.1080/08870440802160984.
Preacher, K. J., & Hayes, A. F. (2008). Asymptotic and resampling strategies for assessing and
comparing indirect effects in multiple mediator models. Behavior Research Methods,
40, 879-891. doi: 10.3758/BRM.40.3.879.
Richardson, C. R., Mehari, K. S., McIntyre, L. G., Janney, A. W., Fortlage, L. A., Sen, A., …
Piette, J. D. (2007). A randomized trial comparing structured and lifestyle goals in an
internet-mediated walking program for people with type 2 diabetes. International
Journal of Behavioral Nutrition and Physical Activity, 4, 59. doi:10.1186/1479-5868-4-
59.
Sandberg, T., & Conner, M. (2009). A mere measurement effect for
anticipated regret: Impacts on cervical screening attendance. British
Journal of Social Psychology, 48, 221-236. doi:
10.1348/014466608X347001.
12
1
2
3
4
5
6
7
8
9
10
11
12
13
14
15
16
17
18
19
20
21
22
23
3
TPB health behavior intervention 35
Schwarzer, R. (1992). Self-efficacy in the adoption and maintenance of health behaviours:
Theoretical approaches and a new model. In: R. Schwarzer (ed.), Self-efficacy: Thought
control of action (pp. 217-243). London: Hemisphere.
Sheeran, P. (2002). Intention-behavior relations: A conceptual and empirical review.
European Review of Social Psychology, 12, 1-36. doi: 10.1080/14792772143000003.
Simons-Morton, D. G., Calfas, K. J., Oldenburg, B., & Burton, N. W. (1998). Effects of
interventions in health care settings on physical activity or cardiorespiratory fitness.
American Journal of Preventive Medicine, 15, 413-430.
Steptoe, A., Doherty, S., Rink, E., Kerry, S., Kendrick, T., & Hilton, S. (1999). Behavioural
counselling in general practice for the promotion of healthy behaviour among adults at
increased risk of coronary heart disease: Randomised trial. British Medical Journal,
319, 943-948.
Terry, D. L., & Hogg, M. A. (1996). Group norms and the attitude–behavior relationship: A
role for group identification. Personality and Social Psychology Bulletin, 22, 776–793.
doi:10.1177/0146167296228002.
van Osch, L., Beenackers, M., Reubsaet, A., Lechner, L., Candel, M., de Vries, H. (2009).
Action planning as predictor of health protective and health risk behavior: an
investigation of fruit and snack consumption. International Journal of Behavioral
Nutrition and Physical Activity, 6, 69-79. doi: 10.1186/1479-5868-6-69.
Vessby, B. (2000). Dietary fat and insulin action in humans. British Journal of Nutrition, 83,
S91-S96. doi:10.1017/S000711450000101X.
Warburton, D. E. R., Nicol, C. W., & Bredin, S. S. D. (2006). Health benefits of physical
activity: The evidence. Canadian Medical Association Journal, 174, 801-809.
doi:10.1503/cmaj.051351.
Westerterp, K. R. (2009). Assessment of physical activity: a critical appraisal. European
12
1
2
3
4
5
6
7
8
9
10
11
12
13
14
15
16
17
18
19
20
21
22
23
24
25
3
TPB health behavior intervention 36
Journal of Applied Physiology, 105, 823-828. doi: 10.1007/s00421-009-1000-2.
White, K. M., Terry, D. J., Troup, C., Rempel, L., & Norman, P. (2010). Predicting the
consumption of food low in saturated fats among people diagnosed with Type 2
diabetes and cardiovascular disease: The role of planning in the theory of planned
behaviour. Appetite, 55, 348-354. doi: 10.1016/j.appet.2010.07.011.
Wing, R. R., Vendetti, E., Jakicic, J. M., Polley, B. A., & Lang, W. (1998). Lifestyle
intervention in overweight individuals with a family history of diabetes. Diabetes
Care, 21, 350-359. doi: 10.2337/diacare.21.3.350.
12
1
2
3
4
5
6
7
8
3

TPB health behavior intervention 37
Figure 1. Flow of recruitment and participants through study.
Table 1
Randomized(N = 183)
Intervention(n = 130)
Control Group (n = 53)
Eligible to participate(N = 183)
Included in analysis at 6-weeks
(n = 84/81)
Included in analysis at 6-weeks
(n = 32/30)
Lost to follow-up(n = 46/47)
1 week (n = 33/31)
6 weeks (n = 13/16)
Lost to follow-up (n = 21/23)
1 week (n = 17/18)
6 weeks (n = 4/5)
Note. Time 1 = pre-intervention. Time 2 = 1-week post-intervention. Time 3 = 6-weeks post-intervention. Ns refer to healthy eating/physical activity.
Baseline assessment(n = 130/128)
Baseline assessment (n = 53/53)
121
23456789
10111213141516171820212223242526272829303132333435363738394041424344
45
46
47
48
49
50
51
3

TPB health behavior intervention 38
Descriptive Data (Means and Standard Deviations) Examining Time by Condition Effects for
TPB Measures of Healthy Eating and Physical Activity at Baseline, 1- and 6-Week Follow-up
Pre-
intervention
1-week
follow-up
6-week
follow-up
Healthy Eating (n = 183) (n = 133) (n = 116)
Behavior Experimental 5.78 (1.43) 6.20 (1.20) 6.10 (1.08)
Control 5.55 (1.70) 5.50 (1.50) 5.55 (1.43)
Intention Experimental 6.10 (0.92) 6.25 (0.99) 6.39 (0.70)
Control 5.95 (0.94) 5.85 (0.93) 5.85 (0.75)
Planning Experimental 5.35 (1.38) 5.46 (1.30) 5.49 (1.22)
Control 5.25 (1.61) 5.36 (1.30) 5.09 (1.49)
Perceived behavioral control Experimental 6.39 (0.64) 6.44 (0.70) 6.36 (0.76)
Control 5.75 (1.41) 5.95 (1.00) 5.85 (0.93)
Subjective Norm Experimental 6.26 (0.85) 6.19 (1.21) 6.15 (0.98)
Control 6.00 (0.86) 6.00 (0.99) 5.60 (0.99)
Attitude Experimental 6.19 (1.11) 6.42 (.77) 6.05 (1.29)
Control 6.31 (1.03) 6.09 (1.03) 6.10 (1.02)
Physical Activity (n = 181) (n =132) (n = 111)
Behavior Experimental 4.27 (1.95) 4.95 (1.63) 4.60 (1.84)
Control 4.43 (1.69) 3.95 (1.69) 4.19 (1.81)
Intention Experimental 5.87 (1.25) 5.98 (1.16) 5.84 (1.17)
Control 6.33 (.58) 5.00 (1.41) 5.43 (1.12)
Planning Experimental 4.61 (1.62) 5.22 (1.39) 5.05 (1.43)
Control 4.92 (.96) 4.32 (1.26) 4.41 (1.64)
Perceived behavioral control Experimental 5.65 (1.36) 5.80 (1.24) 5.73 (1.31)
12
1
2
3
TPB health behavior intervention 39
Control 6.00 (0.84) 4.90 (1.41) 5.38 (1.12)
Subjective Norm Experimental 6.26 (0.77) 6.08 (1.04) 5.99 (0.97)
Control 5.98 (0.78) 5.19 (1.37) 5.40 (1.04)
Attitude Experimental 6.02 (1.21) 6.25 (0.92) 5.94 (1.28)
Control 5.90 (0.99) 5.77 (0.95) 5.60 (1.11)
12
3

TPB health behavior intervention 40
Table 2
Bivariate Correlations Between the Extended TPB Variables and Self-Report Physical
Activity at 1-Week Follow-up (N = 132)
1 2 3 4 5 6
1. Attitude .35*** .43*** .42*** .38*** .27**
2. Subjective norm .61*** .57*** .28** .18*
3. Perceived behavioral control .81*** .54*** .43***
4. Intention .60*** .54***
5. Planning .56***
6. Self-report behavior
*p < .05, **p < .01, ***p < .001.
12
1
2
3
4
3