a mechanistic explanation of the physical properties …
TRANSCRIPT

A MECHANISTIC EXPLANATION OF THE
PHYSICAL PROPERTIES O F UNDISTURBED LOESS
Harr i son Kane Associate Professor of Civil Engineering
University of Iowa
Research P ro jec t HR-126 Iowa State Highway 'ommission
The opinions, findings, and conclusions expressed in this publication a r e those of the author and not necessar i ly
those of the Iowa State Highway Commission.
DEPARTMENT OF CIVIL ENGINEERING UNIVERSITY O F IOWA
IOWA CITY, IOWA 5 2 d 4 0
February, 1968

A MECHANISTIC EXPLANATION O F THE
PHYSICAL PROPERTIES O F UNDISTURBED LOESS
Harr i son Kane Associate Professor of Civil Engineering
University of Iowa
Research Pro jec t HR-126 Iowa State Highway Commission
The opinions, findings, and conclusions expressed in this publication a r e those of the author and not necessar i ly
those of the Iowa State Highway
DEPARTMENT O F CIVIL ENGINEERING UNIVERSITY O F IOWA
IOWA CITY, IOWA 52240
February, 1968

FOREWORD
This is the final report on the r e s e a r c h performed in the Department
of Civil Engineering a t the University of Iowa for the Iowa State Highway
Commission under Research Pro jec t HR-126. The principaI investigator
was ass i s ted by Mr. Bruce Bailey, Graduate Research Assistant, and
Mr. Richard W. Long, an undergraduate student assis tant .

The relation between the properties and the water content of an
undisturbed loess were investigated to provide insight into the mechanical
behavior of the natural soil. Hand-carved samples from a single deposit,
a t their natural water contents, and at water contents modified in the
laboratory to provide a range from 870 to 3270, were subjected to uncon-
solidated-undrained triaxial compression tests, consolidation tests, and
initial negative pore water pressure tests. In addition, the clay-size
fraction was separated from the remainder of the loess for a separate
ser ies of tests to establish its properties. The natural water content of
the deposit in the field was measured at regular intervals for one year to
provide an example of the range in properties that would be encountered
at this site.
The test results are presented and their interpretation leads to
conclusions regarding the volumetric relations that exist as the water
content varies. The significance of the water content in relation to the
properties of the natural soil is explored and the concept of a critical
water content for loess is introduced.

CONTENTS
CHAPTER 1. INTRODUCTION 1. 1 General Aspects of the Problem 1. 2 Physical Propert ies of Loess 1. 3 Scope of This Study
Page 1 1 2 5
CHA.PTER 2. SITE SELECTION AND SOIL INDEX PROPERTIES 7 2. 1 Selection of Site 7 2 . 2 Index Proper t ies of Loess H 7 2. 3 Proper t ies of the Clay Fract ion 9
CHA.PTER 3. FIELD STUDIES A.ND SAMPLING PROCEDURES 10 3. 1 Description of Site and Tes t P i t 10 3 . 2 Field Water Content Measurements and
Weather Data 10 3 . 3 Sampling Procedures 12
CHAPTER 4. LABORATORY TESTS 14 4. 1 Introduction 14 4.2 Preparat ion of Tes t Specimens 15 4. 3 One-Dimensional Consolidation Tes t s 17 4.4' Triaxial Compression Tes t s 2 0 4.5 Initial Negative P o r e Water P r e s s u r e Tests 27 4.6 Tests on Clay Frac t ion 33
CHAPTER 5. INTERPRETATION O F RESULTS 34 5. 1 Volumetric Relations 34 5. 2 Strength and Compressibil i ty a s a Function
of Water Content 37 5. 3 Initial Negative P o r e Water P r e s s u r e a s a Function
of Water Content 3 9 5.4 Proper t ies a t Natural Water Contents 4 1
CHAPTER 6. SUMMARY AND CONCLUSIONS 6 . 1 Summary 6 . 2 Conclusions
APPENDIX I. REFERENCES 48
APPENDIX 11. NOTATION 50
TABLES 5 2
FIGURES 63

LIST OF TABLES
Table No.
2.1
3 . 1
4.1
4 . 2
4 .3
Soil Index P rope r t i e s
Total Monthly Precipitation in Inches
Summary of Consolidation Tes ts
Summary of Triaxial Tes ts
Summary of Initial Negative P o r e Water P r e s s u r e Tes ts
Init ial Negative P o r e Water P r e s s u r e Tes t s on Clay Frac t ion
P rope r t i e s at Natural Water Contents
Page
5 2
5 3
54
55

LIST OF FIGURES
Figure No. Page
Grain-Size Distribution for Loess H. Plast ic i ty Chart Comparing Loessial Soils. Section Through Tes t Site. Field Measurements, October and November 1966. Field Measurements, December 1966 and January 1967. Field Measurements, February and March 1967. Field Measurements, April and May 1967. Field Measurements, June and July 1967. Field Measurements, August and September 1967. Natural Water Content Profi les , October to December 1966. Natural Water Content Profi les , December 1966 to Februa ry 1967. Natural Water Content Profi les , March to June 1967. Natural Water Content Profi les , June to September, 1967. Range i n Natural Water Contents, October 1966 to September 1967. Water Contents and Dry Densities of Tes t Specimens. Typical Void Ratio-Log P r e s s u r e Relationships.
I Definitions of P a r a m e t e r s po and Cc .
t Variation of po With Initial Water Content.
I Variation of Cc With Initial Water Content. S t ress -St ra in Curves, Specimens No. 1 to 6. Stress-Strain Curves, Specimens No. 7 to 14. S t ress -St ra in Curves, Specimens No. 15 to 22. S t ress -St ra in Curves, Specimens No. 23 to 31. S t ress -St ra in Curves, Specimens No. 3 2 to 39. Relative Increase in Degree of Saturation Due to Undrained Hydrostatic Compression. Unconfined Shear Strength-Water Content Relations. Triaxial Shear Strength-Water Content Relations, G- 3= 20 psi. Triaxial Shear Strength-Water Content Relations, U- 3 = 40 psi. Triaxial Shear Strength-Water Content Relations, 0- = 60 ~ s i . Tr iax ia l Shear Strength-Water Content Relations, C = 80 psi.

Figure No. Page
Triaxial Shear Strength-Water Content Relation, 6 3 = 100 psi. 9 3 Triaxial Shear Strength-Water Content Relations, Cr 3 = 120 psi. 94 Triaxial Shear Strength-Water Content Re1 ations, Cr 3 = 140 psi. 95 Modified Mohr-Coulomb Diagram, w = 8Yo. 9 6 Modified Mohr-Coulomb Diagram, w = 14%. 97 Modified Mohr-Coulomb Diagram, w = 20%. 98 Modified Mohr -Coulomb Diagram, w = 26%. 9 9 Modified Mohr-Coulomb Diagram, w = 32%. 100 Mohr-Coulomb Fai lure Envelopes for Undrained Triaxial Tes ts . 101 Angle of Shearing Resistance-Water Content Relations. 102 Apparant Cohesion-Water Content Relations. 103 Relationship of Moduli to Water Content and Confining P r e s s u r e . 104 Apparatus fo r Initial Negative P o r e Water P res su reTes t s . 105 Response Time for Negative P o r e Water P r e s s u r e Tes t No. 15. 106 Response Time for Negative P o r e Water P r e s s u r e Tes t No. 1. 107 Negative P o r e Water Pressure-Water Content Relations f o r Loess H. 108 Negative P o r e Water Pressure-Degree of Saturation Relations f o r Loess H. 109 Consolidation Tes t s on Clay Fraction. 110 Negative P o r e Water P res su re -Wate r Content Relations f o r Clay Fraction. 111 Volumetric Relations for Loess h. 112 Change in Void Ratio Due to Consolidation P r e s s u r e Increments . 113

CHAPTER 1
INTRODUCTION
i. 1 General Aspects of the Problem
Large a r e a s of the midwestern United States, including over half
of Iowa and Nebraska, a r e covered with deposits of loess, a wind-
deposited sediment of predominately s i l t -s ized mater ial . Loess a l so
covers la rge portions of the cent ra l a r e a s of a l l other continents. While
there is g rea t variety in the physical propert ies of loess, the general
charac ter i s t ics and associated problems a r e consistent on an inter-
national scale (Terzaghi, 195 1).
The physical propert ies of the natural, undisturbed loess a r e of
grea t in te res t to engineers who a r e concerned with the design and per for -
mance of foundations, excavations, slopes, and other engineering works
associated with the in-situ soil. However, the engineer can approach
many of these problems with only l imited confidence because the propert ies
of loess and the variations in these propert ies a r e not completely under-
stood. The resu l t s of this uncertainty may be troublcsorne s t ruc tures ,
uneconomical designs, o r both.
A s an example, the procedures f o r the design of spread footings on
loess may be cited. Authorities i n the field of foundation engineering
1 References a r e listed alphabetically in Appendix I . - References

recommend that the footing design be based on field load tests supple-
mented by a study of the effect of seasonal and other moisture changes
on the test results (Terzaghi and Peck, 1967). The interpretation of the
tests must be empirical and follow precedents in the area because there
is no theory to relate the test results to the physical properties of the
loess and the test conditions.
This study has been undertaken to develop a mechanistic explana-
tion of the physical properties of loess. An understanding of this
mechanical behavior should support the development of realistic theories
for bearing capacity and other phenomena of interest to the soils engi-
neer. In the next section, the general character of loess is described to
provide background for the more detailed description of the scope of this
study which follows.
1. 2 Physical Properties of Loess
There is general agreement among investigators that loess is a
wind-deposited sediment transported from the flood plains of glacial
and other r ivers. .The engineering properties a r e derived from its
composition and structure. Studies of the composition of loess deposits
in Kansas and Nebraska (Gibbs and Holland, 1960) and in Iowa (Lyon,
Handy, and Davidson, 1954; Handy, Lyon, and Davidson, 1955) show a
clay content of 10% to 30% with the balance being composed of silt and
fine sand. The clay occurs a s particles, aggregates, or coatings on
the silt particles and is montmorillonite with possibly small amounts of
illite.
The behavior of loess , a s distinguished f r o m that of other soi ls with
the same constituents, depends on i ts undisturbed s t ruc ture . When i ts
undisturbed s t ruc ture is destroyed, loess loses i ts unique charac ter . It
has been observed (Larionov, 1965; Gibbs and Holland, 1960) that the
s i l t -s ized particles do not contact each other but a r e separated by the
clay coatings o r the clay aggregates. As a resul t , the s t rength and com-
pressibil i ty of loess a r e determined primari ly by the propert ies of the
clay fraction.
The undisturbed s t ruc ture has a high porosity but the voids a r e not
uniformly distributed throughout the aggregate. Larionov (1965) c lass i -
f ies these voids a s ultramicroscopic pores (clay-size), occupying to 10%
of the total volume, interpart ic le pores (s i l t -s ize to 0. 5 m m diameter) ,
occupying f r o m 13% to 36% of the volume, and macropores which a r e
channels with consolidated o r calcified walls.
Under natural conditions, the clay-size voids a r e always saturated
(Larionov, 1965) and water may occupy pa r t s of the other voids a s well.
F o r loess deposits in Iowa, Davidson and Sheeler (1952) r epor t natural
water contents f r o m 5% for soi ls with a 10% clay content to 3070 for soils
with 30% clay. The natural water content is a lso rclatc-d to the average
annual rainfall (Peck and Ireland, 1958) and it may vary considerably
with the seasons a s well (Terzaghi, 1951).
The liquid l imit and plasticity index range f r o m 25 to 45 and 5 to 25
respectively. The lower values a r e representat ive of sandy loess while

the higher values a r e fo r clayey loess (Davidson and Sheeler , 1952;
Clevenger, 1958). The natural s ta te of loess is normally very loose a s
a r e su l t of i ts open s t ruc ture and natural unit weights normally range
f r o m 70 pcf to 90 pcf. Densities have also been noted to increase
slightly with depth (Lyon, Handy, and Davidson, 1954).
The significance of the open, loose s t ruc ture of natural loess is
exhibited in i ts compressibil i ty and s t rength charac ter i s t ics . The
s t ruc tu re i s maintained by the bond s trength provided by the clay binder.
If applied s t r e s s e s exceed the binder strength, o r if t he re is a loss in
strength, the s t ruc ture can collapse and la rge compressive deformations
can occur . The p r imary cause for a loss in strength is the wetting and
consequent swelling and softening of the clay binder (Holtz and Gibbs,
1951). There a r e numerous cases reported in the l i te ra ture where the
wetting of a loessial foundation so i l contributed to unusual set t lements
of an otherwise stable foundation (e. g. Clevenger, 1958; Peck and Ireland,
1958).
The shear strength is influenced s imilar ly. F o r a given density and
clay- content, an increase in water content can cause a marked dec rease
in the cohesive s t rength contributed by the binder. Gibbs and Holland
(1960) repor t that with low water contents the cohesive s t rength of ioess
may be a s high a s 15 ps i with a re su l t that nearly ver t ica l slopes, 50ft
to 80 ft high, a r c stablc. When the loess is wt*tlt*d, i ts c:uhosion 1n;ty
drop to less than 1 psi . In addition, high pore p r e s s u r e s dctvolop when

the wetted loess i s loaded. These pore p r e s s u r e s cause a reduced f r i c -
tional r e s i s t ance until they a r e dissipated by drainage.
1. 3 Scope of This Study
The physical proper t ies descr ibed above make i t c l ea r that the
water content of the loess and the re la ted water content of the c lay binder
a r e key f ac to r s determining these proper t ies . Based on these cons idera-
tions, s e v e r a l questions, which a r e the substance of this r e sea rch , can
be formulated:
1. What seasona l variations in natural water content may occur in
a loess deposit?
2 . How is the water content of the whole so i l re la ted to the water
content of the c lay binder?
3 . How a r e the compressibi l i ty and s t rength cha rac t e r i s t i c s of the
undisturbed loes s re la ted to t hese water contents?
4. Can the negative pore water p r e s s u r e in the undisturbed loess ,
i f measured , provide a means for determining the water content of the
clay binder?
This r e s e a r c h has been d i rec ted p r imar i ly a t answering these
questions through field and labora tory studies of the natural soil . The
study has been l imited to a single deposit so that the clay content, s t r u c -
tu re , and mincroiogy of a l l samples would bc a s nniforni a s possible.
The c r i t e r i a used in selecting the s i te , and the soil index proper t ies a r e
presen ted i n chapter 2 .
The field studies were designed to indicate the range in natural
conditions to which the deposit was subjected. The results of these
studies a r e included in Chapter 3, where the si te installation and the
field procedures used to obtain undisturbed samples a r e also described.
To investigate the variations in behavior of the loess, one-
dimensional consolidation tests, unconsolidated-undrained triaxial com-
pression tests , and initial negative pore water pressure tests were run
on the loess in its natural state and with its water content varied to pro-
vide a range which might be encountered naturally. Consolidation and
negative pore water pressure tests were also run on the clay fraction to
study its properties. The conditions for these tests and the results a r e
presented in Chapter 4.
In Chqpter 5, the test results a r e discussed and the interrelation-
ship among the variables i s analysed. A volumetric explanation of the
observed behavior follows f rom this interpretation. In the final chapter,
the work i s summarized and the conclusions a r e presented.

CHAPTER 2
SITE SELECTION AND SOIL INDEX PROPERTIES
2 . 1 Selection of Site
The laboratory and field testing p rogram required a deposit of
undisturbed loess , accessible throughout the year, and available for the
construction of a t e s t pit and periodic sampling f o r water content deter -
minations. Seven s i tes in the vicinity of Iowa City were considered and
a l l but two were eliminated for failing to meet one o r m o r e of the above
cr i te r ia . Pre l iminary so i l classification t e s t s were run on samples f r o m
the two acceptable s i tes and the decision was made to use the deposit
with the grea ter clay content for this study. Work on the s i te with the
smal le r clay content was deferred to a future t ime.
The s i te selected fo r this work i s located about two miles west of
Iowa City on the north s ide of the IWV county road, opposite the Johnson
'ounty School Number 2 and south of the Hawkeye Apartments. The loess
deposit a t this s i te will be identified a s Hawkeye Loess o r Loess H
throughout the remainder of this repor t . The t e s t pit was developed on
top of a gently rolling h i l l where the loess was 15 ft thick and underlain
by sand. In a boring located about 1000 ft to the south, the loess was
underlain by a sandy clay glacial t i l l .
2 . 2 Index Proper t ies of Loess H
The loess in eas t -cent ra l Iowa which includes this s i t e has been
identified a s a Wisconsin-age, o r Peorian, loess . The index propert ies

of the loess a t the tes t s i te a s determined f r o m te s t s on samples taken
f r o m a depth of s ix ft, a r e summarized in Table 2. 1 and the gra in-s ize
distribution curves a r e shown in Fig. 2. 1. The liquid and plastic l imits ,
specific gravity, and grain-size analyses were determined according to
ASTM designations D 423, D 424, D 854, and D 422 resprct ively (ASTM,
1964). The ranges and average values fo r the na tura l dry density and
water content of the specimens t r immed for t r iax ia l and consolidation
testing a r e a l so l isted in the table. The methods used in determining
these values a r e described in Chapter 4. The activity (Skempton, 1953)
has been calculated using the modified definition proposed by Seed,
Woodward, and Lundgren (1 964): ,
A = Change in plasticity index Corresponding change i n clay content
in which A denotes the activity of the clay and the clay content i s the per
cent finer than 0.002 mm. The plasticity index and clay content for
Loess H and the corresponding values for the fractionated clay described
in section 2. 3 below were used in this calculation.
A comparison of the plasticity propert ies of Loess H with other
loessial soi ls i s shown in Fig. 2.2. Loess H plots in the "sil ty loess"
zone which includes most of the Missouri River Basin loess ia l soi l
(Clevenger, 1958). The plasticity index is slightly lowcr than the a v e r -
age curve determined by Shec-lcr and Davidson (1957) for this vast-
ccntral portion of Iowa.

2. 3 Proper t i e s of the Clay Fract ion
Samples of the clay fraction with a particle s ize less than 0. 002 m m
were separa ted f r o m the whole soi l by decantation. In this process , the
loess was f i r s t soaked in d is t i l led water for a t least 24 hours. Approx-
imately 200 g m of the wet s o i l were then agitated for two minutes in a
dispersion cup, the procedure being s imi lar to that used in a hydrometer
analysis except that no chemical deflocculating agent was added. The
d ispersed soi l was then placed in a 1000 m l cylinder of distilled water,
mixed, and permitted to set t le for a specified period of t ime. The s u s -
pended solids and water were then decanted. The same procedure was
repeated two m o r e t imes using the decantate to ensure the separat ion of
the clay- and s i l t - s ize par t ic les . The clay and water was then placed in
a shallow pan and the water was permit ted to evaporate. When the cons is -
tency of the clay was that of a s lu r ry , i t was placed in a meta l cylinder
and consolidated under a p r e s s u r e of about 20 psi to a water content of
100% to 110%. The samples were then s tored in a moist chamber until
required for testing.
The Atterberg l imits and specific gravity of the finer than 0.002 m m
clay fract ion a r e l isted in Table 2. 1. The shrinkage limit was determined
according to ASTM designation D 427 (ASTM, 1964) and the other t e s t s
were the s a m e a s those descr ibed above.

CHAPTER 3
FIELD STUDIES AND SAMPLING PROCEDURES
3. 1 Description of Site and Test Pit
A section through the test site showing the test pit and the obser-
vation well installations is shown in Fig. 3. 1. The ground surface slopes
gently away from the test pit on all sides except a t the road cut on the
south. The test pit was dug initially to a depth of 6 ft below the reference
datum and was 3 . 5 ft square in plan. After all the sampling work was
completed, the pit was 7 ft deep and about 6 ft square. A plywood cover
and plastic tarpaulin were used to keep the test pit clean and dry.
Two observation wells consisting of 6411.-diameter uncased auger
borings were used t o observe the level of the ground water. These became
unusable after about 6 months of operation and they were replaced by
piezometers installed nearby as shown in Fig. 3. 1. The piezometers
were 1-1 12 in. -diameter by 2 ft-long porous tubes with 112 in. -outside
diameter polyethylene tubing extending to the ground surface. Thcse
elements were installed in 3-in. auger borings backfilled with sand. An
electric water level indicator was used to locate the depth of the water
surface in the polyethylene tube.
3 . 2 Field Water Content Measurements and Weather Data
To measure the natural variation in water content at the site, auger
borings were made periodically and water content samples were taken

at depths f rom 2 f t to 12 ft below the ground surface. The borings were
all located within 15 ft of a line extending from the reference post to the
observation well No. 2 (F ig . 3. 1). In all, forty-one borings were made
in the a rea with a minimum spacing of 4 ft between adjacent holes. After
the samples were taken, the holes were backfilled to eliminate any pos-
sible influence on subsequent water content measurements. The water
content measurements and ground water levels from October 1966
through September 1967 a re shown in Figs. 3 . 2 to 3 . 7. Since the ground
surface slopes about 3 ft in the area in which the borings were made,
and since the ground water surface was also observed to slope approx-
imately parallel to the ground surface, the water content profiles a r e
referenced by depth below the ground surface rather than by elevation.
On the other hand, the water levels in the observation wells and piezo-
meters a r e more conveniently tied to the reference datum.
The precipitation and temperature records for the same period a re
also shown in Figs. 3 . 2 to 3. 7. These records were obtained from the
Iowa City Cooperative Observers Weather Station. The precipitation at
the site was also measured with a rain gage located on the reference
post. The available records f rom this gage and the monthly records
f rom the Weather Station a r e given in Table 3.1 for comparison. The
agreement indicates that the Iowa City measurements a r e valid for the
field site. Table 3.1 also lists the 10-year and 70-year averages of
the monthly precipitation. The year from October 1966 to September 1967

is seen to be about average except fo r a somewhat wetter June and d rye r
May and July.
The variation of natural water content with depth below ground s u r -
face is shown i n Figs. 3 . 8 to 3. 11 for representat ive days, and the range
in natural water contents for the period October 1966 to September 1967
i s shown in Fig. 3. 12. Below a 6 ft depth the spread in natural water
contents was f r o m 26% to 3370. This corresponds to a range in degree of
saturat ion of about 75% to 90%.
3 . 3 Sampling Procedures
Blocks of soil were removed f r o m the tes t pit to provide undisturbed
specimens for the laboratory t e s t s . This work was done between October
25 and December 12, 1966. The procedure was to hand-carve the blocks
f r o m the lower corners of the t e s t pit. The blocks measured about 8 in.
by 10 in. by 12 in. The plan-locations and depths of the blocks were
recorded and th ree water content samples w e r e taken f r o m rach block.
The variation i n these water contents frorn a single block was found to
be f r o m 1% to 3%.
After a block was removed, i t was covered with a plastic bag,
wrapped with mois t rags , and finally covered with another plastic bag.
The block was then placed in a cardboard car ton and t ranspor ted to the
laboratory by c a r . Upon a r r i v a l a t the laboratory, the blocks were
divided into sma l l e r samples o r , when necessary, s tored in a moist
room for a maximum of two days brforc, subdividing.

The blocks were subdivided by scoring them with an ice pick. The
subdivided portions were then trimmed to the nominal dimensions of 3 in.
by 3 in. by 6 in. for the triaxial test specimens, and 2 in. thick by 4 in.
in diameter for the consolidation test specimens. At this time, water
content samples were again taken for a final check before the samples
were sealed for storage.
Since the laboratory testing program extended for about 8 months
the samples had to be prepared for storage with great care. They were
f i rs t wrapped in aluminum foil and then dipped several times into molten
paraffin. Finally they were placed in a plastic bag and the weight of the
entire package was recorded to permit a check on moisture loss i f
desired. Each packaged sample was identified so that its original location
in the test pit could be determined.
The samples were stored in a moist room until needed for testing.
The weights of the wrapped samples were measured just prior to testing
and on the basis of these measurements and the earl ier water content
determinations i t was found that the total loss in water contcnt between
carving the block a t the test pit and removing the sample from storagc
was less than 1%.
CHAPTER 4
LABORATORY TESTS
4. 1 Introduction
The purpose of the laboratory testing program was two-fold. F i r s t
i t was essential to define the strength and compressibility properties of
the loess with its natural structure intact and with water contents through-
out a range which might exist naturally over some period of time. To
this end, the water contents of the structually undisturbed specimens
were altered, a s described in the following section, and nominal water
contents of 8% 1470, 2070, 2670, and 32% were achieved. The natural
water content was about 26% and the loess became saturated a t a water
content of 35%. One-dimensional consolidation tests, undrained hydro-
static compression tests, and undrained triaxial compression tests were
run and the equipment, conditions, and results of these tests a r e pre-
sented later in this chapter.
The second purpose was to measure other properties of the soil
that would provide a basis for understanding the behavior mechanism.
Thus the initial negative pore pressure was selected and measured for
the undisturbed specimens with the water content again varied from 8%
to 32%. In addition, the remolded clay fraction of the loess, separated
by the procedure described in Chapter 2 , was subjected to one-dimensional
and hydrostatic consolidation tests. The negative pore water pressure in
the remolded clay was also measured at various water contents. The final

sections of this chapter present the negative pore pressure test results
and the results of the tests on the clay fraction.
4 . 2 Preparation of Test Specimens
The undisturbed samples at their natural water contcnts were
stored in a moist-room as described in Chapter 3 until required by the
testing program. For the tests on the soil at the nominal water content
of 26%, the tes t specimens were carved directly from the samples at
their natural water contents. For all other tests i t was necessary to
either reduce or increase the water content of the sample before trimming
to test specimen size.
The alteration of the water content was accomplished in the following
manner. To achieve a water content of 3270, the sample as stored at its
natural water content was unwrapped and wetted by spraying the surface
with a measured quantity of water. The sample was then rewrapped and
placed in the moist room for several days to permit the dispersal of the
water throughout the soil. This process was repeated until the water
content of the sample, estimated from the sample's wet weight and its
original weight and water content, was the desired 3270. The sample was
then trimmed to triaxial specimen-size or into the consolidation ring
for testing. The water contents of the specimen and the trimmings were
compared to check the uniformity of water distribution in the sample and
in'all cascs the differences were l r s s than 1%.
Watcr contents below thc natural water content were achieved by

permitting the surface of the sample to air-dry for several hours, during
which time the samplc was weighed periodically to determine the weight
of water evaporated. The sample was then stored in the nioist room to
permit the remaining soil moisture to redistribute itself. This process
was repeated until the desired water content was reached. It was found
that air-drying the samples too rapidly produced cracks which required
discarding the sample.
The modified water contents were in general within 270 of the desired
nominal water content. The maximum deviation of the natural water con-
tents from the nominal value of 26% was about the same.
The dry densities of the consolidation and triaxial test specimens
were calculated from their initial dimensions and oven-dry weights.
These densities are plotted against the initial water contents in Fig. 4. 1
to illustrate the effect of varying the water content on the density of the
loess. No significant change in density resulted from the increase in
water content to 32% or the reduction to 20%. However, drying to water
contents of 14% and 8% caused some shrinkage and an increase in density
of 2 pcf to 4 pcf. Fig. 4. 1 also shows that the initial degrees of satura-
tion of the specimens range from about 90% for the wet sprcimens to 2570
for the dry specimens. At the natural water content the degree of sa tura -
tion varies from 70% to 80%.

4. 3 One -Dimensional Consolidation Tes t s
Equipment. A bench model consolidation tes t machine1, having dead-
weight leading a t a lever rat io of 10 to 1, was used to load the specimens
in the one-dimensional consolidation tes t s . The consolidometerl was the
fixed r ing type, 2.5 in. in diameter and 0. 75 in. in height with a cutting
edge to permi t the specimen to be t r immed directly into the ring. A dial
indicator reading 0.0001 in. was used to measure the of the
specimen.
T e s t conditions. The soi l specimen a t the desired water content
was t r immed d i rec t ly into the consolidometer ring and weighed for the
init ial water content determination. Moistened f i l ter paper c i rc les were
then placed on the top and bottom faces, and the specimen and the r ing
were placed in the consolidometer. The lower consolidometer stone and
the loading cap stone were also moistened before being placed in contact
with the fi l ter paper. Drying of the sample during the tes t was prevented
by enclosing the top of the consolidometer with a polyethylene cover, sealed
to the s ides and around the loading cap. Moist sponges inside the consoli-
dometer maintained a high humidity.
The tes t specimen was loaded initially with a sma l l seating load af te r
which the load was increased in increments f r o m 0.25 tsf t o 32 tsf. The
1 Manufactured by Wykeham F a r r a n c e Engineering Ltd.

I conventional geometric progression of load increments was used. Each
1 load increment was maintained for two hours after which the following )
i increment was applied. The two-hour duration was determined to be
adequate on the basis of tests with longer durations. These tests showed )
that the plot of compression dial reading vs. log of time flattened after !
one hour to a constant slope of 0. 0025 in. o r less for a ten-fold increase )
in time. This deformation corresponds to a change in void ratio equal )
to about 0.006 and does not have a significant effect on the pressure-void i
ratio relationship. The use of such durations shorter than the conventional J
24-hour duration has been investigated by Leonards and Ramiah (1960) )
among others with the conclusion that the load increment duration has )
an insignificant effect on the pressure-void ratio relationship provided i 5
the duration is sufficiently long to permit most of the primary consolidation )
to occur. )
Unloading was accomplished by removing load increments equal )
to three -fourths of the previous load until the pressure of 0. 5 tsf was 1 ,
attained, whereupon al l weights were removed. The specimen was then j
weighed and dried for the final water content determination.
Test Results
Typical void ratio-logpressure relationships for each nominal water
content a r e shown in Fig. 4 . 2 and the results o f a l l thv consolidation I
tests a r e summarized in Tablo 4. 1. Tho notation used in 'Table 4. 1 i s !
as follows:
)
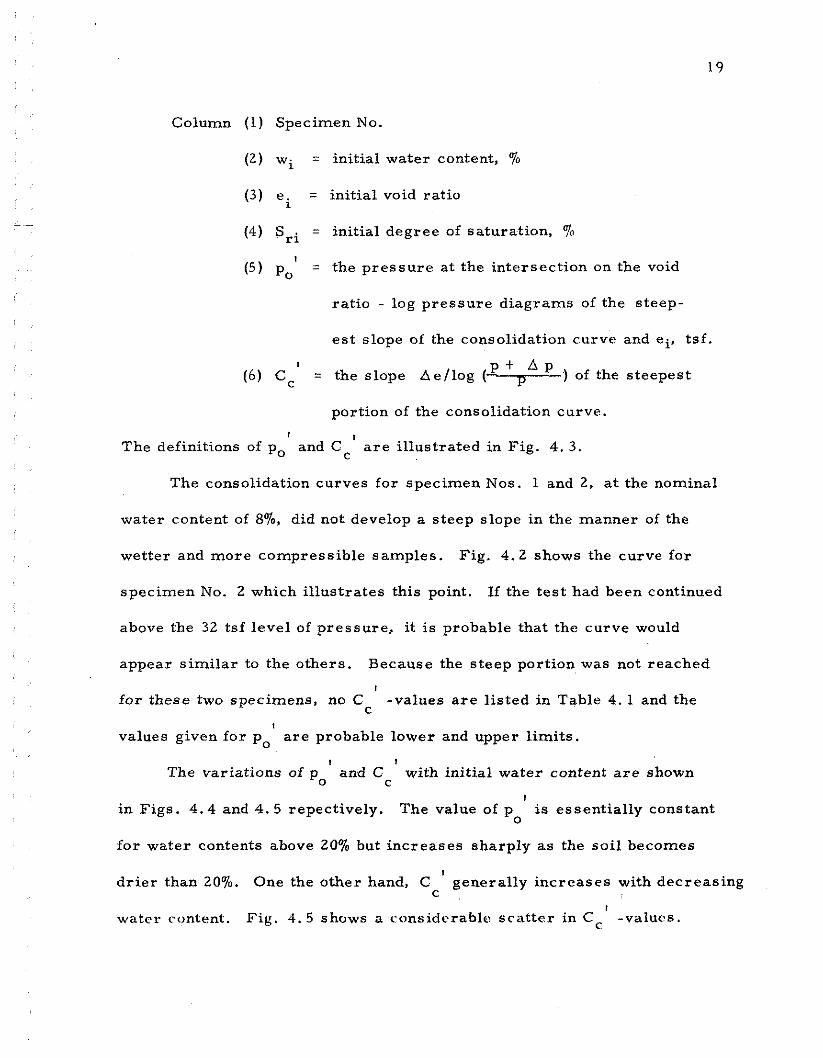
Column (1) Specimen No.
(2) wi = initial water content, %
(3) ei = initial void ratio
(4) Sri = initial degree of saturation, 70 1
(5) po = the pressure at the intersection on the void
ratio - log pressure diagrams of the steep-
es t slope of the consolidation curve and ei, tsf.
1 P + A P (6) Cc = the slope Aellog (---F-----) of the steepest
portion of the consolidation curve. I I
The definitions of po and Cc a r e illustrated in Fig. 4. 3.
The consolidation curves for specimen Nos. 1 and 2, a t the nominal
water content of 870, did not develop a steep slope in the manner of the
wetter and more compressible samples. Fig. 4.2 shows the curve for
specimen No. 2 which illustrates this point. If the test had been continued
above the 32 tsf level of pressure, it is probable that the curve would
appear similar to the others. Because the steep portion was not reached
I
for these two specimens, no C -values a r e listed in Table 4. 1 and the C
I
values given for po a r e probable lower and upper limits.
I I
The variations of p and C with initial water content a r e shown 0 C
in Figs. 4 . 4 and 4.5 repectively. The value of p is essentially constant 0
for water contents above 20% but increases sharply as the soil becomes
I drier than 20%. One the other hand, C generally increases with decreasing
C I
watcr content. Fig. 4 . 5 shows rt considerablr. scnttcr in Cc -values.

A part, but not all, of this scatter is due to differences in initial void
rat io; that is, at a given water content, the specimens with higher void
1
ratios have higher C c -values in most cases. It is interesting to note
1 I that, while decreasing the water content increases po , Cc also increases
and thus the dry specimens a r e more compressible than the wet ones a t
!
pressures above po . 4.4 Triaxial Compression Tests
Equipment. The equipment used for the triaxial compression tests
1 included the following major elements :
a. 5-ton capacity gear driven compression test machine.
b. Self -compensating constant pressure apparatus for applying
cell pressures to 140 psi.
c. Cell volume change measuring apparatus.
d. Triaxial cells for 1-112 in. diameter specimens with working
pressure of 150 psi.
e . Load rings for axial load measurement, of high strength steel
with capacities of 500 and 1000 lbs.
Test Conditions and Procedures. The triaxial compression tests
on the loess were unconsolidated-undrained tests; that is, the specimens
were sealed so that water and a i r could neither enter nor leave the speci-
men during the application of both the cell pressure and the axial load.
A ser ies of tests with cell pressures ranging from zero to 140 psi was
1 Manufactured by Wykeham Farrance Engineering Ltd.

run on specimens of the loess a t each nominal water content. The speci-
mens were trimmed in a humid room from the soil samples previously
prepared and cured at the desired water content (Section 4.2). The trimmed
specimens were 1.5 in. in diameter and 3 . 4 in. in height. Immediately
after trimming, the specimens were weighed, placed in the triaxial cell,
and enclosed in a rubber membrane which was sealed to a lucite base disc
and loading cap.
The triaxial cell was then assembled, filled with water, and the
cell pressure applied. The volume change in the specimen which occurred
during the application of the cell pressure was measured by use of the
volume change apparatus. In this apparatus, volume changes under p res -
sure a r e indicated by the displacement of a liquid paraffin-water interface
in a burette with 0. 1 cc divisions. A zero reading is taken with the
specimen in place and the cell filled with water. When the cell pressure
is applied, water flows into the cell due to expansion of the cell and com-
pression of the specimen. The cell expansion was determined for various
cell pressures by calibration tests run in an identical manner but without
a soil specimen. Thus the volume change of the specimen may be deter-
mined by subtracting the cell volume change from the measured volume
change. The specimen volume change is accurate to - t 0.2 cc which,
for the volumes, densities, and water contents in these tests, corres-
ponds to a computed increase in degree of saturation currect to within
+ 0.5%. The presence of a i r trapped in the cell and between the specimen -
and the membrane would cause the computed increase in degree of satura-
tion to be too great. Care was taken to avoid trapping any significant
quantity of air but some a i r bubbles could be observed. With the effect
of trapped air taken into account, the maximum e r ro r in the dcgree of
saturation is estimated to be t 2%.
The compression of the soil under the cell pressure was not instan-
taneous and fixed durations of pressure were used to assure uniform
compression. The duration was 10 min. for the 20 psi cell pressure;
this was increased by 5 min. for each additional 20 psi to 40 min. for
140 psi. The volume changes due to the cell pressure were essentially
complete by the end of these periods.
After compression under the cell pressure, the axial s t r e s s was
increased using a strain rate of 0. 6% per minute. The test was continued
until the axial s t ress decreased o r 20% strain was reached. After testing,
the specimen was removed from the cell, weighed, and oven dried for
the water content determination.
Test Results. The s t ress-s t ra in curves for all tests , grouped
according to nominal water content, a r e shown in Figs. 4 .6 to 4. 10 and
the test results and pertinent data are summarized in Table 4.2. The
notation used in the table is as follows:
Column (1) Specimen No.
(2) w - water content, U/o
(3) ei = initial void ratio

(4) Sri = initial degree of saturation, 70
(5) c3 = cell pressure, psi
(6) Src = degree of saturation after
compression due to cell pressure, qu
(7) (C1- b ) 1 2 = half the s t ress difference (CT - 0- ) 3 f 1 3
at failure, psi
(8) cf = the axial strain at failure, '3'0
(9) E s = the axial strain at half the failure s t ress , %
(11) Es = the secant modulus at helf the failure
s t ress , psi
(12) Ei = the initial tangent modulus, psi
In order that the results given in Table 4 . 2 may be readily inter -
preted, the influence of the water content and the confining pressure on
various quantities in and derived from the table a r e discussed in the
following paragraphs.
The relative increase in degree of saturation, a s a result of undrained
hydrostatic compression, defined here as the ratio of the actual to the
potential increase in saturation (S -S .) / (100-Sri), is plotted against the r c r i
confining pressure for each nominal water content in Fig. 4. 11. The
wettest specimens experienced the greatest relative increase in degree
of saturation whereas the driest specimens experienced the least. Since
the wettest specimens were also the weakest, this result would of course
be expected. However, by the comparison of columns (4) and ( 6 ) in

Table 4.2, it is seen that the greatest absolute a s contrasted to relative I
)
increase in the degree of saturation occurs for the specimens with nominal )
I water contents of 2070 and 2670. At these water contents the effects of a
\
low strength and a relatively high potential volume change combine to I
produce this result. The dr ier specimens, having nominal water contents I
\
of 8% and 1470, have a greater strength and their structure does not col-
lapse at the test pressure levels. The wettest specimens with a nominal
water content of 3270 have high degrees of saturation initially and therefore )
can compress only a small amount under undrained hydrostatic compression. 1
Separate plots of (cl- C ) 12 versus water content, columns (7) 3 f
and (2) respectively of Table 4.2, have been made for each value of con-
fining pressure in order that the strengths a t the nominal water contents
could be interpolated. These plots a r e shown in Figs. 4. 12 to 4.19.
The difference between the strength a t the nominal water content and at
the actual water content is smal l in most cases because the actual and
nominal water contents were not greatly different.
The adjusted values of ( Cl- ) /2 and the corresponding values 3 f 1
of (C + 6 ) 12 a r e plotted for each nominal water content in Figs. 4 .20 I
1 3 f
to 4.24. These plots a r e known as modified Mohr-Coulomb diagrams I
l and, in each figure, a straight line has been fit to the plotted points using
a least square analysis. The intercept - a and slope cl, of this line a r e 1
related directly to the cohesion intercept cU and slope qU of the conven- i
tional Mohr-Ct>ulornb failure <*nvrlopc~. In car21 I'ignrt* the valilc's of 5 ) )

and 9 obtained from the plot and the computed values of c U and + a r e u
listed.
The total s t ress failure envelope for unconsolidated-undrained
tests on unsaturated soil i s actually curved because the slope depends on
the degree of saturation. As the confining pressure increases, pore air
dissolves in the pore water and the degree of saturation increases. Thus
the envelope flattens and approaches the horizontal when complete satura-
tion is reached. The amount of curvature for a given pressure range
depends on the magnitude of the change in degree of saturation. On the
diagrams in Figs. 4.20 to 4.24, this curvature is small enough to be
obscured by differences due to other causes, eg., differences in density
and natural structure of the undisturbed specimens. Therefore the values
of +u and cU listed in the figures have been accepted a s good approxi-
mations for the full pressure range under consideration and the corres-
ponding Mohr-Coulomb failure envelopes for each water content a r e plotted
in Fig. 4.25.
A final presentation of the strength data is given in Figs. 4.26 and
4.27 where the accepted values of + U and c a r e plotted against water u
content. The value of c, Fig . 4.26, decreases rapidly a s the water
content increases from 14% to 26%. This behavior i s the direct result
of the dependence of +U on the degree of saturation ST. At water rontt.nt8
of 14% and smaller, Sr is less than 40% (Fig. 4. 1 ) and the rrlativr incrc.usc.
in ST as a result of undrained compression is small (Fig. 4.11). On the

other hand, at w = 2670 the value of Sr is almost 8070, the relative increase
in Sr is large, and the soil is nearly saturated. Since the value of
becomes zero upon saturation, i t is evident that the marked decrease in
Qu should occur in the range w = 14% to w = 2670 as observed.
On the other hand, the value of the intercept cu (Fig. 4.27) decreases
sharply between w = 8% and w = 14%. The interccpt cU represents the
undrained shear strength of the soil under a total normal s t ress of zero.
This in turn depends on the attractive forces between the clay particles
and the pore pressures which exist during shear, that is, on the undrained
strength of the clay binder. Thus the observed reduction in cU indicates
that the undrained strength of the clay binder diminishes to a near minimum
value a s the water content increases to 1470,
The initial tangent modulus and the secant modulus a r e plotted
against confining pressure for each water content in Fig. 4.28. Both
moduli a r e greatest by a significant amount at the 8% water content. The
greatest reductions in moduli occur in the increment of water content
between 8% and 14%; this parallels the similar behavior of the apparent
cohesion observed above. It is notable that the secant modulus a t high
confining pressures increases a s the water content increases f rom 14%
to 32%. This reversal in behavior may be explained by the greater volume
reductions experienced by the dr ier specimens during the undrained appli-
cation of the confining pressure. This compression altered the structure
so that failure occurred at s trains significantly greater than the failure

strains for specimens whose volume decreased only slightly, that is, thosc
with low confining pressures or high water contents.
4.5 Initial Negative Pore Water Pressure Tests
Equipment. The initial negative pore water pressures were measured
using the exposed end-plate procedure developed by the U. S. Bureau of
Reclamation (Gibbs and Coffey, 1963).
This method makes use of a saturated fine-pore ceramic stone which
is mounted so that the top is exposed to air and the bottom is connected
to a closed system in which the pore water pressure can be adjusted and
measured. Negative pressures in the stone are maintained by the menisci
formed at the air-water interface on the exposed face of the stone. A
partly saturated soil specimen is placed on the stone so that the water
phase in the soil is continuous with the pore water in the stone. The nega-
tive pore water pressure in the stone is then adjusted so that there is no
flow of water in either direction between the soil and the stone. Under
these conditions, the pore pressure in the stone is equal to that in the soil.
There a r e several technical problems which must be overcome. First ,
the water in the stone will cavitate when the negative pressure exceeds
about 1 atmosphere. Should this occur, the pressure can no longer be
measured or maintained. This condition is avoided by increasing the
a i r pressure above the stone and the pore water pressure in the stone
simultaneously. No change in the shapes of the menisci will occur since
they depend only on the difference in pressure across the air-water interface.
In effect, the pressure datum is shifted sufficiently to keep the pore
pressure in the stone at a level where there is no danger of cavitation.
This technique is known as the " t ransfer of origin" method (Gibbs, et al,
1960) o r the "axis translation technique" (Olsen & Langfelder, 1965).
The ceramic stone and plate must also be sufficiently fine so that
the air entry value, i. e. the a i r pressure that will cause an air bubble
to enter the stone, exceeds the negative pore pressure in the soil. If
this precaution is not taken, a i r will enter the stone and the water in the
stone will cavitate. Three stones were used in these tests having a i r
entry values of approximately 40 psi, 80 psi, and 210 psi.
The major elements of the apparatus for measuring the negative
pore pressures are shown schematically in Fig. 4.29. A standard
triaxial cell was modified so that a 1-718 in. - diameter ceramic stone
with the desired a i r entry value could be mounted on the base. The
outlet from the stone was connected to a mercury U-tube null indicator
through a length of 118 in. OD copper tubing. The null indicator was
balanced by adjusting the pressure in a mercury U-tube manometer by
means of a screw control. The outlet from the stone also led through
a valve to a water-filled burette. A regulated air pressure supply was
connected to the cell and measured with a Bourdon gage. The maximum
pressure available was 80 psi.
Test Conditions and Procedures. The successful measurement of
negative port, prc,ssurcs requires that the apparatus betwrtsn the stone

and the null indicator be completely deaired. To ensure this condition,
the ceramic end plate was boiled under a vacuum and deaired water was
forced through the remaining par ts of the system prior to assembly. The
triaxial cell base was then submerged in a deep basin of water and the end
plate mounted under water. The cell base was removed from the basin
and a positive pressure was maintained under the end platc by opening the
valve to the burette.
The specimens used in the initial negative pore pressure tests were
with few exceptions subsequently used for the triaxial tests. The specimens
were thus 1-1/2 in. in diameter and 3 . 4 in. long. The test was started by
f i rs t wiping the end plate with a moist cloth, seating the specimen firmly
on the end plate, closing the valve to the burette, and assembling the top
of the cell to the base. This procedure was accomplished very quickly
and as soon as the burette valve was closed, the mercury in the null indicator
started to move upwards indicating a flow of water into the soil specimen.
This movement was neutralized by reducing the pressure in the manometer.
When the pressure in the manometer was reduced to -5 psi, the cell p res -
sure was increased by an increment of 5 psi, the manometer returned to
zero pressure, and the burette valve opened and closed instantaneously to
prevent a further build-up in negative pressure and possible cavitation. The
process of adjusting the manometer pressure and increasing the cell p res -
sure was repeated until equilibrium was indicated by no further tendency
for flow into or out of the soil. A t this point, the negative pore pressure

I in the soil is taken to be the algebraic difference between the manometer
pressure and the cell pressure. Thus a manometer pressure of - 3.0 ps i 1
and a cell pressure of 15.0 ps i indicate an initial negative pore pressure
of - 18.0 psi.
One of the major difficulties encountered in these tests was the
need for the continuous adjustment of the pressure to maintain balance in I
the null indicator. For tests requiring one or two hours for equilibrium
to be reached, it was possible to make the necessary adjustments. How- \
ever, some of the tests, in particular the tests with high negative pore
pressures and the finest stone, did not reach equilibrium until 10 to 20
hours after starting. In these cases it was necessary to shut the test
down overnight and resume the following day. This was accomplished by
closing the outlet valve on the cell thus ensuring that no water could be
drawn into the system. The cell pressure was then increased to a level
that would ensure that the pore pressure in the stone would not fall below
- 5 psi before the next reading was to be taken. The next pressure reading 1
could not be taken, however, without f i r s t placing the null indicator back
in the system. In doing this, an effort was made to predict the negative
pressure in the stone and to place the null indicator under this pressure
before the outlet valve on the cell was opened. If the predicted pressure 1
was correct, no flow would occur upon opening the valve. If the predicted \,
I pressure was not precisely correct, which was generally the case, an ,.
immediate flow wc)uld occur clues 1.0 thv ovarshoot o r und<~rsho<rt. tiapid )

pressure adjustments were necessary to balance the null indicator and a
tendency to over-correct existed. As a result the readings immediately
after opening the outlet valve on the cell showed fluctuations in pressure
as great as 2 psi. The fluctuations diminished with time and the system
returned to its original rate of adjustment toward equilibrium.
Examples of the time lags i n reaching equilibrium a re shown in
Figs. 4. 30 and 4. 31. In Fig. 4. 30 the results of Test No. 15, in which
the 80-psi stone was used, demonstrate a smooth approach to equilibrium
which i s attained at about 15 min. after the s tar t of the test. A more
irregular curve is shown in Fig. 4.31 for Test No. I . The 210-psi stone
was used for this test and the specimen was dr ier than that in Test No.
15. Equilibrium was not attained until about 22 hours after the s ta r t of
the test. The time required for these long-duration tests put an unfortunate
limitation on the number of tests that could be run.
Test Results. The results of the initial negative pore pressure tests
a r e given in Table 4.3. In the tests in which a triaxial specimen was tested,
the triaxial specimen number is also given and additional data on these
specimens may be obtained in Table 4.2. For each negative pore pressure
test, Table 4. 3 gives the water content of the specimen, the degrce of
saturation, i f available, the measured pore water pressure u, the time
lag for equilibrium as illustrated in Figs. 4.30 and 4. 31, and the a i r
entry value of the stone used in the test. No test results a r e given for
the specimens with nominal water contents of 8% because their negative

pore pressures were lower than the -80-psi capacity of the equipment. j
Test Nos. 6A and 6 B were run on opposite ends of the same specimen \
and the difference in measured pore pressure is about 13% of the larger j
)
value. This may have been due to differences in the ends of the specimen, )
or due to e r ro r s caused by the test procedure. Based on these differences, I
) on the fluctuations in the measurements that occurred in some of the \
longer tests (eg. F ig . 4.31), and on the scatter in the values a t a given
water content, the negative pressures a r e believed to be within it 10% of )
the measured values. i
The negative pore pressures a r e plotted against water content in
Fig. 4. 32. A different symbol is used for each end plate and the demon-
strated agreement among the results with the different end plates supports I
the validity of the test procedure. I \
A curve has been f i t to the plotted points to provide an empirical
I equation relating the water content to the negative pore pressure. The
curve has the equation j
The good fit illustrated is, of course, empirical and other types of
curves could be f i t to the data with similar success.
1 The relation between negative pore pressure and degree of satura-
tion is shown in Fig. 4.33. This relationship is s imilar to the negative )
pore pressure-water content relationship in Fig. 4. 32 but there is some- )
)
what greater scatter in thr data points. )
4.6 Tests on Clay Fraction
Consolidation Tests. A one-dimensional consolidation test and a
triaxial consolidation test were run on the clay fraction which had been
separated from the whole loess soil as described in chapter 2. The speci-
mens for both tests were saturated and had an initial water content
slightly greater than 10070. The resulting void ratio-log pressure curves
a r e shown in Fig. 4.34 and it i s evident that the relationships a r e essen-
tially the same for both tests.
Initial Negative Pore Pressure Tests. Specimens of the clay fraction
a t water contents ranging from 112.2% to 35.070 were prepared by permit-
ting the clay to air-dry to the approximate water content desired,
removing any crust from the surface, remolding to assure a uniform
distribution of water, and finally curing for at least one day in a moist
chamber. The specimens were then tested using the equipment and pro-
cedures described above in Section 4.5.
The results of the negative pore pressure tests a r e presented in
Table 4.4 and the relationship between the water content and the negative
pore pressure is shown in Fig. 4.35. An empirical curve which has
been fi t to the data having the equation
is also shown in the figure.

CHAPTER 5
1NTERPRETA.TION O F RESULTS
5. 1 Volumetric Relations
The physical properties of loess would be more readily understood
if the structure and arrangement of the si l t - and clay-size fractions were
known. While the test results do not allow a definitive description to be
made, several limiting conditions may be inferred. Additional results
may permit the narrowing of these limits.
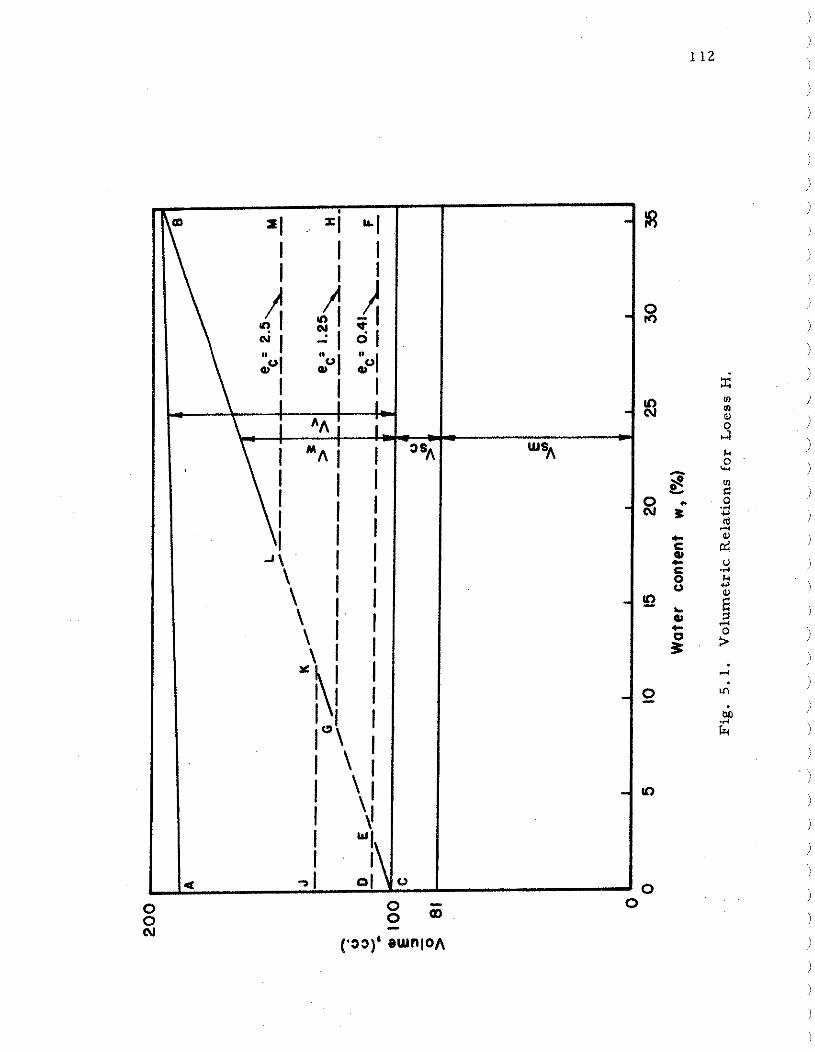
A diagram illustrating the volumetric relations is shown in Fig. 5. 1.
For convenience, the volume of solids Vs is taken to be 100 cc. As given
in Table 2. 1, the percentage of clay-size particles finer than 0. 002 mm
is 19% and the specific gravities of the si l t and clay components a r e
nearly equal. Therefore the total volume of solids in this example is com-
posed of 19 cc of clay-size particles and 81 cc of silt-size particles. These
volumes a r e denoted by the symbols Vsc and Vsm respectively. The
undisturbed void ratio varies with water content from about 0.97 at w = 32%
to 0. 88 a t w = 8% (Table 4.2). The void ratio of the loess when completely
dry was found to be 0.85. Thus the total volume of the lorss is shown in
Fig. 5.1 to vary f rom 185 cc for w = 0% to 198 cc when saturated a t w =
36% (line AB). The volume of water Vw increases linearly from 0 to 98 cc
a t w = 36% (line CB).
The voids Vv may be classed according to size a s were the solids.
Thus some of the voids exist between clay-size particles while the remaining

voids a r e larger in size and exist between the silt-size particles and aggre-
gates of particles. The former a r e referred to a s clay-voids V and the VC
latter macro-voids V in the following discussion. vm
With the above notation, the void ratio e is:
It is convenient to define two additional ratios, the macro-void ratio, e . m'
and the clay-void ratio ec:
The smallest volume of clay-voids must be greater than that correspond-
ing to the shrinkage limit of the remolded clay fraction (Table 2. 1). This
clay-void ratio is 0.41 and therefore the lower limit for V is 8 cc (line VC
DEF). Since the finest voids will be the last to be dried, it is evident
that the clay-voids will be saturated and that, if Vvc = 8 cc, there w i l l
also be water in the macro-voids for al l values of w greater than about
3%. Thus the clay, if it were at the shrinkage limit initially, would be
free to swell in accordance with the void ratio-pressure relationship for
rebounding f rom the shrinkage limit. An estimate of the void ratio after
swelling may be obtained f rom Fig. 4. 34 by extcnding the compression
curve to e : 0.41, and thcn returning to a pressurr of 0. 1 1st' along a path

I parallel to the rebound curves. This procedure indicates a final void ratio
of about 1.25 after swelling. This volume increase is shown by line EG, )
Fig. 5. 1, and the clay volume with free water in the macro-voids is line GH.
If the clay particle arrangement is flocculent, the clay-void volume \
will be represented by a higher line, such as JKLM, instead of DEGH i
which was based on remolded clay and therefore a dispersed particle i
arrangement. The location of JKLM is not known but may be deduced )
indirectly. Thus a significant change in the properties of the loess would I
\
be expected when the clay is compressed by desiccation as the water con- i
I tent decreases f rom L to K. On the other hand, for water contents between
I
L and M, where the clay volume is stable, the properties of the loess I
should be relatively constant. Point L in Fig. 5. 1 has been se t in a water i
content range where the properties of the loess were found vary signifi- )
cantly; however, the location within the range was arbitarily chosen to 1
correspond with a clay-void ratio twice that of line GH, ie. with e = 2.5. C
I It is of interest to consider the implications of the location of line
I
JKLM with regard to the structure and particle arrangement of the loess
as a whole. If i t is assumed that the clay occurs as a coating on the
surface of the si l t particles and if the resulting clay-silt particle is con- i
sidered as an individual grain, then the structural arrangement and packing )
of these grains is reflected in the value of the macro-void ratio in the same I
\
manner that the packing of a sand i s reflected in the value of its void ratio. i
For line JKLM in Fig. 5. 1, the macro-void ratio i s from 0. 33 to 0.42, 1

whereas for line DEGH it is from 0.59 to 0. 74. The former values a r e
representative of a dense single grain packing and the latter a medium
to loose packing. If JKLM is accepted as the most likely clay-void line,
the structure of the loess would be described as a dense packing of low-
density grains, that is,of grains which a re composed of silt particles
coated with a porous clay binder.
5.2 Strength and Compressibility as a Function of Water Content
The volumetric relations in Fig. 5. 1 may be used to explain the
influence of the water content on the strength and compressibility of
loess. The variation with water content of the strength, as described
by the undrained failure parameters and c and of the compressi- u'
I 1 bility, described by the parameters p and C was shown in Figs.
0 C
4.26, 4.27, 4.4, and 4.5 respectively. The relationships between these
parameters and the volumetric relations a r e considered in the following
paragraphs.
The value of 4 , as discussed in section 4.4, depends on the degree u
of saturation S and approaches zero as Sr approaches 100%. The r
observed reductiqn in qlU as the water content increases from 14% to 26%
is the result of the increase in saturation which occurs in this interval
under confining pressures to 140 psi. Thus 4, depends not only on the u
water content, but also on the confining pressure and compressibility of
the soil structure, all of which influence the degree of saturation. As
a result of these considerations, it is evident that the volumetric relations

in Fig. 5. 1 can not in themselves explain the behavior of c/? u' I
On the other hand, the value of cU depends on the undrained strength i \
of the clay binder because i t represents the shear strength with zero
confining pressure. The cohesion vs. water content plot in Fig. 4.27
shows a marked change in behavior at a water content of 14%. As the i
water content increases to 14%, there i s a sharp reduction in c whereas J
u I
above 14% water content there i s only a slight reduction. Reference to \
Fig. 5. 1 indicates that 14% water content i s between points K and L, that 1
is, within the range where the clay binder is swelling and thus softening I
; and losing strength.
1 1
The slope Cc of the steep portion of the void ratio-log pressure 1
diagram decreases with increasing water content (Fig. 4.5), but the
1 total reduction is small. It should be noted that Cc could not be
obtained for water contents below 14% because the void ratio-log pres-
sure curves did not extend to a sufficiently high pressure. The observed 1 I
decrease in C ' may reflect a more gradual compression as the clay C )
I binder softens, but no conclusive explanation based on the volumetric J
relations is evident.
1 The pressure p , which is a quasi-preload, decreases as the water
0 )
content increases to 207'0, and thereafter remains essentially constant )
(Fig. 4.4). This parameter depends on the strength of the binder brfore
compression, and thrrcforc on the watcsr content, brcauxc only a s 1 1 1 a I I
decrease in volume occurred under pressures lowrr than p,:. A Iurthcr I

i l lustration of the compressibil i ty-water content relations is given in
Fig. 5. 2 where the total change in void rat io fo r each of four p res su re
increments in the one-dimensional consolidation t e s t s i s plotted against
water content. The distinct break in the curves for the increments f r o m
2 to 4 tsf and f rom 4 to 8 tsf occurs between water contents of 16% to 2070.
F o r the load increment f r o m 8 to 32 tsf there is a peak in the curve a t
a water content of 1670. This resu l t s f rom the fact that the s teepest por -
tion of the void ratio-log p res su re curves occurs wholly within the incre-
ment for specimens a t this water content. The figure clear ly i l lustrates
that t he re is little o r no difference in behavior for water contents above
20%. Fig. 5. 1 provides an explanation for this behavior s ince water
contents above 20% a r e between points L and M where the void ratio and
water content of the clay binder a r e shown to be constant .
On the bas is of the above comparisons, i t is concluded that the
variation of both strength and compressibil i ty with water content i s con-
s is tent with the volumetric concepts embodied in Fig. 5. 1.
5. 3 Initial Negative P o r e Water P r e s s u r e a s a Function of Water Content
The variation of the initial negative pore watcr p r e s s u r e with water
content was shown in Fig. 4. 32. A s h a r p inc rease in negative pore pres -
s u r e occurred a s the water content was reduced below 1870 to 20%. The
negative pore p r e s s u r e s were measured to be f r o m -10 ps i to -20 ps i in
this water content range.
One of the purposes for measuring the negative pore p res su re was

to permit an estimation of the water content of the clay binder. The basis
for the estimate was the assumption that the negative pore pressurc in the
loess was due to capillary s t resses in the water in the clay-size voids.
To provide an independent measurement of these capillary s t resses , the
relation between negative pore pressure and the water content of the clay-
size particles was measured in a separate series of tests and presented
in Fig. 4. 35.
Equations 4.5.1 and 4.6.1 express the measured relation between
pore pressure and water content for the loess and clay fraction
respectively:
32.5 u (psi) = - (-
w% )
100 ) 5
u (psi) = - (- wc%
If these equations a r e assumed to result from the same phenomenon,
the pore pressures may be equated thus relating the water contents:
w = 3 . l w C
However, i t is evident from the following that this relation cannot hold.
Since the clay content of the loess is 19%, the ratio wc/w is 100119 or
5.2 if a l l the water is in the clay voids. Therefore, for values of wc/w
less than 5.2, there must be water in the macro-voids ; that is , the clay
voids a r e not large enough to hold all of the water. This being the case,
the pore pressures in the loess a r e due to water in thc rt>;lcro-voids a r c
not rcllatircl to thc prossuros givcsn by Equation 4.0. 1 .
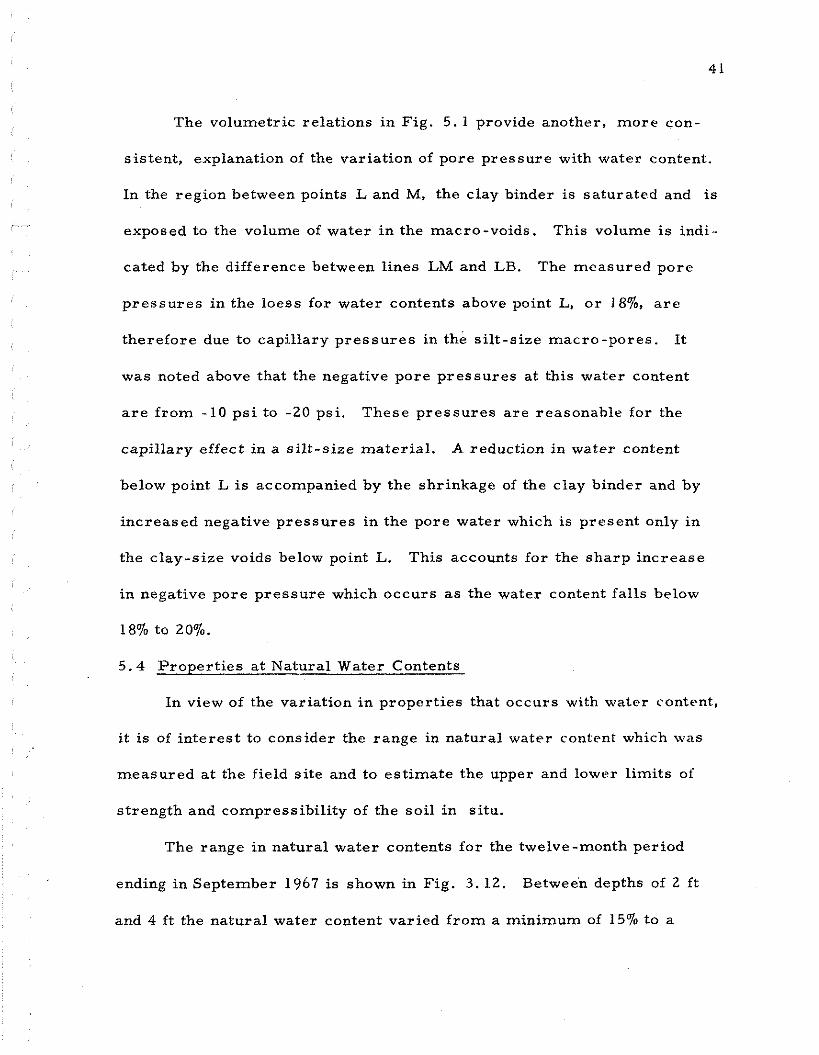
The volumetric relations in Fig. 5. 1 provide another, more con-
sistent, explanation of the variation of pore pressure with water content.
In the region between points L and M, the clay binder is saturated and is
exposed to the volume of water in the macro-voids. This volume i s indi-
cated by the difference between lines LM and LB. The measured pore
pressures in the loess for water contents above point L, o r 18% a r e
therefore due to capillary pressures in the silt-size macro-pores. It
was noted above that the negative pore pressures at this water content
a r e from -10 psi to -20 psi. These pressures are reasonable for the
capillary effect in a silt-size material. A reduction in water content
below point L i s accompanied by the shrinkage of the clay binder and by
increased negative pressures in the pore water which is present only in
the clay-size voids below point L. This accounts for the sharp increase
in negative pore pressure which occurs as the water content falls below
18% to 20%.
5 .4 Properties at Natural Water Contents
In view of the variation in properties that occurs with water content.,
it is of interest to consider the range in natural water content which was
measured a t the field site and to estimate the upper and lower limits of
strength and compressibility of the soil in situ.
The range in natural water contents for the twelve -month period
ending in September 1967 is shown in Fig. 3 . 12. Between depths of 2 ft
and 4 ft the natural water content varied from a minimum of 15% to a

, maximum of 28%; from the 6 ft to the 12 f t depth, the range was f rom 25%
I I to 3270. Values of po, C , $U and c for these water contents have I
C U
been estimated on the basis of the curves in Figs. 4 .4 , 4,5, 4.26, and
4.27 respectively, and the results a r e listed in Table 5. 1.
It is evident from Table 5. 1 that there is no significant variation in I
properties below the 6 f t depth. This is true because the rangt. in natural i
water contents is not great and, more significantly, because the properties i 1
a re not sensitive to water content changes within this range. The under-
lying reason for this behavior, as demonstrated in Fig. 5. 1, is that the
volume of the clay binder, and hence its water content and strength, is
constant between the water contents of 25% and 32%.
For the depths below 4 ft , however, there is an important variation , t
in properties. The value of p and the strength parameters a r e signi- I 0
1 ficantly higher for the minimum water content of 15% than for the maximum
\
water content. Again, Fig. 5. 1 demonstrates the reason for this. The 1
lower water content falls between points K and L which define the region
where the clay binder is shrinking, and therefore increasing in strength,
due to desiccation.
If a field plate load test were conducted a t a shallow depth during 1
i the period when the natural water content were near 15%, it is evident
i
that the results would reflect a temporary high strength and low compres- ;I
>,
sibility and would, therefore, be misleading. Howsvt*r, thc. wntvr rvnli.nt ) i prc>filc.s show11 i n Figs. 3. 8 l.lirc)ugIi 3 . I 1 inclic.al:c* l.li;tl. w;ktt.r c~c~r~lt~ntu )

below 20% a r e exceptional a t this si te. Because of this, i t may be con-
cluded that this loess deposit i s sufficiently moist to be stable, in that
i ts propert ies do not change with normal water content variations. In a
m o r e a r id region, where lower water contents prevail , an otherwise
identical loess would be sensit ive to variations in water content.

CHAPTER 6
SUMMARY AND CONCLUSIONS
6.1 Summary )
The primary purpose of this study of undisturbed loess was to esplorr 1
the relation between the water content of the whoie soil and that of the \
binder and to develop thereby a new basis for interpreting the mechanical I
behavior. To this end, a single loess deposit was used as a source of \
undisturbed samples to eliminate a s much a s practical variables other than
I water content.
The undisturbed samples a t their natural water contents, and at water I
contents modified in the laboratory to provide a range from 870 to 32%, \x
were subjected to unconsolidated-undrained triaxial compression tests, to 'I
consolidation tests in which no water was added to the unsaturated samples, )
and to initial negative pore water pressure tests. The results of these ) \
tests were summarized in Tables 4. 1, 4 .2 , and 4. 3 respectively. I
One of the original hypotheses was that the initial negative pore water
pressure in the loess was the result of the capillary effects in the clay )
binder. It follows that equal capillary pressures in the loess, and in a I
\
specimen composed of the clay-size material only, would imply that the
water content of the clay binder in the loess was the same as that in the
clay sample. To investigate this, the clay-size fraction was separated
from remainder of the loess and remolded specimens at various wat:cr
, , contc:nts worc subjc:cted to the initial nvgativc pore prcsstirv Ivs t . . I l i c s c ,

results were summarized in Table 4.4. The void ratio -pressure relations
for the remolded clay fraction were also determined in one-dimensional
and triaxial consolidation tests.
The water content in the field was obtained at regular intervals to
provide an example of the range in properties that would be encountered
at this site. These measurements were summarized in Fig. 3. 12.
Finally the index properties of the loess and of the separated clay
fraction were determined. These have been presented in Table 2. 1.
6 .2 Conclusions
The conclusions that follow a re based on the test results and inter-
pretations given in Chapter 4 and 5 respectively. At this point it should
be noted that, by design, a single loess deposit was used as a source of
samples. This choice permitted a detailed study with one significant
variable, i. e. water content. While the conclusions provide a basis for
comparing and explaining the properties of other loessial soils, they
have been drawn from tests on only one soil and generalizations must
be made with caution until other loessial soils a r e studied.
1. The water content of loess is a significant factor determining
its behavior. There i s a water content, o r narrow range of water contents,
above which the clay binder is volumetrically stable but below which the
clay binder shrinks due to desiccation. This water contcnt o r rangr is
referred to here as the critical water content.
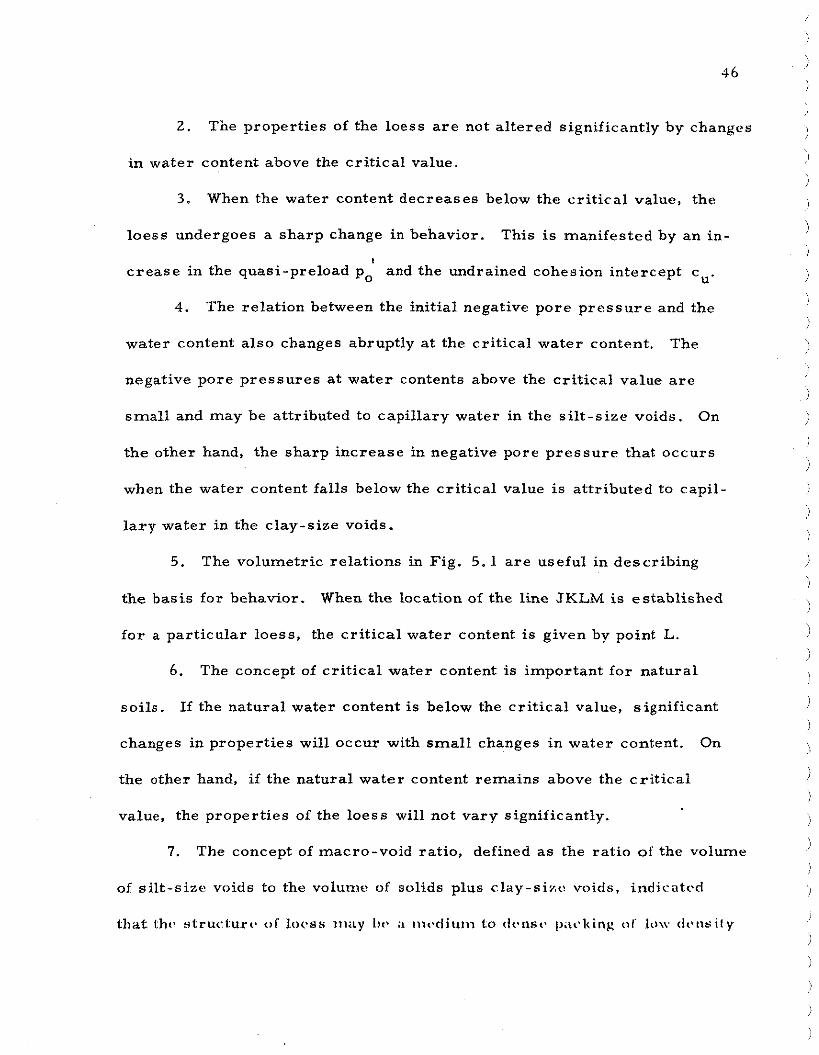
2. The properties of the loess a r e not altered significantly by changes i
in water content above the critical value. I
3 . When the water content decreases below the critical value, the I
loess undergoes a sharp change i n behavior. This i s manifested by an in- )
I )
crease in the quasi-preload po and the undrained cohesion intercept cU. I
\ 4. The relation between the initial negative pore pressure and the
water content also changes abruptly at the critical water content. The
) negative pore pressures at water contents above the critical value a r e
j
small and may be attributed to capillary water in the si l t -size voids. On :I
I the other hand, the sharp increase in negative pore pressure that occurs
when the water content falls below the critical value is attributed to capil- j
/ lary water in the clay-size voids.
\
5. The volumetric relations in Fig. 5.1 a r e useful in describing )
the basis for behavior. When the location of the line JKLM is established
for a particular loess, the cri t ical water content is given by point L. 1 \
6. The concept of critical water content is important for natural \
soils. If the natural water content is below the cri t ical value, significant )
i changes in properties will occur with small changes in water content. On
I
the other hand, i f the natural water content remains above the cri t ical )
value, the properties of the loess wi l l not vary significantly. i )
7. The concept of macro-void ratio, defined as the ratio of the volume !
of silt-size voids to the volunlc~ of solids plus clay-siisc voids, indicatrd i
1 that tho structure* o f l a c*s~ inny I )<$ :I t i i~~t l iu~n 1.0 tlrnsc* p;it.l<ing c r l ' lo\\. tl<bnsily '1

part ic les , that is, par t ic les consisting of a s i l t g ra ins coated with a binder
of clay-size par t ic les and clay-size voids. A study of the mechanical
behavior of an idealized s t ruc tu re of this type would be instructive.
8. For the Hawkeye Loess, the c r i t i ca l water content i s in the
range f r o m 15% to 20%. Since the clay-size par t ic les make up 19% of the
loess , the corresponding water contents of the clay binder a r e 78%) and
104%. All the water assumed to be in the clay-voids when the loess is
a t i ts c r i t ica l water content.
9. When the Hawkeye loess was above the c r i t i ca l water content,
I the quasi-preload po was 1 .7 tons per square foot and the undrained
cohesion intercept c was in the range f r o m 5 p s i to 15 psi . At a water u
content of 876, which is below the c r i t ica l water content, these values
increased to p = 10 to 20 tsf and c = 48 psi. 0 u

APPENDIX I. - REFERENCES
ASTM, (1964). "Procedures for Testing Soils, " American Society for Testing Materials, Philadelphia. i
Clevenger, W. A . , (19581, "Experiences with Loess a s Foundation Material, " Transactions, ASCE, Vol. 123, pp. 151 -180.
Davidson, D. T. and Sheeler, J. B., (1952), "Studies of the Clay Fract ion in Engineering Soils: 111. Influence of Amount of Clay on Engineering Proper t ies , " Proceedings, Highway Resea rch Board, Vol. 31, pp. 558-563.
Gibbs, H. J. and Coffey, C. T. , (1963), "Measurement of Initial Negative P o r e P r e s s u r e of Unsaturated Soil, P r o g r e s s Report on Shear and Pore P r e s s u r e Research , E a r t h Resea rch P rogram, " Laboratory Report No. EM-665, U. S. Bureau of Reclamation, Denver, Colorado.
Gibbs, H. J . , Hilf, J. W., Holtz, W. G . , and Walker, F. C . , (1960), "Shear Strength of Cohesive Soils, " ASCE Resea rch Conference on Shear Strength of Cohesive Soils, Boulder, Colorado, pp. 33-162.
Cibbs, H. J. and Holland, W. Y. , (1960), "Petrographic and Engineering Proper t ies of Loess, ' I Engineering Monograph No. 28, U. S. Bureau of Reclamation, Denver, Colorado.
Handy, R. L., Lyon, C. A . , and Davidson, D. T . , (1955), of Petrographic and Engineering P rope r t i e s of Loess in Southwest, Eas t -Cent ra l and Northeast Iowa, " Iowa Academy of Science Proceedings, Vol. 62, pp. 279-297. (Reprinted in Bulletin No. 21, Iowa Highway Resea rch Board, December 1960, pp. 65-87).
Holtz, W. G. and Gibbs, H. J., (1951), "Consolidation and Related Proper t ies of Loessial Soils, " Symposium on Consolidation Testing of S o i l s - 1951, American Society for Testing Mater ials , Special Technical Publication No. 126, pp. 9-26.
Larionov, A. K., (1965), "Structural Charac ter i s t ics of Loess Soils fo r Evaluating Their Constructional Proper t ies , " Proceedings, .6th Inter - national Conference on Soil Mechanics and Foundation E a i n v e r i n ~ VVo 1 , Montreal, pp. 64-68.

Leonards, G. A. and Ramiah, B. K., (1 959), "Time Effects in the Consolidation of Clays, " P a p e r s on Soils - 1959 Meetings, American Society fo r Testing Materials, Special Technical Publication No. 254, pp. 116-130.
Lyon, C. A., Handy, R. L., and Davidson, D. T. , (1954), "Proper ty Variations in the Wisconsin Loess of East-Central Iowa, " Iowa Academy of Science Proceedings, Vol. 61, pp. 291 -312. (Reprinted in Bulletin No. 20, Iowa Highway Research Board, December 1960, pp. 44-64).
Olson, R. E. and Langfelder, L. J., (1965), "Pore Water P r e s s u r e s in Unsaturated Soils, 'I Journa l of the Soil Mechanics and Foundations Division, ASCE, Vol. 91, No. SM4, Proceeding Paper , 4409, pp. 127- 150.
Peck, R. B. and Ireland, H. O., (1958), Discussion on: Clevenger, W. A., "Experiences with Loess a s a Foundation Material, " Transactions, ASCE, Vol. 123, pp. 171-179.
Seed, H. B., Woodward, R. J. and Lundgren, R. , (1964), "Fundamental Aspects of the Atterberg Limits, " Journal of the Soil Mechanics and Foundation Division, ASCE, Vol. 90, No. SM6, pp. 75- 105.
Sheeler, J. B. and Davidson, D. T . , (1957), "Further Correlat ion of Consistency Limits of Iowa Loess with Clay Content, " Proceedings, Iowa Academy of Science, Vol. 64, pp. 407-412. (Reprinted in Bulletin No. 21, Iowa Highway Resea rch Board, December, 1960, pp. 221-226.
Skempton,A. W., (1953), "The colloidal Activity of Clays, " Proceedings, 3rd International conference on Soil Mechanics and Foundation Engi- neering, Zurich.
Terzaghi, K., (1951), Discussion on: Holtz, W. G. and Gibbs, H. J . , "Consolidation and Related P rope r t i e s of Loessial Soils, " Symposium on Consolidation Testing of Soils - 1951, American Socity for Testing Mater ials , Special Technical Publication No. 126, pp. 30-32.
Terzaghi, K. and Peck, R. B., (1967), Soil Mechanics in Engineering Prac t ice , 2nd ed. , Wiley, New York.
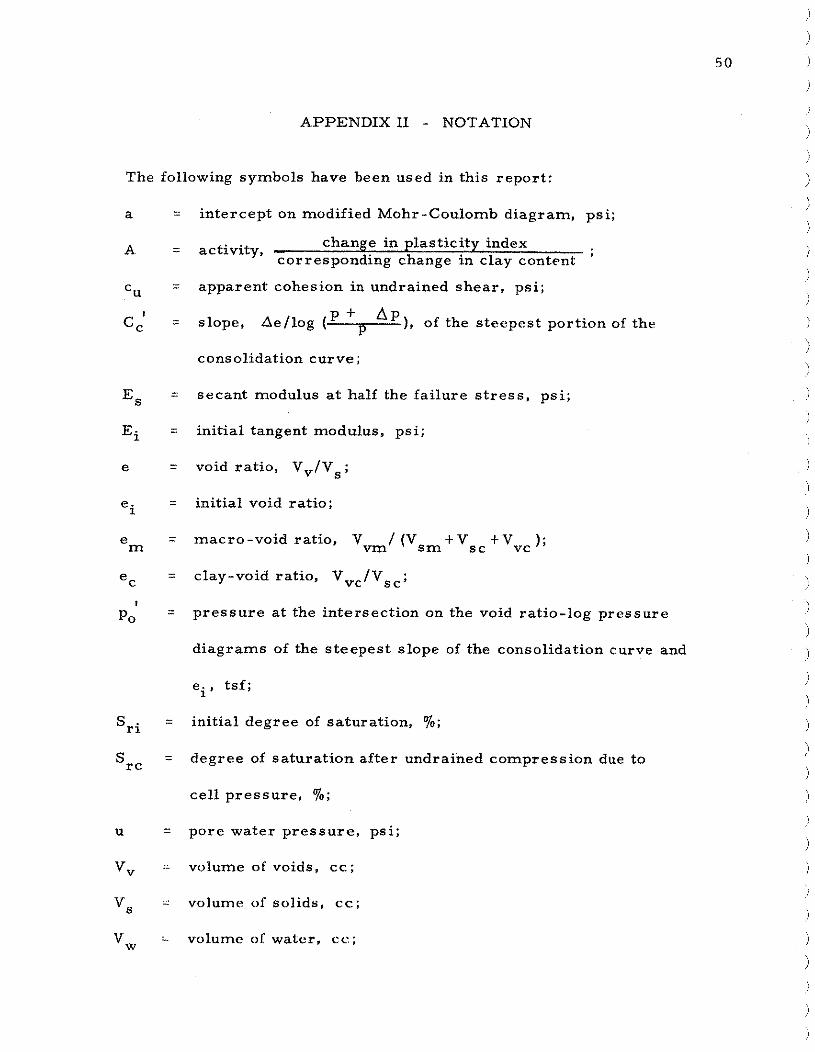
A P P E N D I X I1 - N O T A T I O N
The following symbols have been used in this report:
a = intercept on modified Mohr-Coulomb diagram, psi;
A. = activity, change in plasticity index corresponding change in clay content '
u = apparent cohesion in undrained shear, psi;
I
c c P + A P = slope, Aellog (T), of the steepcst portion of the
consolidation curve;
s = secant modulus a t half the failure s t ress , psi;
Ei = initial tangent modulus, psi;
e = void ratio, Vv/Vs;
e. 1
= initial void ratio;
e = macro-void ratio, V-/ (Vsm + V + v v c ) ; m
ec = clay-void ratio, VV,/Vsc; I
Po = pressure at the intersection on the void ratio-log pressure
diagrams of the steepest slope of the consolidation curve and
e. tsf; 1'
'ri = initial degree of saturation, %;
'rc = degree of saturation after undrained compression due to
cell pressure, %;
u = pore water pressure, psi;
v v :- volume of voids, cc ;
s volumc of solids, c c ;
w : volume oI water, cc;

V = volume of clay-size paritcles, cc; S C
Vsm = volume of silt-size particles, cc;
V = volume of clay-voids, cc; VC
Vvm = volume of macro-voids, cc;
w = water content, %;
w. = initial water content, %; 1
w = water content of clay fraction, %; C
E f = axial s train a t failure, 70;
cs = axial s train a t half the failure s t ress , 70;
C3 = cell pressure, psi;
(5- 63)f/2 = half the s t ress difference (6- - 0- ) at failure, psi; 1 3
9 = slope of modified Mohr-Colomb diagram;
Q,u = angle of shearing resistance in undrained shear.

TABLE 2.1
SOIL INDEX PROPERTIES
Property No. of Tests Range Average )
(1) (2) (3) (4) ) I
(a) Loess H
Liquid Limit
Plastic Limit 5 23-24 24
Plasticity Index 11
Specific Gravity 4 2.72-2. 74 2.73
I Percentage of Clay:
less than 0.005 m m 4 24-28 26 i
less than 0.002 m m 4 17-21 19
Activity 1.10 I
Natural dry density, pcf 13 85.0-89. 3 8 7
Natural water content, % 13 23.2-27.0 25
1
(b) Clay Fraction Less Than 0.002 mm
Liquid Limit 2 146 146
Plastic Limit 2 43-48 46
Plasticity Index 100 )
Shrinkage Limit 2 14-17 15 )
Specific Gravity 1
Perccntagr of Clay:
less than 0.002 mm 100 )

TABLE 3.1
TOTAL MONTHLY PRECIPITA.TION IN INCHES
Measured at F r o m Records of Iowa City Cooperative Site Observer Weather Station
Oct. 1966 Oct. 1966 10 yea r 70 year to to average average
Month Sept. 1967 Sept. 1967 1951- 1960 1897-1966 (1) (2 (3) (4) (5)
October
November
December
January
February
March
Apri l
May
June
July
August
September
TOTALS 33.82
I. R. = Incomplete Record
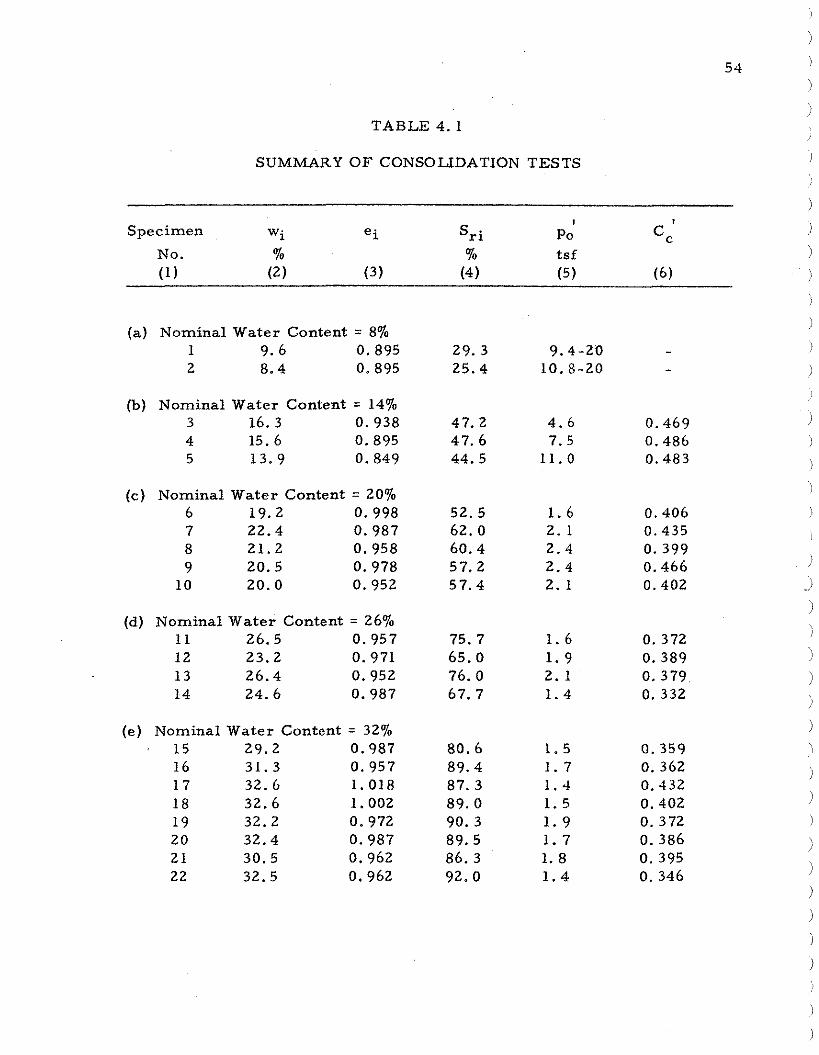
TABLE 4 .1
SUMMARY O F CONSOLIDATION TESTS
I , Specimen Wi ei 'ri Po c
No. % % tsf (1) (2) (3) (4) (5) (6)
(a) Nominal Water Content = 8% 1 9. 6 0.895 29. 3 9.4-20 - 2 8.4 0.895 25.4 10.8-20 -
(b) Nominal Water Content = 14% 3 16. 3 0.938 47. 2 4 .6 0.469 4 15.6 0.895 47. 6 7.5 0.486 5 13. 9 0.849 44.5 11 .0 0.483
( c ) Nominal Water Content = 20% 6 19. 2 0.998 52. 5 1 .6 0.406 7 22.4 0.987 62.0 2 .1 0.435 8 21.2 0.958 60.4 2 . 4 0.399 9 20.5 0.978 57.2 2.4 0.466
10 20.0 0.952 57 .4 2 .1 0.402
(d) Nominal Water Content = 26% 11 26.5 0.957 75. 7 1 . 6 0. 372 12 23.2 0.971 65.0 1 . 9 0.389 13 26.4 0.952 76. 0 2 .1 0.379 14 24.6 0.987 67. 7 1 . 4 0. 332
(e) Nominal Water Content = 32% 15 29.2 0.987 16 31. 3 0.957 17 32. 6 1.018 18 32.6 1.002 19 32.2 0.972 20 32.4 0.987 2 1 30.5 0.962 22 32.5 0.962

TA
BL
E 4
.2
SU
MM
AR
Y O
F T
RIA
XIA
L T
ES
TS
Sp
ecimen
w
ei
S r
i c'-3
'rc (fll-dj)f
f €s
€fJ
Es
Es
E i
No.
2
7'0 7'0
psi
7'0 p
si 7'0
7'0 p
si p
si (1
) (2
) (3
) (4
) (5
) (6
) (7
) (8
) (9
) (1
0)
(11
) (1
2)
(a)
No
min
al w
ater co
nten
t = 87'0
1
8. 3
0.9
03
2
5. 3
0
2
5.3
76
1.5
8
0.5
0
3.2
1
5, 0
00
1
5,0
00
2
9.2
0
.87
5
28
.8
20
30. 9
7
4
1.7
6
0.5
6
3.1
13, 0
00
17, 0
00
3 8. 3
0
.88
2
25
.7
60
2
7. 6
1
07
4
.59
0
.68
6
. 8
16
,00
0
23
,00
0
4
7. 7
0.8
82
2
3.9
1
00
2
5. 1
1
48
7
.28
0
.87
8
.4
17
,00
0
21, 00
0
5
8.0
0
.86
0
25
.4
14
0
27
. 0
18
0
20
.0
1.1
0
18
.2
16
,40
0
35
,00
0
6
7.4
0
.90
7
22
.3
14
0
23
.0
16
2
20
.0
1.3
5
14
. 8
12
,00
0
23
,00
0

TA
BL
E 4
.2
(co
nti
nu
ed)
SU
MM
AR
Y O
F T
RIA
XIA
L T
ES
TS
Sp
ecim
en
w
e i
sri
c3
s
rc
-3
cf
cs
2
€
fie
s N
o.
Es
E i
70 %
p
si
%
psi
%
70
p
si
psi
(1
) (2
) (3
) (4
) (5)
(6)
(7)
(8)
(9)
(10
) (1
1)
(12
)
(b) N
om
ina
l w
ate
r co
nte
nt
= 14%
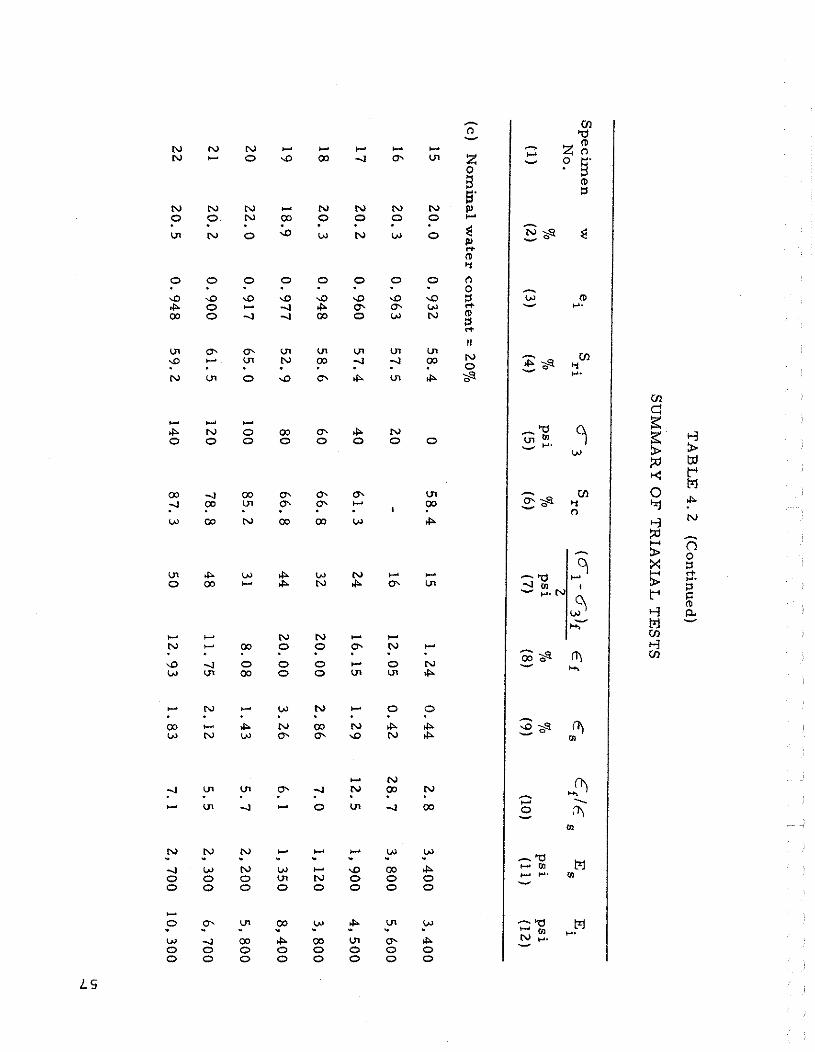
00000000 OOONIOOOO vmm-m~mr-
b l-2 C
.;: 2 C X
N E-4
b 2 2 u2
W - UJ sm W -
- U
" ss V)
m .*( -
.r(
" sz V)
. r( @ m -
C al
a V)
*~~~~oorn~~rn No-000r-m LniGddmLei -ANN 3 3
V) \O m 0 --8:sz*IO
-5' mmm~mm
4' iGG&mG V) \O\D\Dmr-m
00000000 N*\OCOON-5'
-*-
*m*\DmOION
IOIOIOIOIO\D\DIO If + $NmOmr-P-Om
zzi$%g;Gg$ 0
VOOOOOOOO
" al Y
$OWNW ONIO 0'. ~0000mN00
NNNNdNNN
E
-433-NNN - U -
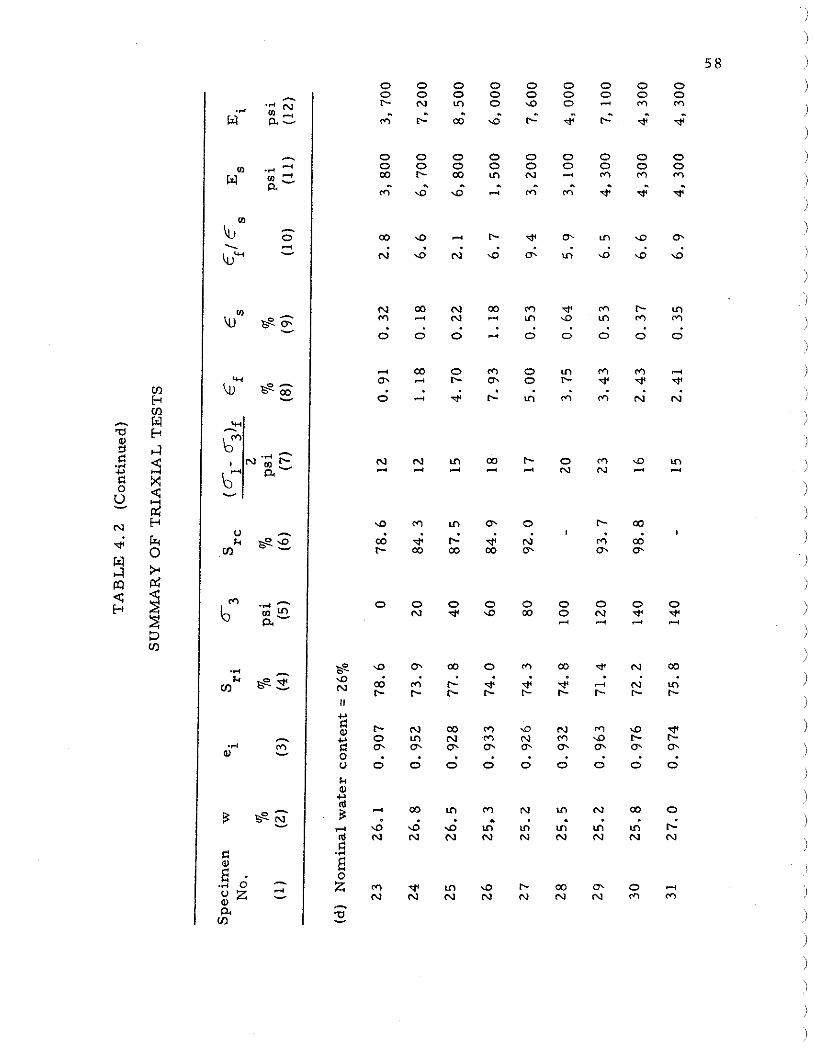
5 8 0 0 0 0 0 0 0 0 0 0 0 0 0 0 0 0 0 0 r - ~ ~ 0 0 . ~ 0 - r n m
m " C o o ' G G $ r - ' $ $
0 0 0 0 0 0 0 0 0 0 0 0 0 0 0 0 0 0 m r - m m ~ - r n r n m m " . D - . D - ; m " m " $ $ d
m * - t - w a - m . ~ a - N . G N . 9 . O ; r n \ d \ d \ d
~ m ~ m m ~ ~ r n p - m m - N - m o m r n r n
0 0 0 ~ 0 0 0 0 0
4 m o m o m m m 3 e - t - m o t - * * * d r ; G < U i m ' m ' N . N .
C O C - O ~ \ D I O 2 2 2 - + N N 3 -
\D m m a- 0 r- m 8 & 4 & 4 N ' m ' m ' t - m m m a - a- a-
0 0 0 0 0 0 0 0 0 N + \ D C O O N * *
3 - 3 -
\ D a - m O r n C O * N m g & m ' C $ G G L N . G N c - t - r - r - t - t - p . r - r - I 1 c.'
g t - N m m o N r n \ D * c r ~ m ~ ~ ~ m ~ ~ ~ G a - a - e a - a - a - a - o I o \ 0 0 0 0 0 0 0 0 0 0 0
k d) cr $ - m m m ~ m ~ m o , G G G m ' & m ' u ; m ' < 8 N N N N N N N N N
'5 i m + m a t - m a - 0 -
N N N N N N N ~ ~ - a -
- '- N - 3 a-
- 01 .* - W gC:
bliUI - 0 . 3
bW -
V)
iu Fsz
W
b gz - W
bm t
b-' - N.Gz a-
0 " Is2 V)
bm .: ; a-
.r( - rnk Is:
- .+ w rn -
B es
C d)
2 6 2 $ 2 - a
V]
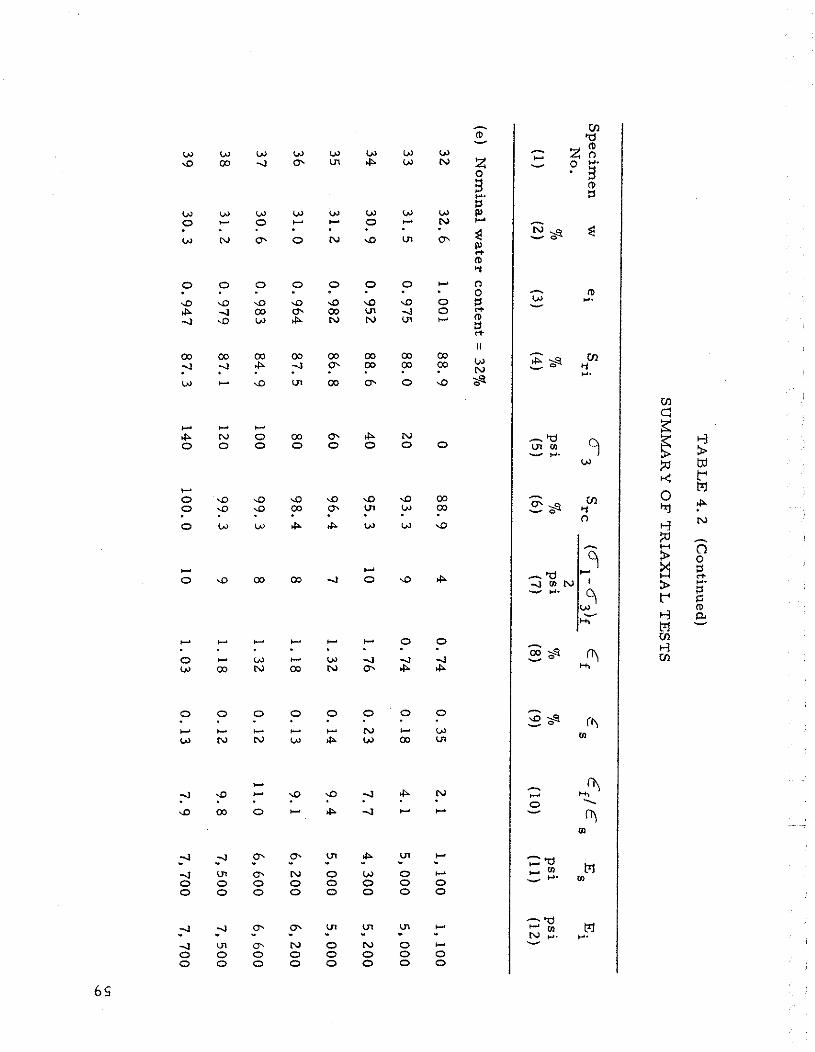
.~. w 44 d B 'q
mO\NO\ONm ,-,N404-to-O
4 mmmmmmmm
.a
E gNm.crm\Or-mm
mmmmmmmm

TABLE 4 . 3 )
SUMMARY OF INITIAL NEGATIVE PORE WATER PRESSURE TESTS
Tes t Triaxial w Degree of u Time Lag En d-plate \
No. Specimen Yo Saturation psi for Air Entry No. 70 Equilibrium Value
hr . -min. ps i )
(1 (2 (3) (4) (5) (6) (7) )
(a) Nominal Water Content = 14% \
(b) Nominal Water Content = 20%
(c) Nominal Water Content = 26%
Nominal Water Content
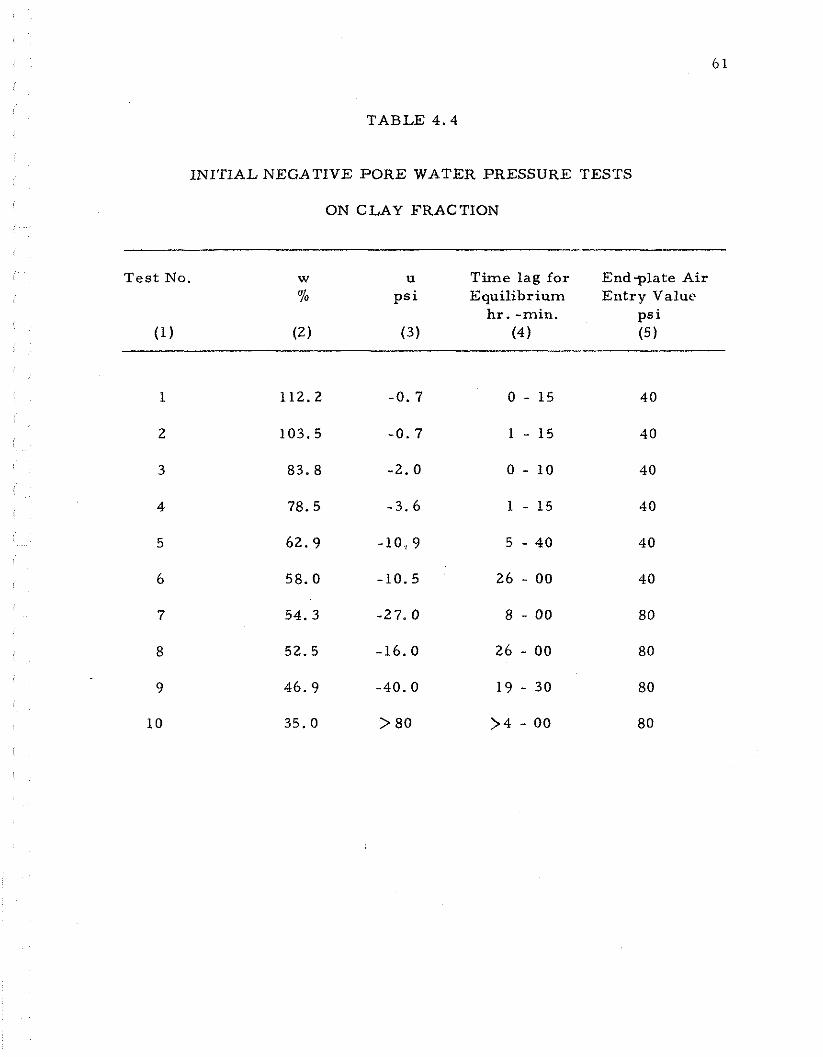
T A B L E 4.4
INITIAL NEGATIVE P O R E WA.TER PRESSURE TESTS
ON CLAY FRACTION
T e s t No. w u T i m e l a g f o r E n d p l a t e A i r yo p s i E q u i l i b r i u m E n t r y Value
h r . -min . p s i (1) (2) (3) (4) (5)

TABLE 5.1
PROPERTIES AT NATURAL WATER CONTENTS
Depth Natural w a t e r po f t content tsf
2 to 4 15% min. 7. 5 0. 46 2 2 15 ,)
28% max. 1.6 0.40 2
6 to 12 257% min. 1 .7 0.41 4
3270 max. 1 .6 0.39 1

PA
RT
ICL
E
DIA
ME
TER
(mm
)
Fig. 2
. 1. G
rain
-Size D
istribu
tion
for L
oe
ss H.
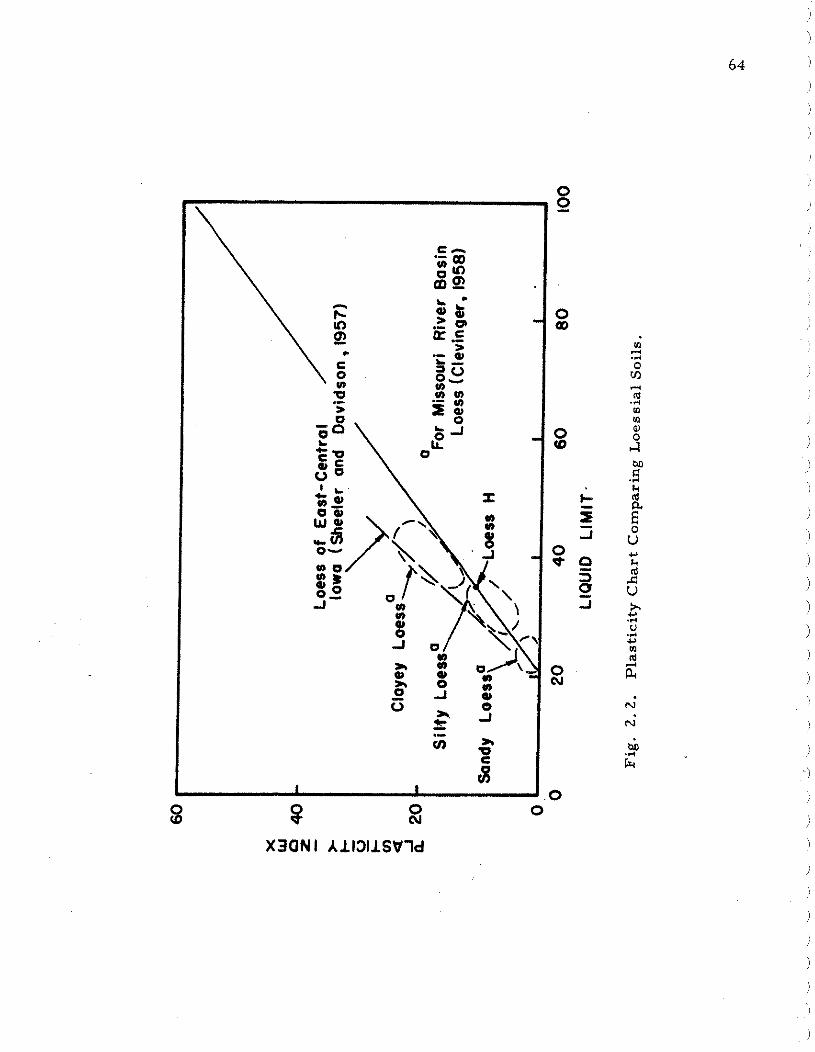
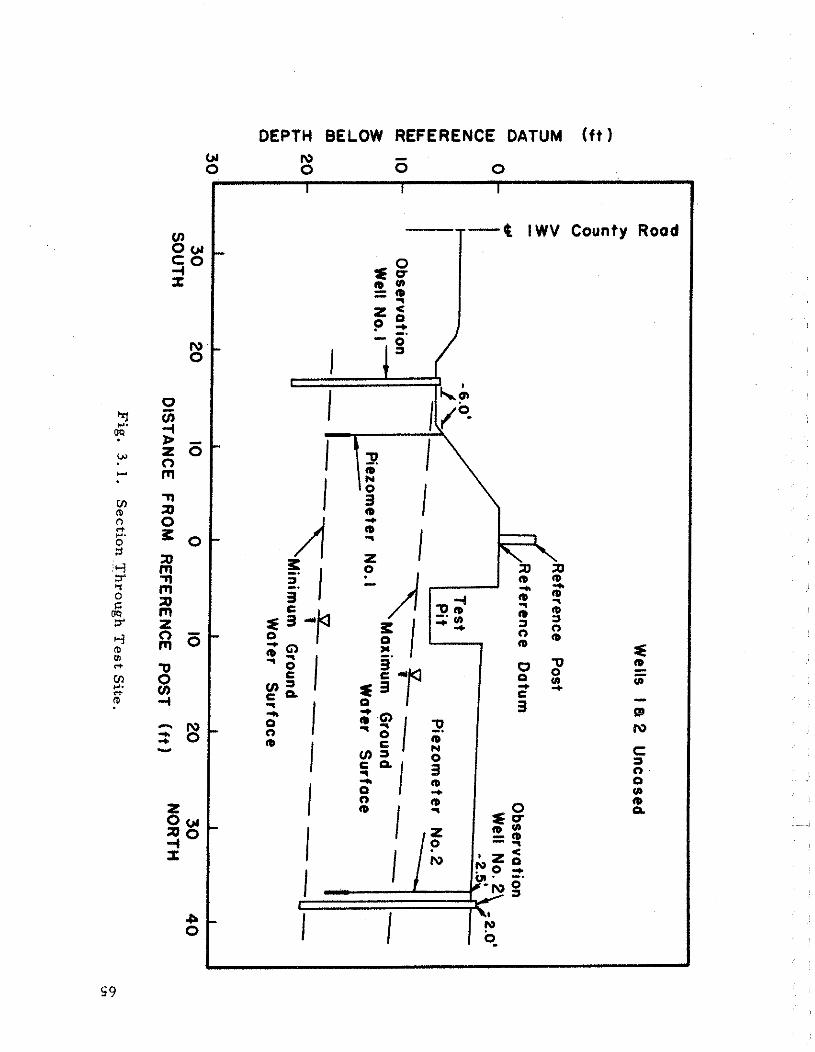

Average of four borings A Interpolated for depth shown + Depth = 10'
Depth = 12'
-
-
( a ) Water Content
LL 100
0 C
E 0, I-
0 ' I
OCT, I NOV. 1, 1966 DEC. i
Fig. 3. 2 . Field Measurements, October and November 1966.
4
(b) Precipitation -
n A m
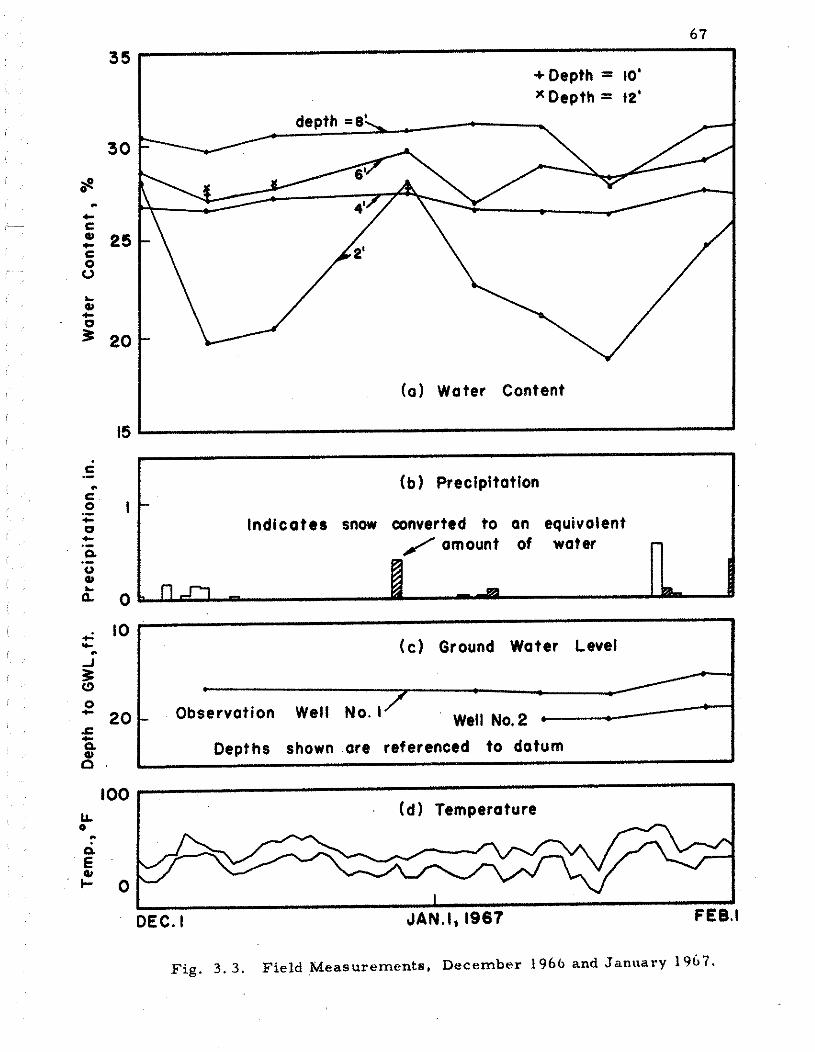
(01 Water Content
(b) Precipitation
Indicates snow converted to an equivalent / amount of water
(c ) Ground Water Level
Well No. 2
Depths shown ore referenced to datum
100 LL ( d l Temperature 0 "
$ 0
DEC. I
Fig. 3 . 3 . Field Measurements. December 1966 and January 1967.
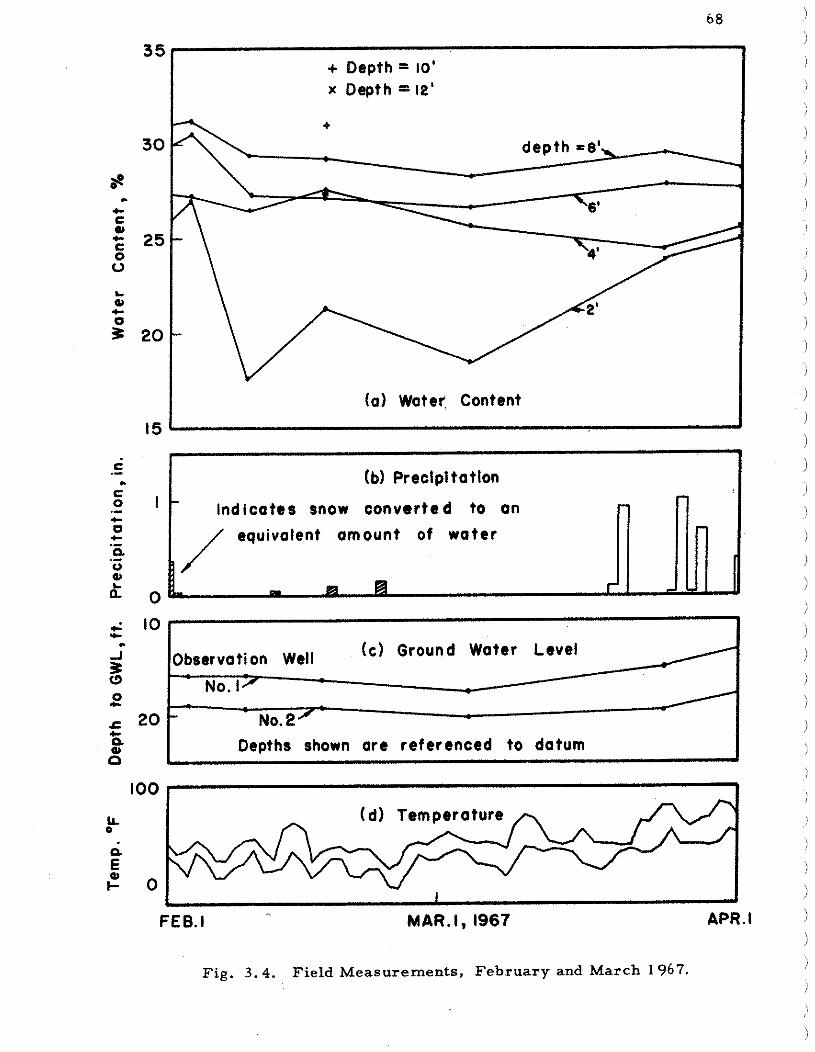
(b) Preclpitatlon
( d l Temperature
- Indicates snow converted to an -
C .- . C 0 I .- C 0 C a .- 0
f! a 0
FEB.1 -
MAR.1, 1967 APR. I
-
d 10 Y- . $ (3
0 C
r 2 0 C a '5
Fig. 3 . 4 . Field Measurements, February and March 1967.
Observation Well (c) Ground Water Level
No. I r
- NO. 2" Depths shown are referenced to datum
,/ equivalent amount of water -
- 63 a I- -
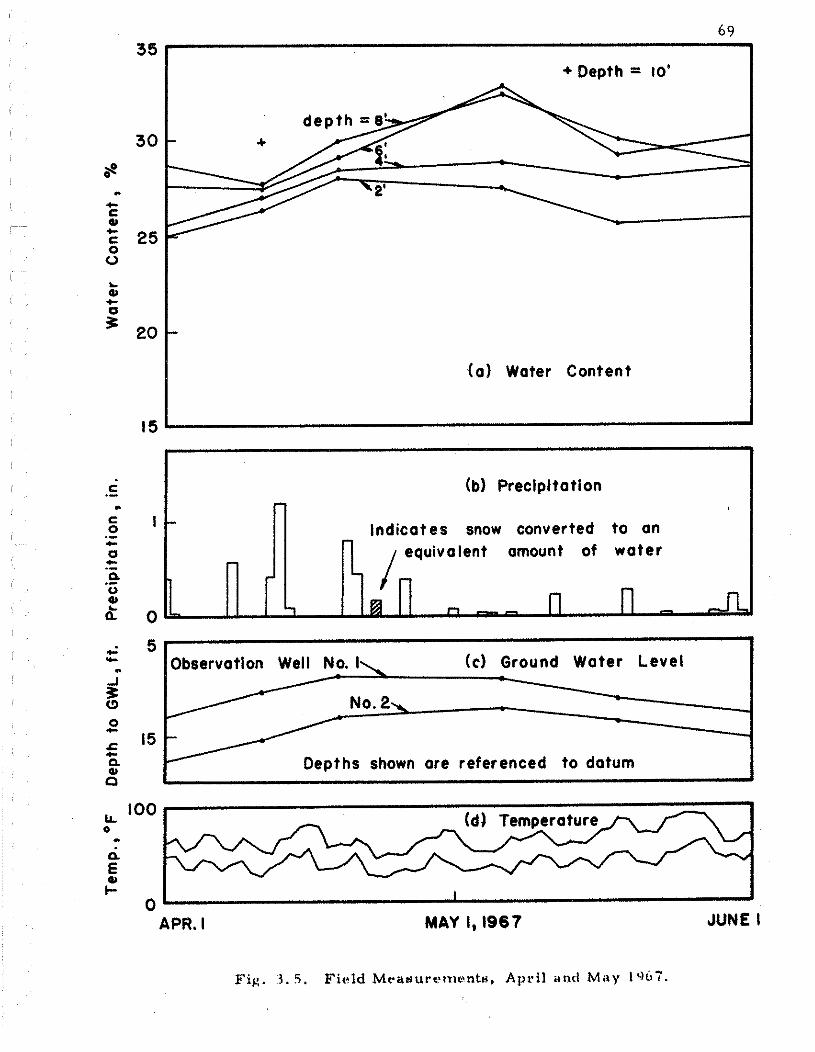
+ Depth = 10'
( a ) Water Content
I I
(b) Precipitation
Indicates snow converted to an quivalent amount of water
Observation Well No. I\ (c) Ground Water Level
No. 2\,
Depths shown are referenced to datum ,
0 APR. I MAY 1,1967 JUNE I
Fig. 3 . 5 . Field M r a a t ~ r t * t t ~ e n t ~ , Apri l ant! Miay lYb7.
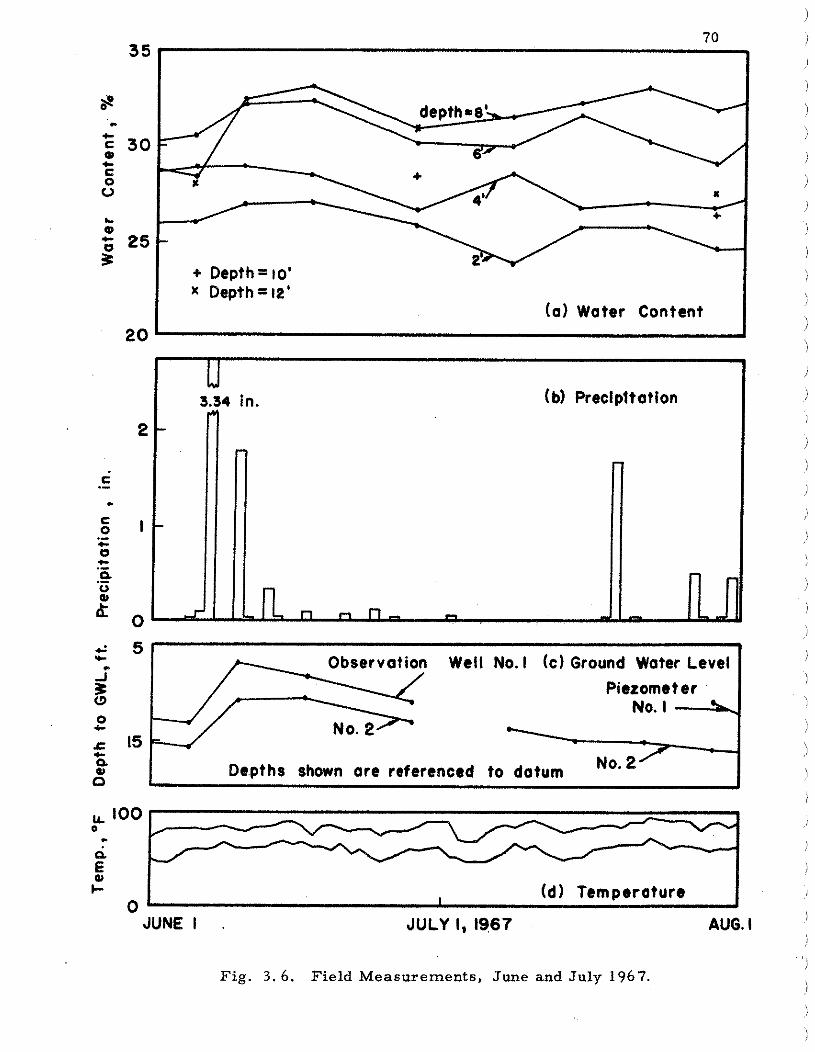
3
Observation Well No. I (c) Ground Water Level Pieromet er
No. I \
Depths shown ore referenced to datum NO. 2/ .
0) t
I ( d l Temperature
0 JUNE I . JULY 1,1967 AUO. I
Fig. 3 . 6 . Field Measurements, June and July 1967.

71 35
3 0
8 .. t C 0) t
L (U t
2 0 - + Depth'lO' x Depth = 1 2 '
2'fl . (a) Water Content
15 -
Pietometer No. 1, \
(c) Ground Water Level . No. 2 1 A
L
Depths shown are referenced to datum
LL. 0
ti E
t?! (dl Temperature 0
AUG. I SEPT. 1, 1967 OCT. I
Fig. 3. 7. Field Measurements, August and September 1967.

WATER CONTENT (9'0)
0 I Dec. 1 , 1966
I
4 -
8 -
12
. Fig. 3. 8 . Natural Water Content Profiles, October to
December 1966.
I Dec. 8, 1966
I
GWL: 16.3'
-
-
-
-

WATER CONTENT t%)
12
Fig. 3. 9 .
I I Jan. 19, 1967
GWL: 17.8' below surf,
: \ -
I I Feb. 17, 1967
GWL: 16.8' below surf.
Natural Water Content Profiles,
December 1966 to Frbruary I967

GWL F
I 1 June 5, 1967
r
: 1 GWL
Fig. 3 . 1 0 . Natural Water Content Profi les ,
March to June 1967. i

WATER CONTENT C4b) 10 20 30
I I June 28, 1967
I I .
Sept. 4 , 1967 OWL: 15.0' below surf,
Fig. 3 . 11 . Natural Water Content Profiles,
June to September, 1967.
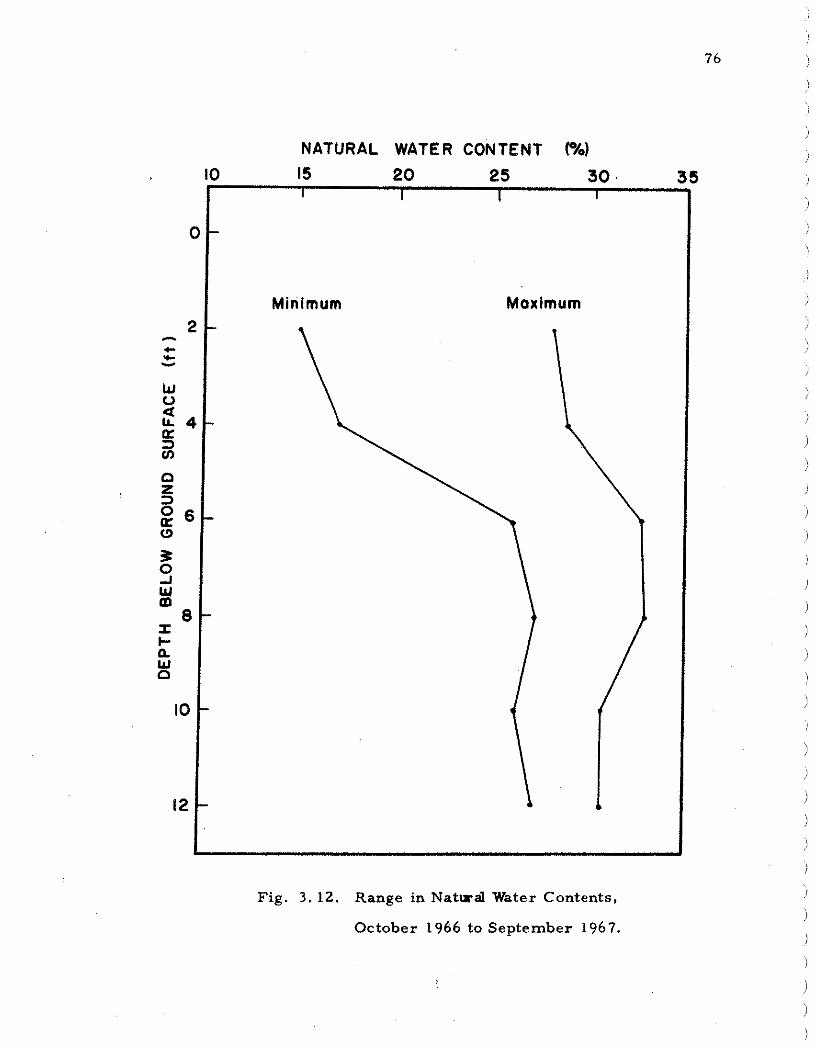
NATURAL WATER CONTENT ('''1
Fig. 3. 12. Range in Natval Water Contents,
October 1966 to September 1967.

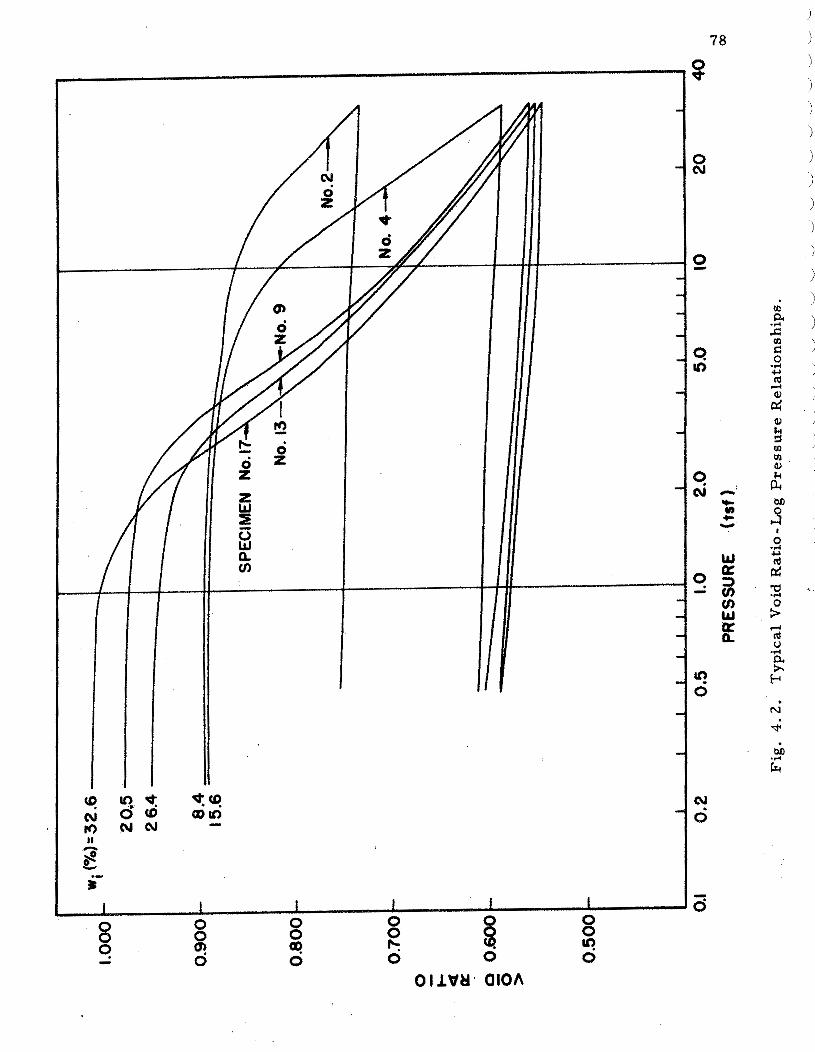
Fig
. 4
.2.
Ty
pic
al
Voi
d R
ati
o-L
og
Pre
ssu
re R
ela
tio
nsh
ips.

ngeRt to steepest portion of curve.
P
LOG PRESSURE
I I Fig. 4. 3. Definitions of Parameters po and Cc .


INIT
IAL
W
AT
ER
C
ON
TE
NT
(%I
I F
ig. 4
. 5.
Va
riatio
n of C,
With
Initia
l Water C
on
tent.


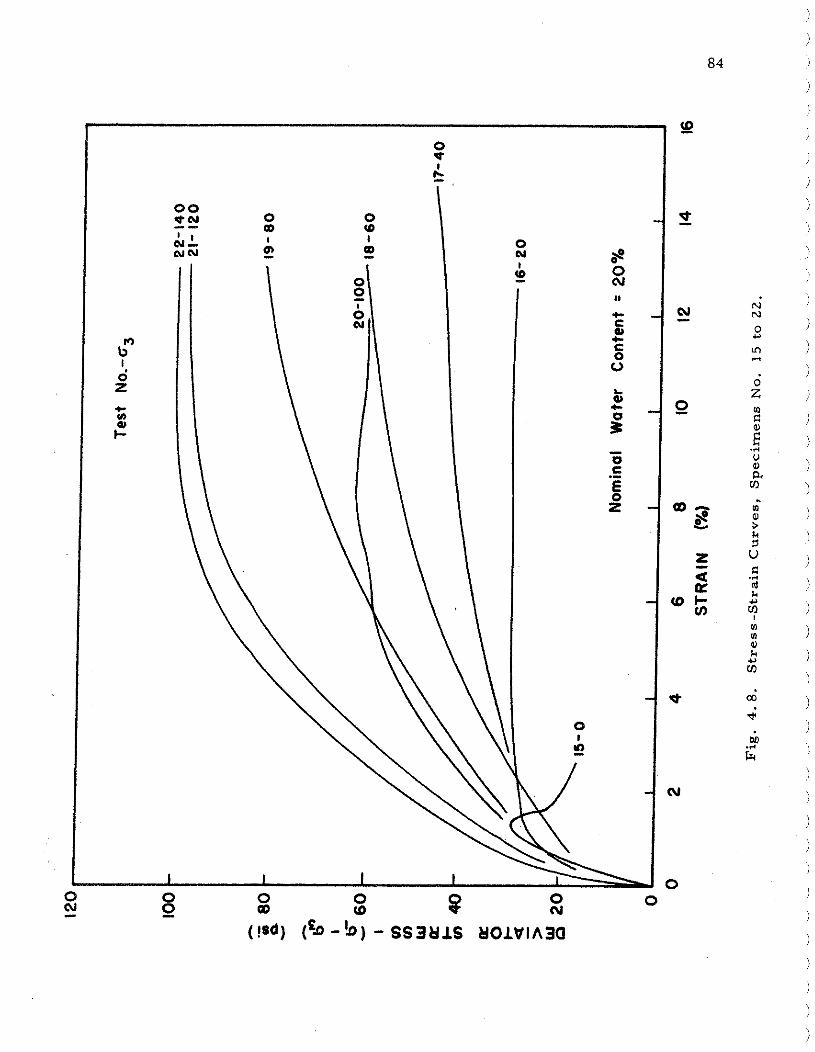


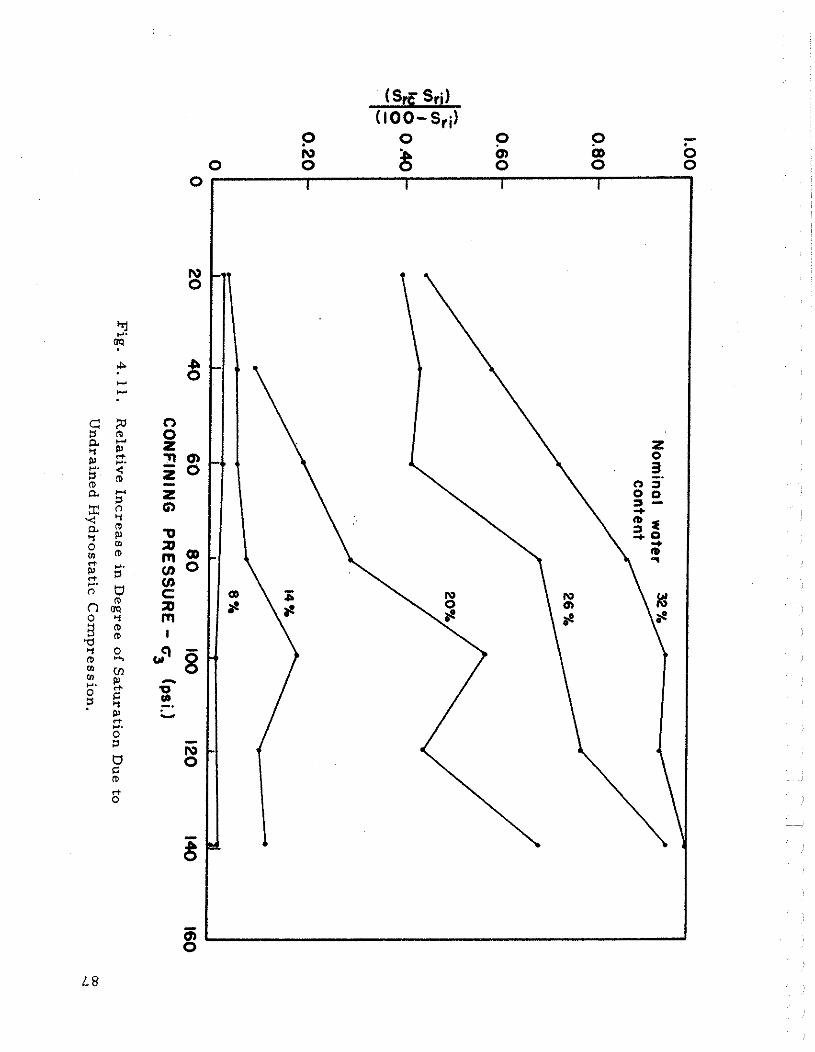

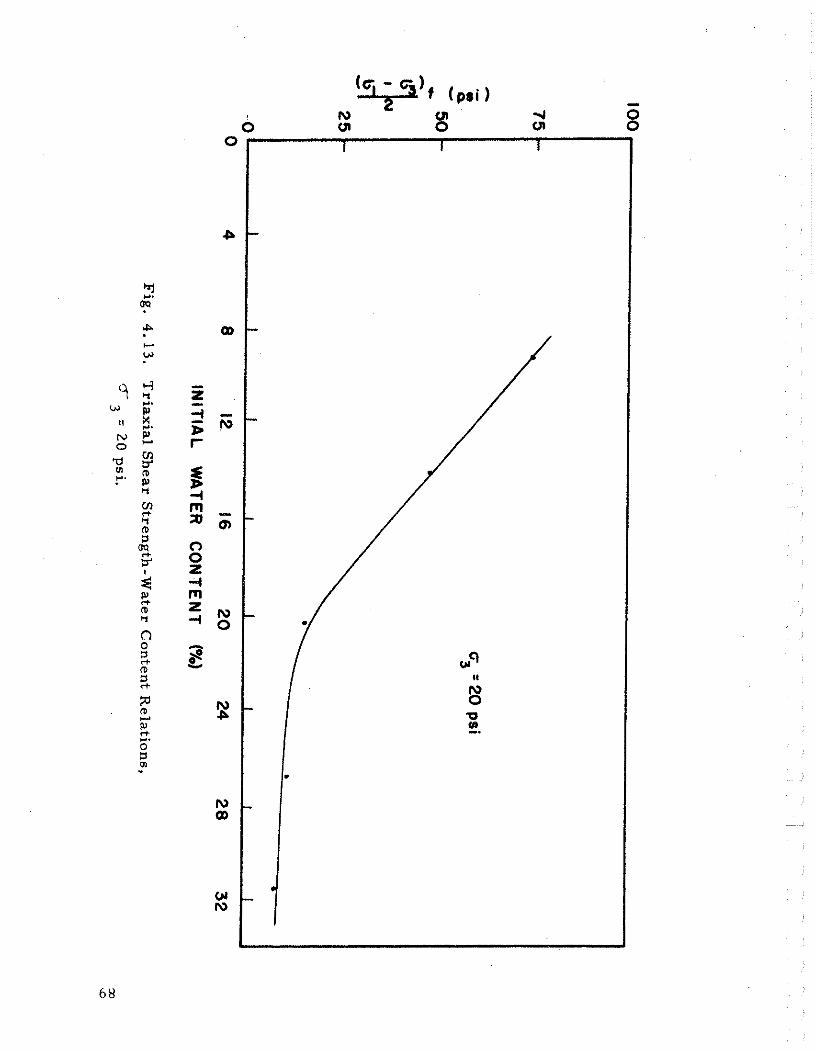


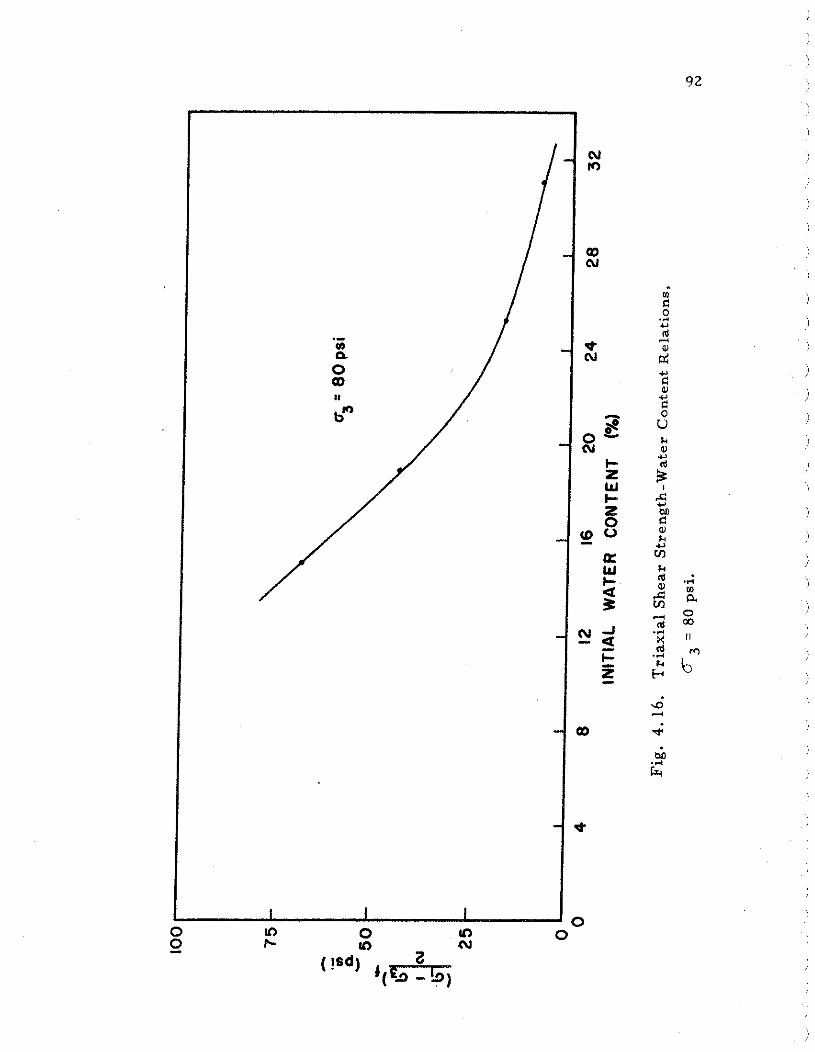
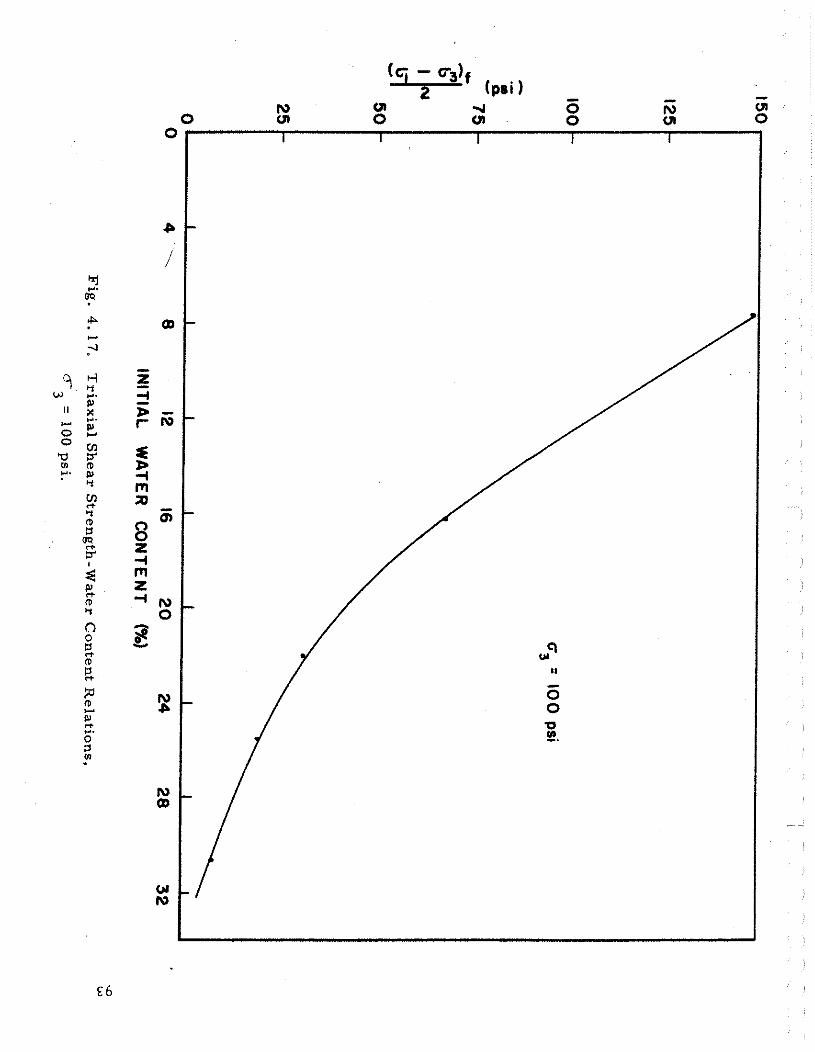


(V m
OD (U
. m C 0 .rl I-'
d m 3
(U 2 I-' C w - I-'
* fi g, 0
U
% I- C
z P) I-'
6 I- Z 0 fi 0
cD 2' a, - C
0:; W t-
I.,
Q m .; 0) V)
0. 3: R
cV -l - * F6 3
- 4 .rl
- X I1 Id c .+ m z
C
- ti t.
OI 3
OD .J.
M
L:
d
D
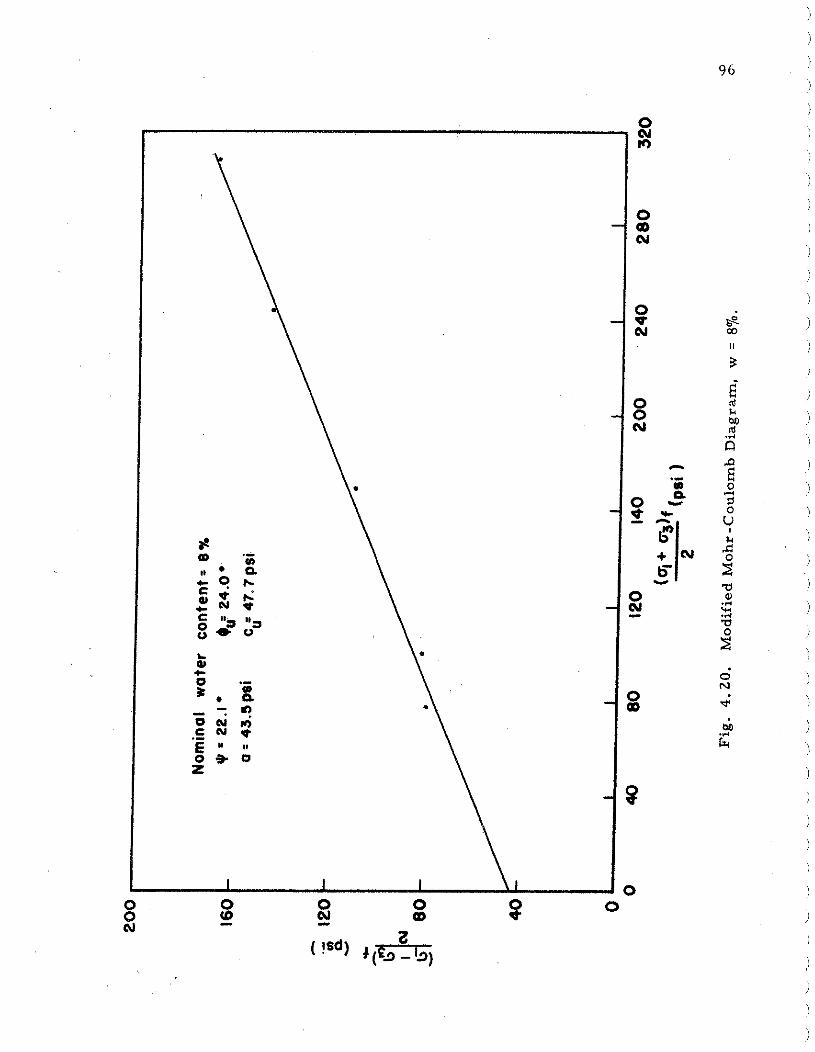


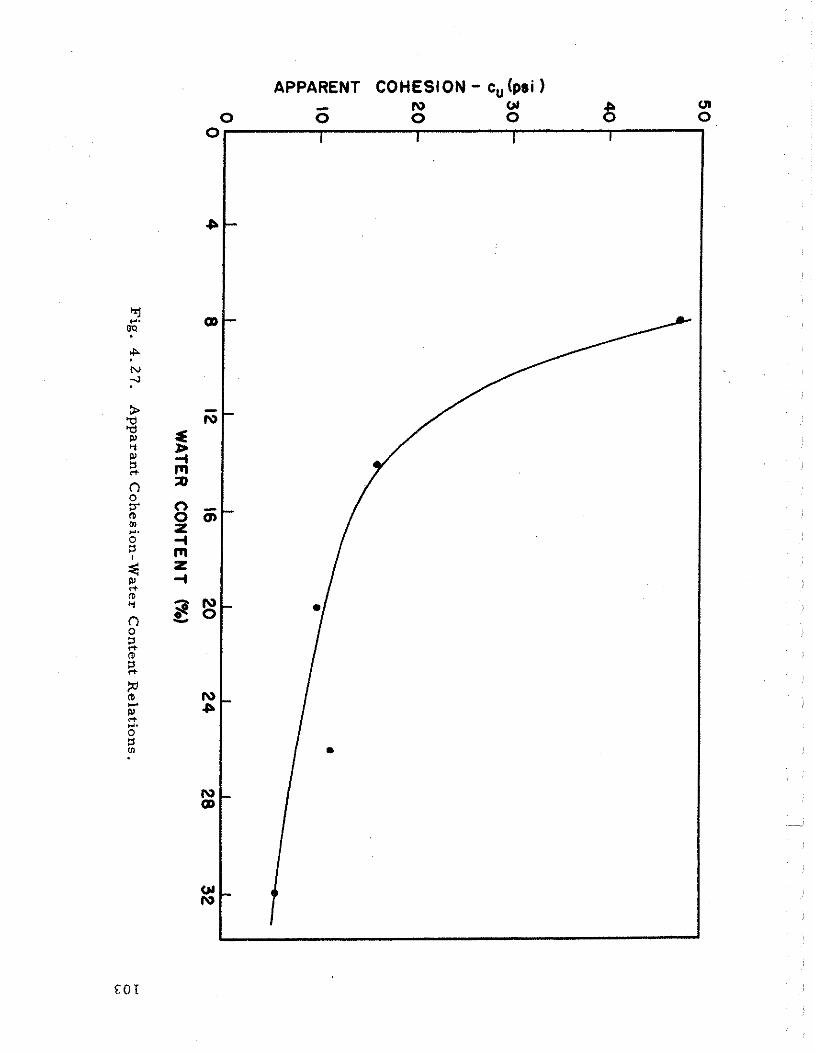

40000
(01 Initial Tangent Modulus
C4
3 2 0 0 0 - $ c.
w- I
cn 24000 Nominal water content = 8%
3 A 3 0 0 L
16000 z W (3 P a t-
A 8000
a - C - z -
0
- 0 40 80 120
CONFINING PRESSURE -cs (poi
Fig. 4. 28, Rrrlationuhip o f Moduli to Walr.~. C'crntc-nl
and Confining Preeaurr.

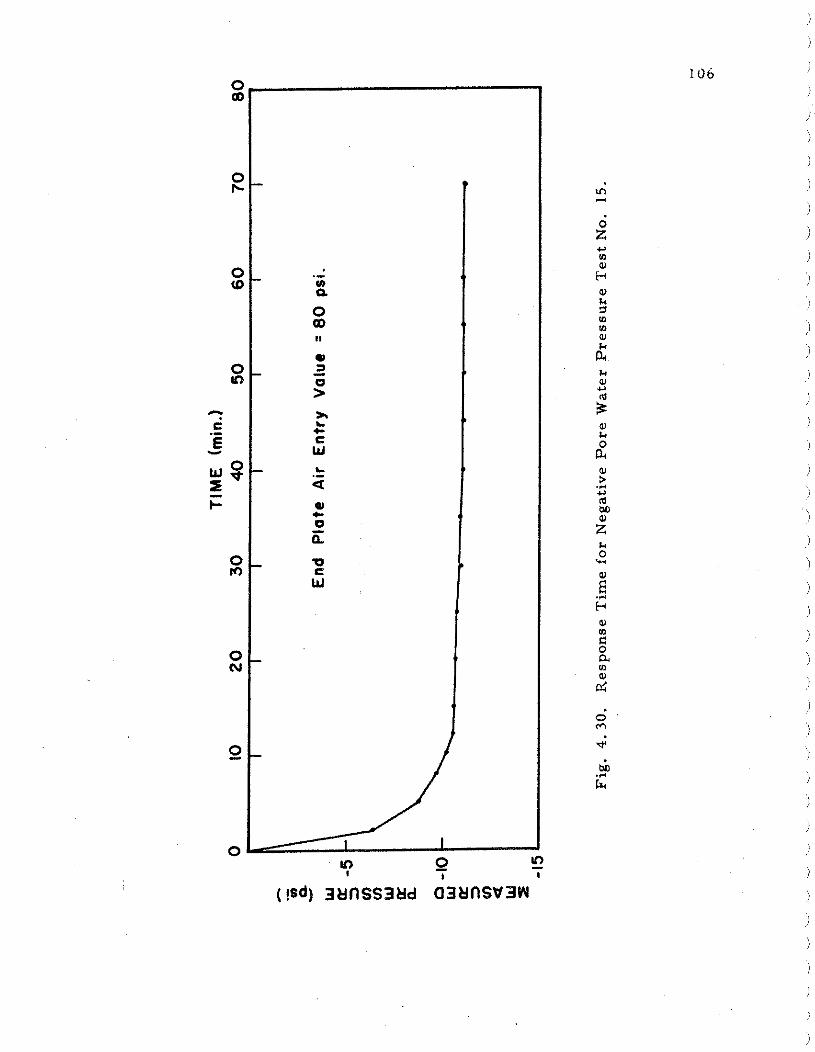

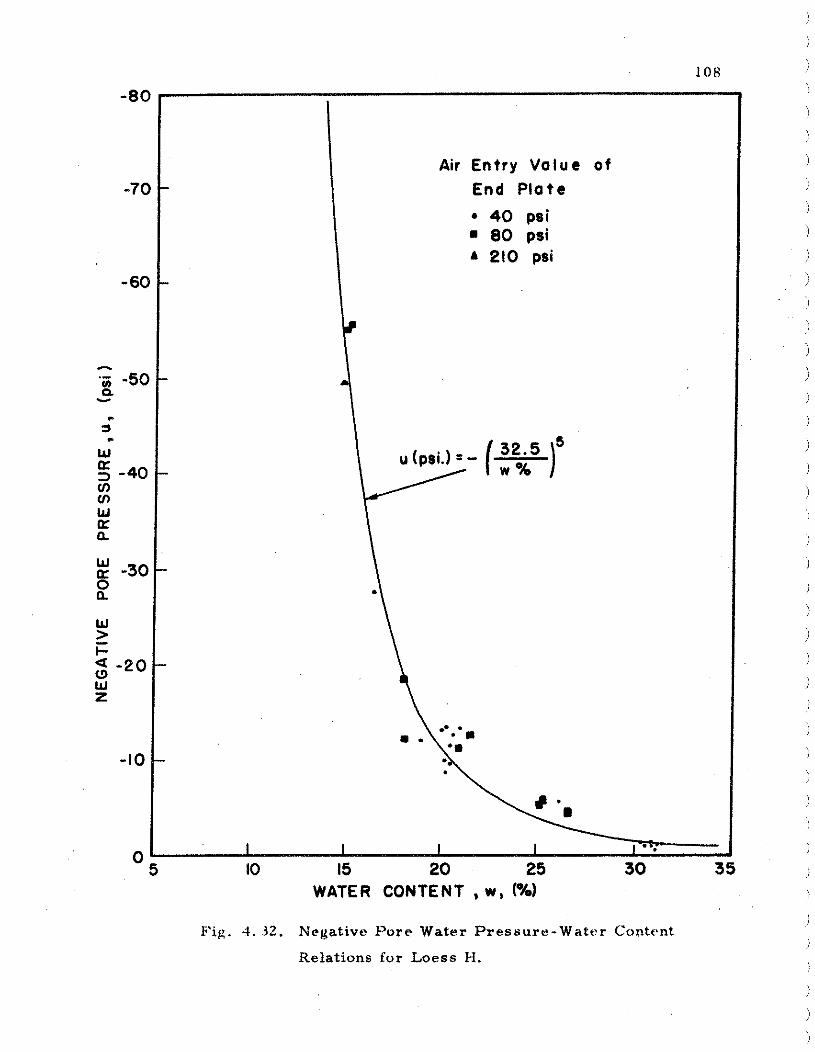
F i g . 1. 32. Negative Pore Water Presaure-Water Content
Relations for Loess H.
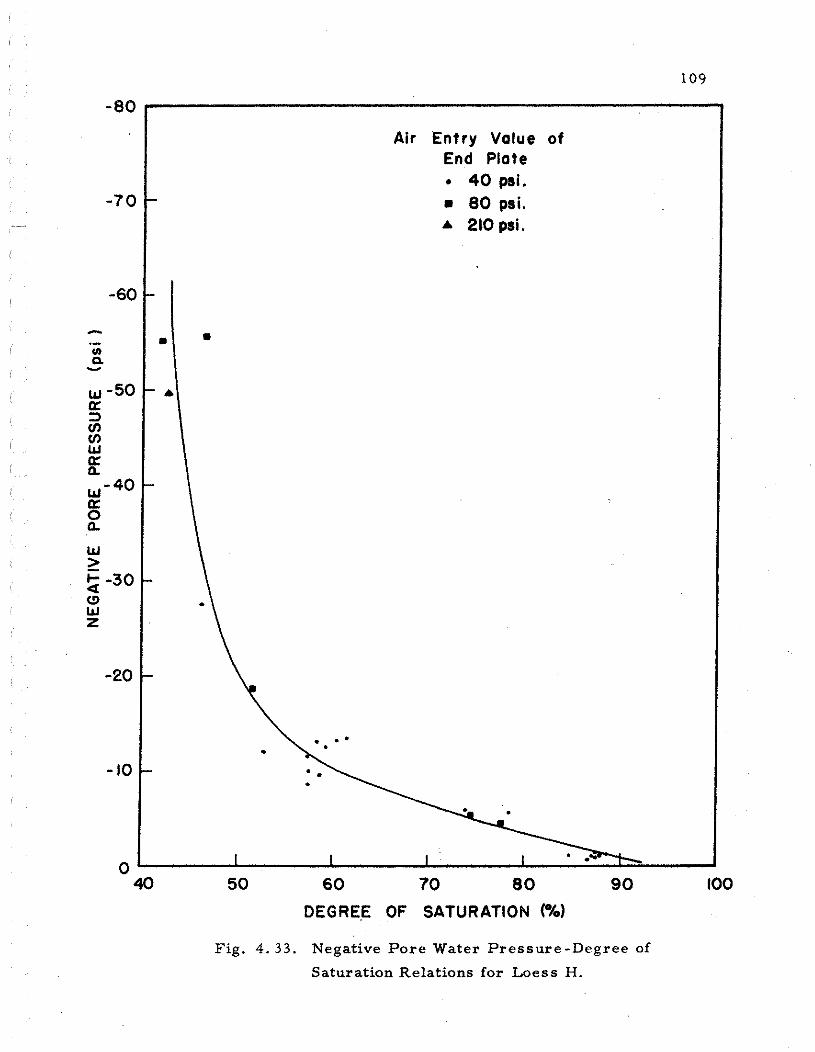
Air Entry Value of End Plate
40 psi. a 80 psi. A 210 psi.
40 50 60 70 8 0 90 100
DEGREE OF SATURATION (%)
Fig. 4 . 3 3 . Negative Pore Water Pressure -Degree of
Saturation Relations for Loess H.


2 0 40 60 80 100 120 WATER CONTENT , wc,(O/o)
Fig. 4. 35 . Negative Pore Water Pressure-Water Content
Relations for Clay Fraction.