a meta-analysis of autumn phenology studies
TRANSCRIPT

PART OF A SPECIAL ISSUE ON PLANTS AND CLIMATE CHANGE
Changes in autumn senescence in northern hemisphere deciduous trees:
a meta-analysis of autumn phenology studies
Allison L. Gill1, Amanda S. Gallinat1, Rebecca Sanders-DeMott1, Angela J. Rigden2,
Daniel J. Short Gianotti2, Joshua A. Mantooth
2and Pamela H. Templer
1,*
1Department of Biology and 2Department of Earth and Environment, Boston University, Boston, MA 02215, USA* For correspondence. E-mail [email protected]
Received: 11 February 2015 Returned for revision: 5 March 2015 Accepted: 24 March 2015 Published electronically: 11 May 2015
� Background and Aims Many individual studies have shown that the timing of leaf senescence in boreal andtemperate deciduous forests in the northern hemisphere is influenced by rising temperatures, but there is limitedconsensus on the magnitude, direction and spatial extent of this relationship.� Methods A meta-analysis was conducted of published studies from the peer-reviewed literature that reportedautumn senescence dates for deciduous trees in the northern hemisphere, encompassing 64 publications with obser-vations ranging from 1931 to 2010.� Key Results Among the meteorological measurements examined, October temperatures were the strongestpredictors of date of senescence, followed by cooling degree-days, latitude, photoperiod and, lastly, total monthlyprecipitation, although the strength of the relationships differed between high- and low-latitude sites. Autumn leafsenescence has been significantly more delayed at low (25� to 49�N) than high (50� to 70�N) latitudes across thenorthern hemisphere, with senescence across high-latitude sites more sensitive to the effects of photoperiod andlow-latitude sites more sensitive to the effects of temperature. Delays in leaf senescence over time were stronger inNorth America compared with Europe and Asia.� Conclusions The results indicate that leaf senescence has been delayed over time and in response to temperature,although low-latitude sites show significantly stronger delays in senescence over time than high-latitude sites.While temperature alone may be a reasonable predictor of the date of leaf senescence when examining a broad suiteof sites, it is important to consider that temperature-induced changes in senescence at high-latitude sites are likelyto be constrained by the influence of photoperiod. Ecosystem-level differences in the mechanisms that control thetiming of leaf senescence may affect both plant community interactions and ecosystem carbon storage as globaltemperatures increase over the next century.
Key words: Autumn phenology, climate change, growing season, leaf senescence, temperature, deciduous tree,woody plants.
INTRODUCTION
Air temperatures around the globe are increasing (Jones et al.,2012), which has measureable effects on a variety of plant pro-cesses. Specifically, the effects of climate change on the phe-nology of vegetation have received increased attention over thepast several decades as any factor that alters the timing of earlygrowing season leaf-out and senescence has the potential to af-fect a variety of ecosystem properties. For example, the timingof leaf-out and senescence of deciduous plants has been shownto affect plant competition (Fridley, 2012), plant growth(Myneni et al., 1997) and ecosystem carbon uptake(Barichivich et al., 2012). Changes in phenology also affect sur-face albedo through differences in reflectance between closedand bare canopies (Richardson et al., 2013). While leaf-out hasbeen shown to advance over the past century as a result of in-creasing air temperatures (Linderholm, 2006; Polgar andPrimack, 2011), the relationship between temperature and leafsenescence remains less well understood (Garcıa-Plazaolaet al., 2003; Richardson et al., 2013). Leaf senescence com-pletes the growing season for deciduous trees and therefore fac-tors that delay leaf-off can lengthen the period of plant
photosynthesis and increase rates of gross primary productivity(Richardson et al., 2010). Thus, an extension of the growingseason can contribute to reduced atmospheric CO2 concentra-tions due to enhanced carbon sequestration in terrestrial plants(Penuelas et al., 2009; Richardson et al., 2013). However, theincrease in carbon uptake may be partially offset by increasedrates of ecosystem respiration (Piao et al., 2008).
Efforts to examine the effects of increasing air temperatureson leaf senescence have employed a wide array of methodolo-gies and have measured senescence across a range of scales,from ground-based observations of individual trees to regional-scale remote sensing. Ge et al. (2014) conducted a meta-analy-sis of ground-based phenological data sets spanning >20 yearsthroughout China and found that leaf senescence in trees andwoody shrubs was delayed by 1�98 d per decade from 1960 to2011. Menzel et al. (2006) used long-term, ground-based obser-vations to determine that autumn senescence in Europe was de-layed by 1�3 d per decade and 1�0 d �C–1 between 1971 and2000; however, these trends were not unidirectional as only15 % of individual sites demonstrated significantly delayed se-nescence, 12 % showed senescence dates that advanced and
VC The Author 2015. Published by Oxford University Press on behalf of the Annals of Botany Company.All rights reserved. For Permissions, please email: [email protected]
Annals of Botany 116: 875–888, 2015
doi:10.1093/aob/mcv055, available online at www.aob.oxfordjournals.org
Downloaded from https://academic.oup.com/aob/article-abstract/116/6/875/161733by gueston 31 January 2018

83 % did not change significantly over time. Through the useof 8� 8 km2 grid remote-sensing data, Piao et al. (2006) dem-onstrated that senescence was delayed by 0�37 d year–1 over the27 year period between 1982 and 2009 in deciduous forests inthe northern hemisphere. Jeong et al. (2011) found evidence ofadvanced senescence in temperate North America using satel-lite data from 1982 to 2011. Several additional studies alsoshow weak or insignificant relationships between the timing ofautumn senescence and air temperatures (Menzel, 2003;Menzel et al., 2006; Pudas et al., 2008).
The lack of consistent relationships between air temperatureand timing of leaf senescence suggests that autumn senescencemay be influenced by a variety of factors that obscure its rela-tionship with temperature. The date of first frost in the autumnmonths in temperate and boreal ecosystems is highly variableand does not always follow a linear cooling trend (Way andMontgomery, 2014). It is therefore likely that the timing of leafsenescence responds to a suite of environmental factors, al-though the genetic basis of senescence activity and physiologyremains unknown (Tuskan et al., 2006; Way and Montgomery,2014). For example, photoperiod (Hanninen and Tanino 2011;Jeong et al., 2011; Way, 2011) and local meteorological factorssuch as wind and humidity (Staelens et al., 2003; Travers andEldridge, 2013) have all been shown to affect dates of senes-cence. The factors that most strongly influence the onset of se-nescence may also differ across ecosystems, with high-latitudeplants considered to be more responsive to photoperiod andlow-latitude plants more responsive to temperature (Stinzianoand Way, 2014; Way and Montgomery, 2014). In addition tosite-level meteorological factors, recent studies also demon-strate a relationship between the timing of spring leaf-out andthe timing of autumn leaf senescence (Fu et al., 2014; Keenanand Richardson, 2015).
Changes in vegetation dynamics have major implications forthe global carbon cycle, yet the current generation of terrestrialbiosphere models often fail to simulate changes in autumn phe-nology accurately (Richardson et al., 2012). Many terrestrialbiosphere models use temperature as a primary predictor of leafsenescence despite its inconsistency as a strong driver in obser-vational studies (Menzel, 2002; Menzel et al., 2006;Richardson et al., 2013). For example, the Integrated BiosphereSimulator (IBIS) model induces leaf drop when mean daily airtemperatures fall below 5 �C (Foley et al., 2010), while othermodels use combinations of both mean air temperature andthreshold temperatures to predict leaf shedding (Estrella andMenzel, 2006). Growing degree-days or cooling degree-daysare employed in some models, and provide an integrated mea-sure of temperature history over a growing season (White andNemani, 2003; Jolly et al., 2005; Richardson et al., 2012).Other models predict leaf drop through an integration of photo-period and mean air temperature thresholds (BIOME-BGC;White et al., 1997), or photoperiod and cooling degree-daysummation (Delpierre et al., 2009). The lack of consensus inphenology modelling schemes reflects the fact that the mecha-nisms that drive autumn phenology remain poorly understood(Vitasse et al., 2011).
Leaf senescence data are widely collected, although integrat-ing these observations into an interpretable framework poses achallenge due to the variability in measurement methods andcriteria used to determine the date of senescence. There is no
consistent definition of leaf senescence, nor a standard method-ology used for monitoring the process across studies (Gallinatet al. 2015). Some data networks standardize methodologiesover specific regions or habitat types in an effort to synthesizesenescence trends over time and space (e.g. Ibanez et al., 2010;Panchen et al., 2015). Despite these large-scale efforts, thereare numerous individual studies that have examined controls onthe timing of leaf senescence at local and regional scales thatvary in their methodology. In many cases the definition of leafsenescence depends on the plant species examined, as somespecies’ life history traits inherently lend themselves to particu-lar definitions. For instance, the genus Quercus typically holdssenescing leaves longer than other genera, which may make thedate of 50 % leaf colour change the best description of leaf se-nescence, while members of the genus Paulownia drop greenleaves, making leaf drop a preferable metric to characterize theend of the growing season. Some studies integrate physiologicalmeasurements such as photosynthetic rate and chlorophyll con-tent to delineate the date of senescence (Nagai et al., 2011).While the metrics chosen by individual research groups oftenoptimize senescence estimates for a particular genus or loca-tion, the variation in methodology across ecosystems makeslarge-scale generalization challenging.
Here we synthesize publications from the peer-reviewed lit-erature to evaluate larger scale trends in dates of leaf senes-cence across leaf senescence studies in the northernhemisphere. We present a meta-analysis to describe patterns ofleaf senescence in boreal and temperate deciduous trees and ex-amine relationships between dates of leaf senescence and mete-orological measurements to assess physical drivers of leafsenescence. The primary goals of this synthesis were to: (1)characterize the methodologies employed in observations of au-tumn senescence in boreal and temperate deciduous trees in thenorthern hemisphere; (2) determine the influence of tempera-ture, precipitation, latitude and photoperiod on the timing ofleaf senescence in high- and low-latitude ecosystems; (3) iden-tify how senescence trends differ among taxa and regions; and(4) provide recommendations for future research by identifyingbiologically relevant methods for monitoring leaf senescenceand characterizing key areas of uncertainty in predicting senes-cence phenology.
MATERIALS AND METHODS
Data collection
We assembled a database of peer-reviewed publications usingthe Web of Science search engine. We used all combinations ofthe following search terms as ‘topics’: ‘autumn’ or ‘fall’; ‘phe-nology’ or ‘senescence’; ‘tree’ or ‘plant’ or ‘forest’; and ‘leaf’.We limited the search to English-language, peer-reviewed jour-nal articles published before 25 February 2013. The search re-sulted in 760 publications, but we limited our subsequentanalysis to all publications that report either (1) the date of treeleaf senescence in a given year (for one year or a series ofyears) or (2) a rate of change in tree leaf senescence dates overtime or temperature for a reported measurement period. Welimited the data set to publications that report estimates of au-tumn leaf senescence for ecosystems with one annual senes-cence period. To optimize data resolution, we included only
876 Gill et al. — Meta-analysis of autumn senescence in the northern hemisphere
Downloaded from https://academic.oup.com/aob/article-abstract/116/6/875/161733by gueston 31 January 2018
those publications in which researchers monitored phenologymore frequently than 14 day intervals throughout the senes-cence period. We included measurements from both young andmature trees and, in the cases of experimental studies, used datafrom reference treatments only. Within publications, we consid-ered unique sites and plant species to represent independentdata. We extracted data from tables and text when availableand used DataThief (version 1.6; Tummers, 2006) to extractvalues presented in the figures.
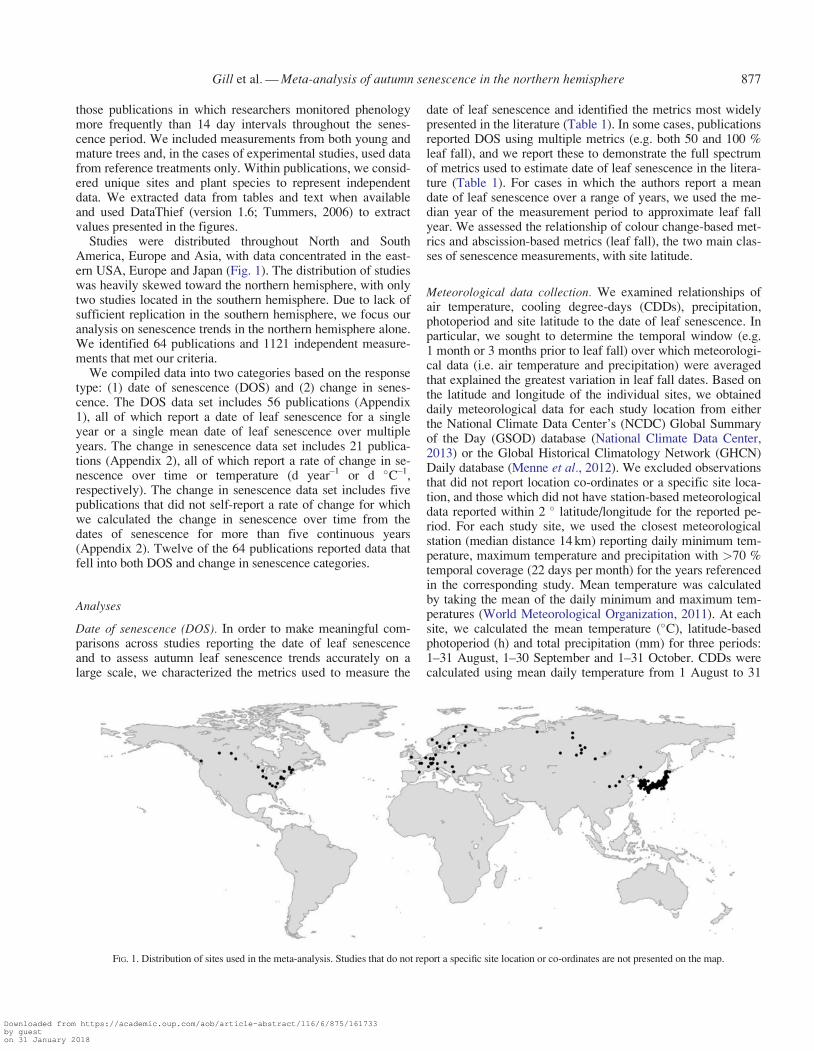
Studies were distributed throughout North and SouthAmerica, Europe and Asia, with data concentrated in the east-ern USA, Europe and Japan (Fig. 1). The distribution of studieswas heavily skewed toward the northern hemisphere, with onlytwo studies located in the southern hemisphere. Due to lack ofsufficient replication in the southern hemisphere, we focus ouranalysis on senescence trends in the northern hemisphere alone.We identified 64 publications and 1121 independent measure-ments that met our criteria.
We compiled data into two categories based on the responsetype: (1) date of senescence (DOS) and (2) change in senes-cence. The DOS data set includes 56 publications (Appendix1), all of which report a date of leaf senescence for a singleyear or a single mean date of leaf senescence over multipleyears. The change in senescence data set includes 21 publica-tions (Appendix 2), all of which report a rate of change in se-nescence over time or temperature (d year–1 or d �C–1,respectively). The change in senescence data set includes fivepublications that did not self-report a rate of change for whichwe calculated the change in senescence over time from thedates of senescence for more than five continuous years(Appendix 2). Twelve of the 64 publications reported data thatfell into both DOS and change in senescence categories.
Analyses
Date of senescence (DOS). In order to make meaningful com-parisons across studies reporting the date of leaf senescenceand to assess autumn leaf senescence trends accurately on alarge scale, we characterized the metrics used to measure the
date of leaf senescence and identified the metrics most widelypresented in the literature (Table 1). In some cases, publicationsreported DOS using multiple metrics (e.g. both 50 and 100 %leaf fall), and we report these to demonstrate the full spectrumof metrics used to estimate date of leaf senescence in the litera-ture (Table 1). For cases in which the authors report a meandate of leaf senescence over a range of years, we used the me-dian year of the measurement period to approximate leaf fallyear. We assessed the relationship of colour change-based met-rics and abscission-based metrics (leaf fall), the two main clas-ses of senescence measurements, with site latitude.
Meteorological data collection. We examined relationships ofair temperature, cooling degree-days (CDDs), precipitation,photoperiod and site latitude to the date of leaf senescence. Inparticular, we sought to determine the temporal window (e.g.1 month or 3 months prior to leaf fall) over which meteorologi-cal data (i.e. air temperature and precipitation) were averagedthat explained the greatest variation in leaf fall dates. Based onthe latitude and longitude of the individual sites, we obtaineddaily meteorological data for each study location from eitherthe National Climate Data Center’s (NCDC) Global Summaryof the Day (GSOD) database (National Climate Data Center,2013) or the Global Historical Climatology Network (GHCN)Daily database (Menne et al., 2012). We excluded observationsthat did not report location co-ordinates or a specific site loca-tion, and those which did not have station-based meteorologicaldata reported within 2 � latitude/longitude for the reported pe-riod. For each study site, we used the closest meteorologicalstation (median distance 14 km) reporting daily minimum tem-perature, maximum temperature and precipitation with >70 %temporal coverage (22 days per month) for the years referencedin the corresponding study. Mean temperature was calculatedby taking the mean of the daily minimum and maximum tem-peratures (World Meteorological Organization, 2011). At eachsite, we calculated the mean temperature (�C), latitude-basedphotoperiod (h) and total precipitation (mm) for three periods:1–31 August, 1–30 September and 1–31 October. CDDs werecalculated using mean daily temperature from 1 August to 31
FIG. 1. Distribution of sites used in the meta-analysis. Studies that do not report a specific site location or co-ordinates are not presented on the map.
Gill et al. — Meta-analysis of autumn senescence in the northern hemisphere 877
Downloaded from https://academic.oup.com/aob/article-abstract/116/6/875/161733by gueston 31 January 2018

October. CDDs represent the thermal sum below a base temper-ature of 20�C based on the method of Richardson et al. (2006).
We examined the relationships between meteorological vari-ables and date of 50 % leaf fall, the most common metric em-ployed across DOS studies (Table 1). We binned senescenceobservations by site latitude (low latitude, 25–49�N; high lati-tude, 50–70�N; roughly corresponding to the distribution oftemperate and boreal forests, respectively) and regressed meanDOS at each site against mean August, September and Octobertemperature (�C), cumulative CDDs (�C), photoperiod on thedate of leaf senescence (h), site latitude and total monthly pre-cipitation (mm) for August, September and October. In order toassess the relative effect of temperature and photoperiod on thedate of senescence across high and low latitude sites, we thenused partial correlation analysis to assess the relationship be-tween the DOS and temperature (mean August, September,October and cumulative CDDs) while removing the effect ofphotoperiod.
Change in senescence. While all studies completed their obser-vation period between 1993 and 2010, the start of senescenceobservations varied widely across studies from 1931 to 2005(Appendix 2). In order to evaluate the influence of whenobservations were initiated and the study duration on study-specific estimates of change in senescence over time ortemperature, we binned studies by decades based on the start ofthe measurement period. We further binned studies by conti-nent (North America, Europe and Asia), major plant order (allorders with more than five independent measurements) and site
latitude (low latitude, 25–49�N; high latitude, 50–70�N) toevaluate the relationships between spatial and taxonomicfactors and the date of senescence. We computed the meanchange in the date of senescence over time (years) andtemperature (�C) across all studies and used one-way analy-ses of variance (ANOVAs; P< 0�05) and Tukey’s tests of post-hoc intergroup comparison to assess differences in the changein senescence across continents, plant orders, site latitude rangeand time periods. All statistical analyses were conducted in R(version 3.1.1; R Development Core Team, 2013).
RESULTS
Date of senescence
Among DOS studies, we identified 24 distinct methods of esti-mating date of autumn leaf senescence across 56 publications(Table 1; Appendix 1). These publications utilized a variety ofmetrics, including leaf fall, leaf colour change and annualchanges in plant physiology as measures of leaf senescence.Date of senescence was significantly earlier at higher latitudes,regardless of whether colour change or percentage leaf fall wasused as a measure of date of senescence (P< 0�01 for both;Fig. 2). However, latitude explained more variation in the dateof leaf senescence in measurements utilizing colour change(R2¼ 0�55; e.g. 50 % colour change, 50 % green, peak colourchange, more yellow than green leaves; Fig. 2A) compared topercentage leaf fall (R2¼ 0�26; e.g. 10, 50, 80, 90 and 100 %leaf fall; Fig. 2B).
TABLE 1. Metrics used to estimate date of senescence across publications reporting the date of fall leaf senescence in the northernhemisphere (DOS studies only, n¼ 56 publications and 861 independent measurements total)
Leaf senescence metric No. of publications Fraction of publications No. of observations Fraction of observations
50 % leaf fall 20 0�36 291 0�34100 % leaf fall 12 0�21 162 0�19NDVI 6 0�11 83 0�180 % leaf fall 4 0�07 62 0�0750 % green 3 0�05 3 050 % colour change 2 0�04 7 0�010 % green 2 0�04 2 050 % yellow 2 0�04 3 0PAR transmission plateau 2 0�04 66 0�08Peak colour change 2 0�04 94 0�11Start of leaf fall 2 0�04 68 0�0810 % colour change in 10 % of trees 1 0�02 8 0�0110 % colour change in 90 % of trees 1 0�02 8 0�0110 % leaf fall 1 0�02 48 0�0650 % Amax 1 0�02 6 0�0150 % colour change or leaf fall 1 0�02 103 0�1275 % leaf fall 1 0�02 9 0�0190 % leaf fall 1 0�02 9 0�01Eddy covariance 1 0�02 2 0Landsat 50 % cover 1 0�02 1 0More yellow than green leaves 1 0�02 4 0Photo ‘greenness’ index 1 0�02 1 0Photosynthetic rate¼ 0 1 0�02 16 0�02Peak red 1 0�02 1 0
The number and total percentage of published studies and independent observations that used each metric are reported.Note that many studies employed multiple metrics, therefore the number of entries in the table is greater than the total number of publications included in
Appendix 1.See Appendix 1 for list of publications included here.LAI, leaf area index; PAR, photosnthetically acive radiation; NDVI, normalized difference vegetation index.
878 Gill et al. — Meta-analysis of autumn senescence in the northern hemisphere
Downloaded from https://academic.oup.com/aob/article-abstract/116/6/875/161733by gueston 31 January 2018

We limited our analysis of the relationship between meteoro-logical variables and the date of leaf senescence to studies re-porting the date of 50 % leaf fall in order to compare acommon metric of leaf senescence among published studies (20publications). The date of 50 % leaf fall was the most commonmetric utilized and accounted for 36 % of publications and34 % of individual observations of DOS. Thirteen of the other24 methods used to characterize the date of leaf senescencewere unique to a single study; it was therefore not feasible toexamine effects of meteorological measurements across thesestudies together.
Simple linear regression models highlighted relationships be-tween site-level meteorological data and the date of 50 % leaffall across all sites examined in the northern hemisphere(Fig. 3). Compared with other meteorological variables, meanmonthly temperature explained the most variation in the date of50 % leaf fall, and the relationship strengthened as the tempera-ture window examined shifted later in the year, with a delay of2�49 6 0�48 (mean 6 s.e.) d �C–1 in mean October temperature
(R2¼ 0�49, P< 0�001; Fig. 3C). Sites with greater CCDs sen-esced earlier (R2¼ 0�37, P< 0�001; Fig. 3D). Latitude and pho-toperiod on the date of 50 % leaf fall explained 25 and 22 % ofthe variation in the date of 50 % leaf fall, respectively (Fig. 3E,F). Greater precipitation in August through October weakly de-layed or did not change leaf fall timing significantly, with pre-cipitation alone explaining �16 % of the variability in the dateof 50 % leaf fall (Fig. 3G–I).
The relationships between date of 50 % leaf fall and all mea-sures of temperature (August, September, October mean tem-perature and cumulative CDDs) were weaker in high-latitudecompared with low-latitude sites (Table 2; Fig. 3A–D). The re-lationship between date of 50 % leaf fall and each measure oftemperature weakened (i.e. P-values increased) once the effectof photoperiod through partial correlation analysis was removedfor high-latitude sites (CDD: R¼ –0�54, P¼ 0�068; Rpartial¼–0�064, P¼ 0�87; mean October temperature: R¼ 0�59,P¼ 0�068; Rpartial¼ 0�25, P¼ 0�50; Table 2). In contrast, the re-lationship between each measure of temperature and date of50 % leaf fall in low-latitude sites remained statistically signifi-cant when the effect of photoperiod was removed (CDD:R¼ –0�69, P¼ 0�001; Rpartial¼ –0�49, P¼ 0�02; mean Octobertemperature: R¼ 0�81, P< 0�001; Rpartial¼ 0�73, P< 0�001;Table 2).
Change in senescence
Six publications reported changes in autumn leaf senescencewith temperature (109 independent observations) and 18 publi-cations (291 independent observations) reported changes in au-tumn leaf senescence with time (Appendix 2). Examining allstudies together, we found that leaf senescence was delayed by0�33 6 0�03 d year–1 and 1�20 6 0�17 d �C–1 (mean 6 1 s.e.).Date of senescence did not vary over time at high-latitude sites,but was significantly more delayed at low-latitude sites overtime (P¼ 0�040; Fig. 4A). The relationship between date of se-nescence and temperature did not differ significantly betweenhigh and low latitudes (P¼ 0�96; Fig 4B). In all sites (low- andhigh-latitude), date of senescence was delayed with increasedtemperatures (Fig. 4B). Senescence was delayed with timeacross all three northern hemisphere continents examined, butthe delay was significantly larger with time in North Americathan in Europe and Asia (P <0�001; Fig. 4C). Both Europe andAsia showed delayed leaf senescence with increased tempera-tures (Fig. 4D), but there was not a statistically significant dif-ference in response to temperature between continents(P¼ 0�095, Fig. 4B). Both Rosales and Fagales were signifi-cantly more delayed per �C than Ginkogales (P< 0�0001;Fig. 4F). The rate of senescence delay (d year–1 and d degree–1)was higher in studies initiated in recent decades (1990s–2000s)than those initiated in 1930–1980, although the difference wasnot statistically significant (Fig. 4G, P¼ 0�069; Fig. 4H,P¼ 0�095, respectively).
DISCUSSION
Drivers of autumn leaf senescence
Among the meteorological measurements examined, Octobertemperatures were the strongest predictors of date of 50 % leaf
350 A
B
300
Colour change
250
Dat
e of
sen
esce
nce
200
Leaf fall
Dat
e of
sen
esce
nce
350
300
250
20030 40 50
Latitude (°N)
60 70
FIG. 2. Relationship between latitude and the date of leaf senescence by studiesthat estimate date of senescence using (A) leaf colour change and (B) percentageleaf fall. Points represent all studies that estimate the date of leaf senescence us-ing either method. Measurements using leaf colour change explain more varia-tion in the relationship between latitude and the date of leaf senescence thanmeasurements using percentage leaf fall (colour change, R2¼ 0�55, P< 0�001;
leaf fall, R2¼ 0�26, P< 0�001).
Gill et al. — Meta-analysis of autumn senescence in the northern hemisphere 879
Downloaded from https://academic.oup.com/aob/article-abstract/116/6/875/161733by gueston 31 January 2018

fall, followed by CDDs, latitude, photoperiod and, lastly, totalmonthly precipitation, although the strength of the relationshipsdiffered between high- and low-latitude sites (Figs 3 and 4;Table 2). Temperature continued to explain significant variationin the date of 50 % leaf fall in low-latitude sites after the effectof photoperiod was removed, but did not explain significantvariation in high-latitude leaf fall timing following removal ofphotoperiod from regression models (Table 2). These resultssuggest that while temperature alone may be a reasonable pre-dictor of the date of 50 % leaf fall in general (mean Octobertemperature: R2¼ 0�49 across all sites), the factors that moststrongly control leaf fall may differ by site location. The lack ofchange in date of 50 % leaf fall over time at high latitudes
350 A B C
D E F
G H I
300
250
200
0 5 10 15
Mean Aug temperature (*C)
20 25 30
0 50 100 150 200 250 300
Total Aug precipitation (mm)
0 50 100 150 200 250 300
Total Sept precipitation (mm)
0 50 100 150 200 250 300
Total Oct precipitation (mm)
DO
S
350
300
250
200
0 200 400 600
CDD Aug–Oct (°C)
800 1000 1200
DO
S
350
300
250
200
DO
S
0 5 10 15
Mean Sept temperature (*C)
20 25 30
90807060
Latitude (°N)
50 1412108
Photoperiod (h)
644030
0 5 10 15
Mean Oct temperature (*C)
20 25 30
High: m = 1.76, P = 0.48, R 2 = 0.06Low: m = 1.43, P = 0.09, R 2 = 0.15All: m = 1.46, P = 0.03, R 2 = 0.17
High: m = 0.21, P = 0.03, R 2 = 0.45Low: m = 0.05, P = 0.26, R 2 = 0.07All: m = 0.09, P = 0.03, R 2 = 0.16
High: m = – 0.02, P = 0.84, R 2 = 0.005
Low: m = 0.16, P = 0.01, R 2 = 0.31
All: m = 0.11, P = 0.06, R 2 = 0.13
High: m = –0.05, P = 0.64, R 2 = 0.03Low: m = 0.03, P = 0.65, R 2 = 0.012All: m = 0, P = 0.99, R 2 = 0
High: m = –0.03, P = 0.11, R 2 = 0.29Low: m = –0.05, P = 0.001, R 2 = 0.48All: m = –0.03, P < 0.001, R 2 = 0.37
High: m = –1.88, P = 0.04, R 2 = 0.44Low: m = –1.64, P = 0.007, R 2 = 0.36All: m = –0.77, P = 0.006, R 2 = 0.25
High: m = 10.05, P = 0.06, R 2 = 0.36Low: m = 21.72, P = 0.01, R 2 = 0.31All: m = 6.65, P = 0.011, R 2 = 0.22
High: m = 2.84, P = 0.10, R 2 = 0.31
Low: m = 2.46, P = 0.003, R 2 = 0.39
All: m = 1.80, P = 0.001, R 2 = 0.33
High: m = 2.78, P = 0.07, R 2 = 0.36
Low: m = 3.25, P < 0.001, R 2 = 0.65
All: m = 2.49, P<0.001, R 2 = 0.49
High latitude
All sitesLow latitude
FIG. 3. Relationship between monthly averaged site temperature (�C), cooling degree-days (CDDs, �C), photoperiod (h) on date of senescence (DOS), site latitude,total monthly precipitation (mm) and the date of 50 % leaf fall. Points represent the average date of 50 % leaf fall by site. Low-latitude and high-latitude sites are as
indicated in the key in (A).
TABLE 2. Partial correlation coefficients associated with simplelinear regression models
Parameter Effect removed Low latitude High latitude
R P-value R P-value
Cooling degree-days (�C) None –0�69 0�001 –0�54 0�068Photoperiod –0�49 0�02 –0�064 0�87
August temperature (�C) None 0�39 0�098 0�25 0�48Photoperiod –0�31 0�19 –0�072 0�85
September temperature (�C) None 0�63 0�4 0�55 0�097Photoperiod 0�35 0�14 0�012 0�96
October temperature (�C) None 0�81 <0�001 0�59 0�068Photoperiod 0�73 <0�001 0�25 0�5
880 Gill et al. — Meta-analysis of autumn senescence in the northern hemisphere
Downloaded from https://academic.oup.com/aob/article-abstract/116/6/875/161733by gueston 31 January 2018

despite large changes in temperature (Fig. 4A; Jones et al.,2012) is possibly due to the strong constraint photoperiod im-poses on the timing of leaf fall in these latitudes (Stinziano andWay, 2014; Way and Montgomery, 2014). Our results suggestthat while temperature and photoperiod are two important vari-ables that could be incorporated in models to predict the date ofleaf senescence, it is unlikely that model parameters can be ap-plied uniformly at the global scale. Temperature alone may pro-vide a reasonable predictor for the date of 50 % leaf fall at lowlatitudes, but the inclusion of the effect of photoperiod in mod-els may be important to assess the timing of leaf-off at highlatitudes.
Compared with low-latitude ecosystems, high-latitude eco-systems may continue to experience the largest increases intemperature over the next century (Jones et al., 2012), whilephotoperiod will remain the same over time. These asynchro-nous changes in meteorological factors may affect plant com-munities and their role in carbon sequestration (Stinziano andWay, 2014). For example, as the ranges of more southerly plantspecies migrate north in response to rising temperatures (Becket al., 2011), these temperature-responsive species maylengthen their photosynthetic period, while native, photoperiod-dependent northerly species may show less flexibility in thetiming of leaf senescence, affecting competitive dynamics
2·0A B
C D
E F
G H
6
4
2
0
–2
6
4
2
0
–2
6
4
2
0
–2
6
4
2
0
–2
1·5
1·0
Day
s pe
r ye
ar
Day
s pe
r de
gree
Day
s pe
r de
gree
Day
s pe
r de
gree
Day
s pe
r de
gree
Day
s pe
r ye
arD
ays
per
year
Day
s pe
r ye
ar
0
Low latitude
274
237
16
192 79 19
145 85 86
2 102 5
55 46
a
a
a
a
a
b
Asia
Fagales
1930–1959 1960–1989
Years Years
1990–2009 1930–1959 1960–1989 1990–2009
Ginkgoales Rosales Sapindales Fagales Ginkgoales Rosales
Europe N. America Asia Europe N. America
28 25
16
a
a
a
a a
a
a a a
a
a
101 8 0
aa
5104
b
bb
P = 0·040
P < 0·001
P = 0·15
P = 0·0694 P = 0·0948
P = 0·96
P = 0·095
P < 0·0001
High latitude Low latitude High latitude
2·0
1·5
1·0
0·5
0·5
0
2·0
1·5
1·0
0·5
0
2·0
1·5
1·0
0·5
0
FIG. 4. Change in date of senescence by latitude range, continent, plant order and decade. Shown are orders with more than five independent observations. Time pe-riods in (G) and (H) show the decade in which senescence observations began, with all studies ending between 1993 and 2010. Values are means 6 s.e.; different let-
ters indicate statistically significant differences between groups. Values below the bars show the number of independent observations.
Gill et al. — Meta-analysis of autumn senescence in the northern hemisphere 881
Downloaded from https://academic.oup.com/aob/article-abstract/116/6/875/161733by gueston 31 January 2018

within plant communities (Way and Montgomery, 2014). Thestrong influence of photoperiod on leaf senescence at high lati-tudes could also influence ecosystem-scale carbon uptake.Photoperiod-induced leaf senescence will end an individualgrowing season’s period of ecosystem carbon uptake, but car-bon losses through soil respiration may remain high with warmertemperatures (Piao et al., 2008). While warming-inducedchanges in leaf senescence delay the end of the growing seasonand result in enhanced net carbon uptake in temperate forests(Keenan et al., 2014), these patterns may not hold true in higherlatitude boreal forests if trees do not extend their period of photo-synthesis at the end of the growing season. In other words, thestronger constraint of photoperiod on date of leaf senescence inhigh-latitude boreal deciduous forests may limit the response offorest carbon uptake to increases in temperature.
There was a statistically significant delay in leaf senescencewith time (days per year) across all three continents in the north-ern hemisphere, but delays were stronger in North America thanin Europe and Asia. This pattern is similar to the results of Piaoet al. (2007), who used large-scale remote-sensing techniquesand quantified senescence delays of 0�28 d year–1 in NorthAmerica but only 0�11 d year–1 in Eurasia over the last two de-cades. Some of the differences observed across continents maybe due to differences in tree species composition and the numberof species assessed. Differences in geographical distribution ofstudies within each continent may also explain some of the vari-ation observed. For example, while European studies were dis-tributed throughout the continent, studies tended to beconcentrated in coastal regions in Asia and North America (Fig.1). In addition, our analysis found that high-latitude regionshave smaller changes in senescence over time than low-latituderegions (Fig. 4). As the majority of high-latitude studies in-cluded in this analysis were conducted in Europe, it is not sur-prising that we found larger delays in North America and Asiathan in Europe. Unlike satellite-derived measurements of senes-cence that show an intensifying delay in senescence in recentdecades (Jeong et al., 2011), we did not find a statistically sig-nificant change in the rate of delay over time (Fig. 4G).
Recommendations for future research
Looking forward, as the study of leaf senescence phenologygarners additional research interest, one important take-awayfrom this meta-analysis is the need to identify and use common,biologically relevant definitions of the date of leaf senescence.Among the publications we examined in our meta-analysis,date of senescence was estimated by a variety of metrics, in-cluding leaf fall, colour change and chlorophyll content, andwas measured on a variety of scales, including leaf, branch, in-dividual tree and total canopy. Fifty per cent leaf fall comprisedover one-third of senescence measurements, and we show thatit is a useful metric to compare date of senescence observationsacross multiple studies. Leaf fall is easily characterized in thefield and contributes to measurements of forest productivity,making it a practical ecological measure. While 50 % leaf fallis the metric most commonly used across studies of fall leaf se-nescence, our results demonstrate that senescence dates esti-mated using leaf colour change are more strongly correlatedwith latitude than percentage leaf fall (Fig. 2). Because the
senescence process is a combination of biodegradation and nu-trient resorption, deciduous plants often show a large decline inphotosynthetic activity long before they drop their leaves(Wilson et al., 2001). Additionally, species-specific relation-ships between the end of the photosynthetic period and date ofleaf fall may vary, adding bias to patterns not accounted for inthis analysis. Therefore, metrics involving leaf colour changemay represent more biologically meaningful measures of theend of the growing season for deciduous plants compared withpercentage leaf fall. We suggest that researchers consider thebiological relevance of senescence metrics when designing fu-ture studies to allow for robust cross-study comparisons and en-able understanding of large-scale trends.
Deciduous trees in the northern hemisphere are well repre-sented by leaf senescence studies, especially in eastern NorthAmerica, Europe and parts of Asia (Fig. 1). Additional studiesin other regions in North America and the southern hemisphereare needed. This enlarged geographic range of studies would al-low researchers to disentangle differences in the response of au-tumn leaf senescence to changes in temperature at finerresolution across space and deciduous forest biomes (temperatevs. boreal). Due to small sample sizes, we found it was not fea-sible to estimate senescence trends at the species level. Wetherefore focused on the level of plant order and found thatplants in the order Rosales and Fagales respond to increases inair temperature with later dates of senescence compared withGinkgoales.
Regional, national and global networks of on-the-ground andremotely sensed data provide important information aboutchanges in autumn phenology, but there is an opportunity toaugment these data through smaller scale, independent studiesas well. In particular, we recommend that global change experi-ments that are currently underway to examine the effects ofelevated CO2, warmer temperatures, drought, elevated tropo-spheric ozone or other global change factors, as well as multi-factor investigations, include measurements of leaf senescence.Despite the noted underprediction of changes in spring leaf-outby experimental manipulations compared with observationalstudies (Wolkovich et al., 2012), ongoing or new experimentscould provide additional critical information by disentanglingthe various environmental and physiological drivers of autumnphenology.
Conclusions
To our knowledge, this is the first study to synthesize exist-ing senescence data derived from individual studies of decidu-ous trees throughout the northern hemisphere. Our findingsdemonstrate that across published studies, leaf senescence is de-layed over time and in response to temperature, although low-latitude sites show significantly stronger delays in senescenceover time than high-latitude sites. We find that while tempera-ture alone may be a reasonable predictor of the date of leaf se-nescence when examining a broad suite of sites, it is importantto consider that temperature-induced changes in senescence athigh-latitude sites are likely to be constrained by the influenceof photoperiod. Ecosystem-level differences in the mechanismsthat control the timing of leaf senescence may affect both plant
882 Gill et al. — Meta-analysis of autumn senescence in the northern hemisphere
Downloaded from https://academic.oup.com/aob/article-abstract/116/6/875/161733by gueston 31 January 2018
community interactions and ecosystem carbon storage as globaltemperatures increase over the next century.
ACKNOWLEDGEMENTS
We thank Richard Primack, Michael Hanley and two anony-mous reviewers for helpful comments on earlier drafts of thismanuscript. We thank Amanda Vieillard for help with theearly stages of this work, and the Boston UniversityBiogeoscience Program for providing a venue to bring ourgroup together. This work was supported by awards from theUnited States Department of Energy Office of ScienceGraduate Fellowship Program administered by the Oak RidgeInstitute for Science and Education (DE-AC05-06OR23100 toA.L.G.) and the United States National Science FoundationGraduate Fellowship Program (DGE-1247312 to A.J.R. andA.S.G.) and CAREER program (DEB 1149929 to P.H.T.).
LITERATURE CITED
Asshoff R, Zotz G, Korner C. 2006. Growth and phenology of mature temper-ate forest trees in elevated CO2. Global Change Biology 12: 848–861.
Augspurger CK, Cheeseman JM, Salk CF. 2005. Light gains and physiologi-cal capacity of understorey woody plants during phenological avoidance ofcanopy shade. Functional Ecology 19: 537–546.
Barichivich J, Briffa KR, Osborn TJ, Melvin TM, Caesar J. 2012. Thermalgrowing season and timing of biospheric carbon uptake across the NorthernHemisphere. Global Biogeochemical Cycles 26: GB4015.
Barr AG, Black TA, Hogg EH, Kljun N, Morgenstern K, Nesic Z. 2004.
Inter-annual variability in the leaf area index of a boreal aspen–hazelnut for-est in relation to net ecosystem production. Agricultural and ForestMeteorology 126: 237–255.
Beck PS Juday GP, Alix C, et al. 2011. Changes in forest productivity acrossAlaska consistent with biome shift. Ecology Letters 14: 373–379
Blanke MM, Kunz A. 2011. Effects of climate change on pome fruit phenologyand precipitation. Acta Horticulturae 922: 381–386.
Brown JL, Vargo S, Connor EF, Nuckols MS. 1997. Causes of vertical stratifi-cation in the density of Cameraria hamadryadella. Ecological Entomology22: 16–25.
Chen X, Xu L. 2012. Phenological responses of Ulmus pumila (Siberian Elm) toclimate change in the temperate zone of China. International Journal ofBiometeorology 56: 695–706.
Chen X, Hu B, Yu R. 2005. Spatial and temporal variation of phenologicalgrowing season and climate change impacts in temperate eastern China.Global Change Biology 11: 1118–1130.
Chmielewski F, Rotzer T. 2001. Response of tree phenology to climate changeacross Europe. Agricultural and Forest Meteorology 108: 101–112.
Chmielewski F, Muller A, Kuchler W. 2005. Possible impacts of climatechange on natural vegetation in Saxony (Germany). International Journalof Biometeorology 50: 96–104.
Connor EF, Adams-Manson RH, Carr TG, Beck MW. 1994. The effects ofhost plant phenology on the demography and population dynamics of theleaf-mining moth. Ecological Entomology 19: 111–120.
Delbart N, Kergoat L, Le Toan T, Lhermitte J, Picard G. 2005.
Determination of phenological dates in boreal regions using normalized dif-ference water index. Remote Sensing of Environment 97: 26–38.
Delpierre N, Dufrene E, Soudani K, et al. 2009. Modelling interannual and spa-tial variability of leaf senescence for three deciduous tree species in France.Agricultural and Forest Meteorology 149: 938–948.
Dillen SY, de Beeck MO, Hufkens K, Buonanduci M, Phillips NG. 2012.
Seasonal patterns of foliar reflectance in relation to photosyntheticcapacity and color index in two co-occurring tree species, Quercus rubraand Betula papyrifera. Agricultural and Forest Meteorology 160: 60–68.
Doi H. 2012. Response of the Morus bombycis growing season to temperatureand its latitudinal pattern in Japan. International Journal of Biometeorology56: 895–902.
Doi H, Takashi M. 2008. Latitudinal patterns in the phenological responses ofleaf colouring and leaf fall to climate change in Japan. Global Ecology andBiogeography 17: 556–561.
Dragoni D, Rahman AF. 2012. Trends in fall phenology across the deciduousforests of the Eastern USA. Agricultural and Forest Meteorology 157:96–105.
Dragoni D, Schmid HP, Wayson CA, Potter H, Grimmond C, Randolph JC.
2011. Evidence of increased net ecosystem productivity associated with alonger vegetated season in a deciduous forest in south-central Indiana, USA.Global Change Biology 17: 886–897.
Elmore AJ, Guinn SM, Minsley BJ, Richardson AD. 2012. Landscape con-trols on the timing of spring, autumn, and growing season length in mid-Atlantic forests. Global Change Biology 18: 656–674.
Estrella N, Menzel A. 2006. Responses of leaf colouring in four deciduous treespecies to climate and weather in Germany. Climate Research 32: 253–267.
Foley JA, Prentice IC, Ramankutty N, et al. 2010. An integrated biospheremodel of land surface processes, terrestrial carbon balance, and vegetationdynamics. Global Biogeochemical Cycles 10: 603–628.
Fridley JD. 2012. Extended leaf phenology and the autumn niche in deciduousforest invasions. Nature 485: 359–362.
Fu YSH, Campioli M, Vitasse Y, et al. 2014. Variation in leaf flushing date in-fluences autumn senescence and next year’s flushing date in two temperatetree species. Proceedings of the National Academy of Sciences, USA 111:7344–7360.
Gallinat AS, Primack RB, Wagner DL. 2015. Autumn, the neglected season inclimate change research. Trends in Ecology and Evolution 30: 169–176.
Garcıa-Plazaola JI, Hernandez A, Olano JM, Becerril JM. 2003. The opera-tion of the lutein epoxide cycle correlates with energy dissipation.Functional Plant Biology 30: 319–324.
Ge Q, Wang H, Rutishauser T, Dai J. 2014. Phenological response to climatechange in China: a meta-analysis. Global Change Biology 21: 1–10.
Gibson PG, Reighard PG, Scott SW, Oullette DR. 2001. Using graft transmis-sible agents in Y-trained peach systems. Acta Horticulturae 557: 139–144.
Gill DS, Amthor JS, Bormann FH. 1998. Leaf phenology, photosynthesis, andthe persistence of saplings and shrubs in a mature northern hardwood forest.Tree Physiology 18: 281–289.
Glinwood R, Pettersson J. 2000. Movement by mating females of a host alter-nating aphid: a response to leaf fall. Oikos 90: 43–49.
Grassi G, Magnani F. 2005. Stomatal, mesophyll conductance and biochemicallimitations to photosynthesis as affected by drought and leaf ontogeny inash and oak trees. Plant, Cell and Environment 28: 834–849.
Hanninen H, Tanino K. 2011. Tree seasonality in a warming climate. Trends inPlant Science 16: 412–416.
Heide OM. 2003. High autumn temperature delays spring bud burst in borealtrees, counterbalancing the effect of climatic warming. Tree Physiology 23:931–936.
Ibanez I, Primack RB, Miller-Rushing AJ, et al. 2010. Forecasting phenologyunder global warming. Philosophical Transactions of the Royal Society B:Biological Sciences 365: 3247–3260.
Isaacson BN, Serbin SP, Townsend PA. 2012. Detection of relative differencesin phenology of forest species using Landsat and MODIS. LandscapeEcology 27: 529–543.
Jeong S-J, Ho C-H, Gim H-J, Brown ME. 2011. Phenology shifts at start vs.end of growing season in temperate vegetation over Northern Hemispherefor the period of 1982–2008. Global Change Biology 17: 2385–2399.
Jolly WM, Nemani R, Running SW. 2005. A generalized, bioclimatic index topredict foliar phenology in response to climate. Global Change Biology 11:619–632.
Jones PD, Lister DH, Osborn TJ, Harpham C, Salmon M, Morice CP. 2012.
Hemispheric and large-scale land-surface air temperature variations: an ex-tensive revision and an update to 2010. Journal of Geophysical Research117: D05127.
Juknys R, Sujetoviene G, Zeimavicius K, Gustainyte J. 2011. Effects of cli-mate warming on timing of lime (Tilia cordata L.) phenology.Environmental Engineering 1: 139–143.
Juknys R, Sujetoviene G, Zeimavicius K, Sveikauskaite I. 2012a. Comparisonof climate warming induced changes in silver birch (Betula pendula Roth)and lime (Tilia cordata MIll.) phenology. Baltic Forestry 18: 25–32.
Juknys R, Zeimavicius K, Sujetoviene G, Gustainyte J. 2012b. Response oftree seasonal development to climate warming. Polish Journal ofEnvironmental Studies 21: 107–113.
Gill et al. — Meta-analysis of autumn senescence in the northern hemisphere 883
Downloaded from https://academic.oup.com/aob/article-abstract/116/6/875/161733by gueston 31 January 2018

Kafaki SB, Mataji A, Hashemi SA. 2009. Hornbeam trees phenological charac-teristics of mountain forest by using ground observation and satellite data inIran. Environmental Science and Sustainability: 121–127.
Keenan TF, Gray J, Friedl MA, et al. 2014. Net carbon uptake has increasedthrough warming-induced changes in temperate forest phenology. NatureClimate Change 4: 598–604.
Keenan TF, Richardson AD. 2015. The timing of autumn senescence is af-fected by the time of spring phenology: implications for predictive models.Global Change Biology (in press).
Keskitalo J. 2005. A cellular timetable of autumn senescence. Plant Physiology139: 1635–1648.
Kodani E, Awaya Y, Tanaka K, Matsumura N. 2002. Seasonal patterns of can-opy structure, biochemistry and spectral reflectance in a broad-leaved decidu-ous Fagus crenata canopy. Forest Ecology and Management 167: 233–249.
Kozlov MV, Berlina NG. 2002. Decline in length of the summer season on theKola Peninsula, Russia. Climatic Change 54: 387–398.
Kramer K. 1995. Phenotypic plasticity of the phenology of seven European treespecies in relation to climatic warming. Plant, Cell and Environment 18:93–104.
Kunz A, Blanke MM. 2011. Effects of global climate change on apple ‘GoldenDelicous’ phenology – based on 50 years of meteorological and phenologi-cal data in Klein-Altendorf. Acta Horticulturae 903: 1121–1126.
Laurila T, Soegaard H, Lloyd CR, Aurela M, Tuovinen JP, Nordstroem C.
2001. Seasonal variations of net CO2 exchange in European Arctic ecosys-tems. Theoretical and Applied Climatology 70: 183–201.
Lebourgeois F, Pierrat J-C, Perez V, Piedallu C, Cecchini S, Ulrich E. 2010.
Simulating phenological shifts in French temperate forests under two cli-matic change scenarios and four driving global circulation models.International Journal of Biometeorology 54: 563–581.
Lee DW, O’Keefe J, Holbrook NM, Feild TS. 2003. Pigment dynamics and au-tumn leaf senescence in a New England deciduous forest, eastern USA.Ecological Applications 18: 677–694.
Linderholm HW. 2006. Growing season changes in the last century.Agricultural and Forest Meteorology 137: 1–14.
Matsumoto K. 2010. Causal factors for spatial variation in long-term phenologi-cal trends in Ginkgo biloba L. in Japan. International Journal ofClimatology 2010: 1280–1288.
Menne MJ, Durre I, Vose RS, Gleason BE, Houston TG. 2012. An overviewof the global historical climatology network-daily database. Journal ofAtmospheric and Oceanic Technology 29: 897–910.
Menzel A. 2002. Phenology: its importance to the global change community.Climatic Change 54: 379–385.
Menzel A. 2003. Plant phenological anomalies in Germany and their relation toair temperature and NAO. Climatic Change 57: 243–263.
Menzel A, Estrella N, Fabian P. 2001. Spatial and temporal variability of thephenological seasons in Germany from 1951 to 1996. Global ChangeBiology 7: 657–666.
Menzel A, Sparks TH, Estrella N, et al. 2006. European phenological responseto climate change matches the warming pattern. Global Change Biology 12:1969–1976.
Myneni RB, Keeling CD, Tucker CJ, Asrar G, Nemani RR. 1997. Increasedplant growth in the northern high latitudes from 1981 to 1991. Nature 386:698–702.
Nagai S, Maeda T, Gamo M, Muraoka H, Suzuki R, Nasahara KN. 2011.
Using digital camera images to detect canopy condition of deciduous broad-leaved trees. Plant Ecology and Diversity 4: 79–89.
Nakamura M, Muller O, Tayanagi S, Nakaji T, Hiura T. 2010. Experimentalbranch warming alters tall tree leaf phenology and acorn production.Agricultural and Forest Meteorology 150: 1026–1029.
National Climatic Data Center. 2013. Global surface summary of day, 2013.(ftp://ftp.ncdc.noaa.gov/pub/data/gsod). Asheville, NC.
Nicolai V. 2010. Plasticity in voltinism of the successful European NeozoonPhyllonorycter robiniella (Lepidoptera: Gracillariidae). EntomologiaGeneralis 32: 301–309.
Niinemets U, Tamm U. 2005. Species differences in timing of leaf fall and fo-liage chemistry modify nutrient resorption efficiency in deciduous temper-ate forest stands. Tree Physiology 25: 1001–1014.
Norby RJ, Hartz-Rubin JS, Verbrugge MJ. 2003. Phenological responses inmaple to experimental atmospheric warming and CO2 enrichment. GlobalChange Biology 9: 1792–1801.
Panchen ZA, Primack RB, Gallinat AS, et al. 2015. Substantial variation in leafsenescence times among 1360 temperate woody plant species: implicationsfor phenology and ecosystem processes. Annals of Botany 116: 865–873.
Parker GG, Tibbs DJ. 2004. Structural phenology of the leaf community in thecanopy of a Liriodendron tulipifera L. forest in Maryland, USA. ForestEcology and Management 50: 387–397.
Pataki DE, Oren R. 2003. Species differences in stomatal control of water lossat the canopy scale in a mature bottomland deciduous forest. Advances inWater Resources 26: 1267–1278.
Pellis A, Laureysens I, Ceulemans R. 2004. Genetic variation of the bud andleaf phenology of seventeen poplar clones in a short rotation coppice cul-ture. Plant Biology 6: 38–46.
Penuelas J, Rutishauser T, Filella Y. 2009. Phenology feedbacks on climatechange. Science 324: 887–888.
Piao S, Fang J, Zhou L, Ciais P, Zhu B. 2006. Variations in satellite-derivedphenology in China’s temperate vegetation. Global Change Biology 12:672–685.
Piao S, Friedlingstein P, Ciais P, Viovy N, Demarty J. 2007. Growing seasonextension and its impact on terrestrial carbon cycle in the NorthernHemisphere over the past 2 decades. Global Biogeochemical Cycles 21:GB3018.
Piao S, Ciais P, Friedlingstein P, et al. 2008. Net carbon dioxide losses of north-ern ecosystems in response to autumn warming. Nature 451: 49–52.
Polgar CA, Primack RB. 2011. Leaf-out phenology of temperate woody plants:from trees to ecosystems. New Phytologist 191: 926–941.
Pudas E, Leppala M, Tolvanen A, Poikolainen J, Venalainen A, Kubin E.
2008. Trends in phenology of Betula pubescens across the boreal zone inFinland. International Journal of Biometeorology 52: 251–259.
R Development Core Team. 2013. R: a language and environment for statisti-cal computing. R Foundation for Statistical Computing, Vienna, Austria.Available at http://www.R-project.org.
Richardson AD, Bailey AS, Denny EG, Martin CW, O’Keefe J. 2006.
Phenology of a northern hardwood forest canopy. Global Change Biology12: 1174–1188.
Richardson AD, Braswell BH, Hollinger DY, Jenkins JP, Ollinger SV. 2009.
Near-surface remote sensing of spatial and temporal variation in canopyphenology. Ecological Applications 19: 1417–1428.
Richardson AD, Black AT, Ciais P, et al. 2010. Influence of spring and autumnphenological transitions on forest ecosystem productivity. PhilosophicalTransactions of the Royal Society B: Biological Sciences 365: 3227–3246.
Richardson AD, Anderson RS, Altaf Arain M, et al. 2012. Terrestrial bio-sphere models need better representation of vegetation phenology: resultsfrom the North American Carbon Program Site Synthesis. Global ChangeBiology 18: 566–584.
Richardson AD, Keenan TF, Migliavacca M, Ryu Y, Sonnentag O, Toomey
M. 2013. Climate change, phenology, and phenological control of vegeta-tion feedbacks to the climate system. Agricultural and Forest Meteorology169: 156–173.
Rolshausen G, Schaefer HM. 2007. Do aphids paint the tree red (or yellow) –can herbivore resistance or photoprotection explain colourful leaves in au-tumn? Plant Ecology 191: 77–84.
Schaberg PG, van den Berg AK, Murakami PF, Shane JB, Donnelly JR.
2003. Factors influencing red expression in autumn foliage of sugar maple.Tree Physiology 23: 325–333.
Schreiber SG, Hamann A, Hacke UG, Thomas BR. 2013. Sixteen years ofwinter stress: an assessment of cold hardiness, growth performance and sur-vival of hybrid poplar clones at a boreal planting site. Plant, Cell andEnvironment 36: 419–428.
Sonnentag O, Hufkens K, Teshera-Sterne C, et al. 2012. Digital repeat photog-raphy for phenological research in forest ecosystems. Agricultural andForest Meteorology 152: 159–177.
Soolanayakanahally RY, Guy RD, Silim SN, Song M. 2013. Timing of photo-periodic competency causes phenological mismatch in balsam poplar(Populus balsamifera L.). Plant, Cell and Environment 36: 116–127.
Soudani K, Hmimina G, Delpierre N, et al. 2012. Ground-based network ofNDVI measurements for tracking temporal dynamics of canopy structureand vegetation phenology in different biomes. Remote Sensing ofEnvironment 123: 234–245.
Staelens J, Nachtergale L, Luyssaert S, Lust N. 2003. A model of wind-influ-enced leaf litterfall in a mixed hardwood forest. Canadian Journal of ForestResearch 33: 201–209.
Stinziano JR, Way DA. 2014. Combined effects of rising [CO2] and tempera-ture on boreal forests: growth, physiology, and limitations. Botany 92:425–436.
Tartachnyk I, Blanke MM. 2001. Environmental effects on apple tree physiol-ogy. Acta Horticulturae 557: 465–472.
884 Gill et al. — Meta-analysis of autumn senescence in the northern hemisphere
Downloaded from https://academic.oup.com/aob/article-abstract/116/6/875/161733by gueston 31 January 2018

Tateno R, Aikawa T, Takeda H. 2005. Leaf-fall phenology along a topogra-phy-mediated environmental gradient in a cool-temperate deciduous broad-leaved forest in Japan. Journal of Forest Research 10: 269–274.
Travers SK, Eldridge DJ. 2013. Increased rainfall frequency triggers an in-crease in litter fall rates of reproductive structures in an arid eucalypt wood-land. Austral Ecology 38: 820–830.
Tummers D. 2005. DataThief III. http://datathief.org/Tuskan GA, DiFazio S, Jansson S, et al. 2006. The genome of black cotton-
wood, Populus trichocarpa (Torr. & Gray). Science 313: 1596–1604.Uddling J, Karlsson PE, Glorvigen A, Sellden G. 2005. Ozone impairs autumnal
resorption of nitrogen from birch (Betula pendula) leaves, causing an increasein whole-tree nitrogen loss through litter fall. Tree Physiology 26: 113–120.
Vitasse Y, Potre AJ, Kremer A, Michalet R, Delzon S. 2009. Responses of can-opy duration to temperature changes in four temperate tree species: relativecontributions of spring and autumn leaf phenology. Oecologia 161: 187–198.
Vitasse Y, Francois C, Delpierre N, et al. 2011. Assessing the effects of climatechange on the phenology of European temperate trees. Agricultural andForest Meteorology 151: 969–980.
Waddell KJ, Fox CW, White KD, Mousseau TA. 2001. Leaf abscission phe-nology of a scrub oak: consequences for growth and survivorship of a leafmining beetle. Oecologia 127: 251–258.
Wang J, Ives NE, Lechowicz MJ. 1992. The relation of foliar phenology to xy-lem embolism in trees. Functional Ecology 6: 469–475.
Way DA. 2011. Tree phenology responses to warming: spring forward, fallback? Tree Physiology 31: 469–471.
Way DA, Montgomery RA. 2014. Photoperiod constraints on tree phenology,performance and migration in a warming world. Plant, Cell andEnvironment (in press).
White MA, Nemani RR. 2003. Canopy duration has little influence on annualcarbon storage in the deciduous broad leaf forest. Global Change Biology 9:967–972.
White MA, Thornton PE, Running SW. 1997. A continental phenology modelfor monitoring vegetation responses to interannual climatic variability.Global Biogeochemical Cycles 11: 217–234.
Wilson KB, Baldocchi D, Hanson PJ. 2001. Leaf age affects the sea-sonal pattern of photosynthetic capacity and net ecosystem exchangeof carbon in a deciduous forest. Plant, Cell and Environment 24:571–583.
Wolkovich EM, Cook BI, Allen JM, et al. 2012. Warming experiments under-predict plant phenological responses to climate change. Nature 485:494–497.
World Meteorological Organization. 2011. Guide to climatological practices.Geneva, Switzerland: WMO-No. 100.2011 edition.
Zhang X, Goldberg MD. 2011. Monitoring fall foliage coloration dynamicsusing time-series satellite data. Remote Sensing of Environment 115:382–391.
Zhao G, Zheng Y, Liu J, Zhang X, Chen H, Wang J. 2006. The relation inves-tigatino on climate change and woody plant phenophase in Zhengzhou Cityof China In: G Gao, SL Ustin, eds. Remote sensing and modeling of ecosys-tems for sustainability III 6298: 629822.
APPENDIX 1 PUBLICATIONS INCLUDED IN
DATE OF SENESCENCE ANALYSIS
This table includes all publications that met search criteria fordate of senescence studies and were included in the senes-cence metric tabulation in Table 1. Studies highlighted in boldused the most common senescence metric (50 % leaf fall) and
were included in the regression and partial correlation analy-ses. (*) indicates a paper that reported a mean date of leaf sen-escence over a range of years, and (**) indicates that therange of years varied by site within the study.
No. Paper Observations Continent Site Latitude Longitude Biome Order Year range Senescencemetric
1 Asshoff et al.(2006)
9 Europe Swiss Canopy CraneReserve
47�46667 7�5 Temperate Fagales 2002–2004 75 % LF
2 Augspurger et al.(2005)
5 NorthAmerica
Trelease Woods,understorey
40�15 –88�16667 Temperate Sapindales 1996–1998* 0 % LAI
Trelease Woods, edgeTrelease Woods, canopy Mixed
3 Barr et al. (2004) 16 NorthAmerica
Old Aspen Site 53�7 –106�2 Boreal Fagales 1997–2003 PAR transmissionplateau, Px¼ 0Malpighiales 1994, 1996–2003
4 Blanke and
Kunz (2011)
3 Europe Klein-Altendorf Research
Centre
50�62 6�988 Temperate Mixed 1988–2010* 50 % LF
1958–2007*
1958–1987*
5 Brown et al.(1997)
4 North
American
Orland E. White
Arboretum
39�0638 –78�0646 Temperate Fagales 1994 50 % LF
6 Chen et al. (2005) 6 Asia Beijing 40�01667 116�3333 Temperate Mixed 1982–1993* NDVIGaixian 40�4333 122�3333 1982–1993*Harbin 45�7 126�6667 1982–1993*Luoyang 34�6667 112�41667 1982–1993*Mudanjiang 44�4333 129�6667 1982–1993*Xi’an 34�21667 108�96667 1982–1993*Xingtai 37�0667 114�5 1982–1993*
7 Chmielewski and
Rotzer (2001)
11 Europe Dinaric Mountain Region 42�9 20�3 Temperate Mixed 1969–1984* 50 % LF
Great Hungarian
Lowlands
46 19�6
North Alpine Foreland 47�8 10�9Southern Central
European Highlands
48�2 8�2
Bohemian Highlands 48�6 15�5Northern Central
European Highlands
50�4 8�7
British Isles 51�6 –3�8 Temperate
North Sea/Central
European Lowlands
52�9 10�1 Temperate
Baltic Sea Region 57�2 15�2 Temperate
North Atlantic Mountain
Region
61�9 8�1 Boreal
North Scandinavia 67�1 26�7 Boreal
(continued)
Gill et al. — Meta-analysis of autumn senescence in the northern hemisphere 885
Downloaded from https://academic.oup.com/aob/article-abstract/116/6/875/161733by gueston 31 January 2018

ContinuedNo. Paper Observations Continent Site Latitude Longitude Biome Order Year range Senescence
metric
8 Chmielewskiet al. (2005)
3 Europe Saxony NA NA Temperate Sapindales 1961–2000* 50 % CCFagales 1961–2000*
9 Connor et al.(1994)
6 North
America
Orland E. White
Arboretum
39�0638 �78�0646 Temperate Fagales 1989–1991 50 % LF
10 Delbart et al.(2005)
10 Asia Turuhansk 65�8 88 Boreal Fagales 1999 NDVITaseevo 57�18333 94�833333 BorealVehme 63�08333 88 BorealPodtsesovo 58�51666 92�216666 BorealAksarka 66�5 67�816666 BorealIlir 50�5 100�7 BorealKuragino 53�9 92�7 BorealKrasnoyarsk 56 93 BorealTachtip 52�733 90 BorealVolchno 54 81 Boreal
11 Dillen et al.(2012)
2 North
America
Harvard Forest 42�533 –72�183 Temperate Fagales 2010 50 % LF
Fagales
12 Doi (2012) 53 Asia Japan meteorological sites(53 sites)
NA NA Temperate Rosales 1953–2005 80 % LF
13 Doi and Takashi(2008)
2 Asia Japan meteorological sites 35�4 135�8 Temperate Ginkgoales 1953–2005* 80 % LFSapindales
14 Dragoni et al.(2011)
10 NorthAmerica
Morgon Monroe StateForest
39�317 –86�417 Temperate Mixed 1999–2008 0 % LAI
15 Dragoni andRahman(2012)
48 NorthAmerica
28�25�N 28�25 NA Temperate Mixed 1989–1999 NDVI35�75�N 35�75 NA48�25�N 48�25 NA
16 Elmore et al.(2012)
1 NorthAmerica
Cheasapeake Bay 39�87 –77�75 Temperate Mixed 2004–2008* Landsat 50 %cover
17 Fridley (2012) 6 North
America
Syracuse, NY 43�05 –76�15 Temperate Mixed 2008–2010 50 % LF, 90 %
LF
18 Gibson et al.(2001)
1 North
America
Clemson, SC 34�68 –82�84 Temperate Rosales 1998 50 % LF
19 Gill et al. (1998) 4 North
America
Hubbard Brook
Experimental Forest
43�94 –71�72 Temperate Fagales 1989 50 % LF
Lamiales
Sapindales
20 Glinwood and
Pettersson
(2000)
1 Uppsala 59�816667 17�633333 Temperate Rosales 1998 50 % LF
21 Grassi andMagnani(2005)
6 Europe Nonantola ExperimentalSite
44�683 11�033 Temperate Lamiales 2001–2003 50 % Amax
Fagales
22 Heide (2003) 7 Europe Agricultural University
of Norway
60 10�783 Boreal Fagales 1996–2002* 50 % LF
23 Isaacson et al.(2012)
8 NorthAmerica
Flambeau River StateForest
45�733 –90�75 Temperate Lamiales 2009 NDVI
Kettle Moraine StateForest
43�598 –88�280 Sapindales
24 Juknys et al.(2011)
92 Europe Vytautus Magnus
University
54�083 23�083 Temperate Malvales 1956–60,
1968–1997,
2000–2010
50 % LF, 50 %
CC
25 Kafaki et al.(2009)
4 Asia Guilan Province NA NA Temperate Fagales 2003–2006 100 % LF
26 Keskitalo (2005) 1 Europe Umea University 63�820539 20�303591 Boreal Malpighiales 2003 100 % LF27 Kodani et al.
(2002)Japan Tohoku Research Center 36�76667 141�13333 Temperate Fagales 1999 0 % LAI
28 Kozlov andBerlina (2002)
60 Europe Lapland Biosphere Reserve 67�65 32�61667 Boreal Mixed 1931–1941,1946–1952,1957–1998
Start of LF
29 Kramer (1995) 9 Europe International PhenologicalGardens
NA NA Temperate Malpighiales 1955–1987 50 % LFMalvalesPinalesFagales
30 Laurila et al.(2001)
2 Europe Petsikko 69�47 27�23 Boreal Fagales 1997–1998 Eddy covariance
31 Lebourgeois et al.(2010)
8 Europe 102 sites NA NA Temperate Pinales 1997–2006 10 % CC in 10 %of trees, 10 %CC in 90 % oftrees
Fagales32 Lee et al. (2003) 88 North
AmericaHarvard Forest 42�53 –72�18 Temperate Fagales 1991–1999 50 % LF
CornalesLamialesFagalesSapindalesRosales
33 Nagai et al.(2011)
9 Asia Takayama 36�1466 137�423 Temperate Fagales 2005–2007 0 % LAI
Sapindales34 Nakamura et al.
(2010)1 Asia Tomakomai Experimental
Forest42�667 141�6 Temperate Fagales 2008 80 % LF
35 Nicolai (2010) 8 Europe Marburg, Hesse 50�816667 8�6 Temperate Fabales 2002–2009 Start of LF
(continued)
886 Gill et al. — Meta-analysis of autumn senescence in the northern hemisphere
Downloaded from https://academic.oup.com/aob/article-abstract/116/6/875/161733by gueston 31 January 2018

ContinuedNo. Paper Observations Continent Site Latitude Longitude Biome Order Year range Senescence
metric
36 Niinemets and
Tamm (2005)
6 Europe Karkna 58�46667 26�633333 Temperate Sapindales 1997 50 % LF, 80 %
LF
Fagales
Malpighiales
37 Norby et al.(2003)
4 North
America
Oak Ridge 35�9 –84�333333 Temperate Sapindales 1995–1996 50 % LF
38 Parker and
Tibbs (2004)
11 North
America
Anapolis, MD 38�883333 –76�55 Temperate Fagales 1994 50 % LF
Cornales
Fagales
Saxifragales
Magnoliales
39 Pataki and Oren
(2003)
6 North
America
Duke Forest 36�017 –79�982 Temperate Fagales 1997 50 % LF, 100 %
LF
Saxifragales
Magnoliales
40 Pellis et al.(2004)
50 Europe Antwerp 51�083 4�366 Temperate Malpighiales 1996–1998, 2001 100 % LF, plateauPAR ratio
41 Richardson et al.(2009)
1 NorthAmerica
Bartlett ExperimentalForest
44�064 –71�288 Temperate Mixed 2007 Photo ‘greenness’index, peak redcolour
42 Rolshausen andSchaefer(2007)
2 Europe Freiberg 48 8 Temperate Rosales 2004 Peak CC
43 Schaberg et al.(2003)
1 NorthAmerica
USDA Forest ServiceNorthern ResearchStation
44�5 –73�2 Temperate Sapindales 1999 50 % green, 50 %yellow, 0 %green
44 Schreiber et al.(2013)
4 North
America
Alberta-Pacific Forest
Industries
– –113 Temperate Malpighiales 2010 More yellow
than green
leaves
45 Sonnentag et al.(2012)
1 NorthAmerica
Harvard Forest 42�5 –72�2 Temperate Mixed 2010 100 % LF, 50 %green, 0 %green
46 Soolanayakana-hally et al.(2013)
2 NorthAmerica
Vancouver 49�26 –123�25 Temperate Malpighiales 2009 100 % LF, 50 %yellowIndian Head,
Saskatchewan47 Soudani et al.
(2012)9 Europe Fontainebleau 48 2 Temperate Fagales 2005–2009** NDVI
Hesse 48 7Fougeres 48 1
48 Tartachnyk andBlanke (2001)
3 Europe Bonn 50�733 7�0833 Temperate Rosales 1997–1999 90 % LF
49 Tateno et al.(2005)
48 Asia Ashui Forest ResearchStation
35�3 135�72 Temperate Cornales 2001 10 % LFEricalesSapindalesAquifolialesApialesmixedFagalesRosalesLamialesMagnolialesLaurales
50 Uddling et al.(2005)
2 Europe Ostad Field Station 57�9 12�4 Temperate Fagales 1997–1998 100 % LF
51 Vitasse et al.(2009)
103 Europe Pyrenees 46 6 Temperate Fagales 2005–2007 50 % CC or LF
Lamiales
Sapindales
52 Waddell et al.(2001)
3 North
America
Sesquicentennial State
Park (high elevation)
34�091 –80�907 Temperate Fagales 1994 50 % LF
Sesquicentennial State
Park (low elevation)
34�091 –80�907
Clemson University 34�132 –80�869
53 Wang et al.(1992)
23 North
America
Mont St. Hilaire Nursery 45�533 –73�133 Temperate Fagales 1988–1989* 50 % LF
Lamiales
Malvales
Rosales
Malpighiales
Sapindales
54 White et al.(1997)
2 NorthAmerica
Hubbard Brook 43�933 –71�67 Temperate Mixed 1991–1992 NDVI
55 Zhang et al.(2011)
4 North
America
Harvard Forest 42�533 –72�183 Temperate Mixed 2001–2004 50 % LF, 50 %
colour change
56 Zhao et al. (2006) 71 Asia Henan MeteorologicalBureau sites
NA NA Temperate Malpighiales 1986–2003 100 % LFFabalesSapindales
CC, colour change, LAI, leaf area index; LF, leaf fall; PAR, photosynthetically acive radiation; NA, not available; NDVI, normalized difference vegetationindex.
Gill et al. — Meta-analysis of autumn senescence in the northern hemisphere 887
Downloaded from https://academic.oup.com/aob/article-abstract/116/6/875/161733by gueston 31 January 2018

APPENDIX 2 PUBLICATIONS INCLUDED IN
CHANGE IN SENESCENCE ANALYSIS
(*) indicates that the slope was calculated based on >5 yearsof DOS data reported in the study, and (**) indicates that therange of years for which data are reported is less than the 5
year threshold period, but the study reported senescencechange in d �C–1 across an elevation gradient. All studies wereincluded in the analysis regardless of senescence metric.
No. Paper Observations Continent Biome Order Year range Senescence metric Regression type
1 Barr et al. (2004)* 1 NorthAmerica
Boreal Fagales 1994–2003 PAR transmission plateau Time
2 Chen and Xu (2012) 46 Asia Temperate Rosales 1986–2005 “Almost all leaves fallen” Time andtemperature
3 Chen et al. (2005) 5 Asia Temperate Mixed 1982–1993 NDVI Time4 Chmielewski
and Rotzer. (2005)11 Europe Temperate/boreal Mixed 1969–1998 50 % LF Time
5 Chmielewski et al. (2005) 3 Europe Temperate Sapindales 1961–2000 50 % CC TimeFagales
6 Dragoni et al. (2011) 3 NorthAmerica
Temperate Mixed 1998–2008 0 % LAI Time
7 Dragoni andRahman (2012)
9 NorthAmerica
Temperate Mixed 1989–2008 NDVI Time
8 Ibanez et al. (2010) 183 Asia Temperate Ginkgoales 1953–2005 80 % LF TimeRosales
9 Juknys et al. (2012a) 3 Europe Temperate Sapindales 1956–2010 50 % LF TimeFagalesMalvales
10 Juknys et al. (2012b) 2 Europe Temperate Fagales 1956–2010 50 % LF TemperatureMalvales
11 Kozlov and Berlina (2002)* 1 Europe Boreal mixed 1931–1941,1946–1952,1957–1998
‘Begininning of leaf fall’ Time
12 Kunz and Blanke (2011) 1 Europe Temperate Rosales 1958–2008 50 % LF Time13 Lee et al. (2003)* 11 North
AmericaTemperate Rosales 1991–1998 50 % LF Time
SapindalesLamialesFagales
14 Matsumoto (2010) 55 Asia Temperate Ginkgoales 1961–2000 80 % LF Temperature15 Menzel et al. (2001) 4 Europe Temperate Sapindales 1951–1996 Start of CC Time
Fagales16 Menzel et al. (2006) 1 Europe Temperate mixed 1971–2000 50 % CC Time and
temperature17 Nicolai (2010)* 1 Europe Temperate Fabales 2002–2009 Start of LF Time18 Pudas et al. (2008) 3 Europe Boreal Fagales 1997–2006 50 % colour change Time and
temperature19 Richardson et al. (2006) 1 North
AmericaTemperate Sapindales 1957–2004 Photo greenness index Time
20 Vitasse et al. (2009) 2 Europe Temperate Fagales 2005–2007** 50 % CCor LF
Temperature
21 Zhao et al. (2006)* 4 Europe Temperate Sapindales 1986–2003 100% LF TimeMalpighialesFabales
LAI, leaf area index; LF, leaf fall; PAR, photosnthetically acive radiation; NDVI, normalized difference vegetation index.
888 Gill et al. — Meta-analysis of autumn senescence in the northern hemisphere
Downloaded from https://academic.oup.com/aob/article-abstract/116/6/875/161733by gueston 31 January 2018