a method for simultaneous linear optics and coupling ... trade name, trademark, manufacturer, or...
TRANSCRIPT

BNL-112293-2016-JA
A method for simultaneous linear optics and coupling correction for storage rings
with turn-by-turn beam position monitor data
Xi Yanga, Xiaobiao Huangb a Brookhaven National Laboratory b SLAC National Accelerator Laboratory
May 2016
National Synchrotron Light Source II Energy & Photon Sciences Directorate
Brookhaven National Laboratory
U.S. Department of Energy DOE, Office of Science
Notice: This manuscript has been authored by employees of Brookhaven Science Associates, LLC under Contract No. DE-SC0012704 with the U.S. Department of Energy. The publisher by accepting the manuscript for publication acknowledges that the United States Government retains a non-exclusive, paid-up, irrevocable, world-wide license to publish or reproduce the published form of this manuscript, or allow others to do so, for United States Government purposes.

DISCLAIMER
This report was prepared as an account of work sponsored by an agency of the United States Government. Neither the United States Government nor any agency thereof, nor any of their employees, nor any of their contractors, subcontractors, or their employees, makes any warranty, express or implied, or assumes any legal liability or responsibility for the accuracy, completeness, or any third party’s use or the results of such use of any information, apparatus, product, or process disclosed, or represents that its use would not infringe privately owned rights. Reference herein to any specific commercial product, process, or service by trade name, trademark, manufacturer, or otherwise, does not necessarily constitute or imply its endorsement, recommendation, or favoring by the United States Government or any agency thereof or its contractors or subcontractors. The views and opinions of authors expressed herein do not necessarily state or reflect those of the United States Government or any agency thereof.

K
O
T
B
n CorrE-m
A method for simultaneous linear optics and coupling correction forstorage rings with turn-by-turn beam position monitor data
Xi Yang a, Xiaobiao Huang b,n
a Brookhaven National Laboratory, Upton, Long Island, NY 11973, USAb SLAC National Accelerator Laboratory, 2575 Sand Hill Road, Menlo Park, CA 94025, USA
eywords:
ptics correction
urn-by-turn
PM
esponding author.ail address: [email protected] (X. Hu
a b s t r a c t
We propose a method to simultaneously correct linear optics errors and linear coupling for storage ringsusing turn-by-turn (TbT) beam position monitor (BPM) data. The independent component analysis (ICA)method is used to isolate the betatron normal modes from the measured TbT BPM data. The betatronamplitudes and phase advances of the projections of the normal modes on the horizontal and verticalplanes are then extracted, which, combined with dispersion measurement, are used to fit the latticemodel. The fitting results are used for lattice correction. The method has been successfully demonstratedon the NSLS-II storage ring.
1. Introduction
Linear optics correction has crucial importance in the operationof a storage ring accelerator. There are many error sources thatcontribute to deviations of the storage ring optics from the idealmodel. These include systematic and random errors of quadrupolecomponents of all magnets, feeddown from horizontal orbit offsetsin sextupole magnets, and perturbations due to insertion devices.Linear optics errors usually degrade the nonlinear dynamics per-formance of the storage ring, causing a reduction of dynamicaperture and momentum aperture. Linear optics errors can becorrected with adjustments to the strengths of quadrupole mag-nets. Correction of linear optics often lead to improvements ofinjection efficiency and/or Touschek lifetime [1]. It may also benecessary to correct the linear optics in order to deliver certainbeam parameters to facilitate user experiments, beam diagnostics,or machine protection. For example, accurate beta functions maybe required at certain locations of the ring, or an accurate phaseadvance may be required between two storage ring components.
Linear coupling between the horizontal and vertical planes andspurious vertical dispersion are other types of common errors in astorage ring that need to be controlled. Linear coupling can becaused by skew quadrupole components of magnets throughmagnet errors, rolls of quadrupoles, and vertical orbit offset insextupole magnets. Spurious vertical dispersion can be caused byvertical steering magnets and coupling of the horizontal
ang).
dispersion through skew quadrupole components in dispersiveregions. Both linear coupling and spurious vertical dispersioncontribute to the vertical emittance and both can be correctedwith skew quadrupoles. The reduction of vertical emittancethrough linear coupling and spurious vertical dispersion correc-tion is often referred to as “coupling correction”.
Linear optics and coupling correction for storage rings is typi-cally done with orbit response matrix based methods (e.g., LOCO(linear optics from closed orbit) [1], used in this paper). By fittingquadrupole and skew quadrupole variables in the lattice model tothe measured orbit response matrix and dispersion data, LOCOfinds a set of magnet errors that can give rise to the observedlattice errors. Correcting the magnet errors in the machine thenleads to improved linear optics and reduced coupling error.
In recent years turn-by-turn (TbT) BPMs have become widelyused in storage rings. TbT BPMs not only detect the closed orbit,but also the orbit of a beam in coherent oscillation. From the latterbetatron amplitudes and phase advances can be derived [2–4],which in turn can be used for optics correction [4–8]. TbT BPMdata also contain linear coupling information and can be used forcoupling correction. Methods based on the correction of globaland/or local linear coupling resonance driving term were pre-viously proposed or carried out by several authors [9–13]. Typi-cally these methods require linear optics correction beforehand inorder to obtain an accurate optics model as needed for couplingcorrection. Ref. [14] proposed a method that could be used to si-multaneously correct linear optics and coupling. One disadvantageof this method is that the BPM errors of the first two BPMs pro-pagate downstream and may affect the fitting results. The ex-tended section by section technique (SBST) developed at LHC can

98
be used for optics and coupling correction [15]. The extended SBSTmethod has not been used on storage ring light sources, probablybecause of its relative complexity as compared to the LOCOmethod.
In this paper we propose and experimentally demonstrate anew method to simultaneously correct linear optics and coupling.The independent component analysis (ICA) method is first appliedto extract the amplitudes and phases of the projection of thenormal modes on the horizontal and vertical BPMs [4], which arethen compared to their model generated counterparts in fitting.The fitting scheme is similar to LOCO. Since closed orbit responseand coherent orbit oscillation sample the optics and coupling er-rors of the machine in a similar fashion, it is expected the per-formance of this method would be similar to that of LOCO. How-ever, the TbT BPM data based method has a great advantage in thatdata taking is significantly faster than LOCO. The time for takingorbit response matrix data may vary from 10–100 min for differentmachines, while TbT BPM data taking takes only a few seconds.Simulation results for our new method were previously reportedin Ref. [16].
In the following we first describe the method in Section 2. Adiscussion of simulation results is in Section 3. Experimental re-sults on the National Synchrotron Light Source-II (NSLS-II) storagering are presented in Section 4. Conclusion is given in Section 5.
2. Optics and coupling correction with ICA
Betatron motion with linear coupling can be decoupled intotwo normal modes [17,18]. In general, the beam motion observedby a BPM on any of the two transverse planes has components ofboth normal modes. Normally the two modes have different be-tatron tunes and hence can be separated with the ICA methodwhen TbT BPM data from BPMs around the ring are analyzed to-gether [4]. In the ICA process, BPM noise is reduced and othercomponents of beam motion, such as synchrotron motion andnonlinear resonance terms, are isolated from the betatron motion.Therefore, the resulting betatron components have high accuracy.
Each betatron normal mode corresponds to two orthogonal ICAmodes. The betatron components on each BPM consist of four ICAmodes, which can be expressed as
Ψ Ψ Ψ Ψ
Ψ Ψ Ψ Ψ
= − + −
= − + − ( )
x A B c d
y a b C D
cos sin cos sin ,
cos sin cos sin , 1
n n n n n
n n n n n
1 1 2 2
1 1 2 2
where xn and yn are observed beam positions on the horizontaland vertical planes at the nth turn, respectively,Ψ πν ψ= +n2n n1 ,2 1,2 1,2, and ν1,2 and ψ1,2 are the tunes and initialphases of the normal modes. The initial phases ψ1,2 are equal for allBPMs. Typically in a storage ring the linear coupling is weak, inwhich case the observed x-motion is dominated by one normalmode and the y-motion by the other. For each transverse plane wecall the dominant mode the primary mode and the other mode thesecondary mode. The tunes of the primary modes are close to theuncoupled tunes for the corresponding planes. For the con-venience of discussion, we refer the horizontal primary mode asnormal mode 1 and the vertical primary mode as normal mode 2.
The linear coupled motion of betatron coordinates= ( ′ ′)X x x y y, , , T at any location of the ring can be predicted with
the one-turn transfer matrix T . Diagonalizing the transfer matrix,one can relate betatron coordinates to normal mode coordinates
Φ
Φ
Φ
Φ
Θ =−
− ( )
⎛
⎝
⎜⎜⎜⎜⎜⎜
⎞
⎠
⎟⎟⎟⎟⎟⎟
J
J
J
J
2 cos
2 sin
2 cos
2 sin 2
1 1
1 1
2 2
2 2
via a transformation Θ=X P , where J1,2 and Φ1,2 are the action andphase variables for the two normal modes, respectively [19]. Inparticular, the position coordinates x and y are given by
Φ Φ Φ
Φ Φ Φ
= + ( − )
= ( − ) + ( )
x p J J p p
y J p p p J
2 cos 2 cos sin ,
2 cos sin 2 cos , 3
11 1 1 2 13 2 14 2
1 31 1 32 1 33 2 2
where the pij coefficients are elements of matrix P and by choice ofthe initial values of phase variables Φ1,2, we have = =p p 012 34[19]. Not considering damping of the coherent motion (e.g., due todecoherence), the action variables are constants of motion. Thephase variables Φ1,2 advances from one location to another and thephase advances for a full turn are πν2 1,2.
Clearly the measured beam motion in Eq. (1) and the modelpredicted motion in Eq. (3) represent the same physical processand are separated in the same form. The amplitudes and phaseadvances of the two normal modes on the two transverse planesin the two equations should be equal. Equating the amplitudes, weobtain
+ = ( )A B J p2 , 42 21 11
+ = + ( )c d J p p2 , 52 22 13
2142
+ = ( )C D J p2 , 62 22 33
+ = + ( )a b J p p2 . 72 21 31
2322
The J1,2 constants can be calculated by averaging the values de-rived from the amplitudes of the primary modes, i.e., using Eqs.(4) and (6). Aside from constant initial phase, the phase advancescan also be equated, leading to
Φ= ( ) ( )π− B
Atan Mod , 8
12 1
Φ= +( )
π− −
⎛⎝⎜
⎞⎠⎟
dc
pp
tan Mod tan ,9
12 2
1 14
13
Φ= +( )
π− −
⎛⎝⎜
⎞⎠⎟
ba
pp
tan Mod tan ,10
12 1
1 32
31
Φ= ( ) ( )π− D
Ctan Mod , 11
12 2
where πMod2 indicates taking modulus of π2 and we have madeuse of the fact that the value of arctangent can be uniquely de-termined within [0, π2 ) when both sine and cosine of an angle isknown.
The phase advances of the normal modes Φ1,2 at the BPMs canbe calculated with the lattice model. The P matrix can be com-puted from the one-turn transfer matrix at the BPM with thenumeric procedure given in Ref. [19] or alternatively with equation

Table 1Selected parameters of NSLS-II.
Parameters Value Unit
Energy 3 GeVCircumference 792.0 m# of periods 30Betatron tunes νx y, 33.22, 16.26
RF frequency frf 499.68 MHz
Momentum compaction αc × −0.36 10 3
99
=P VU, with matrices V , U calculated with formulas given in Ref.[18].
Eqs. (4)–(11) apply at each BPM location. They relate quantitiesmeasured from TbT BPM data to quantities that can be calculatedwith the lattice model. In reality, the actual machine lattice de-viates from the ideal model and there are instrumentation errorsin the measurements. Therefore, Eqs. (4)–(11) are not exactly sa-tisfied. However, one could adjust parameters in the lattice modeland the diagnostics to minimize the differences between themeasurements and the model prediction through a least-squareproblem. Based on these equations, an approach to calibrate thelattice model with TbT BPM data can be developed in a mannersimilar to the LOCO method, except here the input data used aredifferent.
Dispersion function measurements can be done quickly. Theyprovide additional constraints to the lattice model and are them-selves targets to be controlled through optics and coupling cor-rection. Therefore, dispersion functions are also included in theleast-square fitting problem.
Instrumentation errors include BPM gain errors and BPM rolls.For each BPM, the measured beam position is related to actualbeam position via a transformation
=( )
⎜ ⎟ ⎜ ⎟⎛⎝
⎞⎠
⎛⎝
⎞⎠
xy
xyB ,
12meas beam
with
θ θθ θ
=− ( )
⎛⎝⎜⎜
⎞⎠⎟⎟
⎛⎝⎜⎜
⎞⎠⎟⎟
g
gB cos sin
sin cos
0
0 13
x
y
where gx y, and θ being the BPM gains and BPM roll, respectively.Transformation in Eq. (12) is applied to both the transformationmatrix P and the model dispersion functions before they arecompared to the measurements. In LOCO a fourth parameter isincluded in matrix B to describe BPM transformation errors [1].We may do the same in the future in our method.
The objective function to be minimized can be defined as
∑χσ
( ) = = −
( )
⎛⎝⎜
⎞⎠⎟f w
d dq ,
14i kk
ik ik
ik
2
,
meas model 2
where q is a vector that holds all fitting parameters, summationindex i stands for BPM i, k stands for the kth type of data, dik
meas anddik
model are the measured and model values for data, respectively, σik
is the uncertainty level for data point dikmeas, and wk is the weight
factor for data type k. The fitting parameters include horizontaland vertical BPM gains, BPM rolls, quadrupole gradients, and skewquadrupole gradients. For each BPM, the fitting data include theamplitude of the horizontal primary mode (Eq. (4)), the amplitudeof the vertical primary mode (Eq. (6)), the amplitude of the hor-izontal secondary mode (Eq. (5)), the amplitude of the verticalsecondary mode (Eq. (7)), horizontal dispersion, vertical disper-sion, cosine and sine of the phase advance of the horizontal pri-mary mode (Eq. (8)), cosine and sine of the phase advance of thehorizontal secondary mode (Eq. (9)), cosine and sine of the phaseadvance of the vertical primary mode (Eq. (11)), and cosine andsine of the phase advance of the vertical secondary mode (Eq.(10)). The betatron tunes can also be included in the objectivefunction as fitting data. The weight factors are set to 1 by defaultand may be empirically adjusted to change the relative weights ofdifferent types of data. More weight may be given to the phaseterms as they are not affected by BPM calibration. It is also ad-visable not to let contribution of one type of data to dominate χ2.
TbT BPM data and orbit response matrix data sample the linearoptics and coupling of the storage ring in a similar manner, i.e., byperturbing the beam orbit in the transverse phase space area
around the closed orbit. Orbit response matrix data are measuredwith closed orbit, which typically has higher precision than TbTorbit because closed orbit is usually measured by averaging overmany turns. For example, for the NSLS-II storage ring, the noiselevel for closed orbit measurement is ∼0.2 μm and the noise levelfor TbT orbit is ∼1.0 μm. However, in TbT BPM data analysis,hundreds to thousands turns can be used, which statisticallycompensates the loss of precision for single-pass orbit measure-ments. In fact, because the advanced data analysis technique, ICA,is used to extract the betatron modes with data from all BPMswhile filtering out BPM noise and contributions of other physicalprocesses, it is possible that TbT BPM data have a statistical ad-vantage over orbit response matrix data for optics and couplingmeasurements.
It is known that quadrupole strength fitting parameters in astorage ring lattice could have similar patterns in their perturba-tions to the optics and it may be difficult to separate their con-tributions to optics errors through fitting the orbit response matrixdata [20]. The same is true to our TbT data based fitting method.Therefore, the constrained fitting technique proposed for LOCO inRef. [20] should be used here, too. With such a fitting algorithm,the ICA based optics and coupling correction method described inthe above demonstrated high robustness in both simulation andexperiments.
3. Simulation
We have done simulation studies to demonstrate the applic-ability of the proposed method and the results are reported in Ref.[16]. Lattice models for the SPEAR3 and NSLS-II storage rings areused in those studies. Quadrupole and skew quadrupole errors areplanted into the lattice. TbT BPM data are generated by particletracking, adding BPM gain and roll errors, and adding BPM noise.After applying ICA and fitting as described in the previous section,the BPM gain and roll errors are accurately recovered for bothlattice models. The quadrupole and skew quadrupole errors arerecovered for the SPEAR3 lattice. For the NSLS-II lattice, because ofthe degeneracy issue, only an approximately equivalent solution isobtained for the quadrupole and skew quadrupole errors. Theoptics error (beta beat) and coupling (ratio of projected emittanceϵ ϵ/y x) for the fitted lattice are very close to the target lattice, whichindicate the fitted lattice is a good approximation to the latter.
4. Experiments
4.1. Experimental setup and example ICA modes
We applied our ICA based method to the NSLS-II storage ring toexperimentally measure and correct the storage ring optics andcoupling. NSLS-II storage ring is a new third generation storagering light source that has been recently commissioned. A few se-lected parameters of the NSLS-II storage ring are shown in Table 1.

Fig. 1. Rms amplitude of the first 10 leading ICA modes (top) and FFT spectrum thefirst six ICA modes (bottom) from the TbT BPM data of iteration 1. The FFT spectrumis scaled by the rms amplitude for each mode.
Fig. 2. Horizontal (top) and vertical (bottom) dispersion functions measured withrf frequency shift (“use RF”) or from the TbT data through ICA (“from ICA”).
Fig. 3. Top: Phase advances between adjacent BPMs from ICA measurements be-fore corrections (blue) are compared to the ideal model (red). Bottom: Differencesbetween measured and model phase advances between adjacent BPMs beforecorrections. (For interpretation of the references to color in this figure caption, thereader is referred to the web version of this paper.)
100
The storage ring is equipped with 180 BPMs, all of which arecapable of taking turn-by-turn data [21].
In the experiment, errors were initially inserted to the machinelattice by adding small random errors to quadrupole magnetstrengths ( σ ∼Δ
−10K K/4). Coherent motion was excited simulta-
neously on the horizontal and vertical planes with the pingersbefore TbT BPM data were taken. The oscillation amplitudes forBPMs with large beta function values were about 0.2 mm on thehorizontal plane and about 0.3 mm on the vertical plane, respec-tively. Five TbT BPM data sets were taken for each machine con-dition. In addition, dispersion data were taken by shifting the rffrequency by 500 Hz. 1024 turns of BPM data were used for the ICAanalysis. Data from both planes form a 360�1024 matrix. We kept10 leading singular value modes for ICA analysis. The first four ICAmodes are the betatron modes. The fifth mode is the synchrotronmode. The sixth mode shows a slow drift on its temporal patternand its source is unknown. The other modes are mostly within thenoise level. Fig. 1 shows the amplitude (rms values for all BPMs) ofall ten ICA modes and the FFT spectrum of the first six modes.
The spatial pattern of the synchrotron mode (mode 5) is pro-portional to dispersion and can be used to measure the horizontaland vertical dispersion functions. The energy oscillation amplitudeis determined by requiring the horizontal rms dispersion to beequal to the model value, from which the energy oscillation am-plitude was found to be δ = × −0.3 10m
4. The measured synchro-tron tune is ν = 0.00657s . Dispersion functions measured from theTbT data are compared to results from the usual closed orbit basedmethod in Fig. 2. Reasonable agreement is seen for both horizontaland vertical dispersions.
4.2. Optics and coupling before correction
From the spatial patterns of the ICA betatron modes, the
betatron amplitudes and phase advances at the BPMs can be cal-culated [4]. By requiring the average beta functions as derivedfrom the primary modes at the BPMs to be equal to the values ofthe ideal model, we can obtain the action variables of the coherentmotion for the horizontal and vertical planes. For the initial dataset, the action variables are = × −J 1.41 10 m1
9 and= × −J 2.82 10 m2
9 and the fractional betatron tunes obtained fromthe corresponding temporal patterns are ν = 0.2048x andν = 0.2513y , respectively. Phase advances of the normal modes canbe measured from the amplitudes of the corresponding ICAmodes, using Eqs. (8) and (10). The measured phase advancesbetween adjacent BPMs are compared to the model values inFig. 3.
The ratio of the amplitudes of the projected motion of a normalmode onto the two transverse planes is a measure of the local

Fig. 4. Amplitude ratios r1 (blue) and r2 (red) of the projected motion onto the twotransverse planes for the two normal modes, as defined in Eq. (15), for TbT databefore corrections. (For interpretation of the references to color in this figurecaption, the reader is referred to the web version of this paper.)
Fig. 6. Comparison of ratios of projected vertical emittance over horizontal emit-tance for lattices fitted by TbT data (“ICA”) and LOCO before corrections.
101
coupling. From Eqs. (4)–(7), we can define
= ++
=+
= ++
=+
( )
ra b
A B
p p
p
rc d
C D
p p
p
,
.15
1
2 2
2 2
312
322
11
2
2 2
2 2
132
142
33
The amplitude ratio for the two normal modes at all BPMs areshown in Fig. 4.
The ICA results are used for lattice model fitting as described inSection 2. The fitting parameters are horizontal gains, verticalgains, and rolls for all 180 BPMs, 150 quadrupole parameters, and30 skew quadrupole parameters. The quadrupole and skewquadrupole parameters are the same as the LOCO setup for NSLS-II[22]. The normalizing sigmas in Eq. (14) are set to −0.05 m 1/2 forthe betatron amplitudes, 0.005 m for dispersion functions,0.005 rad for phase advances of the primary modes, and 0.02 radfor phase advances of the secondary modes. Constraints are addedto all fitting parameters with the cost function proportional to the2-norm of the corresponding column of the Jacobian matrix ofeach fitting parameter. χ2 normalized by the degree of freedomdropped from 140.9 to 1.8 in two fitting iterations for the first TbTdata set.
Orbit response matrix data were also taken during the ex-periment under the same machine condition. The data were fittedfor three iterations. The results are compared to the ICA fittingresults. The optics of the fitted lattices are compared in Fig. 5.There was excellent agreement between ICA and LOCO in the
Fig. 5. Comparison of beta beating of lattices fitted by TbT data (“ICA”) and LOCO forhorizontal (top) and vertical (bottom) beta functions before corrections.
distribution of beta beating, which clearly verifies that the twofitted lattices are nearly equivalent. Fig. 6 shows the distribution ofthe projected vertical emittance (normalized by the horizontalemittance) for the two fitted latices. Although not all details agree,the average emittance ratios are nearly the same.
The fitted lattice parameters for ICA fitting and LOCO arecompared in Fig. 7. Good agreement was seen for quadrupolevariables 1–60 (QL1 and QL2) and 121–150 (QM2). But the fittederrors of quadrupole variables 61–120 (QH1 and QH2) for LOCOare larger. Since the fitted optics of the two methods are equiva-lent (see Fig. 5), the differences in the fitted quadrupole errorsindicate the cost functions for these variables in the LOCO setupneed to be increased. The error bars for the ICA fitting method inFig. 5 are derived from the fitting results of the five TbT data setsunder the same condition.
Fig. 7. Comparison of fitted quadrupole variables (top) and skew quadrupolevariables (bottom) for lattices fitted by TbT data (“ICA”) and LOCO for iteration 1.
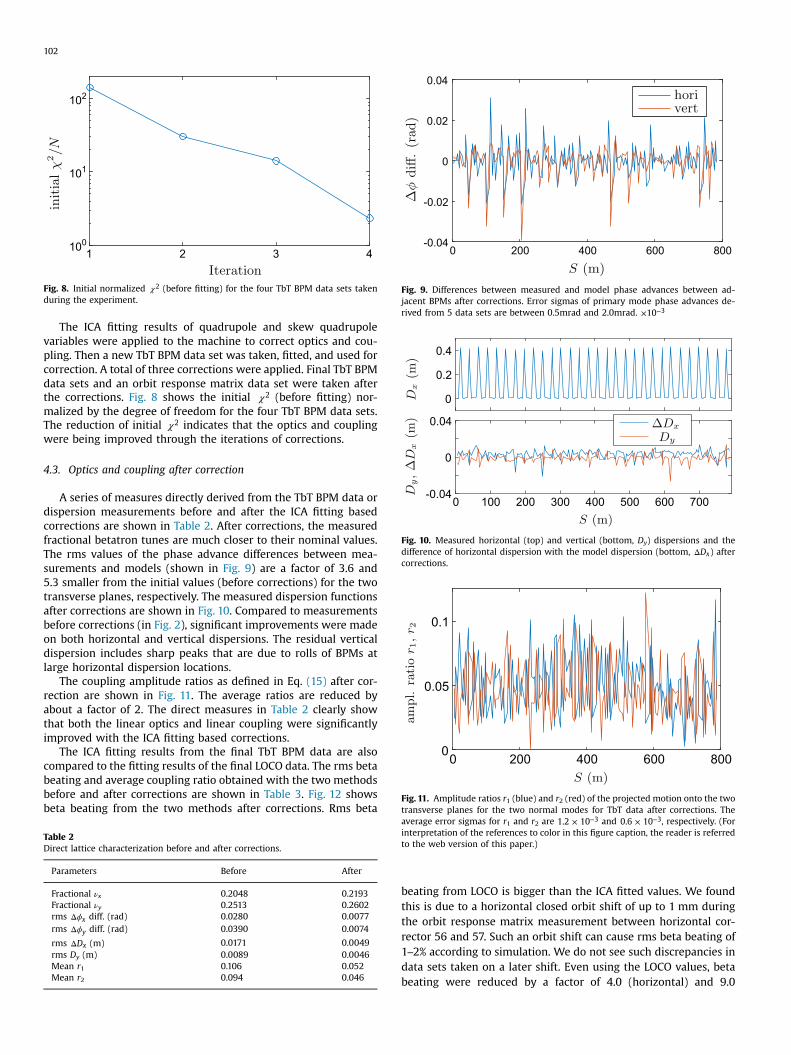
Fig. 8. Initial normalized χ2 (before fitting) for the four TbT BPM data sets takenduring the experiment.
Fig. 9. Differences between measured and model phase advances between ad-jacent BPMs after corrections. Error sigmas of primary mode phase advances de-rived from 5 data sets are between 0.5mrad and 2.0mrad. × −10 3
Fig. 10. Measured horizontal (top) and vertical (bottom, Dy) dispersions and thedifference of horizontal dispersion with the model dispersion (bottom, ΔDx) aftercorrections.
Fig. 11. Amplitude ratios r1 (blue) and r2 (red) of the projected motion onto the twotransverse planes for the two normal modes for TbT data after corrections. The
102
The ICA fitting results of quadrupole and skew quadrupolevariables were applied to the machine to correct optics and cou-pling. Then a new TbT BPM data set was taken, fitted, and used forcorrection. A total of three corrections were applied. Final TbT BPMdata sets and an orbit response matrix data set were taken afterthe corrections. Fig. 8 shows the initial χ2 (before fitting) nor-malized by the degree of freedom for the four TbT BPM data sets.The reduction of initial χ2 indicates that the optics and couplingwere being improved through the iterations of corrections.
4.3. Optics and coupling after correction
A series of measures directly derived from the TbT BPM data ordispersion measurements before and after the ICA fitting basedcorrections are shown in Table 2. After corrections, the measuredfractional betatron tunes are much closer to their nominal values.The rms values of the phase advance differences between mea-surements and models (shown in Fig. 9) are a factor of 3.6 and5.3 smaller from the initial values (before corrections) for the twotransverse planes, respectively. The measured dispersion functionsafter corrections are shown in Fig. 10. Compared to measurementsbefore corrections (in Fig. 2), significant improvements were madeon both horizontal and vertical dispersions. The residual verticaldispersion includes sharp peaks that are due to rolls of BPMs atlarge horizontal dispersion locations.
The coupling amplitude ratios as defined in Eq. (15) after cor-rection are shown in Fig. 11. The average ratios are reduced byabout a factor of 2. The direct measures in Table 2 clearly showthat both the linear optics and linear coupling were significantlyimproved with the ICA fitting based corrections.
The ICA fitting results from the final TbT BPM data are alsocompared to the fitting results of the final LOCO data. The rms betabeating and average coupling ratio obtained with the two methodsbefore and after corrections are shown in Table 3. Fig. 12 showsbeta beating from the two methods after corrections. Rms beta
Table 2Direct lattice characterization before and after corrections.
Parameters Before After
Fractional νx 0.2048 0.2193Fractional νy 0.2513 0.2602rms ϕΔ x diff. (rad) 0.0280 0.0077rms ϕΔ y diff. (rad) 0.0390 0.0074
rms ΔDx (m) 0.0171 0.0049rms Dy (m) 0.0089 0.0046Mean r1 0.106 0.052Mean r2 0.094 0.046
average error sigmas for r1 and r2 are × −1.2 10 3 and × −0.6 10 3, respectively. (Forinterpretation of the references to color in this figure caption, the reader is referredto the web version of this paper.)
beating from LOCO is bigger than the ICA fitted values. We foundthis is due to a horizontal closed orbit shift of up to 1 mm duringthe orbit response matrix measurement between horizontal cor-rector 56 and 57. Such an orbit shift can cause rms beta beating of1–2% according to simulation. We do not see such discrepancies indata sets taken on a later shift. Even using the LOCO values, betabeating were reduced by a factor of 4.0 (horizontal) and 9.0

Table 3Fitted lattice parameters by ICA and LOCO before and after corrections.
Parameters Before After
ICA LOCO ICA LOCO
rms β βΔ /x x 0.0678 0.0780 0.0051 0.0194
rms β βΔ /y y 0.0937 0.0991 0.0038 0.0110
rms ΔDx 0.0167 0.0227 0.0056 0.0045rms ΔDy 0.0080 0.0085 0.0030 0.0046
Mean ϵ ϵ/y x 0.0147 0.0129 0.0027 0.0031
Fig. 12. Comparison of beta beating of lattices fitted by TbT data (“ICA”) and LOCOfor horizontal (top) and vertical (bottom) beta functions after corrections. The fittederrors in LOCO is partially due to an orbit shift of up to 1 mm during the orbitresponse matrix measurement.
Fig. 13. Comparison of ratios of projected vertical emittance over horizontalemittance for lattices fitted by TbT data (“ICA”) and LOCO after corrections.
Fig. 14. Comparison of fitted BPM gains by TbT data (“ICA”) and LOCO for horizontal(top) and vertical (bottom) BPMs after corrections.
103
(vertical), respectively. Coupling ratios of the fitted lattices arecompared in Fig. 13. The reduction of coupling ratio is a factor of5.5 according to ICA fitting and 4.2 according to LOCO.
In Fig. 14 we show a comparison of fitted BPM gains for the twomethods. At many locations the fitted gains of the two methodsagree. But there are discrepancies at some locations. The BPMgains fitted with the TbT data could be more susceptible to noiseor coupling with optics errors. A good practice may be to use fixedBPM gains obtained with LOCO in the ICA fitting method.
5. Conclusion
We propose a method to use turn-by-turn (TbT) BPM data tosimultaneously correct linear optics and linear coupling for
circular accelerators. The independent component analysis (ICA) isapplied to extract the betatron normal modes and their projectionon the two transverse planes [4]. The betatron amplitudes andphase advances of the projected modes are fitted to the latticemodel. Linear optics and coupling of the machine can be calculatedwith the fitted model. Correction is made by reversing the fittederrors of the quadrupole and skew quadrupole variables.
This new method has been successfully demonstrated on theNSLS-II storage ring. In the experiment we reduced rms beta beatfrom 7.8% (horizontal) and 9.9% (vertical) to 1.9% (horizontal) and1.1% for the two transverse planes, respectively, using LOCO resultsas references. The coupling ratio was reduced from 1.3% to 0.3%.
Because TbT can be taken within seconds and with little per-turbation to the stored beam (in our experiment coherent oscil-lation amplitude is below 0.3 mm), this method has a great ad-vantage over the orbit response matrix based method, LOCO [1].For storage ring machines, this method may be used to check andcorrect optics during operation using data taken with injectiontransients. It may also improve efficiency for machine startup andmachine studies as less time is needed for lattice correction.
Acknowledgment
We thank Yongjun Li for preparing the initial condition of themachine for the experiment. We thank James Safranek for readingthe manuscript. Author X. Yang thanks Victor Smalyuk for manyuseful discussions. The study is supported by U.S. DOE underContract No. DE-AC02–98CH10886 (BNL) and Contract No. DE-AC02–76SF00515 (SLAC).
References
[1] J. Safranek, Experimental determination of storage ring optics using orbit re-sponse measurements, Nucl. Instrum. Methods Phys. Res. Sect. A: Accel.Spectrom. Detect. Assoc. Equip. 388 (1–2) (1997) 27–36, http://dx.doi.org/10.1016/S0168–9002(97)00309–4, URL ⟨http://www.sciencedirect.com/science/article/pii/S0168900297003094⟩.
[2] P. Castro, et al., in: Proceedings of PAC93, Washington, D.C., 1993, p. 2103.[3] C.-x. Wang, V. Sajaev, C.-Y. Yao, Phase advance and β function measurements
using model-independent analysis, Phys. Rev. ST Accel. Beams 6 (2003)104001, http://dx.doi.org/10.1103/PhysRevSTAB.6.104001.
[4] X. Huang, S.Y. Lee, E. Prebys, R. Tomlin, Application of independent componentanalysis to Fermilab Booster, Phys. Rev. ST Accel. Beams 8 (2005) 064001, http://dx.doi.org/10.1103/PhysRevSTAB.8.064001.
[5] M. Aiba, S. Fartoukh, A. Franchi, M. Giovannozzi, V. Kain, M. Lamont, R. Tomás,G. Vanbavinckhove, J. Wenninger, F. Zimmermann, R. Calaga, A. Morita, First β-beating measurement and optics analysis for the CERN large hadron collider,Phys. Rev. ST Accel. Beams 12 (2009) 081002, http://dx.doi.org/10.1103/PhysRevSTAB.12.081002.
[6] X. Shen, S.Y. Lee, M. Bai, S. White, G. Robert-Demolaize, Y. Luo, A. Marusic,R. Tomás, Application of independent component analysis to ac dipole based

104
optics measurement and correction at the relativistic heavy ion collider, Phys.Rev. ST Accel. Beams 16 (2013) 111001, http://dx.doi.org/10.1103/PhysRevSTAB.16.111001.
[7] M. Aiba, M. Böge, J. Chrin, N. Milas, T. Schilcher, A. Streun, Comparison of linearoptics measurement and correction methods at the swiss light source, Phys. Rev.ST Accel. Beams 16 (2013) 012802, http://dx.doi.org/10.1103/PhysRevSTAB.16.012802.
[8] M. Carla, et al., in: Proceedings of IPAC2015, Richmond, VA, USA, 2015, p. 1686.[9] J. Bengtsson, CERN 88–05, 1988.[10] R. Tomás (Ph.D. thesis), University of Valencia, January 2003.[11] M. Benedikt, F. Schmidt, R. Tomás, P. Urschütz, A. Faus-Golfe, Driving term
experiments at CERN, Phys. Rev. ST Accel. Beams 10 (2007) 034002, http://dx.doi.org/10.1103/PhysRevSTAB.10.034002.
[12] F. Wang, S.Y. Lee, Vertical emittance correction with independent componentanalysis method, Phys. Rev. ST Accel. Beams 11 (2008) 050701, http://dx.doi.org/10.1103/PhysRevSTAB.11.050701.
[13] A. Franchi, L. Farvacque, J. Chavanne, F. Ewald, B. Nash, K. Scheidt, R. Tomás,Vertical emittance reduction and preservation in electron storage rings viaresonance driving terms correction, Phys. Rev. ST Accel. Beams 14 (2011)034002, http://dx.doi.org/10.1103/PhysRevSTAB.14.034002.
[14] X. Huang, J. Sebek, D. Martin, Lattice modeling and calibration with turn-by-
turn orbit data, Phys. Rev. ST Accel. Beams 13 (2010) 114002, http://dx.doi.org/10.1103/PhysRevSTAB.13.114002.
[15] R. Tomás, O. Brüning, M. Giovannozzi, P. Hagen, M. Lamont, F. Schmidt,G. Vanbavinckhove, M. Aiba, R. Calaga, R. Miyamoto, CERN large hadron col-lider optics model, measurements, and corrections, Phys. Rev. ST Accel. Beams13 (2010) 121004, http://dx.doi.org/10.1103/PhysRevSTAB.13.121004.
[16] X. Huang, X. Yang, Linear optics and coupling correction with turn-by-turnBPM data, in: Proceedings of IPAC15, Richmond, VA, 2015, p. 698.
[17] D. Edwards, L. Teng, IEEE Trans. Nucl. Sci. 20 (1973) 3.[18] D. Sagan, D. Rubin, Linear analysis of coupled lattices, Phys. Rev. ST Accel.
Beams 2 (1999) 074001, http://dx.doi.org/10.1103/PhysRevSTAB.2.074001.[19] Y. Luo, Linear coupling parametrization in the action-angle frame, Phys. Rev. ST
Accel. Beams 7 (2004) 124001, http://dx.doi.org/10.1103/PhysRevSTAB.7.124001.[20] X. Huang, J. Safranek, G. Portmann, Loco with constraints and improved fitting
technique, ICFA Newslett. 44 (2007) 60, URL ⟨http://www.slac.stanford.edu/cgi-wrap/getdoc/slac-pub-13686.pdf⟩.
[21] K. Vetter, et al., NSLS-II RF beam position monitor, in: Proceedings of BIW10,Santa Fe, NM, 2010, p. 205.
[22] X. Yang, X. Huang, J. Safranek, Loco application to NSLS2 storage ring disper-sion and beta beating correction, in: Proceedings of IPAC15, Richmond, VA,2015, p. 1989.