a method to decipher pleiotropy by detecting underlying ... · rheumatoid arthritis (ra; p < 1...
TRANSCRIPT

©20
16N
atur
e A
mer
ica,
Inc.
All
righ
ts r
eser
ved.
NATURE GENETICS ADVANCE ONLINE PUBLICATION 1
T E C H N I C A L R E P O RT S
There is growing evidence of shared risk alleles for complex traits (pleiotropy), including autoimmune and neuropsychiatric diseases. This might be due to sharing among all individuals (whole-group pleiotropy) or a subset of individuals in a genetically heterogeneous cohort (subgroup heterogeneity). Here we describe the use of a well-powered statistic, BUHMBOX, to distinguish between those two situations using genotype data. We observed a shared genetic basis for 11 autoimmune diseases and type 1 diabetes (T1D; P < 1 × 10⁻⁴) and for 11 autoimmune diseases and rheumatoid arthritis (RA; P < 1 × 10⁻³). This sharing was not explained by subgroup heterogeneity (corrected PBUHMBOX > 0.2; 6,670 T1D cases and 7,279 RA cases). Genetic sharing between seronegative and seropostive RA (P < 1 × 10⁻⁹) had significant evidence of subgroup heterogeneity, suggesting a subgroup of seropositive-like cases within seronegative cases (PBUHMBOX = 0.008; 2,406 seronegative RA cases). We also observed a shared genetic basis for major depressive disorder (MDD) and schizophrenia (P < 1 × 10⁻⁴) that was not explained by subgroup heterogeneity (PBUHMBOX = 0.28; 9,238 MDD cases).
Recent studies have demonstrated that many diseases have risk alleles in common1–4 and exhibit significant coheritability5–7. Coheritability studies are defining the relationship between complex traits and pro-viding new insights into disease mechanisms. As more phenotypes are studied using genetics in the context of emerging deeply pheno-typed population-wide cohorts8, including the Precision Medicine Initiative9, coheritability of traits will become even more apparent. In the genomics era, methods for detecting coheritability have moved beyond traditional approaches such as twin or family studies10,11. Now, alternative approaches using genome-wide association study (GWAS) data from unrelated individuals are widely used. Polygenic risk score approaches3,12,13 build genetic risk scores (GRSs) for one phenotype and test the association of those GRSs with a second phe-notype. Mixed-model approaches5,6,14 can be used to estimate the genetic covariance of two traits on the observed scale. Genetic covari-ance can be used to calculate genetic correlation and coheritability6. Cross-trait linkage disequilibrium score regression (LDSC) uses link-age disequilibrium (LD) and summary statistics obtained from GWAS to estimate the genetic correlation attributable to SNPs7. In addition, the P values of independent SNPs associated with multiple phenotypes can be tested for a significant deviation from the null distribution2.
A method to decipher pleiotropy by detecting underlying heterogeneity driven by hidden subgroups applied to autoimmune and neuropsychiatric diseasesBuhm Han1–4,25, Jennie G Pouget1,5–7,25, Kamil Slowikowski1,3,4,8, Eli Stahl9, Cue Hyunkyu Lee10, Dorothee Diogo1,3,4, Xinli Hu1,3,4,11, Yu Rang Park10,12, Eunji Kim10,13, Peter K Gregersen14, Solbritt Rantapää Dahlqvist15, Jane Worthington16,17, Javier Martin18, Steve Eyre16,17, Lars Klareskog19, Tom Huizinga20, Wei-Min Chen21, Suna Onengut-Gumuscu21, Stephen S Rich21, Major Depressive Disorder Working Group of the Psychiatric Genomics Consortium22, Naomi R Wray23 & Soumya Raychaudhuri1,3,4,19,24
1Department of Medicine, Brigham and Women’s Hospital and Harvard Medical School, Boston, Massachusetts, USA. 2Department of Convergence Medicine, University of Ulsan College of Medicine and Asan Institute for Life Sciences, Asan Medical Center, Seoul, Republic of Korea. 3Program in Medical and Population Genetics, Broad Institute of MIT and Harvard, Cambridge, Massachusetts, USA. 4Partners Center for Personalized Genetic Medicine, Boston, Massachusetts, USA. 5Campbell Family Mental Health Research Institute, Centre for Addiction and Mental Health, Toronto, Ontario, Canada. 6Institute of Medical Science, University of Toronto, Toronto, Ontario, Canada. 7Department of Psychiatry, University of Toronto, Toronto, Ontario, Canada. 8Bioinformatics and Integrative Genomics, Harvard University, Cambridge, Massachusetts, USA. 9Department of Psychiatry, Mount Sinai School of Medicine, New York, New York, USA. 10Asan Institute for Life Sciences, University of Ulsan College of Medicine, Asan Medical Center, Seoul, Republic of Korea. 11Harvard–MIT Division of Health Sciences and Technology, Boston, Massachusetts, USA. 12Department of Biomedical Informatics, Asan Medical Center, Seoul, Republic of Korea. 13Department of Chemistry, Seoul National University, Seoul, Republic of Korea. 14Robert S. Boas Center for Genomics and Human Genetics, Feinstein Institute for Medical Research, Manhasset, New York, USA. 15Department of Public Health and Clinical Medicine, Rheumatology, Umeå University, Umeå, Sweden. 16Arthritis Research UK Centre for Genetics and Genomics, Musculoskeletal Research Centre, Institute for Inflammation and Repair, Manchester Academic Health Science Centre, University of Manchester, Manchester, UK. 17National Institute for Health Research, Manchester Musculoskeletal Biomedical Research Unit, Central Manchester University Hospitals National Health Service Foundation Trust, Manchester Academic Health Sciences Centre, Manchester, UK. 18Instituto de Parasitología y Biomedicina López-Neyra, Consejo Superior de Investigaciones Científicas, Granada, Spain. 19Rheumatology Unit, Department of Medicine, Karolinska Institutet and Karolinska University Hospital Solna, Stockholm, Sweden. 20Department of Rheumatology, Leiden University Medical Centre, Leiden, the Netherlands. 21Center for Public Health Genomics, University of Virginia, Charlottesville, Virginia, USA. 22A full list of members and affiliations appears in the Supplementary Note. 23Queensland Brain Institute, University of Queensland, Brisbane, Queensland, Australia. 24Institute of Inflammation and Repair, University of Manchester, Manchester, UK. 25These authors contributed equally to this work. Correspondence should be addressed to S.R. ([email protected]) or B.H. ([email protected]).
Received 29 October 2015; accepted 22 April 2016; published online 16 May 2016; doi:10.1038/ng.3572

©20
16N
atur
e A
mer
ica,
Inc.
All
righ
ts r
eser
ved.
2 ADVANCE ONLINE PUBLICATION NATURE GENETICS
T E C H N I C A L R E P O RT S
These approaches have been applied to demonstrate significant shared genetic structure among many phenotypes5,7,15, including autoim-mune2 and neuropsychiatric diseases3,6,13. The observed coheritability and genetic sharing suggest the possibility of pleiotropy, defined here as the sharing of risk alleles across traits at specific loci or at a genome-wide level. An example of a variant showing pleiotropy is the PTPN22 variant encoding p.Arg620Trp, which is associated with multiple autoimmune diseases16.
The sharing of risk alleles across diseases can be driven by all individuals or by a subset of individuals. In the former scenario, the sharing is clearly driven by pleiotropy (whole-group pleiotropy). In the latter scenario, only a subset of individuals with one disease is genetically similar to individuals with another disease. We call this subgroup heterogeneity, a situation where a patient cohort consists of genetically distinct subgroups that may or may not have distinct symptom profiles and treatment outcomes. Subgroup heterogeneity can occur in the context of misclassifications (for example, when cases with atypical clinical presentations for a different disease are erroneously included), molecular subtypes (for example, when two different etiologies underlie a disease, resulting in a subset of cases that share pathogenesis with a different disease), asymmetric causal relationships (for example, when one disease causes another dis-ease, resulting in a subset of cases that also have the causal disease; often called mediated pleiotropy), or ascertainment bias (for exam-ple, when cases also affected with a different disease are more likely to come to clinical attention and be included in the study). Such situations result in a subset of cases that is genetically similar to individuals with another disease, creating shared genetic structure17. Indeed, there is now evidence that misclassifications18–21, etiologi-cal diversity22, and ascertainment bias23 are prevalent across certain human diseases, leading to the conclusion that significant heteroge-neity may exist24–27. Because the potential contribution of subgroup heterogeneity to any genetic sharing observed between diseases represents a critical disease insight, statistical methods are needed
to distinguish subgroup heterogeneity from whole-group pleiot-ropy. For the purposes of this paper, we will use the term ‘pleiotropy’ to refer to whole-group pleiotropy and ‘heterogeneity’ to refer to subgroup heterogeneity.
RESULTSOverview of BUHMBOXGenetic sharing between disease A (DA) and disease B (DB) could be due to pleiotropy but could also be due to heterogeneity (that is, where a subset of DA cases are genetically more similar to DB cases). If we calculated GRSs for DA cases using DB-associated loci and their effect sizes (GRSB), the mean of GRSB would be statistically different between DA cases and controls under either pleiotropy or heterogene-ity. Under pleiotropy, some DB risk alleles impose risk of DA, and DB risk alleles will be enriched in DA cases compared to controls. Under heterogeneity, a subset of DA cases will have genetic characteristics of DB, and therefore DB risk alleles will also be enriched in these individuals. In both situations, the enrichment of DB risk alleles in DA cases will result in an increased mean GRSB in individuals that are DA cases. For the same reasons, if we calculated the genetic correla-tion (rg) of DA and DB using cross-trait LDSC7 in this scenario, the rg would be positive under both pleiotropy and heterogeneity.
To detect heterogeneity, even in the presence of pleiotropy, we developed BUHMBOX (Breaking Up Heterogeneous Mixture Based On cross(X)-locus correlations). Our method tests for the presence of heterogeneous subgroups (that is, DB-like cases) in an otherwise homogeneous phenotype (that is, DA). To do this, BUHMBOX requires (i) a list of known DB-associated SNPs with corresponding risk alleles, risk allele frequencies (RAFs), and effect sizes and (ii) individual-level genotype data for DB SNPs in DA cases. BUHMBOX leverages the fact that, in the setting of heterogeneity, DB risk alleles have higher allele frequencies only in a specific subset of DA cases. In contrast, under true pleiotropy, DB risk alleles are expected to have higher allele frequencies across all DA cases (Fig. 1). If DB risk alleles are enriched
in one subgroup, the expected correlations of risk allele dosages between loci will be con-sistently positive (Supplementary Table 1 and Supplementary Note). BUHMBOX com-bines these pairwise correlations into one statistic and tests for excessive positive corre-lations. Heterogeneity can lead to a significant BUHMBOX test statistic. In contrast, a lack of true heterogeneity or insufficient power to detect the presence of heterogeneity (type II error) can lead to a nonsignificant BUHMBOX test statistic. Insufficient power occurs when the number of DA cases, heterogeneity propor-tion, or number of known risk alleles and/or their effect sizes for DB are small.
Subgroup heterogeneity Whole-group pleiotropy
Known independent DB risk loci in DA cases Known independent DB risk loci in DA cases
Pleiotropic loci
No correlationsPositive correlations in
risk allele dosagesbetween independent loci
Correlations
High
Low
Locus :
1p31
3p21
4q27
Dia
gnos
ed D
A (
know
n)
Dia
gnos
ed D
A (
know
n)
DB u
naffe
cted
Unknown
DB a
ffect
ed
7q32
10q2
1
16p1
2
19q1
3
18p1
1
Locus :
1p31
3p21
4q27
7q32
10q2
1
16p1
2
19q1
3
18p1
1
a b
Figure 1 Overview of BUHMBOX. (a) Under the scenario of subgroup heterogeneity, risk alleles for DB-associated loci will be enriched in a subgroup of DA cases, producing positive correlations between DB risk allele dosages from independent loci. (b) Under the scenario where there is no heterogeneity and where DA and DB share alleles owing to pleiotropy (whole-group pleiotropy), DB risk alleles will be uniformly distributed and have no correlations. Red boxes, DB risk alleles; white boxes, non-risk alleles.
©20
16N
atur
e A
mer
ica,
Inc.
All
righ
ts r
eser
ved.
NATURE GENETICS ADVANCE ONLINE PUBLICATION 3
T E C H N I C A L R E P O RT S
BUHMBOX discriminates between heterogeneity and pleiotropyTo demonstrate that BUHMBOX detects heterogeneity (even in the presence of pleiotropy), we conducted simulations with the following parameters: the sample size of DA case individuals (N), the number of risk loci associated with DB (M), and the proportion of DA cases that actually show genetic characteristics of DB (heterogeneity propor-tion, or ). To simulate realistic distributions of effect sizes and allele frequencies, we sampled odds ratio (OR) and RAF pairs from reported associations in the National Human Genome Research Insitute (NHGRI) catalog of published GWAS28 (Online Methods).
To characterize the false positive rate (FPR) of BUHMBOX, we sim-ulated 1,000,000 studies (N = 2,000 and M = 50) in which there was no heterogeneity ( = 0; Online Methods) or pleiotropy. BUHMBOX obtained a 5.1% FPR at P < 0.05; it also obtained appropriate FPRs at a wide range of statistical significance thresholds (P < 0.05 to P < 0.0005; Supplementary Table 2).
To evaluate the FPR of BUHMBOX when there was pleiotropy without heterogeneity ( = 0), we simulated 1,000 studies (N = 2,000 and M = 50) assuming that DA and DB shared 10% of risk loci (5 loci). We quantified the proportion of instances in which BUHMBOX and GRS approaches obtained P values smaller than the threshold P < 0.05. The GRS approach appropriately demonstrated 64.8% power to detect shared genetic structure. BUHMBOX demonstrated an appropriate FPR of 4.3% in detecting heterogeneity (Supplementary Fig. 1).
Finally, to evaluate the power of BUHMBOX to detect heterogene-ity, we repeated these simulations assuming no pleiotropy but sub-tle heterogeneity. We assumed that 10% of DA cases were actually DB cases ( = 0.1). In this case, BUHMBOX demonstrated 81.7% power to detect heterogeneity at P < 0.05 (Supplementary Fig. 1), and the GRS approach demonstrated 100% power to detect shared genetic structure. Note that the difference in power for the GRS approach in the pleiotropy and heterogeneity simulations is due to the stochastic chance that sampled effect sizes for all five loci may be small in the pleiotropy simulation; in simulations where we fixed the OR (1.25) and RAF (0.3) for all loci, the power of the GRS approach was similar for the two scenarios: 91.8% in pleiotropy and 92.0% in heterogeneity.
These simulations illustrate that BUHMBOX is sensitive to heteroge-neity but robust to pleiotropy, whereas the GRS approach detects both scenarios and cannot be used to discriminate between the two. Thus,
BUHMBOX complements methods for detecting pleiotropy by helping to interpret shared genetic structure (Supplementary Table 1).
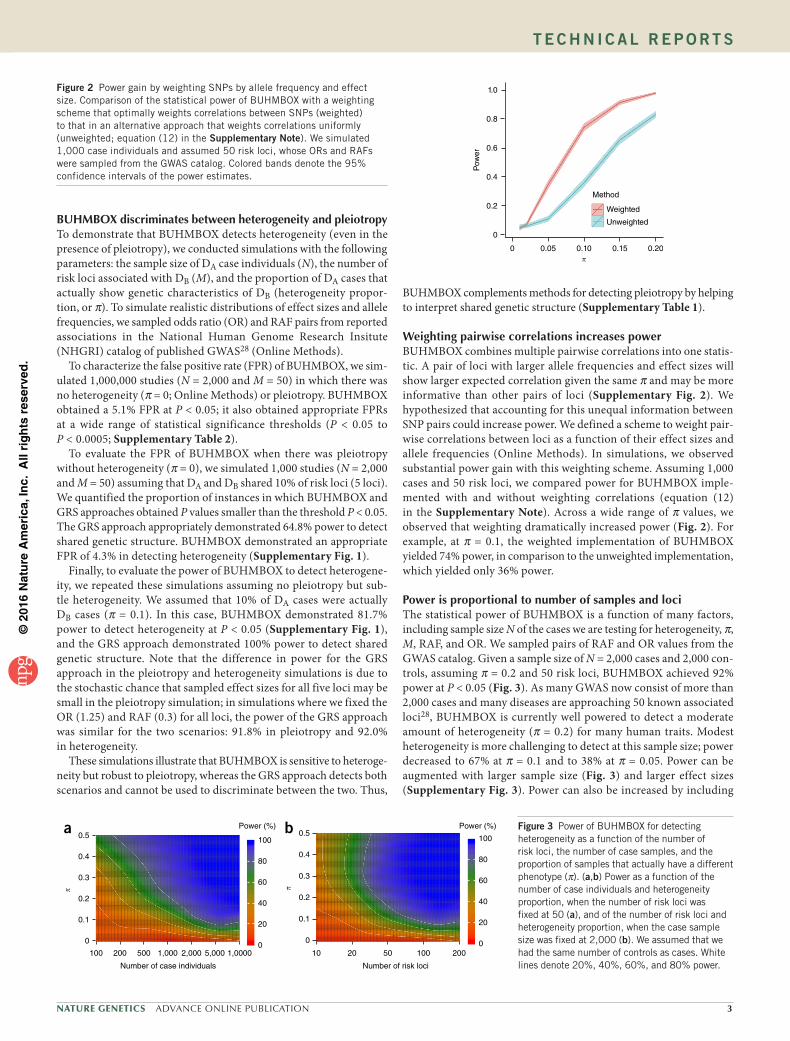
Weighting pairwise correlations increases powerBUHMBOX combines multiple pairwise correlations into one statis-tic. A pair of loci with larger allele frequencies and effect sizes will show larger expected correlation given the same and may be more informative than other pairs of loci (Supplementary Fig. 2). We hypothesized that accounting for this unequal information between SNP pairs could increase power. We defined a scheme to weight pair-wise correlations between loci as a function of their effect sizes and allele frequencies (Online Methods). In simulations, we observed substantial power gain with this weighting scheme. Assuming 1,000 cases and 50 risk loci, we compared power for BUHMBOX imple-mented with and without weighting correlations (equation (12) in the Supplementary Note). Across a wide range of values, we observed that weighting dramatically increased power (Fig. 2). For example, at = 0.1, the weighted implementation of BUHMBOX yielded 74% power, in comparison to the unweighted implementation, which yielded only 36% power.
Power is proportional to number of samples and lociThe statistical power of BUHMBOX is a function of many factors, including sample size N of the cases we are testing for heterogeneity, , M, RAF, and OR. We sampled pairs of RAF and OR values from the GWAS catalog. Given a sample size of N = 2,000 cases and 2,000 con-trols, assuming = 0.2 and 50 risk loci, BUHMBOX achieved 92% power at P < 0.05 (Fig. 3). As many GWAS now consist of more than 2,000 cases and many diseases are approaching 50 known associated loci28, BUHMBOX is currently well powered to detect a moderate amount of heterogeneity ( = 0.2) for many human traits. Modest heterogeneity is more challenging to detect at this sample size; power decreased to 67% at = 0.1 and to 38% at = 0.05. Power can be augmented with larger sample size (Fig. 3) and larger effect sizes (Supplementary Fig. 3). Power can also be increased by including
1.0
0.8
0.6
Pow
er
0.4
0.2
0
0 0.05 0.10 0.15 0.20
Method
Weighted
Unweighted
Figure 2 Power gain by weighting SNPs by allele frequency and effect size. Comparison of the statistical power of BUHMBOX with a weighting scheme that optimally weights correlations between SNPs (weighted) to that in an alternative approach that weights correlations uniformly (unweighted; equation (12) in the Supplementary Note). We simulated 1,000 case individuals and assumed 50 risk loci, whose ORs and RAFs were sampled from the GWAS catalog. Colored bands denote the 95% confidence intervals of the power estimates.
0.5
0.4
0.3
0.2
0.1
0
100 200 500 1,000 2,000 5,000 1,0000
Number of case individuals
100
80
60
40
20
0
Power (%)0.5
100
80
60
40
20
0
Power (%)
10 20 50 100 200
0.4
0.3
0.2
0.1
0
Number of risk loci
a b Figure 3 Power of BUHMBOX for detecting heterogeneity as a function of the number of risk loci, the number of case samples, and the proportion of samples that actually have a different phenotype ( ). (a,b) Power as a function of the number of case individuals and heterogeneity proportion, when the number of risk loci was fixed at 50 (a), and of the number of risk loci and heterogeneity proportion, when the case sample size was fixed at 2,000 (b). We assumed that we had the same number of controls as cases. White lines denote 20%, 40%, 60%, and 80% power.

©20
16N
atur
e A
mer
ica,
Inc.
All
righ
ts r
eser
ved.
4 ADVANCE ONLINE PUBLICATION NATURE GENETICS
T E C H N I C A L R E P O RT S
large numbers of loci with even nominal evidence of association in addition to established genome-wide significant loci (Supplementary Fig. 4 and Supplementary Note).
Controlling for linkage disequilibriumAlthough BUHMBOX adequately controlled the FPR when loci were truly independent, we were concerned that long-range LD between apparently independent loci may introduce false positives29. To ensure that BUHMBOX was robust to LD, we implemented the following strategies: (i) stringent LD pruning of DB-associated loci to exclude SNPs with r2 >0.1 and (ii) accounting for any remaining residual LD by assessing the relative increase of correlations in cases as compared to controls (delta correlations). We evaluated these strategies by mea-suring FPR using the RA Immunochip Consortium data30. In 1,000 different loosely pruned (r2 <0.5) SNP sets constructed using the Sweden EIRA data (Online Methods), the FPR without using delta correlations was high (22.4% at P < 0.05). Applying delta correlations reduced this FPR to 9.5%. When we used stringent pruning (r2 <0.1), FPR was appropriately controlled (FPR was 5.9% and 5.3% with and without delta correlations, respectively). Although LD pruning alone was sufficiently effective for FPR control in this simulation, we have used both strategies throughout the paper to be conservative.
Accounting for population stratificationAnother potential confounding factor is population stratification. If population stratification exists, weak correlations between unlinked loci may occur, leading to inappropriate significance. If similar popu-lation stratification exists in cases and controls, the use of delta corre-lations mitigates this effect. To more aggressively control for the effect of stratification at the individual level, we implemented BUHMBOX
to regress out principal components from risk allele dosages before calculating cor-relation statistics. To evaluate this strategy, we simulated extreme population stratifica-tion using HapMap31 data (60 CEU and 60 YRI founders as cases and 90 JPT plus CHB founders as controls; GC = 26.5). It did not surprise us that, in 5,000 randomly sampled sets of independent SNPs, we observed an inflated BUHMBOX FPR (14.1% at P < 0.05). After regressing out the effects of ten prin-cipal components from risk allele dosages, we observed that the FPR was appropriately controlled (5.7% at P < 0.05). As an addi-tional test under a more realistic scenario, we merged genotype data from northern Europe (Sweden EIRA cohort; 2,762 cases and 1,940 controls) and southern Europe (Spain cohort; 807 cases and 399 controls) in the RA Immunochip Consortium case–control data set30 (Online Methods) to create a highly stratified data set. In 1,000 sets of randomly sampled independent SNPs, we observed an inflation of the FPR (8.6% at P < 0.05); this was appropriately corrected (FPR of 5.9% at P < 0.05) when we regressed out the effects of ten principal components.
Application to autoimmune diseasesAutoimmune diseases have genetic risk loci in common2,4,32–36 that cluster in specific
immune pathways2,27,36. We used the GRS approach to evaluate shared genetic structure for autoimmune diseases and then applied BUHMBOX to assess heterogeneity. We obtained individual-level genotype data from the Type 1 Diabetes Genetics Consortium (T1DGC) UK case–control cohort (6,670 cases and 9,416 con-trols)37 and the RA Immunochip Consortium’s six RA case–control cohorts (7,279 seropositive RA cases and 15,870 controls)30 (Online Methods). We evaluated genetic sharing for a spectrum of autoim-mune diseases with T1D and RA. We obtained independent associ-ated loci for all 18 autoimmune diseases (r2 <0.1, including MHC SNPs) from ImmunoBase (see URLs and Supplementary Table 3) and tested the association of GRSs for these autoimmune diseases with T1D and RA case status.
We observed substantial genetic sharing between autoimmune diseases. T1D demonstrated significant sharing with alopecia areata (AA), autoimmune thyroid disease (ATD), celiac disease (CEL), Crohn’s disease (CRO), juvenile idiopathic arthritis (JIA), primary biliary cirrhosis (PBC), primary sclerosing cholangitis (PSC), RA, Sjögren’s syndrome (SJO), systemic lupus erythematosus (SLE), and vitiligo (VIT) (positive association, P < 1 × 10⁻⁴). RA exhibited sig-nificant genetic sharing with AA, ankylosing spondylitis (AS), ATD, CEL, JIA, PBC, PSC, SLE, systemic sclerosis (SSC), T1D, and VIT (P < 1 × 10⁻³). Overall, GRSs showed significant positive associations for 11 autoimmune diseases each in the T1D and RA cohorts (GRS P < 2.9 × 10−3 = 0.05/17, correcting for 17 diseases tested; Table 1 and Supplementary Table 4). We considered only these traits for subse-quent analyses. To evaluate the degree of heterogeneity necessary to achieve the observed genetic sharing for these autoimmune diseases, we calculated the GRS regression coefficient, which we previously showed approximates the expected (ref. 38), assuming no pleiotropy.
Table 1 Summary of genetic overlap using the GRS and BUHMBOX approaches
Cohort data Test traitNumber of SNPs
GRS P value
GRS (95% CI)
BUHMBOX P value
BUHMBOX power at = 0.20
T1D AA 10 1.4 × 10−120 0.76 (0.69–0.82) 0.83 0.15ATD 7 1.4 × 10⁻³¹ 0.48 (0.40–0.56) 0.30 0.05CEL 38 2.2 × 10⁻³⁵ 0.32 (0.27–0.38) 0.16 0.50CRO 119 2.4 × 10⁻⁵ 0.08 (0.04–0.11) 0.54 0.99JIA 22 3.6 × 10−151 0.44 (0.40–0.47) 0.37 0.96PBC 19 1.1 × 10⁻¹² 0.16 (0.11–0.20) 0.18 0.82PSC 12 4.1 × 10⁻²⁶ 0.38 (0.31–0.45) 0.91 0.08RA 68 6.6 × 10−89 0.55 (0.49–0.60) 0.45 0.40SJO 7 3.9 × 10−146 0.53 (0.49–0.57) 0.84 0.66SLE 16 1.1 × 10−83 0.44 (0.39–0.48) 0.79 0.91VIT 12 2.5 × 10−90 0.59 (0.53–0.65) 0.14 0.33
RA AA 10 1.5 × 10⁻²² 0.28 (0.22–0.34) 0.71 0.23AS 24 6.1 × 10⁻⁴ 0.10 (0.04–0.15) 0.19 0.20ATD 7 3.9 × 10⁻²⁰ 0.34 (0.27–0.41) 0.57 0.08CEL 38 6.4 × 10⁻²⁰ 0.21 (0.17–0.26) 0.57 0.63JIA 22 8.9 × 10−125 0.36 (0.33–0.39) 0.61 0.99PBC 19 1.5 × 10⁻¹³ 0.15 (0.11–0.19) 0.83 0.90PSC 12 6.2 × 10⁻¹⁴ 0.24 (0.18–0.31) 0.46 0.12SLE 16 4.3 × 10−06 0.10 (0.05–0.14) 0.34 0.96SSC 5 9.6 × 10⁻¹⁰ 0.22 (0.15–0.29) 0.08 0.09T1D 53 9.6 × 10−207 0.43 (0.40–0.46) 0.29 1.00VIT 12 1.8 × 10⁻¹¹ 0.18 (0.12–0.23) 0.02 0.41
Seronegative RA
Seropositive RA
14 1.1 × 10⁻¹⁰ 0.30 (0.21–0.39) 0.008 0.26
MDD SCZ 90 1.5 × 10⁻⁵ 0.17 (0.09–0.24) 0.28 0.53
SCZ, schizophrenia. Only the traits that have significant GRS P values in the positive direction are shown. Significant GRS P value indicates evidence of shared genetic structure; significant BUHMBOX P value indicates evidence of heterogeneity. See Supplementary Table 4 for the full results for all traits tested.

©20
16N
atur
e A
mer
ica,
Inc.
All
righ
ts r
eser
ved.
NATURE GENETICS ADVANCE ONLINE PUBLICATION 5
T E C H N I C A L R E P O RT S
On the basis of the GRS coefficients, we observed estimates ranging from 0.08 to 0.76 across the different autoimmune diseases in T1D and from 0.10 to 0.43 in RA (Fig. 4 and Table 1).
We estimated the power of BUHMBOX to detect heterogeneity, correcting for 11 tests (P < 4.5 × 10⁻³). BUHMBOX was well powered for some autoimmune traits; at = 0.2, four traits had >90% power for T1D and four traits had >90% power for RA (Fig. 5). Despite this, we observed no evidence of heterogeneity at all (corrected P > 0.2; Fig. 6 and Table 1). Our findings suggest that autoimmune diseases have risk alleles and pathways in common with T1D and RA, and this is not caused by subgroups of genetically similar cases resulting from misclassifications or molecular subtypes.
Application to subtype misclassifications in RARA consists of two subtypes, seropositive and seronegative RA, with distinct clinical outcomes and MHC associations38. Patients are classi-fied into these two subtypes by whether they have serological evidence of antibodies reactive to cyclic citrullinated peptides (CCP). Although testing for antibody to CCP is specific, its lack of sensitivity can result in some patients with seropositive RA being misclassified as seronega-tive for RA20. We have previously demonstrated that there is shared genetic structure for seropositive and seronegative RA using the GRS approach38, which could imply misclassifications of up to 26.3% of cases between the two RA subtypes.
We used BUHMBOX to evaluate whether seropositive RA misclas-sifications were present in a seronegative RA cohort. We used the seronegative RA cohort (2,406 cases and 15,870 controls) from the RA Immunochip Consortium30. Among 68 independent RA-associated loci,
we chose SNPs that were associated with seropositive RA (P < 5 × 10⁻⁸) but not with seronegative RA (P > 5 × 10⁻⁸) in our Immunochip data. This criterion resulted in the selection of 14 specific loci exclu-sively associated with seropositive RA (Supplementary Table 3). The seropositive RA GRS was significantly associated with seronegative RA case status ( = 0.30, P = 1.1 × 10⁻¹⁰). The regression coefficient ( = 0.30) represents an upper bound for (Fig. 4). BUHMBOX suggested that heterogeneity was indeed present (P = 0.008; Fig. 6, Table 1, and Supplementary Table 4), consistent with potential sub-type misclassifications. As a more stringent test, we selected SNPs on the basis of the results from a test for heterogeneity between the RA subtypes; for this test, we obtained P values by assigning individuals with seropositive RA as cases and individuals with seronegative RA as controls. We chose both SNPs that were associated with seropositive RA (P < 5 × 10⁻⁸) and were nominally significant in the heterogeneity test between the RA subtypes (P < 0.05; Supplementary Table 3). Applying BUHMBOX to these 12 loci still showed significant hetero-geneity in the seronegative RA cohort (P = 0.017).
Application to major depressive disorder and schizophreniaCurrent definitions of psychiatric disorders reflect clinical syndromes, with overlapping clinical features. As a result, psychiatric diagnoses for a patient may change as their symptoms evolve21. In addition to the potential for misdiagnosis, a subset of true MDD cases may be geneti-cally more similar to schizophrenia. If heterogeneity with respect to schizophrenia risk alleles exists among MDD cases, then genetic stud-ies would suggest evidence of coheritability for the two disorders17, as has been observed in previous studies3,6,7. The unintentional inclusion
0.8
0.6
0.4
0.2
0Exp
ecte
d u
nder
no
plei
otro
py
AAATD
CELCRO JIAPBC
PSC RASJO SLE VIT
Disease
T1D
–150
–100
–50
0
log10(PGRS)0.4
0.3
0.2
0.1
0Exp
ecte
d u
nder
no
plei
otro
py
AA ASATD
CELJIAPBC
PSCSLESSC
T1D VIT
Disease
RA
–200
–150
–100
–50
0
log10(PGRS) log10(PGRS) log10(PGRS)
Exp
ecte
d u
nder
no
plei
otro
py
0.4
0.3
0.2
0.1
0
SeropositiveRA
–10–8–6–4–20
Seronegative RA
0.4
0.3
0.2
0.1
0Exp
ecte
d u
nder
no
plei
otro
py
SCZ
Disease
–5–4–3–2–10
MDD
Disease
a b c d
Figure 4 Genetic sharing among autoimmune diseases and psychiatric disorders. (a−d) In each plot, the y axis shows the heterogeneity proportion value expected to explain the observed genetic sharing. Error bars denote 95% confidence intervals. Heterogeneity proportion estimates were based on GRS analysis, assuming no pleiotropy for T1D (a), RA (b), seronegative RA (c), and MDD (d). In a and b, we show only the diseases of the 17 tested that had significantly positive GRS P values.
1.0
0.8
0.6
0.4
0.2
0
0.1 0.2 0.3 0.4 0.5 0.1 0.2 0.3 0.4 0.5 0.1 0.2 0.3 0.4 0.5 0.1 0.2 0.3 0.4 0.5
BU
HM
BO
X p
ower
1.0
0.8
0.6
0.4
0.2
0
BU
HM
BO
X p
ower
1.0
0.8
0.6
0.4
0.2
0
BU
HM
BO
X p
ower
1.0
0.8
0.6
0.4
0.2
0
BU
HM
BO
X p
ower
T1D RA Seronegative RADisease
CROJIASLEPBCSJOCELRAVITAAPSCATD
Disease
T1DJIASLEPBCCELVITAAASPSCSSCATD
DiseaseSeropositiveRA
DiseaseSCZ
MDDa b c d
Figure 5 Statistical power of BUHMBOX to detect heterogeneity. (a−d) Power calculated by performing 1,000 simulations with the corresponding sample size, number of risk alleles, RAFs, and ORs for T1D (a), RA (b), seronegative RA (c), and MDD (d). To calculate power for c and d, we used a significance threshold of 0.05. For a and b, the threshold was adjusted using Bonferroni correction accounting for 11 tests each in T1D and RA.

©20
16N
atur
e A
mer
ica,
Inc.
All
righ
ts r
eser
ved.
6 ADVANCE ONLINE PUBLICATION NATURE GENETICS
T E C H N I C A L R E P O RT S
of ‘schizophrenia-like’ MDD cases, owing to diagnostic misclassification or genetically dis-tinct subgroups, has been acknowledged and explored as a potential source of bias in coher-itability studies by previous investigators3,17.
We used BUHMBOX to test for a subgroup of schizophrenia-like cases in MDD. If a sub-set of MDD cases were misdiagnosed and in fact had schizophrenia or were more geneti-cally similar to schizophrenia, we would expect to see subgroup heterogeneity among MDD cases with respect to schizophrenia risk loci. We first evaluated evidence of shared genetic structure among 90 known schizophrenia-associated loci39 (Supplementary Table 3) in 9,238 MDD cases and 7,521 controls from the Major Depressive Disorder Working Group of the Psychiatric Genomics Consortium40 (Supplementary Table 5). Consistent with previous findings (Supplementary Table 6)3,6,7, the schizophrenia GRS was associated with MDD case status (P = 1.54 × 10⁻⁵), indicating shared genetic structure (Fig. 4). For the GRS analysis, we used a refined subset of the total sample (6,382 MDD cases and 5,614 controls), excluding samples that overlapped with the schizophrenia GWAS39 (Online Methods). Application of cross-trait LDSC7 to estimate the genetic correlation provided further evidence of shared genetic struc-ture between MDD and schizophrenia (rg = 0.47, standard error (s.e.) = 0.07, P = 1.61 × 10⁻¹⁰), of similar magnitude to previous reports7. However, the BUHMBOX P value was not significant (P = 0.28), indi-cating no excess positive correlations among schizophrenia-associated loci in MDD cases (Fig. 6 and Supplementary Table 4). Our find-ings suggest no evidence of a subgroup of schizophrenia-like MDD cases. However, we note that we lacked adequate statistical power to detect heterogeneity in the context of a small heterogeneity propor-tion. Given the MDD sample size and the number of currently known schizophrenia risk loci, there was 53% power at = 0.20 but only 25% power at = 0.10 (Fig. 5).
DISCUSSIONBUHMBOX can be used to determine whether shared genetic struc-ture between traits is the consequence of heterogeneity or pleiotropy on the basis of SNP genotype data alone. It can help to interpret recent observations of shared genetic structures in complex traits, including autoimmune, neuropsychiatric, and metabolic diseases. The intuition behind BUHMBOX is that, if heterogeneity exists, independent loci will show nonrandom positive correlations. Hence, correcting for population structure and long-range LD is critical for this approach to be effective. We emphasize that it is necessary to appropriately inter-pret the source of heterogeneity, which will depend on the biological
and clinical relationship between the two traits. We provide detailed information to guide interpretation in the Supplementary Note.
We demonstrated that genetic sharing among autoimmune diseases is due to pleiotropy, noting that for a few traits we had only modest power (Fig. 5). One notable exception was seronegative RA, which might contain misclassified seropositive RA cases. The results pre-sented here demonstrate that seronegative RA is a heterogeneous phe-notype with respect to genetic overlap with seropositive RA, bringing clarity to an ongoing debate about the nature of this disease. In con-trast, we were underpowered to draw more definitive conclusions as to whether a subset of MDD cases are genetically similar to schizophrenia cases; as MDD cohorts increase in size, we will be able to reassess more accurately whether smaller proportions of heterogeneity might par-tially explain observed coheritability. Our results are consistent with recent analyses concluding that pleiotropy among psychiatric diseases is unlikely to be explained by misclassifications alone17.
We showed that the power of BUHMBOX is a function of sample size, , and the number, effect sizes, and allele frequencies of risk loci. Power to detect subtle heterogeneity ( <0.1) in current data sets is lim-ited. However, in future studies, increasing sample size and the number of known associated loci will augment power. One potential strategy to augment power is to use a polygenic modeling3,12,13 approach, includ-ing a larger number of SNPs with less stringent significance thresholds (Supplementary Fig. 4 and Supplementary Note).
BUHMBOX has certain key caveats. First, it is designed to detect a specific type of heterogeneity resulting from the presence of a subgroup comprising a known second trait. Thus, BUHMBOX cannot currently be applied agnostically to detect the presence of heterogeneity in a data set. Second, BUHMBOX requires prior knowledge of associated loci and their effect sizes. For diseases with few known associated loci, BUHMBOX may perform suboptimally. Also, if known effect size esti-mates are inaccurate, power may decrease because appropriate weight-ing is crucial (Fig. 2). Third, BUHMBOX requires individual-level genotype data for a limited number of loci. Fourth, BUHMBOX can be sensitive to confounding factors. We recommend careful control of LD
1.0
0.8
0.6
0.4
0.2
0Pow
er to
det
ect 2
0% h
eter
ogen
eity CRO
JIASLE
PBC
SJO
RACEL
VIT
AAPSC ATD
0 –1 –2 –3log10(PBUHNBOX)
log10(PGRS)
–150
–100
–150
0
255075
SNP
T1D
1.0
0.8
0.6
0.4
0.2
0Pow
er to
det
ect 2
0% h
eter
ogen
eity
1.0
0.8
0.6
0.4
0.2
0Pow
er to
det
ect 2
0% h
eter
ogen
eity1.0
0.8
0.6
0.4
0.2
0Pow
er to
det
ect 2
0% h
eter
ogen
eity log10(PGRS) log10(PGRS)
0 –1 –2 –3log10(PBUHNBOX)
0 –1 –2 –3log10(PBUHNBOX)
0 –1 –2 –3log10(PBUHNBOX)
Seronegative RA MDD
255075
SNP
255075
SNP255075
SNP
–10–8–6–4–20
SCZ
SeropositiveRA
RAJIA
T1DSLE
PBC
CEL
VIT
AS
SSCPSCATD
AA
–200
–150
–100
–50
0
log10(PGRS)
–5–4–3
–10
–2
a b
c d
Figure 6 BUHMBOX results. (a−d) Results for diseases with significantly positive GRS P values in T1D (a), RA (b), seronegative RA (c), and MDD (d) (for complete results for all traits tested, see Supplementary Table 4). Significant GRS P values indicate evidence of shared genetic structure; significant BUHMBOX P values indicate evidence of heterogeneity. Point size represents the number of DB-associated SNPs included in the analysis. Dashed vertical lines denote the Bonferroni-adjusted significance threshold for the BUHMBOX test statistic. The arrow indicates a significant BUHMBOX test statistic.

©20
16N
atur
e A
mer
ica,
Inc.
All
righ
ts r
eser
ved.
NATURE GENETICS ADVANCE ONLINE PUBLICATION 7
T E C H N I C A L R E P O RT S
and population structure using LD pruning and principal components. Fifth, interpretation of the BUHMBOX test statistic is not simplistic. Positive findings indicate the presence of heterogeneity, but the results cannot distinguish between the various causes of this (for example, misclassifications, molecular subtypes, mediated pleiotropy, and ascer-tainment bias), and negative findings may indicate no heterogeneity or low power. To aid interpretation, BUHMBOX provides a power calculation based on sample size and risk allele information, but it may not always be accurate. For example, if pleiotropy and heterogeneity coexist, power may be overestimated. Sixth, if is small (for example, 0.05), BUHMBOX’s ability to detect heterogeneity is limited. We expect that will vary between situations, and further clinical and biological investigations are necessary to uncover the true . Finally, there is the unlikely possibility that real epistasis can manifest as positive signal in BUHMBOX. Broadly, BUHMBOX can be thought of as capturing a specific form of epistasis where risk alleles correlate positively within the additive model. As such, if this specific form of epistasis occurs naturally between DB-associated SNPs and if this epistasis structure is shared with DA, it has the potential to create a significant BUHMBOX test result and confound these analyses. However, this specific type of epistasis seems unlikely; were it present, application of BUHMBOX using DB-associated SNPs in DB cases to detect apparent ‘heterogene-ity’ might yield a significant result.
When comparing BUHMBOX to existing approaches, we focused on the GRS method. However, the results of our comparison also apply to other existing methods such as mixed-model-based approaches5,6 and LD-score-based approaches7, which are similar to the GRS approach in the sense that they detect both pleiotropy and heterogeneity. We expect that BUHMBOX will complement any of these methods to facilitate interpretation of observed genetic shar-ing between traits. Our statistical approach may be extended to have application beyond heterogeneity, including identification of missing heritability resulting from this type of heterogeneity41. These appli-cations will become more feasible as functional annotations of SNPs advance in the coming years.
URLs. BUHMBOX software, https://www.broadinstitute.org/mpg/buhmbox/; ImmunoBase, http://www.immunobase.org/.
METHODSMethods and any associated references are available in the online version of the paper.
Note: Any Supplementary Information and Source Data files are available in the online version of the paper.
ACKNOWLEDGMENTSThis work was supported in part by funding from the US National Institutes of Health (NIH) (1R01AR063759 (S.R.), 1R01AR062886 (S.R.), 1UH2AR067677-01 (S.R.), and U19AI111224-01 (S.R.)) and Doris Duke Charitable Foundation grant 2013097. B.H. is supported by the Asan Institute for Life Sciences, Asan Medical Center, Seoul, Republic of Korea (2016-0717) and the Korean Health Technology R&D Project, Ministry of Health and Welfare, Republic of Korea (HI14C1731). J.G.P. is supported by Fulbright Canada, the Weston Foundation, and Brain Canada through the Canada Brain Research Fund. K.S. is supported by an NIH training grant (T32HG002295). N.R.W. is supported by the Australian National Health and Medical Research Council (1087889 and 1078901). This research uses resources provided by the Type 1 Diabetes Genetics Consortium, a collaborative clinical study sponsored by the National Institute of Diabetes and Digestive and Kidney Diseases (NIDDK), National Institute of Allergy and Infectious Diseases (NIAID), National Human Genome Research Institute (NHGRI), National Institute of Child Health and Human Development (NICHD), and Juvenile Diabetes Research Foundation International (JDRF) and supported by grant U01DK062418.
AUTHOR CONTRIBUTIONSB.H. and S.R. conceived the statistical approach and organized the project. B.H., J.G.P., and S.R. led and coordinated analyses and wrote the initial manuscript. E.S. and N.R.W. provided guidance on the statistical approach. K.S., C.H.L., D.D., X.H., Y.R.P., and E.K. contributed to the implementation of specific analyses and offered feedback on the statistical methodologies. P.K.G., S.R.D., J.W., J.M., S.E., L.K., S.R., and T.H. contributed RA samples and insight on the clinical implications to RA. W.-M.C., S.O.-G., and S.S.R. contributed T1D samples and insight on clinical implications to T1D. The Major Depressive Disorder Working Group contributed MDD samples and insight on the clinical implications to MDD. All authors contributed to the final manuscript.
COMPETING FINANCIAL INTERESTSThe authors declare no competing financial interests.
Reprints and permissions information is available online at http://www.nature.com/reprints/index.html.
1. Sivakumaran, S. et al. Abundant pleiotropy in human complex diseases and traits. Am. J. Hum. Genet. 89, 607–618 (2011).
2. Cotsapas, C. et al. Pervasive sharing of genetic effects in autoimmune disease. PLoS Genet. 7, e1002254 (2011).
3. Cross-Disorder Group of the Psychiatric Genomics Consortium. Identification of risk loci with shared effects on five major psychiatric disorders: a genome-wide analysis. Lancet 381, 1371–1379 (2013).
4. Fortune, M.D. et al. Statistical colocalization of genetic risk variants for related autoimmune diseases in the context of common controls. Nat. Genet. 47, 839–846 (2015).
5. Lee, S.H., Yang, J., Goddard, M.E., Visscher, P.M. & Wray, N.R. Estimation of pleiotropy between complex diseases using single-nucleotide polymorphism–derived genomic relationships and restricted maximum likelihood. Bioinformatics 28, 2540–2542 (2012).
6. Cross-Disorder Group of the Psychiatric Genomics Consortium. Genetic relationship between five psychiatric disorders estimated from genome-wide SNPs. Nat. Genet. 45, 984–994 (2013).
7. Bulik-Sullivan, B. et al. An atlas of genetic correlations across human diseases and traits. Nat. Genet. 47, 1236–1241 (2015).
8. Pendergrass, S.A. et al. Phenome-wide association study (PheWAS) for detection of pleiotropy within the Population Architecture using Genomics and Epidemiology (PAGE) Network. PLoS Genet. 9, e1003087 (2013).
9. Collins, F.S. & Varmus, H. A new initiative on precision medicine. N. Engl. J. Med. 372, 793–795 (2015).
10. Criswell, L.A. et al. Analysis of families in the Multiple Autoimmune Disease Genetics Consortium (MADGC) collection: the PTPN22 620W allele associates with multiple autoimmune phenotypes. Am. J. Hum. Genet. 76, 561–571 (2005).
11. Kendler, K.S., Neale, M.C., Kessler, R.C., Heath, A.C. & Eaves, L.J. Major depression and generalized anxiety disorder. Same genes, (partly) different environments? Arch. Gen. Psychiatry 49, 716–722 (1992).
12. Wray, N.R., Goddard, M.E. & Visscher, P.M. Prediction of individual genetic risk to disease from genome-wide association studies. Genome Res. 17, 1520–1528 (2007).
13. International Schizophrenia Consortium. Common polygenic variation contributes to risk of schizophrenia and bipolar disorder. Nature 460, 748–752 (2009).
14. Lee, S.H. et al. New data and an old puzzle: the negative association between schizophrenia and rheumatoid arthritis. Int. J. Epidemiol. 44, 1706–1721 (2015).
15. Power, R.A. et al. Polygenic risk scores for schizophrenia and bipolar disorder predict creativity. Nat. Neurosci. 18, 953–955 (2015).
16. Solovieff, N., Cotsapas, C., Lee, P.H., Purcell, S.M. & Smoller, J.W. Pleiotropy in complex traits: challenges and strategies. Nat. Rev. Genet. 14, 483–495 (2013).
17. Wray, N.R., Lee, S.H. & Kendler, K.S. Impact of diagnostic misclassification on estimation of genetic correlations using genome-wide genotypes. Eur. J. Hum. Genet. 20, 668–674 (2012).
18. Silverberg, M.S. et al. Diagnostic misclassification reduces the ability to detect linkage in inflammatory bowel disease genetic studies. Gut 49, 773–776 (2001).
19. van der Linden, M.P. et al. Value of anti–modified citrullinated vimentin and third-generation anti–cyclic citrullinated peptide compared with second-generation anti–cyclic citrullinated peptide and rheumatoid factor in predicting disease outcome in undifferentiated arthritis and rheumatoid arthritis. Arthritis Rheum. 60, 2232–2241 (2009).
20. Wiik, A.S., van Venrooij, W.J. & Pruijn, G.J. All you wanted to know about anti-CCP but were afraid to ask. Autoimmun. Rev. 10, 90–93 (2010).
21. Bromet, E.J. et al. Diagnostic shifts during the decade following first admission for psychosis. Am. J. Psychiatry 168, 1186–1194 (2011).
22. Gibson, P. et al. Subtypes of medulloblastoma have distinct developmental origins. Nature 468, 1095–1099 (2010).
23. Smoller, J.W., Lunetta, K.L. & Robins, J. Implications of comorbidity and ascertainment bias for identifying disease genes. Am. J. Med. Genet. 96, 817–822 (2000).
24. Burrell, R.A., McGranahan, N., Bartek, J. & Swanton, C. The causes and consequences of genetic heterogeneity in cancer evolution. Nature 501, 338–345 (2013).

©20
16N
atur
e A
mer
ica,
Inc.
All
righ
ts r
eser
ved.
8 ADVANCE ONLINE PUBLICATION NATURE GENETICS
T E C H N I C A L R E P O RT S
25. Jeste, S.S. & Geschwind, D.H. Disentangling the heterogeneity of autism spectrum disorder through genetic findings. Nat. Rev. Neurol. 10, 74–81 (2014).
26. Flint, J. & Kendler, K.S. The genetics of major depression. Neuron 81, 484–503 (2014).
27. Cho, J.H. & Feldman, M. Heterogeneity of autoimmune diseases: pathophysiologic insights from genetics and implications for new therapies. Nat. Med. 21, 730–738 (2015).
28. Welter, D. et al. The NHGRI GWAS Catalog, a curated resource of SNP–trait associations. Nucleic Acids Res. 42, D1001–D1006 (2014).
29. Raychaudhuri, S. et al. Genetic variants at CD28, PRDM1 and CD2/CD58 are associated with rheumatoid arthritis risk. Nat. Genet. 41, 1313–1318 (2009).
30. Eyre, S. et al. High-density genetic mapping identifies new susceptibility loci for rheumatoid arthritis. Nat. Genet. 44, 1336–1340 (2012).
31. International HapMap Consortium. The International HapMap Project. Nature 426, 789–796 (2003).
32. Smyth, D.J. et al. Shared and distinct genetic variants in type 1 diabetes and celiac disease. N. Engl. J. Med. 359, 2767–2777 (2008).
33. Festen, E.A. et al. A meta-analysis of genome-wide association scans identifies IL18RAP, PTPN2, TAGAP, and PUS10 as shared risk loci for Crohn’s disease and celiac disease. PLoS Genet. 7, e1001283 (2011).
34. Zhernakova, A. et al. Meta-analysis of genome-wide association studies in celiac disease and rheumatoid arthritis identifies fourteen non-HLA shared loci. PLoS Genet. 7, e1002004 (2011).
35. Jostins, L. et al. Host–microbe interactions have shaped the genetic architecture of inflammatory bowel disease. Nature 491, 119–124 (2012).
36. Cotsapas, C. & Hafler, D.A. Immune-mediated disease genetics: the shared basis of pathogenesis. Trends Immunol. 34, 22–26 (2013).
37. Onengut-Gumuscu, S. et al. Fine mapping of type 1 diabetes susceptibility loci and evidence for colocalization of causal variants with lymphoid gene enhancers. Nat. Genet. 47, 381–386 (2015).
38. Han, B. et al. Fine mapping seronegative and seropositive rheumatoid arthritis to shared and distinct HLA alleles by adjusting for the effects of heterogeneity. Am. J. Hum. Genet. 94, 522–532 (2014).
39. Schizophrenia Working Group of the Psychiatric Genomics Consortium. Biological insights from 108 schizophrenia-associated genetic loci. Nature 511, 421–427 (2014).
40. Ripke, S. et al. A mega-analysis of genome-wide association studies for major depressive disorder. Mol. Psychiatry 18, 497–511 (2013).
41. Wray, N.R. & Maier, R. Genetic basis of complex genetic disease: the contribution of disease heterogeneity to missing heritability. Curr. Epidemiol. Rep. 1, 220–227 (2014).

©20
16N
atur
e A
mer
ica,
Inc.
All
righ
ts r
eser
ved.
NATURE GENETICSdoi:10.1038/ng.3572
ONLINE METHODSGenetic risk score approach. Given M independent risk loci associated with DB, we calculated the GRS of individual i as
GRSij
Mij jx
1
where xij is the risk allele dosage for individual i at marker j and j is the effect size (log-transformed OR) of the risk allele at marker j for disease DB. The GRS approach calculates GRSs for all individuals and associates GRSs with case/control status of DA. In the logistic regression framework for associat-ing GRSs and DA status, we can obtain the regression coefficient for the GRS ( GRS). We previously showed that GRS approximates the proportion of DA cases that are genetically DB cases (heterogeneity proportion, ) if we assume that there is no pleiotropy and the GRS association is solely driven by a sub-group38. Thus, GRS represents an upper bound of .
The BUHMBOX approach. To detect heterogeneity within DA cases driven by a subgroup that is genetically similar to DB cases, we used the following proce-dure. (i) We prepared genotype data for DA cases and controls and information about SNPs associated with DB (risk allele, RAF, and OR). (ii) We pruned SNPs associated with DB on the basis of LD in control samples (excluding SNPs with r2 >0.1 or 1 Mb from other SNPs). (iii) We obtained the risk allele dosages of the pruned SNPs in DA cases and controls. (iv) We regressed out principal components from risk allele dosages to obtain residual dosages, one locus at a time. (v) We calculated R, the correlation matrix of the residual dosages of risk alleles in N cases with DA and R , in N controls. (vi) We calculated Y, a matrix whose nondiagonal elements were z scores from delta correlations
Y R RN NN N
(vii) We calculated the BUHMBOX statistic
Sw y
wi j ij ij
i j ijBUHMBOX 2
where yij is the element in Y in row i and column j. Given M pruned SNPs, (i,j) iterates M(M − 1)/2 nondiagonal elements of Y. The wij term is a weighting function that is designed to maximize power, such that (equation (13) in the Supplementary Note)
wp p p p
p pij
i i j j i j
i i j j
1 1 1 1
1 1 1 1
where pi is the RAF of SNP i and i is the OR of SNP i for DB. The BUHMBOX statistic follows a N(0,1) distribution under the null hypothesis. We calculated the significance of this statistic as a positive one-sided test; the P value is PBUHMBOX = 1 – (SBUHMBOX), where is the cumulative density function of the standard normal distribution. In the context of heterogeneity, excessive positive correlations among DB risk alleles in DA cases result in PBUHMBOX < . See Supplementary Table 1 for a comparison of the BUHMBOX and GRS approaches. The BUHMBOX test statistic was inspired by previous work deriv-ing covariance between correlation estimates42 and on combining dependent estimates43,44. For details of the intuition, derivation, optimization, and inter-pretation of the BUHMBOX test statistic, see the Supplementary Note.
Code availability. BUHMBOX has been fully implemented as a publicly avail-able R script (see URLs).
Power and false positive rate simulations. Given the sample size of DA cases (N), the proportion of DA cases that actually show genetic characteristics of DB cases (heterogeneity proportion, ), and the number of risk loci associ-ated with DB (M), we simulated studies to estimate the power of our method as follows. To simulate a reasonable joint distribution of RAFs and ORs, we
downloaded the GWAS catalog (as of 29 April 2014). Among all binary traits in the catalog, we selected traits with 50 reported associated SNPs, resulting in 22 traits with 1,480 SNPs. From these SNPs, we sampled M pairs of RAFs (p) and their corresponding ORs ( ). To simulate genotypes, we set the RAF to p/(( − 1)p +1) for a subgroup (N individuals) and to p for the other sub-group (N(1 − ) individuals) because N individuals could be thought of as DB cases. Within each subgroup, we generated genotypes assuming that risk alleles were distributed according to Hardy–Weinberg equilibrium and that risk loci were independent. We assumed Hardy–Weinberg equilibrium in cases because we assumed an additive disease model. Then, we applied BUHMBOX to calculate the P value. We repeated this 1,000 times to approximate power as the proportion of simulations with P 0.05. We evaluated power for different values of N, M, and .
Under the assumption that the risk loci were independent, the FPR sim-ulation was equivalent to the power simulation described above, with the only difference being that was set to 0, which forced the null hypothesis. We measured the FPR by assuming N = 1,000 and M = 20 and constructing 1,000,000 such studies.
Linkage disequilibrium simulations. To simulate realistic LD, we used chro-mosome 22 data from control individuals in the Swedish EIRA cohort of the RA data set (2,762 cases and 1,940 controls)30. We assigned half of control indi-viduals as cases and the rest as controls. To generate 1,000 random sets of SNPs, we began from all SNPs and thinned the SNP set by tenfold with different seed numbers using PLINK45 (with the command option --thin 0.1). We then pruned each of the 1,000 data sets using PLINK45 with an r2 criterion of 0.5 or 0.1.
Population stratification simulations. To assess the effects of population stratification, we conducted two sets of simulations. For the first, we used data from HapMap31 release 23 (60 CEU founders, 60 YRI founders, and 90 JPT + CHB founders), setting CEU + YRI individuals as cases and JPT + CHB individuals as controls. We calculated principal components after LD pruning (r2 <0.1). For DB-associated SNPs, we randomly selected 5,000 sets of 22 independent SNPs; we selected a single SNP from each autosome. For the second simulation, we used genotype data from a northern European RA cohort (Swedish EIRA; 2,762 cases and 1,940 controls) and a southern Europe cohort (Spain; 807 cases and 399 controls) from the RA data set30. For this simulation, we used SNPs that we had generated for LD simulations (described above; thinned from Swedish EIRA chromosome 22 with crite-rion r2 <0.1), by setting the Swedish samples as cases and adding the Spanish samples as controls.
Application to specific phenotypes. Type 1 diabetes data set. To evaluate pleiotropy and heterogeneity among 18 autoimmune diseases and T1D, we applied the GRS and BUHMBOX approaches to the UK case–control data set provided by the T1DGC37, which consisted of 16,086 samples (6,670 cases and 9,416 controls) from three collections: (i) cases from the UK-GRID, (ii) shared controls from the British 1958 Birth Cohort, and (iii) shared controls from Blood Services controls (data release 4 February 2012; hg18). The samples were collected from 13 regions. All samples were collected after obtaining informed consent, and samples were genotyped on the Immunochip array. GRS and BUHMBOX analyses were conducted using the region index as a covariate.
Rheumatoid arthritis data set. To evaluate pleiotropy and heterogeneity between 18 autoimmune diseases and RA, we used the RA Immunochip Consortium data from six RA case–control cohorts (UK, US, Dutch, Spanish, Swedish UMEA, and Swedish EIRA)30. To evaluate pleiotropy in autoim-mune diseases, we used 7,279 seropositive RA cases and 15,870 controls. To evaluate misclassifications of RA subtypes, we used 2,406 seronegative RA samples and the same controls. Seropositive and seronegative RA cases were defined in each cohort using standard clinical practices to assess whether patients were reactive to antibody against CCP38. All samples were obtained with informed consent and were collected through protocols approved by an institutional review board. All individuals self-reported as white and of European descent. Samples were genotyped with the Immunochip array. We merged the data from six cohorts into one and used binary variables representing cohorts as well as ten principal components as covariates in the analysis.

©20
16N
atur
e A
mer
ica,
Inc.
All
righ
ts r
eser
ved.
NATURE GENETICS doi:10.1038/ng.3572
Defining autoimmune risk loci. We accessed ImmunoBase (7 June 2015 ver-sion) to define genome-wide significant risk loci for 18 autoimmune diseases. We did not include inflammatory bowel disease, owing to its redundancy with Crohn’s disease and ulcerative colitis. For each of the 18 autoimmune dis-eases analyzed, we pruned the list of index SNPs obtained from ImmunoBase in PLINK45 with options --r2 --ld-window-r2 0.1, using the 1000 Genomes Project Phase 1 European reference panel for LD. For all pairs of SNPs with r2 >0.1, we kept the most strongly associated SNP. To ensure completely inde-pendent risk loci, we also removed SNPs annotated as being located in the same chromosomal region in ImmunoBase, again keeping the most strongly associated index SNP (Supplementary Table 3). When a locus was not in the Immunochip data sets, we looked for a proxy (r2 >0.2) on the basis of the 1000 Genomes Project data.
Major depressive disorder data set. We used BUHMBOX to investigate the relationship between MDD and schizophrenia, which have been previously reported to have common genetic etiology on the basis of polygenic risk scor-ing3 and coheritability analyses6. The full MDD sample analyzed comprised nine GWAS data sets collected from eight separate studies (Supplementary Table 5) as previously described40. All samples were collected through pro-tocols approved by an institutional review board and were obtained with informed consent. Independence of the training (schizophrenia) and target (MDD) data sets is crucial in GRS analyses; GRSs are constructed using effect size estimates obtained using allele frequency differences between cases and controls in the training GWAS, and overlapping cases or controls will therefore bias the association of GRSs to the target data set in the positive direction. In contrast, the BUHMBOX test statistic is based on the correlation of risk allele dosages among cases, which is orthogonal to allele frequency differences in cases and controls and is therefore not inflated by sample overlap. Thus, for the GRS analysis, individual MDD samples (4 cases and 886 controls) that overlapped with samples in the schizophrenia GWAS39 were removed from the analysis; three GWAS cohorts with an insufficient number of independent
control samples (N < 5) were also removed from the analysis. GRS analyses were conducted in each of the remaining six GWAS data sets (Supplementary Table 5), followed by meta-analysis of the GRSs. To obtain the overall GRS effect size ( ) and test statistic, we used the inverse-variance-weighted fixed-effects method. For BUHMBOX, we used the full data set; analyses were con-ducted in each of the nine GWAS data sets (Supplementary Table 5) followed by meta-analysis. Because the BUHMBOX statistic is a z score, we performed meta-analysis of the BUHMBOX results across the data sets using the standard weighted-sum z-score approach, where z scores are weighted by the square root of the sample size.
Defining schizophrenia risk loci. Schizophrenia-associated SNPs were selected as those showing genome-wide significant association with schizo-phrenia (P < 5 × 10⁻⁸) in the most recent Psychiatric Genomics Consortium39 GWAS. For schizophrenia-associated SNPs not directly genotyped in the MDD GWAS data sets, we selected proxy SNPs as those with the highest r2 value from the list of all proxies with r2 >0.2 using the 1000 Genomes Project Phase 1 European reference panel. Of the 97 schizophrenia-associated SNPs (11 indels were not considered in our analysis), 90 LD-independent SNPs (r2 >0.1, >1 Mb away from each other) were available for analysis in the MDD GWAS data sets either via direct genotyping or by genotyping of a proxy SNP (see Supplementary Table 3 for a detailed list of SNPs).
42. Jennrich, R.I. An asymptotic 2 test for the equality of two correlation matrices. J. Am. Stat. Assoc. 65, 904–912 (1970).
43. Wei, L.J., Lin, D.Y. & Weissfeld, L. Regression analysis of multivariate incomplete failure time data by modeling marginal distributions. J. Am. Stat. Assoc. 84, 1065–1073 (1989).
44. Lin, D.Y. & Sullivan, P.F. Meta-analysis of genome-wide association studies with overlapping subjects. Am. J. Hum. Genet. 85, 862–872 (2009).
45. Purcell, S. et al. PLINK: a tool set for whole-genome association and population-based linkage analyses. Am. J. Hum. Genet. 81, 559–575 (2007).