a methodology for value based seismic design of structures
TRANSCRIPT

Scientia Iranica A (2016) 23(6), 2514{2527
Sharif University of TechnologyScientia Iranica
Transactions A: Civil Engineeringwww.scientiairanica.com
A methodology for value based seismic design ofstructures by the endurance time method
M.Ch. Basima;�, H.E. Estekanchib and A. Vafaib
a. Department of Civil Engineering, Sahand University of Technology, Tabriz, P.O. Box 51335-1996, Iran.b. Department of Civil Engineering, Sharif University of Technology, Tehran, P.O. Box 11155-9313, Iran.
Received 19 February 2015; received in revised form 18 August 2015; accepted 15 September 2015
KEYWORDSEarthquakeengineering;Value based seismicdesign;Life cycle costanalysis;Structuraloptimization;Endurance timemethod;Nonlinear dynamicanalysis.
Abstract. A new design methodology based on the total value of structures is introduced.This methodology, namely Value Based Design of structures (VBD), uses the advantages ofEndurance Time (ET) method. While prescriptive and earlier generations of performancebased design approaches commonly try to �nd structures with the least initial cost, adesign approach to directly incorporate the concept of value in design procedure has beenformulated here. Reduced computational e�ort in ET analysis provides the prerequisitesto practical use of optimization algorithms in seismic design. A genetic algorithm isused with the objective of minimizing total cost of the building during its lifespan. ETmethod is used to estimate the structural responses of each candidate design to probableearthquakes and the expected costs of earthquake consequences are calculated using LifeCycle Cost Analysis (LCCA). A prototype steel frame is optimally designed according to aprescriptive, performance based and the proposed value based design method. Then, theirseismic performance and expected cost components are investigated. The results provide apathway towards practical value based design and show that conformance to design coderequirements or performance objectives does not assure achieving the best design regardingthe overall design values.
© 2016 Sharif University of Technology. All rights reserved.
1. Introduction
In recent decades, large economic losses followingearthquakes have revealed the need for improved designcriteria intended to reduce damages and economicimpacts to an acceptable level along with life pro-tection. The prescriptive and also earlier generationsof performance based seismic design approaches tryto design structures satisfying minimal requirementsunder seismic actions in a number of intensity levels
*. Corresponding author.E-mail addresses: [email protected] (M.Ch. Basim);[email protected] (H.E. Estekanchi); [email protected](A. Vafai)
and a design having lower initial cost is commonlypreferred. Such approaches will not necessarily resultin an economical design with lower total cost in lifetimeof the structure. Thus, Life Cycle Cost Analysis(LCCA) has been applied in construction industryto account for economic concerns in decision makingprocedures. The expected costs caused by futureearthquakes during the design life of a structure canbe estimated using LCCA. This analysis, implementedin an optimization algorithm, can be used to �nda design with the least total cost. Basically, thisanalysis can provide a baseline to incorporate technical,economic, and social or any other intended measures indesign procedure. By using this method, the expectedtotal cost of a structure, including the initial cost

M.Ch. Basim et al./Scientia Iranica, Transactions A: Civil Engineering 23 (2016) 2514{2527 2515
and losses caused by probable earthquakes, during itslifespan can be considered as the main measure forthe priority of design alternatives. Here, LCCA isused to determine the total cost of a structure to beused in optimum design procedure. Readily introducedvalue based design can provide a wider description ofdesign target by de�ning the earthquake consequencessuch as structural damages, loss of contents, lossesdue to downtime, human injuries, and fatalities in theform of quanti�able parameters. In this way, it isexpected that the resultant design will perform withdesired post-earthquake capabilities with manageabledisruption.
LCCA demands the calculation of cost compo-nents associated with the performance of the structurein multiple hazard levels [1]. In order to have areliable seismic performance assessment of a struc-tural system to be used in the LCCA methodology,response-history based incremental analyses and re-alistic numerical models of the structure should beused. However, the huge computational demand re-quired in these procedures and sophistications involvedmay make optimization algorithms impractical dueto the repetitive nature of these algorithms, or thesimpli�cations used will decrease the reliability of theresults. In this research study, Endurance Time (ET)method, as a dynamic procedure requiring reasonablyreduced computational e�ort, is applied to estimatethe performance of the structure in all levels of hazardintensity [2]. The main procedure in ET method is toanalyze structures subjected to predesigned intensify-ing accelerograms and assess their performance basedon structural responses at di�erent excitation levels.Using this method, performance of the structure can bemonitored in a full range of hazard intensities by eachsingle response-history analysis instead of progressivelyscaled up ground motions in IDA. Thus, the requiredhuge computational demand of incremental dynamicanalyses is considerably reduced while maintaining themajor advantages of it, i.e. accuracy and insensitivityto model complexity [3]. The idea of using ET analysisresults to calculate the simple expected cost was in-troduced by Basim and Estekanchi [4]. This potentialcapability will be used here to extend the applicationof detailed loss reduction metrics in a practical designprocedure. This can pave the way for practical valuebased seismic design of structures.
Mirzaee et al. [5] and Hariri-Ardebili et al. [6]have studied the applications of the ET method inperformance assessment of structures. Correlatingthe dynamic characteristics of ET intensifying excita-tions with those of ground motions at various hazardlevels has resulted in reasonably accurate estimatesof expected seismic responses at various excitationintensities through ET analysis [7].
In order to demonstrate the method, a �ve-
story and three-bay steel special moment frame isoptimally designed based on three distinct philoso-phies: �rst, according to Iranian National BuildingCode (INBC) as a prescriptive design code, whichis almost identical to the ANSI/AISC360 [8] LRFDdesign recommendations; second, according to FEMA-350 [9] limitations as performance based design criteria;and third, using the introduced value based method tohave the minimum total cost during its lifetime, whichis assumed 50 years. A cost model appropriate forthe studied building is de�ned and used to quantifythe consequences of probable earthquakes. Althoughthe proposed methodology is general and can be usedfor any type of constructions, the used cost modelis de�ned for this speci�c case study of steel framebased on judgmental assumptions and more researchis needed to provide generalized models for other typesof buildings. Seismic performance and expected costcomponents of the resultant prescriptive, performancebased, and value based designs of the frame areinvestigated and discussed.
2. Background
Although signi�cant progresses have been made in thelast two decades in the area of earthquake engineering,currently, most of the seismic design codes belong tothe category of the prescriptive design codes, in whicha number of limit state checks are recommended toprovide safety. Indeed, prescriptive building codes aimat ensuring adequate strength of structural membersand overall structural strength and, hence, they donot provide warrantable levels of building life cycleperformance [1]. Thus, design codes are migrating fromprescriptive procedures intended to preserve life safetyto reliability based design methodologies and most ofthem have attempted to advance their design criteriatowards new generations of Performance Based Design(PBD) of structures. In performance based earthquakeengineering, the performance of the building in itslifetime is inspected in order to ensure reliable andpredictable seismic performance. Several guidelines onthis concept have been introduced over the last decadefor assessment and rehabilitation of existing buildingsand analysis and design of new ones. FEMA-350 [9]provides a probability based guideline for performancebased design of new steel moment resisting frames con-sidering uncertainties in seismic hazard and structuralanalyses.
In performance based design, after selecting theperformance objectives and developing a preliminarydesign, seismic response of the design is evaluated and,afterwards, the design is revised until the acceptancecriteria for all intended performance objectives aremet. More time-consuming analysis procedures areemployed in PBD to estimate the non-linear structural

2516 M.Ch. Basim et al./Scientia Iranica, Transactions A: Civil Engineering 23 (2016) 2514{2527
responses in di�erent levels of excitation. Optimizationmethods have been e�ectively used for PBD to achieveoptimal designs with acceptable performance while thestructural performances and also structural weight aretreated as objectives or constraints of the optimizationproblem [10]. Among many others, Pan et al. [11]used a constraint approach to incorporate severaldesign requirements into a multi-objective optimizationproblem and Liu et al. [12] formulated the performancebased design procedure subjected to uncertainties asa multi-objective optimization problem and used ge-netic algorithm to provide a set of Pareto-optimaldesigns.
Recently, researchers have tried to introduce �-nancial concerns in structural design area to reducethe amount of economic losses caused by earthquakesand hurricanes. As a result, LCCA has become animportant part of structural engineering to assess theperformance of the structures during their lifespan ineconomic terms. As one of the impressive works inthis area, Wen and Kang [13] formulated long-termbene�t versus cost considerations for evaluation of theexpected life cycle cost of an engineering system undermultiple hazards. Later, Liu et al. [14] used a multi-objective genetic optimization algorithm to automatethe design procedure and �nd optimal design alterna-tives with respect to three objectives. They used staticpushover analyses to assess the performance of steelframe design alternatives. Takahashi et al. [15] used arenewal model for the occurrence of earthquakes in aseismic source to formulate the expected life cycle costof design alternatives and applied the methodology toan actual o�ce building as a decision problem. Liu etal. [16] used a multi-objective optimization method toautomate the performance based seismic design of steelframe structures considering the seismic risk in terms ofmaximum inter-story drift. Fragiadakis et al. [17] com-pared single-objective optimal design with minimuminitial weight and a performance based two-objectiveoptimum design of a steel moment resisting frame;meanwhile, they presented a framework to obtain aPareto front of the design alternatives. Mitropoulouet al. [18] investigated the e�ect of the behavior factorin the design of reinforced concrete buildings underearthquake loading in terms of safety and economyby comparing initial and damage cost components ofeach design. Mitropoulou et al. [1] explored the e�ectof some analysis characteristics on the life cycle costanalysis of reinforced concrete structures. Jennings [19]used a multi-objective optimization algorithm withsocioeconomic and engineering objectives to identifyoptimal retro�t plans for wood-frame building stockof a community in order to improve community re-siliency. Four contributors of losses were consideredin this reference: initial cost, economic loss, numberof morbidities, and recovery time and some other
complementary measures were used to account for theloss in quality of life for the population.
3. Endurance Time method (ET)
ET excitation functions are in the form of arti�cialaccelerograms generated in such a way that responsespectrum of any time window of them from zero toa particular time matches a template spectrum witha scale factor which is an increasing function of time.Numerical optimization procedures have been used toachieve this interesting characteristic [20]. Various setsof ET acceleration functions have been produced withdi�erent template response spectra and are publiclyavailable through the website of ET method [21]. Atypical ET accelerogram used in this work, ETA40h, isdepicted in Figure 1. These records are optimized to�t average response spectrum of 7 records (longitudinalaccelerograms) used in FEMA-440 for soil type (C) astemplate spectrum.
As it can be veri�ed in Figure 2, the responsespectrum of a window from tET = 0 to tET = 10 sec ofthe used accelerogram matches the template spectrum.Furthermore, the produced response spectra by othertime windows of the record also match the templatespectrum with a scale factor, providing a correlationbetween analysis time and induced spectral intensity.
Figure 1. Acceleration function for ETA40h01.
Figure 2. Acceleration response spectra for ETA40h01 atdi�erent times of excitation.
M.Ch. Basim et al./Scientia Iranica, Transactions A: Civil Engineering 23 (2016) 2514{2527 2517
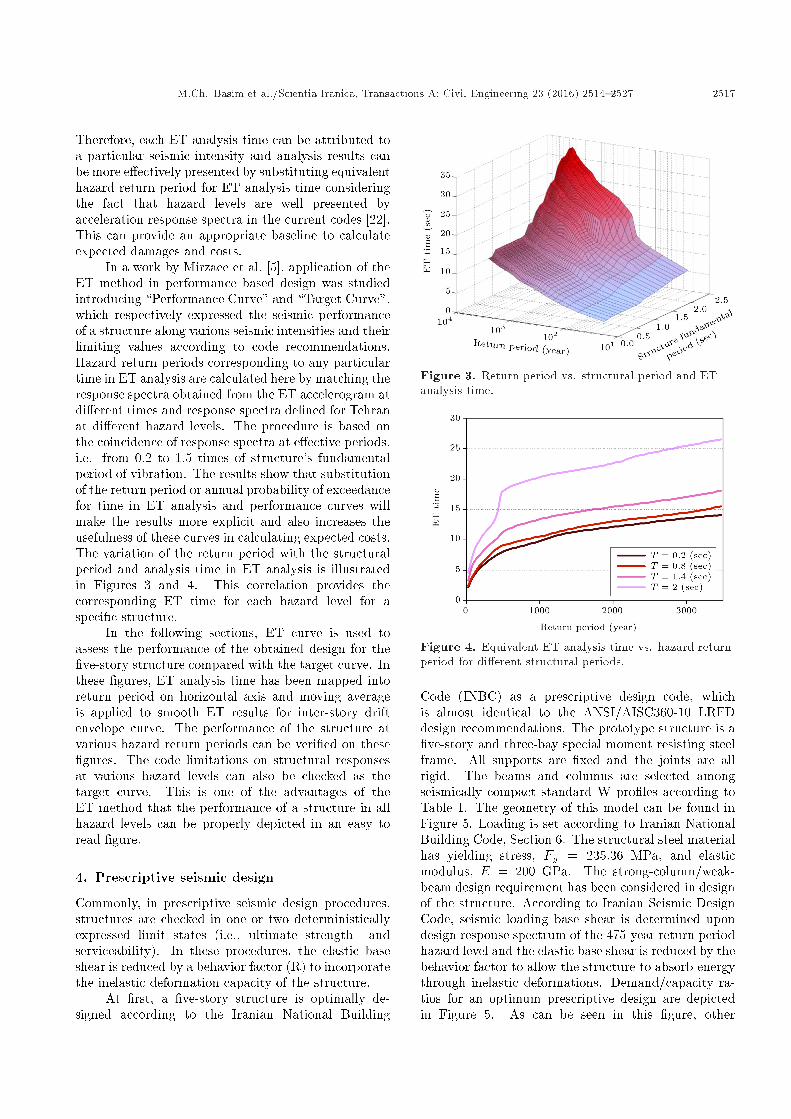
Therefore, each ET analysis time can be attributed toa particular seismic intensity and analysis results canbe more e�ectively presented by substituting equivalenthazard return period for ET analysis time consideringthe fact that hazard levels are well presented byacceleration response spectra in the current codes [22].This can provide an appropriate baseline to calculateexpected damages and costs.
In a work by Mirzaee et al. [5], application of theET method in performance based design was studiedintroducing \Performance Curve" and \Target Curve",which respectively expressed the seismic performanceof a structure along various seismic intensities and theirlimiting values according to code recommendations.Hazard return periods corresponding to any particulartime in ET analysis are calculated here by matching theresponse spectra obtained from the ET accelerogram atdi�erent times and response spectra de�ned for Tehranat di�erent hazard levels. The procedure is based onthe coincidence of response spectra at e�ective periods,i.e. from 0.2 to 1.5 times of structure's fundamentalperiod of vibration. The results show that substitutionof the return period or annual probability of exceedancefor time in ET analysis and performance curves willmake the results more explicit and also increases theusefulness of these curves in calculating expected costs.The variation of the return period with the structuralperiod and analysis time in ET analysis is illustratedin Figures 3 and 4. This correlation provides thecorresponding ET time for each hazard level for aspeci�c structure.
In the following sections, ET curve is used toassess the performance of the obtained design for the�ve-story structure compared with the target curve. Inthese �gures, ET analysis time has been mapped intoreturn period on horizontal axis and moving averageis applied to smooth ET results for inter-story driftenvelope curve. The performance of the structure atvarious hazard return periods can be veri�ed on these�gures. The code limitations on structural responsesat various hazard levels can also be checked as thetarget curve. This is one of the advantages of theET method that the performance of a structure in allhazard levels can be properly depicted in an easy toread �gure.
4. Prescriptive seismic design
Commonly, in prescriptive seismic design procedures,structures are checked in one or two deterministicallyexpressed limit states (i.e., ultimate strength andserviceability). In these procedures, the elastic baseshear is reduced by a behavior factor (R) to incorporatethe inelastic deformation capacity of the structure.
At �rst, a �ve-story structure is optimally de-signed according to the Iranian National Building
Figure 3. Return period vs. structural period and ETanalysis time.
Figure 4. Equivalent ET analysis time vs. hazard returnperiod for di�erent structural periods.
Code (INBC) as a prescriptive design code, whichis almost identical to the ANSI/AISC360-10 LRFDdesign recommendations. The prototype structure is a�ve-story and three-bay special moment resisting steelframe. All supports are �xed and the joints are allrigid. The beams and columns are selected amongseismically compact standard W pro�les according toTable 1. The geometry of this model can be found inFigure 5. Loading is set according to Iranian NationalBuilding Code, Section 6. The structural steel materialhas yielding stress, Fy = 235:36 MPa, and elasticmodulus, E = 200 GPa. The strong-column/weak-beam design requirement has been considered in designof the structure. According to Iranian Seismic DesignCode, seismic loading base shear is determined upondesign response spectrum of the 475-year return periodhazard level and the elastic base shear is reduced by thebehavior factor to allow the structure to absorb energythrough inelastic deformations. Demand/capacity ra-tios for an optimum prescriptive design are depictedin Figure 5. As can be seen in this �gure, other

2518 M.Ch. Basim et al./Scientia Iranica, Transactions A: Civil Engineering 23 (2016) 2514{2527
Table 1. List of alternative section properties for beams and columns.
Beams W18�35
W18�40
W18�46
W18�50
W18�55
W18�60
W18�65
W18�71
Sidecolumns
W10�39
W10�45
W10�54
W10�60
W10�68
W10�77
W10�88
W10�100
W10�112
Innercolumns
W12�79
W12�87
W12�96
W12�106
W12�120
W12�136
W12�152
W12�170
W12�190
W12�210
W12�230
W12�252
W12�279
W12�305
Figure 5. Schematics of steel frames under investigation and demand/capacity ratios according to prescriptive designcriteria.
Figure 6. Performance curve (ET curve) for theprescriptive design.
limitations such as drift limits or strong-column/weak-beam limitation have dominated the design in someelements.
In Figure 6, the seismic performance of theprescriptive design has been investigated according toFEMA-350 limitations on inter-story drift ratios by theET method. Performance curve (ET curve) and alsotarget curve for this structure are compared in this
�gure. FEMA-350 criteria for performance assessmentare explained in the next section. It can be veri�edthat the structure has violated IO level limitation buthas a proper performance in LS and CP levels.
5. Performance based design
Prescriptive design procedures do not assure reliableperformance of the structure in multiple hazard levelsduring its lifespan since these procedures merely intendto keep the ultimate strength of structural members atan acceptable level. Compared to these procedures,in Performance Based Design (PBD), a more generalstructural design philosophy is used in which thedesign criteria are expressed in terms of achievingmultiple performance requirements when the structureis subjected to various seismic hazard levels. In mostof the currant performance based design criteria, theobjective performance of an ordinary building is usuallyde�ned to resist a signi�cant accidental earthquakewithout structural damage, allow repairable structuraldamage against a rare major earthquake, and resist themaximum credible earthquake without collapse [11]. Inorder to assess the performance of structures, various

M.Ch. Basim et al./Scientia Iranica, Transactions A: Civil Engineering 23 (2016) 2514{2527 2519
response estimation methods, such as push-over analy-sis which is widely used in this area, have been used byresearchers and also engineers; however, time historyanalysis is so far believed to be the most accuratemethodology for evaluating structural performance.Optimization methods in design procedures have alsobeen used to achieve safe and economical designswhich can satisfy the performance based measures.An optimum performance based design methodologyis introduced in a work by Estekanchi and Basim [3]utilizing ET method as analysis tool.
The performance based design measures imple-mented in this work are based on FEMA-350 [9].FEMA-350 has provided a guideline for performancebased design of new steel moment resisting frames. Inthese criteria, a probability based approach is used toexplicitly consider the ground motion variability andthe uncertainty in the structural analysis. Two discretestructural performance levels, Collapse Prevention(CP) and Immediate Occupancy (IO), are consideredin FEMA-350. Limitations on inter-story drifts andforces in various elements, especially in columns, arede�ned in these criteria for each of these performancelevels. Other structural performance levels can bedetermined on a project-speci�c basis by interpolationor extrapolation from the criteria provided for the twoperformance levels. For the purpose of this work,Life Safety (LS) performance level has been de�nedby interpolating the IO and CP levels. In LS level,the structure experiences signi�cant damages resultedby the hazard, although some margin remains againsteither partial or total collapse. The performanceobjective in this study assuming \seismic use groupI" for the prototype special moment frame structureis de�ned as achieving IO, LS, and CP performancelevels in the case of ground motion levels of 50%,10%, and 2% probability of being exceeded in 50 years,respectively.
Many uncertainties are involved in behavior andresponse of a building ranging from uncertainties inseismic hazard due to the attenuation laws employedand record to record variability to uncertainties instructural modeling due to simpli�cations and assump-tions used in the numerical analysis [12]. To account forthese uncertainties, FEMA-350 uses a reliability basedprobabilistic approach to de�ne performance measuresthat explicitly acknowledge these inherent uncertain-ties. These uncertainties are expressed in terms ofa con�dence level. A high level of con�dence meansthat the building will very likely be capable of meetingthe desired performance. Considering a minimumcon�dence level of 90% for IO and CP performancelevels, the upper-bound limits for the calculated inter-story drift demand obtained from structural analysiswould be 0.0114 and 0.0508 and interpolation willresult in an upper bound of 0.0254 for LS level.
OpenSees [23] is used to perform structural re-sponse analyses. Concentrated plastic hinges by zero-length rotational springs with elastic beam-columnelements are used to model the nonlinear behavior ofelements. Plastic regions follow a bilinear hystereticresponse based on the Modi�ed Ibarra KrawinklerDeterioration Model [24,25]. To represent shear dis-tortions in the panel zones, they are modeled asrectangles composed of eight very sti� elastic beam-column elements with one zero-length rotational springin the corner based on the approach of Gupta andKrawinkler [26]. P-Delta Coordinate Transformationobject embedded in the platform is used to considerthe second-order e�ects.
A single-objective optimization problem is de�nedto �nd a design having the minimum initial steelmaterial weight as optimization objective. The limita-tions on inter-story drift demand and axial compressiveload on columns and also strong-column/weak-beamcriterion according to FEMA-350 recommendations areformulated as optimization constrains. The design vari-ables are the steel section sizes selected among standardW sections. As indicated in FEMA-350, structuresshould, as a minimum, be designed in accordance withthe applicable provisions of the prevailing buildingcodes, such as speci�cations of AISC360 [8] and AISCSeismic [27]. Thus, the AISC360 requirements andFEMA-350 acceptance criteria are implemented asinitial design constraints. Optimum design sectionshave been determined using GA algorithm adopted forperformance based design purposes using ET methodintroduced in a work by Estekanchi and Basim [3]. Theoptimum design sections can be found in Figure 7.A comparison between performance of the designedframe and the limiting curve according to FEMA-350 invarious seismic intensities can be performed using the
Figure 7. Performance based design sections of the frame.

2520 M.Ch. Basim et al./Scientia Iranica, Transactions A: Civil Engineering 23 (2016) 2514{2527
Figure 8. Performance curve (ET curve) for theperformance based design.
ET curve presented in Figure 8. As could be expected,the optimum design meets the limitations (i.e., coderequirements) with the least margins.
6. Value based design
While value can be de�ned and considered in its broadsense for design purposes, for clarity of explanation,in this research, we consider the structure that ismore economical to construct and maintain to be themost valued. As it will be demonstrated in thissection, ET analysis provides a proper baseline to per-form economical analyses on design alternatives withacceptable computational cost. Initial constructioncost and expected seismic damage cost throughoutthe lifetime of the structure are usually the two mostimportant parameters for decision making [1]. Pro-viding a reliable estimation of structural responses inmultiple intensities is one of the major obstacles inseismic damage cost assessment of structures. Varioussimpli�ed procedures for seismic analyses have beenused by researchers in order to overcome the hugecomputational demand involved in assessment of sev-eral design alternatives. Nevertheless, cost assessmenthas been mostly used in comparative studies amonga limited number of design alternatives and, recently,direct incorporation of life cycle cost in design processhas attracted the attention of researchers [1,28,29].Push-over analysis has been widely used as seismicassessment tool in this area. However, well knownlimitations of this analytical tool besides its weak-nesses in estimating oor accelerations to quantifynon-structural cost components have increased theneed for more realistic and reliable dynamic analysisprocedures with tolerable computational demand. Inthis section, a procedure to calculate the expectedcost components using ET analysis results has beenformulated. Application of this method in opti-mum design of structures in the framework of next-generation performance based seismic design consid-
ering inherent uncertainties is studied by Basim andEstekanchi [30].
The total cost CTOT of a structure can be con-sidered as the sum of its initial construction cost, CIN,which is function of design vector, s, and the presentvalue of the life cycle cost, CLC, which is function oflifetime, t, and the design vector, s [1]:
CTOT(t; s) = CIN(s) + CLC(t; s): (1)
6.1. Initial costsInitial cost is the construction cost of a new structureor the rehabilitation cost of an existing facility. Inour design example, which is a new moment resistingsteel frame, the initial cost is related to the land price,material, and the labor cost for the construction of thebuilding. As the land price and non-structural compo-nents cost are constant for all design alternatives, theycan be eliminated from the total cost calculation andthe initial steel weight of the structure with a laboroverhead can be considered as representor of the initialcost. Thus, an initial cost equal to $500 per m2 over the700 m2 total area of the structure for the prescriptivedesign is considered and for other design alternatives,it will be calculated according to their steel weightdi�erence by a material plus labor cost of 2 $/kg.
6.2. Life cycle costLife cycle cost in this study refers to the costs resultingfrom earthquakes that may occur during lifetime ofthe structure. Based on the recent literature, multiplelimit states according to inter-story drift ratio areconsidered. These limit states and damages depend onthe performance of both structural and nonstructuralcomponents. In order to calculate the life cycle costof the structure, the following cost components areinvolved: the damage repair cost, the cost of loss ofcontents due to structural damage quanti�ed by themaximum inter-story drift and also oor acceleration,the loss of rental cost, the loss of income cost, the cost ofinjuries, and the cost of human fatalities [18,31]. Someother factors have been de�ned and used by researchersto characterize earthquake consequences. Some ofthese factors try to quantify the impacts in the wholecommunity level such as losses due to morbidity or lossin quality of life for the population [19] or resiliencymeasures [32]. In this study, since the main objectiveis to introduce the value based design methodologyand explore the advantages of the ET method in thiscontext, a simple cost model is used and readers areencouraged to refer to the provided references for moredetailed models of earthquake consequences.
A correlation is required to quantify these lossesin economic terms. Several damage indices have beenused to quantify seismic performance of structures.Commonly, inter-story drift (�) has been consideredas a measure of both structural and non-structural

M.Ch. Basim et al./Scientia Iranica, Transactions A: Civil Engineering 23 (2016) 2514{2527 2521
Table 2. Drift ratio and oor acceleration limits for damage states.
Performance level Damage states Drift ratio limit (%)ATC-13 [33]
Floor acceleration limit (g) [34]
I None � � 0:2 a oor � 0:05II Slight 0:2 < � � 0:5 0:05 < a oor � 0:10III Light 0:5 < � � 0:7 0:10 < a oor � 0:20IV Moderate 0:7 < � � 1:5 0:20 < a oor � 0:80V Heavy 1:5 < � � 2:5 0:80 < a oor � 0:98VI Major 2:5 < � � 5 0:98 < a oor � 1:25VII Destroyed 5:0 < � 1:25 < a oor
damage. In this study, seven limit states according todrift ratios based on ATC-13 [33] are used to describestructural performance as shown in Table 2. On theother hand, maximum oor acceleration is used toquantify the loss of contents. The relation between oor acceleration values and damage states is shown inTable 2 based on a work by Elenas and Meskouris [34].The addition of the maximum oor acceleration com-ponent in life cycle cost calculation is introduced byMitropoulou et al. [18]. Piecewise linear relationhas been assumed in order to establish a continuousrelation between damage indices and costs [7].
Expected annual cost has been found to be themost proper intermediate parameter to calculate lifecycle cost of structures using ET method. The proce-dure and formulation to calculate the expected costcomponents in ET framework are described here indetails based on a common framework whose validityis investigated by Kiureghian [35]. The frameworkfor performance based earthquake engineering, used byresearchers at the Paci�c Earthquake Engineering Re-search (PEER) Center, can be summarized by Eq. (2),named as PEER framework formula. By use of thisequation, the mean annual rate (or annual frequency)of events (e.g., a performance measure) exceeding aspeci�ed threshold can be estimated by [35]:
�(dv) =Zdm
Zedp
ZimG(dvjdm)jdG(dmjedp)jj
dG(edpjim)jjd�(im)j; (2)
where:im An intensity measure (e.g., the
peak ground acceleration or spectralintensity);
edp An engineering demand parameter(e.g. an inter-story drift);
dm A damage measure (e.g. the accumulat-ed plastic rotation at a joint);
dv A decision variable (e.g., Dollar loss,duration of downtime).
Here, G(xjy) = P (x < XjY = y) is the Condi-tional Complementary Cumulative Distribution Func-
tion (CCDF) of random variable X, given Y = y, and�(x) is the mean rate of fx < Xg events per year. Thedeterioration of the structure has been ignored here andit has been assumed that it is instantaneously restoredto its original state after each damaging earthquake.
A fundamental assumption made is that, con-ditioned on EDP, DM is independent of IM, and,conditioned on DM, DV is independent of EDP andIM. Thus, it would be possible to decompose theearthquake engineering task into subtasks presented inFigure 9. The ET method is used in response analysisbox in this owchart and it will create a proper baselineto calculate the following boxes.
By considering various cost components as thedecision variable, dv, in Eq. (2), �(dv), i.e. the annualrate that the cost component values DV exceed a valuedv, can be obtained. Results can be presented by acurve with cost values of dv on the horizontal axis and
Figure 9. Performance based earthquake engineeringframework [36].

2522 M.Ch. Basim et al./Scientia Iranica, Transactions A: Civil Engineering 23 (2016) 2514{2527
Figure 10. A sample loss curve due to damage cost.
annual rate of exceedance on the vertical axis, knownas \Loss Curve" [36].
For variable X, the di�erential quantity j�(x +dx) � �(x)j �= jd�(x)j describes the mean number ofevents fx < X � x + dxg per year. Thus, assumingthat X is non-negative, its expected cumulative valuein one year is:
E[X
X] =Z 1
0xjd�(x)j =
Z 10
�(x)dx: (3)
Therefore, the area underneath �(x) versus x curvegives the mean cumulative value of X for all earth-quake events occurring in one year. In our problem,where x is the cost component values as the deci-sion variable, the area under �(dv) versus dv curve
(i.e., Loss Curve) represents the mean cumulativeannual component cost for all earthquake events in oneyear.
Loss Curve can be obtained from ET curvepresented above in a practical procedure. First, theannual probability of exceedance of drift ratios shouldbe determined. By reversing the return period on thex-axis to obtain the mean annual rate of exceedanceand using it on the y-axis, the annual rate of exceedanceof the inter-story drift can be obtained. If the inter-story drift is replaced by component cost applying thelinear relationship discussed previously using Table 2,the annual rate of exceedance for the cost component,namely Loss Curve, can be obtained. The procedureto calculate Loss Curve for losses caused by ooracceleration is similar. In Figure 10, a sample losscurve due to damage cost is depicted. The area underthe loss curve represents the mean annual componentcost caused by all earthquakes in one year.
As mentioned, life cycle cost consists of severalcomponents and can be calculated as follows:
CLC =Cdam + Ccon + Cren + Cinc+inj + Cfat; (4)
Ccon = C�con + Cacccon; (5)
where 5Cdam is the damage repair cost; C�con the loss
of contents cost due to structural damage quanti�ed byinter-story drift; Cacccan the loss of contents cost due to oor acceleration; Cren the loss of rental cost; Cinc thecost of income loss; Cinj the cost of injuries; and Cfat
Table 3. Formulae for calulation of the cost components in Dollars [1,31,33].
Cost component Formula Basic cost
Damage repair(Cdam)
Replacement cost � oor area �mean damage index
400 $/m2
Loss of contents(Ccon)
Unit contents cost � oor area �mean damage index
150 $/m2
Loss of rental(Cren)
Rental rate � gross leasable area �loss of function time
10 $/month/m2
Loss of income(Cinc)
Income rate � gross leasable area �down time
300 $/year/m2
Minor injury(Cinj;m)
Minor injury cost per person � oor area �occupancy rate � expected minor injury rate
2000 $/person
Serious injury(Cinj;s)
Serious injury cost per person � oor area �occupancy rate � expected serious injury rate
20000 $/person
Human fatality(Cfat)
Human fatality cost per person � oor area �occupancy rate � expected death rate
300000 $/person

M.Ch. Basim et al./Scientia Iranica, Transactions A: Civil Engineering 23 (2016) 2514{2527 2523
Table 4. Damage state parameters for cost calculations [33,37].
Damagestates
Mean damageindex (%)
Expected minorinjury rate
Expected seriousinjury rate
Expecteddeath rate
Loss of functiontime (days)
Down time(days)
(I)-None 0 0 0 0 0 0(II)-Slight 0.5 0.00003 0.000004 0.000001 1.1 1.1(III)-Light 5 0.0003 0.00004 0.00001 16.5 16.5(IV)-Moderate 20 0.003 0.0004 0.0001 111.8 111.8(V)-Heavy 45 0.03 0.004 0.001 258.2 258.2(VI)-Major 80 0.3 0.04 0.01 429.1 429.1(VII)-Destroyed 100 0.4 0.4 0.2 612 612
the cost of human fatality. The formulae to calculateeach cost component can be found in Table 3. The �rstterm of each formula is presented in the last column ofthe table as the basic cost. The values of the meandamage index, loss of function, downtime, expectedminor injury rate, expected serious injury rate, andexpected death rate used in this study are based onATC-13 [33] restated in FEMA-227 [37]. Table 4provides these parameters for each damage state. Lossof function time and down time are considered as thetime required to recover the full functionality of thebuilding based on a table from ATC-13 [33] for earth-quake engineering facility classi�cation 16 and mediumrise moment resisting steel frame. Also, Occupancyrate is taken 2 persons per 100 m2. Note that theseare an estimation of cost components and a detailedassessment is necessary to evaluate the expected cost.The method, with no limitation, has the capability ofincorporating detailed calculation of cost components.
According to Eq. (1), the total life cycle costis considered as the sum of the initial constructioncosts and the present value of the annual damage costssummed up through the lifetime of the structure. Adiscount rate equal to 3% over 50 years life of thebuilding has been considered to transform the damagecosts to the present value. This total cost is used as theobjective function in optimization algorithm seeking adesign with the least total cost.
As in the previous sections, Genetic Algorithm(GA) has been used to �nd the optimum design. Al-ternative designs should meet some initial constraints.Strong-column/weak-beam criterion should be checkedand strength of columns should preserve a decreasingtrend along the frame height. Besides these constraints,all AISC360 checks must be satis�ed for the gravityloads. Once the expressed constraints are satis�ed, theLCC analysis is performed. It is important to note thateach of these feasible organisms is acceptable designaccording to the code ignoring seismic actions. Inorder to reach the optimum solution, the algorithm willreproduce new design alternatives based on the initialpopulation and will mutate until the stop criterion
is met. The owchart of the applied methodology ispresented in Figure 11.
Genetic algorithm with an initial population sizeof 200 leads to an optimum design after about 2600 ET
Figure 11. Flowchart of the value based design by theET method.

2524 M.Ch. Basim et al./Scientia Iranica, Transactions A: Civil Engineering 23 (2016) 2514{2527
response history analyses. Figure 12 shows the totalcosts for feasible design alternatives in optimizationprocedure. The optimum design sections are presented
Figure 12. Total costs for feasible design alternatives inoptimization procedure.
Figure 13. Value based design sections of the frame.
Figure 14. Performance curve (ET curve) for the valuebased design.
in Figure 13. The seismic performance of the optimumdesign according to FEMA-350 measures is investi-gated in Figure 14. According to this �gure, this designsatis�es performance limitations of FEMA-350 with amargin that can be justi�ed by economic concerns.
7. Comparative study
In this section, components of life cycle cost forthe three structures (i.e. prescriptive, performancebased, and value based designs) are compared. Thesestructures are designed optimally based on variousdesign philosophies. In Figure 15, cost componentsfor the three structures are provided in 1000$. Eachbar presents contribution of various cost componentsand the value of total cost for each design can befound above the bars. Components in bars are inthe same order as that of the legend for the sake ofclarity. As it can be seen, the prescriptive design hasthe least initial cost but the largest total cost amongthree designs and the value based design, having alarger initial cost, has the least total cost in long term.Also, the value based design has a larger cost of contentloss due to oor acceleration. It may rea�rm thesophistications involved in selecting a desired designalternative. In Table 5, initial costs based on the usedinitial material, present value of life cycle costs due toseismic hazards with various exceedance probabilities,and the determinative part, i.e. total cost of threestructures, are presented. It can be veri�ed that avalue based design has the least total cost and wouldbe an economical alternative in long term. An extrainitial cost of 12200$ over the prescriptive design will
Figure 15. Cost components and total cost for the threedesigns (1000$).

M.Ch. Basim et al./Scientia Iranica, Transactions A: Civil Engineering 23 (2016) 2514{2527 2525
Table 5. Values of life cycle cost terms for the threedesigns (1000$).
Designtype
Initial cost Life cyclecost
Totalcost
Prescriptive 350 250.3 600.3Performance based 351.7 237.9 589.6
Value based 362.2 162.9 525.1
lead to a decrease by 87400$ in the expected lifecycle cost totally having 75200$ of pro�t. Althoughperformance based design has less expected total costthan the prescriptive design, neither the prescriptivedesign criteria nor the performance based ones willnecessarily lead to an economical design in long term.
8. Conclusions
A framework that directly acknowledges the concept ofvalue in the structural design procedure is establishedusing the advantages of Endurance Time (ET) method.Application of the ET analysis in Life Cycle CostAnalysis (LCCA) has been formulated in a general formwhich has the capability to be extended using moredetailed cost models of the construction. ET methodand the resultant performance curve have provided aproper baseline to calculate expected life cycle costs,while the required computational e�ort is in an ac-ceptable range to be used in conventional optimizationtechniques. This will provide the means to extend theeconomic concerns from a merely appraisal tool to amore impressive role which directly de�nes the designtargets. To demonstrate the method and compareit with other common design methods, a �ve-storymoment frame has been optimally designed accordingto three distinct design philosophies: a prescriptivedesign code, a performance based design guideline,and the introduced methodology named Value BasedDesign of structures (VBD). A case-speci�c cost modelhas been de�ned to quantify the consequences ofprobable earthquakes. The procedure to calculate lifecycle cost of the structure using ET results has beenpresented and used in an optimum design algorithm.Structural performance and life cycle cost componentsfor the three optimum designs have been comparedusing ET curve. Results show that the code baseddesign of the structure will not necessarily result inan economical design with less total cost in lifetime ofthe structure. For the studied building, performancebased design requires more initial material cost thanthe prescriptive design because of its more restrictinglimitations and, as expected, it has better performancein various hazard intensities. However, the value baseddesign has the least total cost among the three de-signs, although it demands the highest initial materialcost. The proposed methodology provides a pathway
towards practical value based seismic design. It alsoshows that conventional design procedures based oncompliance to design code requirements or performanceobjectives do not assure achievement of the best �naldesign regarding the overall applicable design concerns.However, this study aimed to introduce a methodologyfor optimum design based on �nancial considerations,and more research is required for de�ning appropriatemodels of earthquake consequences, especially modelsto account for uncertainties.
Nomenclature
a oor Floor accelerationATC Applied technology councilCCDF Conditional Complementary
cumulative Distribution FunctionCP Collapse PreventionCcon Loss of contents costCacccon Loss of contents cost due to oor
accelerationC�con Loss of contents cost due to inter-story
driftCdam Damage repair costCfat Cost of human fatalityCinc Loss of income costCinj Cost of injuriesCinj;m Cost of minor injuriesCinj;s Cost of serious injuriesCren Loss of rental costCIN Initial costCLC Life cycle costCTOT Total costdm A damage measure thresholddv A decision variable thresholdDM Damage MeasureDV Decision Variableedp An engineering demand parameter
thresholdE Elastic modulusEDP Engineering Demand ParameterET Endurance timeETEF Endurance Time Excitation FunctionFEMA Federal Emergency Management
AgencyFy Yielding stressg Acceleration of gravityGA Genetic Algorithmim An intensity measure thresholdIDA Incremental Dynamic Analysis

2526 M.Ch. Basim et al./Scientia Iranica, Transactions A: Civil Engineering 23 (2016) 2514{2527
IM Intensity MeasureIO Immediate OccupancyINBC Iranian National Building CodeLCCA Life Cycle Cost AnalysisLRFD Load Resistance Factor DesignLS Life SafetyPBD Performance Based DesignPEER Paci�c Earthquake Engineering
Research centerR Behavior factors Design vectort Lifetime of structuretET ET excitation timeVBD Value Based Design� Inter-story drift ratio
References
1. Mitropoulou, C.C., Lagaros, N.D. and Papadrakakis,M. \Life-cycle cost assessment of optimally designedreinforced concrete buildings under seismic actions",Reliability Engineering & System Safety, 96(10), pp.1311-1331 (2011).
2. Estekanchi, H.E., Vafai, A. and Sadeghazar, M. \En-durance time method for seismic analysis and designof structures", Scientia Iranica, 11(4), pp. 361-370(2004).
3. Estekanchi, H.E. and Basim, M.C. \Optimal damperplacement in steel frames by the Endurance Timemethod", The Structural Design of Tall and SpecialBuildings, 20(5), pp. 612-630 (2011).
4. Basim, M.C. and Estekanchi, H.E. \Application ofendurance time method in value based seismic designof structures", Second European Conference on Earth-quake Engineering and Seismology, Istanbul (2014).
5. Mirzaee, A., Estekanchi, H.E. and Vafai, A. \Ap-plication of endurance time method in performance-based design of steel moment frames", Scientia Iranica,17(6), pp. 361-370 (2010).
6. Hariri-Ardebili, M., Sattar, S. and Estekanchi, H.\Performance-based seismic assessment of steel framesusing endurance time analysis", Engineering Struc-tures, 69, pp. 216-234 (2014).
7. Mirzaee, A. and Estekanchi, H.E. \Performance-basedseismic retro�tting of steel frames by the endurancetime method", Earthquake Spectra, 31(1), pp. 383-402(2015).
8. AISC360, Speci�cation for Structural Steel Buildings(ANSI/AISC 360-10), American Institute of SteelConstruction, Chicago-Illinois (2010).
9. FEMA-350, Recommended Seismic Design Criteriafor New Steel Moment-Frame Buildings, USA FederalEmer-gency Management Agency (2000).
10. Ganzerli, S., Pantelides, C. and Reaveley, L. \Per-formance-based design using structural optimiza-tion", Earthquake Engineering & Structural Dynamics,29(11), pp. 1677-1690 (2000).
11. Pan, P., Ohsaki, M. and Kinoshita, T. \Constraint ap-proach to performance-based design of steel moment-resisting frames", Engineering Structures, 29(2), pp.186-194 (2007).
12. Liu, Z., Atamturktur, S. and Juang, C.H. \Per-formance based robust design optimization of steelmoment resisting frames", Journal of ConstructionalSteel Research, 89, pp. 165-174 (2013).
13. Wen, Y. and Kang, Y. \Minimum building life-cyclecost design criteria. I: Methodology", Journal of Struc-tural Engineering, 127(3), pp. 330-337 (2001).
14. Liu, M., Burns, S.A. and Wen, Y. \Optimal seismicdesign of steel frame buildings based on life cycle costconsiderations", Earthquake Engineering & StructuralDynamics, 32(9), pp. 1313-1332 (2003).
15. Takahashi, Y., Kiureghian, A.D. and Ang, A.H.S.\Life-cycle cost analysis based on a renewal model ofearthquake occurrences", Earthquake Engineering &Structural Dynamics, 33(7), pp. 859-880 (2004).
16. Liu, M., Burns, S.A. and Wen, Y. \Multiobjective opti-mization for performance-based seismic design of steelmoment frame structures", Earthquake Engineering &Structural Dynamics, 34(3), pp. 289-306 (2005).
17. Fragiadakis, M., Lagaros, N.D. and Papadrakakis, M.\Performance-based multiobjective optimum design ofsteel structures considering life-cycle cost", Structuraland Multidisciplinary Optimization, 32(1), pp. 1-11(2006).
18. Mitropoulou, C.C., Lagaros, N.D. and Papadrakakis,M. \Building design based on energy dissipation: acritical assessment", Bulletin of Earthquake Engineer-ing, 8(6), pp. 1375-1396 (2010).
19. Jennings, E.N. \A multi-objective community-levelseismic retro�t optimization combining social vulner-ability with an engineering framework for communityresiliency", PhD Dissertation, Colorado State Univer-sity (2015).
20. Nozari, A. and Estekanchi, H. \Optimization of en-durance time acceleration functions for seismic as-sessment of structures", International Journal of Op-timization in Civil Engineering, 1(2), pp. 257-277(2011).
21. Estekanchi, H.E. \Endurance time method website",https://sites.google.com/site/etmethod/ (2014).
22. Mirzaee, A., Estekanchi, H.E. and Vafai, A. \Improvedmethodology for endurance time analysis: From timeto seismic hazard return period", Scientia Iranica,19(5), pp. 1180-1187 (2012).
23. Mazzoni, S., McKenna, F., Scott, M.H., Fenves, G.L.and Jeremic, B., Open System for Earthquake Engi-neering Simulation (OpenSees), Berkeley, California(2006).

M.Ch. Basim et al./Scientia Iranica, Transactions A: Civil Engineering 23 (2016) 2514{2527 2527
24. Ibarra, L.F., Medina, R.A. and Krawinkler, H. \Hys-teretic models that incorporate strength and sti�nessdeterioration", Earthquake Engineering & StructuralDynamics, 34(12), pp. 1489-1511 (2005).
25. Lignos, D.G. and Krawinkler, H. \Deterioration mod-eling of steel components in support of collapse pre-diction of steel moment frames under earthquakeloading", Journal of Structural Engineering, 137(11),pp. 1291-1302 (2011).
26. Gupta, A. and Krawinkler, H., Seismic Demands forPerformance Evaluation of Steel Moment ResistingFrame Structures, in Technical Report 132 StanfordUniversity: The John A. Blume Earthquake Engineer-ing Research Center, Department of Civil Engineering(1999).
27. AISC341, Seismic Provisions for Structural SteelBuildings (ANSI/AISC 341-10), American Institute ofSteel Construction, Chicago, IL (2010).
28. Kaveh, A., Laknejadi, K. and Alinejad, B. \Per-formance-based multi-objective optimization of largesteel structures", Acta Mechanica, 223(2), pp. 355-369(2012).
29. Frangopol, D.M., Strauss, A. and Bergmeister, K.\Lifetime cost optimization of structures by a com-bined condition-reliability approach", EngineeringStructures, 31(7), pp. 1572-1580 (2009).
30. Basim, M.C. and Estekanchi, H.E. \Application of en-durance time method in performance-based optimumdesign of structures", Structural Safety, 56, pp. 52-67(2015).
31. Wen, Y. and Kang, Y. \Minimum building life-cyclecost design criteria. II: Applications", Journal of Struc-tural Engineering, 127(3), pp. 338-346 (2001).
32. Bruneau, M., Chang, S.E., Eguchi, R.T., Lee, G.C.,O'Rourke, T.D., Reinhorn, A.M., Shinozuka, M.,Tierney, K., Wallace, W.A. and von Winterfeldt, D.\A framework to quantitatively assess and enhance theseismic resilience of communities", Earthquake Spectra,19(4), pp. 733-752 (2003).
33. ATC-13, Earthquake Damage Evaluation Data forCalifornia, Applied Technology Council (1985).
34. Elenas, A. and Meskouris, K. \Correlation studybetween seismic acceleration parameters and damageindices of structures", Engineering Structures, 23(6),pp. 698-704 (2001).
35. Kiureghian, A.D. \Non-ergodicity and PEER's frame-work formula", Earthquake Engineering & StructuralDynamics, 34(13), pp. 1643-1652 (2005).
36. Yang, T.Y., Moehle, J.P. and Stojadinovic, B., Perfor-mance Evaluation of Innovative Steel Braced Frames,University of California, Berkeley (2009).
37. FEMA-227, A Bene�t-Cost Model for the SeismicRehabilitation of Buildings, Federal Emergency Man-agement Agency, Building Seismic Safety CouncilWashington, DC (1992).
Biographies
Mohammad Charkhtab Basim is an AssistantProfessor of Civil Engineering at Sahand Universityof Technology. He received his PhD in Earthquakeand Structural Engineering from Sharif Universityof Technology in 2015. He had been identi�ed asexceptional talent at SUT and is an honorary mem-ber of Iranian Construction Engineers Society. Hisresearch interests include performance based design ofstructures, structural reliability and optimization, andrehabilitation methods.
Homayoon E. Estekanchi is Professor of Civil Engi-neering at Sharif University of Technology. He receivedhis PhD in Civil Engineering from SUT in 1997 andhas been a Faculty Member at SUT since then. Heis a member of Iranian Construction Engineers Or-ganization, ASCE, Iranian Inventors Association, andseveral other professional associations. His researchinterests include a broad area of topics in structuraland earthquake engineering with a special focus on thedesign of tall buildings and industrial structures.
Abolhassan Vafai, PhD, is a Professor of CivilEngineering at Sharif University of Technology. Hehas authored/co-authored numerous papers in di�er-ent �elds of engineering, including applied mechanics,biomechanics, and structural engineering (steel, con-crete, timber, and o�shore structures). He has alsobeen active in the area of higher education and hasdelivered lectures and published papers on challenges ofhigher education, the future of science and technology,and human resources development.