a methodology to construct a reduced chemical scheme for
TRANSCRIPT

HAL Id: hal-00768791https://hal.archives-ouvertes.fr/hal-00768791
Submitted on 24 Dec 2012
HAL is a multi-disciplinary open accessarchive for the deposit and dissemination of sci-entific research documents, whether they are pub-lished or not. The documents may come fromteaching and research institutions in France orabroad, or from public or private research centers.
L’archive ouverte pluridisciplinaire HAL, estdestinée au dépôt et à la diffusion de documentsscientifiques de niveau recherche, publiés ou non,émanant des établissements d’enseignement et derecherche français ou étrangers, des laboratoirespublics ou privés.
A methodology to construct a reduced chemical schemefor 2D-3D photochemical models: Application to Saturn
M. Dobrijevic, T. Cavalié, F. Billebaud
To cite this version:M. Dobrijevic, T. Cavalié, F. Billebaud. A methodology to construct a reduced chemi-cal scheme for 2D-3D photochemical models: Application to Saturn. Icarus, Elsevier, 2011,�10.1016/j.icarus.2011.04.027�. �hal-00768791�

Accepted Manuscript
A methodology to construct a reduced chemical scheme for 2D-3D photochem‐
ical models: Application to Saturn
M. Dobrijevic, T. Cavalié, F. Billebaud
PII: S0019-1035(11)00163-1
DOI: 10.1016/j.icarus.2011.04.027
Reference: YICAR 9805
To appear in: Icarus
Received Date: 6 January 2011
Revised Date: 27 April 2011
Accepted Date: 30 April 2011
Please cite this article as: Dobrijevic, M., Cavalié, T., Billebaud, F., A methodology to construct a reduced chemical
scheme for 2D-3D photochemical models: Application to Saturn, Icarus (2011), doi: 10.1016/j.icarus.2011.04.027
This is a PDF file of an unedited manuscript that has been accepted for publication. As a service to our customers
we are providing this early version of the manuscript. The manuscript will undergo copyediting, typesetting, and
review of the resulting proof before it is published in its final form. Please note that during the production process
errors may be discovered which could affect the content, and all legal disclaimers that apply to the journal pertain.

A methodology to construct a reduced chemical scheme1
for 2D-3D photochemical models: Application to Saturn2
M. Dobrijevic∗,a,b, T. Cavaliea,b, F. Billebauda,b3
aUniversite de Bordeaux, Observatoire Aquitain des Sciences de l’Univers, 2 rue de4
l’Observatoire, BP 89, F-33271 Floirac Cedex, France5
bCNRS, UMR 5804, Laboratoire d’Astrophysique de Bordeaux, 2 rue de l’Observatoire, BP6
89, F-33271 Floirac Cedex, France7
Abstract8
We present a methodology to build a reduced chemical scheme adapted to the
study of hydrocarbons in the atmospheres of giant planets and Titan. As an ex-
ample, we have built a reduced chemical scheme, containing only 25 compounds
and 46 reactions (including photolysis), which is well adapted to compute the
abundance of the main hydrocarbons observed so far in the atmosphere of Sat-
urn (CH3, CH4, C2H2, C2H4, C2H6, CH3C2H, C3H8 and C4H2). This scheme
gives similar results, within the error bars of the model, as a 1D photochemical
model using an initial chemical scheme containing 90 compounds and more than
600 reactions. As a consequence, such a methodology can be used to build a
reduced scheme well adapted to future 2D (or 3D) photochemical models and
GCMs.
Key words: Saturn, Photochemistry, Hydrocarbons, 2D photochemical9
models10
1. Introduction11
Recent Cassini and ground-based observations (Greathouse et al. 2005, Howett12
et al. 2007, Fouchet et al. 2008, Guerlet et al. 2009, Hesman et al. 2009, Guerlet13
et al. 2010) and observations gathered in the framework of the Herschel Guar-14
anteed Time Key Program ”Water and related chemistry in the Solar System”15
(Hartogh et al., 2009) give unprecedented data on the structure and the compo-16
sition of Saturn’s atmosphere as a function of latitude and time. Interpretation17
∗Tel: +33-5-5777-6124; fax: +33-5-5777-6110Email address: [email protected] (M. Dobrijevic)

of these data requires adapted models like general circulation model and 2D/3D18
photochemical models which are currently lacking. One limitation to the de-19
velopment of 2D/3D photochemical models is the complexity of the chemical20
scheme (large number of compounds and reactions) required to study the evo-21
lution of hydrocarbons, which are the main trace species of the stratosphere. In22
typical 1D photochemical models, the number of species can reach 100 and there23
are more than 500 reactions. In fact, the aim of 1D modeling is to complete24
the chemical scheme as much as possible in order to have the best description25
of chemical processes occurring in the atmosphere and explain how light and26
heavy molecules are produced. In 2D/3D modeling, it is not possible for the27
time being to include such a large chemical scheme due to computational time28
limitations. As a consequence, it is important to determine a reduced chemical29
scheme, which is known to be representative of the main atmospheric chemical30
processes. The problem is then to create such a reduced chemical scheme which31
would be simple enough to be usable for 2D/3D models and whose results would32
remain valid.33
In the present paper, we present a methodology to build a reduced chemi-34
cal scheme validated to study the production of the main hydrocarbons in the35
stratosphere of Saturn. In section 2, we present the photochemical model, in-36
cluding the background atmosphere, the initial chemical scheme and the method37
used to study the propagation of uncertainties in the model. Mole fraction pro-38
files and their uncertainties are presented in section 3 and compared to recent39
CIRS observations. The methodology used to build a reduced chemical scheme40
is presented in section 4, the result is given in section 5 and discussed in section41
6.42
2. Photochemical model43
2.1. Atmospheric model44
Our 1D photochemical model uses a fixed background atmosphere with fixed45
boundary conditions (no evolution with latitude and time). The temperature46
2

profile presented in Fig. 1 has been synthesized by combining two different47
observations. At pressure levels greater than 10−5 mbar, we used the tempera-48
ture profile derived from Cassini/CIRS data corresponding to a planetographic49
latitude of 20◦ S (data provided by S. Guerlet), which is the latitude around50
which the subsolar point was located at the time these data have been col-51
lected (in 2006). Details of the temperature profile retrievial can be found in52
Fouchet et al. (2008) and Guerlet et al. (2009). At pressure levels lower than53
10−5 mbar, we used data derived from Smith et al. (1983). A subjective ex-54
trapolation is done to connect the two points (p = 10−5 mbar, T = 140 K) and55
(p = 10−7 mbar, T = 420 K).56
We used a non-uniform altitude grid with 124 levels from −184 km (pressure57
level p ≈ 104 mbar) to 1580 km (p ≈ 10−7 mbar). The altitude reference (z = 0)58
corresponds to p = 1 bar. Two consecutive levels (z and z + ∆z) are separated59
by a distance smaller than H(z)/5, where H(z) is the atmospheric scale height60
at altitude z.61
We summarize hereafter the boundary conditions of the model. At the lower62
boundary, we set the mole fraction of H2, He, CH4 and CO respectively to yH2 =63
0.86, yHe = 0.135 (Conrath and Gautier, 2000), yCH4 = 4.5 10−3 (Flasar et al.64
2005, Fletcher et al. 2009) and yCO = 5.0 10−10 (Cavalie et al., 2009). All other65
compounds have a flux given by the maximum diffusion velocity v = −K/H66
where K is the eddy diffusion coefficient and H the atmospheric scale height at67
the lower boundary. At the upper boundary, zero fluxes were assumed for all the68
species except for atomic hydrogen and for some oxygen compounds (CO, CO269
and H2O). H atoms are produced by photochemical processes at higher altitudes70
in the thermosphere. We assumed a fixed downward flux for atomic hydrogen71
at the upper boundary equal to ΦH = −1.0× 108 cm−2·s−1 following the work72
of Moses et al. (2005). The photochemical model results are not particularly73
sensitive to this value. The external source of oxygen in the atmosphere of74
Saturn could be in the form of infalling interplanetary dust particles (IDP), ring75
and/or satellite material, or large comets. Recent submillimetric observations76
favor a cometary origin for CO in the stratosphere of Saturn (Cavalie et al.,77
3
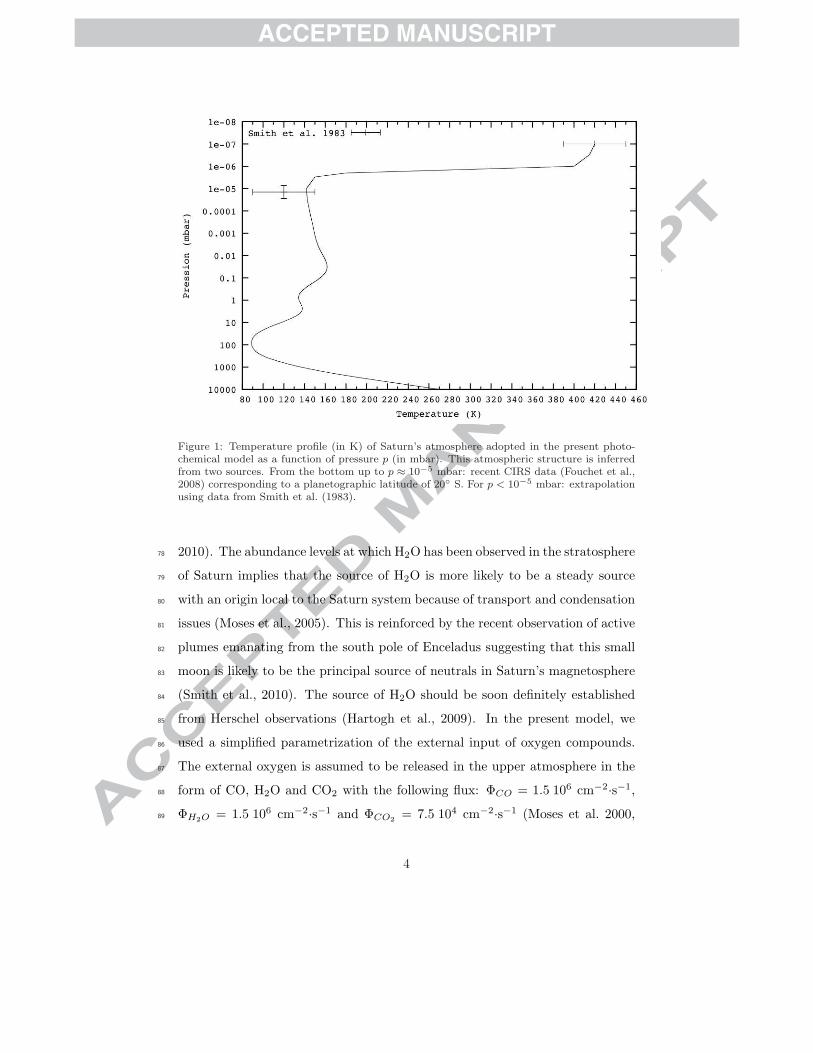
Figure 1: Temperature profile (in K) of Saturn’s atmosphere adopted in the present photo-chemical model as a function of pressure p (in mbar). This atmospheric structure is inferredfrom two sources. From the bottom up to p ≈ 10−5 mbar: recent CIRS data (Fouchet et al.,2008) corresponding to a planetographic latitude of 20◦ S. For p < 10−5 mbar: extrapolationusing data from Smith et al. (1983).
2010). The abundance levels at which H2O has been observed in the stratosphere78
of Saturn implies that the source of H2O is more likely to be a steady source79
with an origin local to the Saturn system because of transport and condensation80
issues (Moses et al., 2005). This is reinforced by the recent observation of active81
plumes emanating from the south pole of Enceladus suggesting that this small82
moon is likely to be the principal source of neutrals in Saturn’s magnetosphere83
(Smith et al., 2010). The source of H2O should be soon definitely established84
from Herschel observations (Hartogh et al., 2009). In the present model, we85
used a simplified parametrization of the external input of oxygen compounds.86
The external oxygen is assumed to be released in the upper atmosphere in the87
form of CO, H2O and CO2 with the following flux: ΦCO = 1.5 106 cm−2·s−1,88
ΦH2O = 1.5 106 cm−2·s−1 and ΦCO2 = 7.5 104 cm−2·s−1 (Moses et al. 2000,89
4

Cavalie et al. 2009).90
The eddy diffusion coefficient K(z) (in cm2·s−1) is presented in Fig. 2. This91
coefficient, together with the methane mole fraction at the lower boundary,92
gives a satisfactory profile of methane in comparison with Voyager/UVS and93
Cassini/CIRS data (Fig. 3).94
Figure 2: Eddy diffusion coefficient (solid line) and molecular diffusion coefficient of CH4
(dashed line) (expressed in cm2·s−1) as a function of pressure (mbar). The methane ho-mopause is located around 10−5 mbar in agreement with Smith et al. (1983).
2.2. Chemical model95
In the present study, we used the review of the hydrocarbon chemistry at96
low temperature described in Hebrard et al. (2006) and Hebrard et al. (2009) for97
Titan’s atmosphere. The initial chemical scheme, associated rate constants and98
uncertainty factors of reaction rates have been extracted from these two papers.99
The chemical scheme includes 90 compounds (H, H2, He, hydrocarbons and100
oxygen compounds), 549 reactions and 59 photodissociation processes. The list101
of reactions can also be provided upon request and will soon be included in the102
5

KIDA database (http://kida.obs.u-bordeaux1.fr/). The photodissociation rates103
have been computed with a mean zenith angle obtained from a subsolar point104
located at 20◦S a solar declination equal to −20◦. Their uncertainty factors105
have been set to FJ = 1.5 (Dobrijevic and Parisot, 1998).106
2.3. Uncertainty propagation107
The overall precision of photochemical models is highly sensitive to the un-108
certainties in the rate coefficients used in the chemical scheme. Since the conti-109
nuity equations are non-linear and strongly coupled, it is necessary to use global110
sensitivity methods to study how these uncertainties propagate in the photo-111
chemical model (Dobrijevic et al., 2010b). The present model is similar to the112
model used in Dobrijevic et al. (2010a). We used a Monte-Carlo approach to113
generate 500 profiles as a function of altitude. This number is a good com-114
promise between the computation time and the statistical significance of the115
distributions.116
3. 1D photochemical model results117
Figs. 3, 4 and 5 present, for each compound of interest, the 500 profiles118
generated by our Monte-Carlo procedure and the initial profile. Initial pro-119
files (black solid lines) correspond to profiles obtained with the initial chemical120
scheme and the nominal values of chemical rate constants. The type of distrib-121
ution of mole fractions depends on the compound and can vary with altitudes:122
distributions are not always normal or log-normal. In this case, quantiles are123
useful measures to represent the distributions. Figures show the 5th and 15th124
20-quantiles and the 1st and 19th 20-quantiles, which give the intervals contain-125
ing respectively 50% and 90% of the profiles. Uncertainty on the CH4 profile126
(due to uncertainties on reaction rate coefficients) is very low, much lower than127
the uncertainties of observations, because the CH4 profile is mainly controlled128
by the eddy diffusion coefficient. On the contrary, uncertainties on other profiles129
derived from the model are much greater than those of observations, especially130
for C3 and C4 compounds.131
6

The aim of the present study is to present a methodology to derive a very132
reduced chemical scheme, not to compare our model to all the previous obser-133
vations (taken at different times with different techniques and different spatial134
resolutions). In order to validate our initial scheme and our 1D photochemical135
model, we restrict the comparisons with recent data that correspond to the same136
latitude (around 20◦ S) and epoch (2006). In particular, the set of data pub-137
lished by Guerlet et al. (2009) and Guerlet et al. (2010) gives the opportunity138
to compare our model with consistent data acquired by the same instrument139
and analyzed with the same procedure.140
Taking uncertainties into account, our model is in relatively good agreement141
with CIRS observations at the subsolar point. All the observational data are142
within the 1st and 19th 20-quantiles of our model. This shows that chemical143
processes included in the initial chemical scheme and physical processes im-144
plemented in the model are representative of the main processes that govern145
the composition of Saturn’s stratosphere. To go deeper into the comparison of146
the model with CIRS data, it would be necessary to compare synthetic spec-147
tra generated from our Monte-Carlo profiles with the CIRS spectra. Such a148
work deserves a dedicated study. The aim here is not to adjust some model149
parameters to have a perfect agreement between the model and observations (if150
possible), but only to have a good agreement to construct a reliable reduced151
chemical scheme.152
4. Reduction methodology153
How to reduce a chemical scheme? A reduced chemical scheme is built by154
removing a set of reactions from the initial chemical scheme. Using this reduced155
chemical scheme, our 1D photochemical model should give results in agreement156
with the ones obtained with the initial chemical scheme. This agreement de-157
pends on a given criterion. Typically, the new results should remain close to a158
reference. Two reference results are then conceivable: results from a reference159
model and results from observations. Ideally, observations should be used as160
7

a reference but we see in figures 3, 4 and 5 that error bars of the model are161
greater than the error bars of observations. For this reason, a reference model162
has been preferred to a reference set of observables. The reference model is163
our 1D photochemical model that includes uncertainties propagation of rate164
constants.165
Since only a few compounds have been observed to date and only a part166
of the atmosphere can be probed by various instruments, we have decided to167
limit the criterion presented above to a given list of compounds and we focus our168
study in the part of the atmosphere which lies between the 1 bar and 10−5 mbar169
pressure levels. The list of compounds corresponds to the ones that have been170
already detected in the atmosphere: CH3, CH4, C2H2, C2H4, C2H6, CH3C2H,171
C3H8 and C4H2 (with the exception of C6H6 for reasons detailed below).172
The strength of the relationship between outputs (mole fractions) and in-173
puts (rate constants) can be evaluated by Rank Correlation Coefficients (RCCs)174
in the presence of non-linearity in the model. RCCs convert a nonlinear but175
monotonic relationship into a linear relationship by replacing the values of the176
sampled inputs/outputs by their respective ranks. These correlation coefficients177
can vary between -1 and 1; a positive value means that both correlated para-178
meters increase or decrease simultaneously. In the presence of nonlinear but179
monotonic correlations, this simple procedure improves the resolution of sensi-180
tivity analysis (Helton et al., 2006).181
In practice, RCCs are calculated using the logarithm of mole fractions and182
rate constants. Rate constants with low RCCs (in absolute value) have weak183
influence on the uncertainty of the mole fraction of a given compound. Removing184
these reactions will have very little influence on the results of the model. This185
means that below a given threshold (a given value of RCC), all the reactions can186
be removed. The lower the RCC threshold, the greater the number of reactions187
and compounds that remain in the reduced chemical scheme. Our criterion to188
validate a reduced chemical scheme was the reproduction of a reference model189
within a certain confidence interval. The confidence interval may be given by the190
5th and 15th 20-quantiles or the 1st and 19th 20-quantiles for instance (this is191
8
an arbitrary choice). The profiles of each target molecule should stay within the192
confidence interval to consider the current reduced scheme as suitable. In the193
following, the confidence interval is given by the 1st and 19th 20-quantiles in the194
part of the atmosphere where the compounds are observed. The determination195
of an optimal RCC threshold (which would give the most satisfactory reduced196
scheme) is an empirically iterative procedure that can be tiresome since the new197
reduced chemical scheme must be tested for each value of the RCC threshold.198
A slight modification of this threshold can add or remove a few reactions in199
the reduced chemical scheme. We have noticed, moreover, that the number of200
runs in the Monte Carlo procedure can affect this ”optimal threshold”. As a201
consequence, in order to limit the number of runs and tests, we did not make202
an exhaustive study to search for the ”optimal RCC threshold”.203
The RCCs between mole fractions and rate constants combine the informa-204
tion of the main influent pathways in the chemical scheme, weighted by their205
uncertainties. A first attempt has been made using the RCCs computed with206
the 500 mole fraction profiles and the corresponding rate constants presented207
previously. One limitation with this method, as stated by Carrasco et al. (2008),208
is that uncertainty factors of some rate coefficients are very important, which209
increase the intrinsic importance of some reactions. This methodology is well210
adapted to derive the key reactions of the chemical scheme (Dobrijevic et al.,211
2010b), but not to construct a reduced scheme. For instance, we were not able to212
find an interesting reduced scheme for C3H4 and C4H2. Too many compounds213
and reactions were necessary to produce vertical profiles in agreement with the214
reference model for these two compounds. This explains also why we did not215
include C6H6 in our model. The other reason is that the chemistry of C4, C5216
and C6 compounds is not well known. In particular, many reactions and com-217
pounds are lacking in the initial chemical scheme (see for instance Dobrijevic218
and Dutour 2007). Consequently, we consider that it is not pertinent to search219
for a reduced scheme that matches the vertical profile of C6H6.220
In a second attempt, we set all the uncertainty factors to a given value F .221
Carrasco et al. (2008) stated that the value of F does not change significantly222
9
the reduced schemes. We chose F = 1.5 for all photodissociation processes223
and reactions. We have generated 500 profiles using a Monte-Carlo procedure224
and then computed the RCCs for all the compounds we were interested in225
and all the reaction rates. After a few attempts, we set the RCCs threshold226
to 0.2. This led us to a reduced scheme with 33 compounds and 54 reactions227
(including photolysis). Four compounds of this scheme were not produced (they228
appeared only as a reactant) and thus were removed from the scheme. Thirteen229
compounds did not appear as a reactant, but only as a product. Some of230
these sink compounds were relatively abundant (compared to the compounds of231
interest) and were then removed, as well as their corresponding reactions. It was232
not possible to remove all the sinks because too many reactions were concerned.233
However, sink compounds with low mole fractions do not alter the abundance234
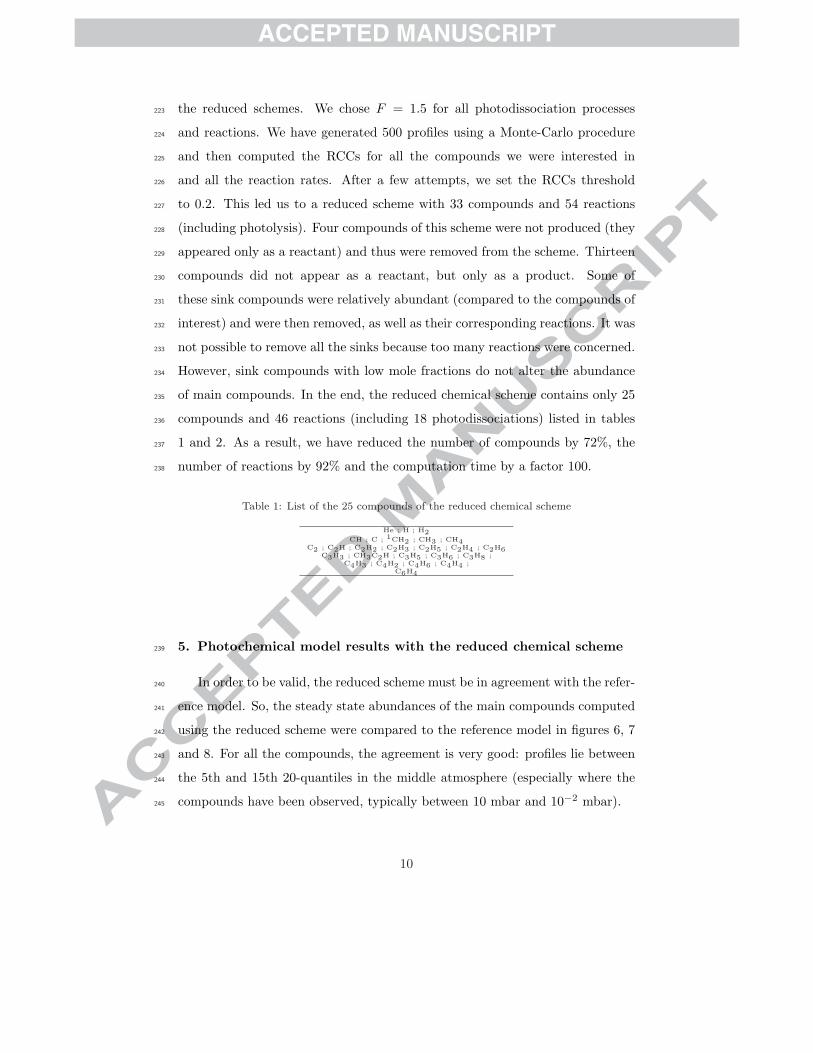
of main compounds. In the end, the reduced chemical scheme contains only 25235
compounds and 46 reactions (including 18 photodissociations) listed in tables236
1 and 2. As a result, we have reduced the number of compounds by 72%, the237
number of reactions by 92% and the computation time by a factor 100.238
Table 1: List of the 25 compounds of the reduced chemical scheme
He ; H ; H2CH ; C ; 1CH2 ; CH3 ; CH4
C2 ; C2H ; C2H2 ; C2H3 ; C2H5 ; C2H4 ; C2H6C3H3 ; CH3C2H ; C3H5 ; C3H6 ; C3H8 ;
C4H3 ; C4H2 ; C4H6 ; C4H4 ;C6H4
5. Photochemical model results with the reduced chemical scheme239
In order to be valid, the reduced scheme must be in agreement with the refer-240
ence model. So, the steady state abundances of the main compounds computed241
using the reduced scheme were compared to the reference model in figures 6, 7242
and 8. For all the compounds, the agreement is very good: profiles lie between243
the 5th and 15th 20-quantiles in the middle atmosphere (especially where the244
compounds have been observed, typically between 10 mbar and 10−2 mbar).245
10

Table 2: Reduced chemical scheme: Photolysis reactions (R1 to R18) and chemical reactions(R19 to R46). Rate constants, cross sections, photolysis rates and uncertainty factors aregiven in Hebrard et al. (2006) and Hebrard et al. (2009).
R1 H2 + hν → H + HR2 CH4 + hν → CH3 + HR3 CH4 + hν → 1CH2 + H2R4 CH4 + hν → CH + H2 + HR5 CH3 + hν → 1CH2 + HR6 C2H2 + hν → C2H + HR7 C2H4 + hν → C2H2 + H2R8 C2H4 + hν → C2H2 + H + HR9 C2H6 + hν → C2H4 + H2R10 C2H6 + hν → C2H4 + H + HR11 C2H6 + hν → C2H2 + H2 + H2R12 CH3C2H + hν → C3H3 + HR13 C3H8 + hν → C3H6 + H2R14 C4H2 + hν → C2H2 + C2R15 C4H4 + hν → C4H2 + H2R16 C3H6 + hν → C3H5 + HR17 C4H6 + hν → C4H4 + H2R18 C4H6 + hν → C2H4 + C2H2
R19 H + CH → C + H2R20 H + C2H3 → C2H2 + H2R21 H + C2H5 → CH3 + CH3R22 H + C3H5 → CH3C2H + H2R23 C + C2H4 → C3H3 + HR24 C + CH3C2H → C4H3 + HR25 CH + CH4 → C2H4 + HR26 1CH2 + H2 → CH3 + HR27 1CH2 + CH4 → CH3 + CH3R28 1CH2 + C2H5 → C3H6 + HR29 C2H + H2 → C2H2 + HR30 C2H + CH4 → C2H2 + CH3R31 C2H + C2H2 → C4H2 + HR32 C2H3 + H2 → C2H4 + HR33 C2H3 + C2H5 → C2H4 + C2H4R34 C2H3 + C4H2 → C6H4 + HR35 H + CH3 + M → CH4 + MR36 H + C2H2 + M → C2H3 + MR37 H + C2H3 + M → C2H4 + MR38 H + C2H4 + M → C2H5 + MR39 H + C3H3 + M → CH3C2H + MR40 H + CH3C2H + M → CH3 + C2H2 + MR41 H + CH3C2H + M → C3H5 + MR42 H + C3H5 + M → C3H6 + MR43 CH3 + CH3 + M → C2H6 + MR44 CH3 + C2H5 + M → C3H8 + MR45 CH3 + C3H3 + M → C4H6 + MR46 H + H + M → H2 + M
Fig. 9 shows that the agreement for C4H2 between the reduced model and246
the reference model is limited to pressure levels lower than about 10−3 mbar.247
The mole fraction of CH3C2H (Fig. 8) obtained with the reduced model is not248
in agreement with the initial model for pressure levels greater than about 10249
mbar. So, the reduced chemical scheme proposed here is not perfect since it250
does not produce profiles of CH3C2H and C4H2 that are reliable in the whole251
part of the atmosphere studied here. Since high pressure and low pressure levels252
are poorly constrained by observations, this discrepancy seems acceptable. If253
necessary, it is of course possible to improve the situation by lowering the RCC254
threshold. This would lead to a less reduced chemical scheme.255
6. Discussion256
How to use this reduced scheme? A priori, the chemical scheme provided here257
should be used with the same rate constants as the ones we used (see Hebrard258
et al. 2006; Hebrard et al. 2009). However, if the initial chemical scheme have to259
be changed (because some rate coefficients or uncertainty factors have to be up-260
11

dated or some reactions have to be added), it is necessary to redo the procedure261
presented in this paper to build a new reduced scheme. In particular, J. Moses262
pointed out (personal communication) that the rate coefficient of reaction R34263
might be overestimated (and that our uncertainty factor is underestimated). A264
particular attention might be paid on this reaction in a future update of the265
chemical scheme. Also, the methodology presented here gives a reduced scheme266
with several sink compounds (with no destruction mechanisms). Although we267
have eliminated most of these compounds, it is not possible to eliminate all the268
reactions that involve sink compounds without changing significantly the results.269
As a consequence, users of 2D/3D photochemical models should take care of the270
presence of sink compounds by adding appropriate destruction mechanisms.271
Is the reduced scheme suitable for other latitudes? The aim of this reduced272
scheme is to be used in 2D/3D photochemical models. In order to test the valid-273
ity of our reduced chemical scheme, we have made a comparison of the model re-274
sults derived from the initial chemical scheme and the reduced chemical scheme275
at different latitudes. Our reference model corresponds to the subsolar point at276
20◦ S. We have tested 2 other latitudes: 60◦S and 40◦S. For these tests, only277
the solar zenith angle has been changed (we used the same temperature profile).278
For all compounds, the behavior of the model is the same whatever the chemical279
scheme used. An example is shown in Fig. 10 for C3H8. Other compounds are280
even less affected by variation of the solar zenith angle. To be fully satisfying,281
the validation should take into account the fact that temperature profiles also282
vary with latitudes. For instance, Cassini data show that the temperature pro-283
file measured at 60◦S is about 10 K higher than at 20◦S (Guerlet et al., 2009).284
It would be interesting to study how uncertainties of rate constants propagate285
in the photochemical model when considering different temperature profiles and286
solar zenith angles. One limitation we see is that many reaction rates have no287
temperature dependence in our initial chemical scheme (because this tempera-288
ture dependence is not known). It is essential to have a good description of the289
chemistry as a function of temperature to see a possible variation of error bars290
of the model as a function of latitude. To do that, it would be necessary to291
12

improve our chemical scheme in order to estimate the temperature dependence292
of many reaction rates and to estimate their uncertainty factors. This kind of293
work is beyond the scope of the present study.294
Can we find a minimal chemical scheme? The reduced chemical scheme295
presented here is not a minimal chemical scheme. To obtain a minimal scheme296
from the reduced one, we might remove some additional reactions depending on297
their RCCs. We could first remove one reaction at a time and check sequentially298
the 46 reactions of the reduced scheme. If a reaction could be removed, then we299
could try to remove another reaction and repeat this procedure as long as the300
model results would be in agreement with the reference model. However, in such301
a non-linear system, different sequences of removal might give different results.302
As a consequence, a great number of runs are necessary to achieve this task.303
Actually, since the initial chemical scheme is expected to be updated frequently,304
we find it useless to try to find a minimal chemical scheme.305
7. Conclusion306
One major step in the development of 2D and 3D photochemical models is307
to determine a chemical scheme that is both simple (i.e. it contains a small308
number of compounds and reactions) and valid (i.e. the results of the model are309
in agreement with a reference model). In the present paper, we have presented310
a methodology to build a reduced chemical scheme. The reference model is311
a 1D photochemical model that includes uncertainties of rate coefficients. The312
screening of the chemical scheme is based on the correlations between outputs of313
the model (mole fractions) and the inputs (rate coefficients). This methodology314
is quite similar to the one used to determine key reactions of a photochemical315
model (Dobrijevic et al., 2010a). We found a reduced chemical scheme where316
about 70% of the compounds and 90% of the reactions have been removed from317
the initial chemical scheme.318
It is not guaranteed that the reduced chemical scheme derived here for Saturn319
is well adapted for other giant planets and Titan. As a consequence, this work320
13
should be done again for other planets to check this specific point. Also, this321
work should be done again if the reference chemical scheme is different from the322
one used in the present study.323
Acknowledgements324
T. Cavalie wishes to acknowledge for funding from the Centre National325
d’Etudes Spatiales (CNES).326
References327
Carrasco, N., Plessis, S., Dobrijevic, M., Pernot, P., 2008. Toward a Reduction of328
the Bimolecular Reaction Model for Titan’s Ionosphere. International Journal329
of Chemical Kinetics 40 (11), 699–709.330
Cavalie, T., Billebaud, F., Dobrijevic, M., Fouchet, T., Lellouch, E., Encrenaz,331
T., Brillet, J., Moriarty-Schieven, G. H., Wouterloot, J. G. A., Hartogh, P.,332
2009. First observation of CO at 345 GHz in the atmosphere of Saturn with333
the JCMT: New constraints on its origin. Icarus 203, 531–540.334
Cavalie, T., Hartogh, P., Billebaud, F., Dobrijevic, M., Fouchet, T., Lellouch,335
E., Encrenaz, T., Brillet, J., Moriarty-Schieven, G. H., 2010. A cometary336
origin for CO in the stratosphere of Saturn? Astronomy and Astrophysics337
510, A88.338
Conrath, B. J., Gautier, D., 2000. Saturn Helium Abundance: A Reanalysis of339
Voyager Measurements. Icarus 144, 124–134.340
Dobrijevic, M., Cavalie, T., Hebrard, E., Billebaud, F., Hersant, F., Selsis, F.,341
2010a. Key reactions in the photochemistry of hydrocarbons in Neptune’s342
stratosphere. Planetary and Space Science 58, 1555–1566.343
Dobrijevic, M., Dutour, I., 2007. The distribution of hydrocarbons in Titan’s344
atmosphere: An evolutionary algorithm-based model. Planetary and Space345
Science 55, 2128–2136.346
14
Dobrijevic, M., Hebrard, E., Plessis, S., Carrasco, N., Pernot, P., Bruno-Claeys,347
M., 2010b. Comparison of methods for the determination of key reactions348
in chemical systems: Application to Titan’s atmosphere. Advances in Space349
Research 45, 77–91.350
Dobrijevic, M., Parisot, J. P., 1998. Effect of chemical kinetics uncertainties on351
hydrocarbon production in the stratosphere of Neptune. Planetary and Space352
Science 46, 491–505.353
Festou, M. C., Atreya, S. K., 1982. Voyager ultraviolet stellar occultation mea-354
surements of the composition and thermal profiles of the Saturnian upper355
atmosphere. Geophysical Research Letters 9, 1147–1150.356
Flasar, F. M., Achterberg, R. K., Conrath, B. J., Pearl, J. C., Bjoraker, G. L.,357
Jennings, D. E., Romani, P. N., Simon-Miller, A. A., Kunde, V. G., Nixon,358
C. A., Bezard, B., Orton, G. S., Spilker, L. J., Spencer, J. R., Irwin, P. G. J.,359
Teanby, N. A., Owen, T. C., Brasunas, J., Segura, M. E., Carlson, R. C.,360
Mamoutkine, A., Gierasch, P. J., Schinder, P. J., Showalter, M. R., Ferrari, C.,361
Barucci, A., Courtin, R., Coustenis, A., Fouchet, T., Gautier, D., Lellouch, E.,362
Marten, A., Prange, R., Strobel, D. F., Calcutt, S. B., Read, P. L., Taylor,363
F. W., Bowles, N., Samuelson, R. E., Abbas, M. M., Raulin, F., Ade, P.,364
Edgington, S., Pilorz, S., Wallis, B., Wishnow, E. H., 2005. Temperatures,365
Winds, and Composition in the Saturnian System. Science 307, 1247–1251.366
Fletcher, L. N., Orton, G. S., Teanby, N. A., Irwin, P. G. J., Bjoraker, G. L.,367
2009. Methane and its isotopologues on Saturn from Cassini/CIRS observa-368
tions. Icarus 199, 351–367.369
Fouchet, T., Guerlet, S., Strobel, D. F., Simon-Miller, A. A., Bezard, B., Flasar,370
F. M., 2008. An equatorial oscillation in Saturn’s middle atmosphere. Nature371
453, 200–202.372
Greathouse, T. K., Lacy, J. H., Bezard, B., Moses, J. I., Griffith, C. A., Richter,373
M. J., 2005. Meridional variations of temperature, C2H2 and C2H6 abun-374
15
dances in Saturn’s stratosphere at southern summer solstice. Icarus 177, 18–375
31.376
Greathouse, T. K., Lacy, J. H., Bezard, B., Moses, J. I., Richter, M. J., Knez,377
C., 2006. The first detection of propane on Saturn. Icarus 181, 266–271.378
Guerlet, S., Fouchet, T., Bezard, B., Moses, J. I., Fletcher, L. N., Simon-Miller,379
A. A., Michael Flasar, F., 2010. Meridional distribution of CH3C2H and380
C4H2 in Saturn’s stratosphere from CIRS/Cassini limb and nadir observa-381
tions. Icarus 209, 682–695.382
Guerlet, S., Fouchet, T., Bezard, B., Simon-Miller, A. A., Michael Flasar, F.,383
2009. Vertical and meridional distribution of ethane, acetylene and propane384
in Saturn’s stratosphere from CIRS/Cassini limb observations. Icarus 203,385
214–232.386
Hartogh, P., Lellouch, E., Crovisier, J., Banaszkiewicz, M., Bensch, F., Bergin,387
E. A., Billebaud, F., Biver, N., Blake, G. A., Blecka, M. I., Blommaert, J.,388
Bockelee-Morvan, D., Cavalie, T., Cernicharo, J., Courtin, R., Davis, G.,389
Decin, L., Encrenaz, P., Encrenaz, T., Gonzalez, A., de Graauw, T., Hut-390
semekers, D., Jarchow, C., Jehin, E., Kidger, M., Kuppers, M., de Lange, A.,391
Lara, L., Lis, D. C., Lorente, R., Manfroid, J., Medvedev, A. S., Moreno, R.,392
Naylor, D. A., Orton, G., Portyankina, G., Rengel, M., Sagawa, H., Sanchez-393
Portal, M., Schieder, R., Sidher, S., Stam, D., Swinyard, B., Szutowicz, S.,394
Thomas, N., Thornhill, G., Vandenbussche, B., Verdugo, E., Waelkens, C.,395
Walker, H., 2009. Water and related chemistry in the solar system. A guar-396
anteed time key programme for Herschel. Planetary and Space Science 57,397
1596–1606.398
Hebrard, E., Dobrijevic, M., Benilan, Y., Raulin, F., 2006. Photochemical ki-399
netics uncertainties in modeling Titan’s atmosphere: a review. Journal of400
Photochemistry and Photobiology C: Photochemistry Reviews 7, 211–230.401
Hebrard, E., Dobrijevic, M., Pernot, P., Carrasco, N., Bergeat, A., Hickson,402
K. M., Canosa, A., Le Picard, S. D., Sims, I. R., 2009. How Measurements403
16

of Rate Coefficients at Low Temperature Increase the Predictivity of Pho-404
tochemical Models of Titan’s Atmosphere. Journal of Physical Chemistry405
113 (42), 11227–11237.406
Helton, J., Johnson, J., Sallaberry, C., Storlie, C., 2006. Survey of sampling-407
based methods for uncertainty and sensitivity analysis. Reliability Engineer-408
ing and System Safety 91, 1175–1209.409
Hesman, B. E., Jennings, D. E., Sada, P. V., Bjoraker, G. L., Achterberg, R. K.,410
Simon-Miller, A. A., Anderson, C. M., Boyle, R. J., Nixon, C. A., Fletcher,411
L. N., McCabe, G. H., 2009. Saturn’s latitudinal C2H2 and C2H6 abundance412
profiles from Cassini/CIRS and ground-based observations. Icarus 202, 249–413
259.414
Howett, C. J. A., Irwin, P. G. J., Teanby, N. A., Simon-Miller, A., Calcutt,415
S. B., Fletcher, L. N., de Kok, R., 2007. Meridional variations in stratospheric416
acetylene and ethane in the southern hemisphere of the saturnian atmosphere417
as determined from Cassini/CIRS measurements. Icarus 190, 556–572.418
Moses, J. I., Fouchet, T., Bezard, B., Gladstone, G. R., Lellouch, E., Feuchtgru-419
ber, H., 2005. Photochemistry and diffusion in Jupiter’s stratosphere: Con-420
straints from ISO observations and comparisons with other giant planets.421
Journal of Geophysical Research (Planets) 110 (E8), E08001.422
Moses, J. I., Lellouch, E., Bezard, B., Gladstone, G. R., Feuchtgruber, H., Allen,423
M., 2000. Photochemistry of Saturn’s Atmosphere. II. Effects of an Influx of424
External Oxygen. Icarus 145, 166–202.425
Smith, G. R., Shemansky, D. E., Holberg, J. B., Broadfoot, A. L., Sandel, B. R.,426
McConnell, J. C., 1983. Saturn’s upper atmosphere from the Voyager 2 EUV427
solar and stellar occultations. Journal of Geophysical Research 88, 8667–8678.428
Smith, H. T., Johnson, R. E., Perry, M. E., Mitchell, D. G., McNutt, R. L.,429
Young, D. T., 2010. Enceladus plume variability and the neutral gas densities430
17

in Saturn’s magnetosphere. Journal of Geophysical Research (Space Physics)431
115 (A14), A10252.432
18
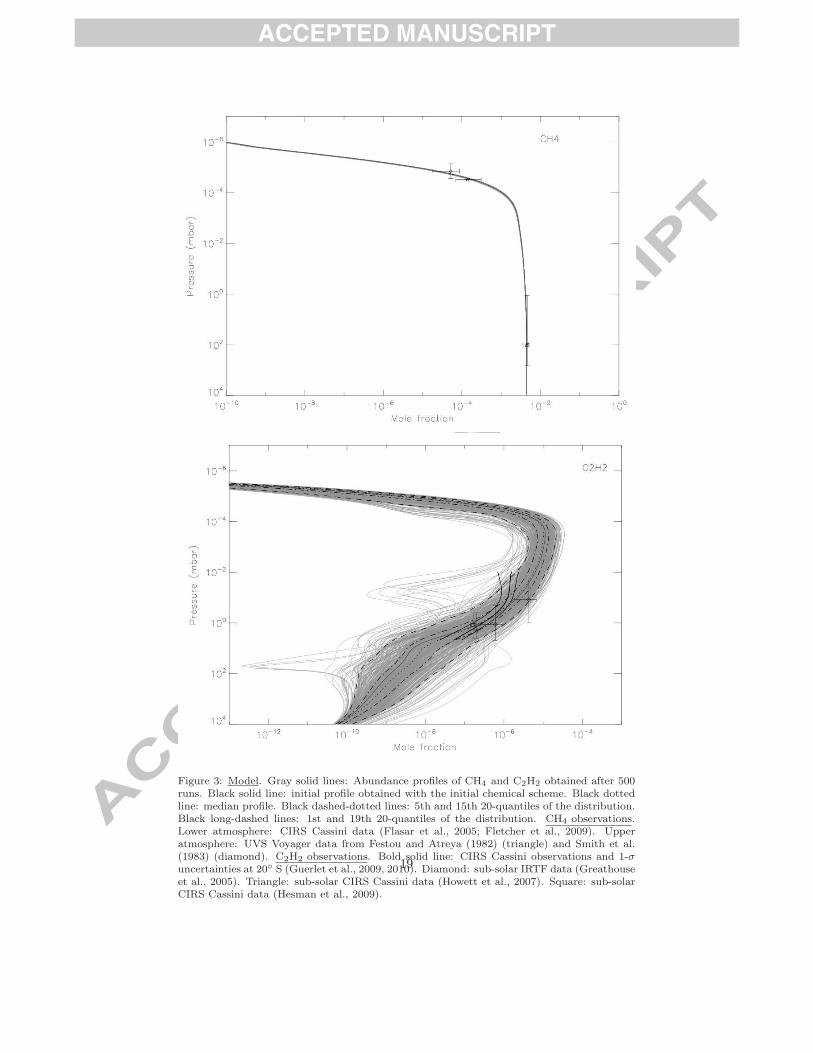
Figure 3: Model. Gray solid lines: Abundance profiles of CH4 and C2H2 obtained after 500runs. Black solid line: initial profile obtained with the initial chemical scheme. Black dottedline: median profile. Black dashed-dotted lines: 5th and 15th 20-quantiles of the distribution.Black long-dashed lines: 1st and 19th 20-quantiles of the distribution. CH4 observations.Lower atmosphere: CIRS Cassini data (Flasar et al., 2005; Fletcher et al., 2009). Upperatmosphere: UVS Voyager data from Festou and Atreya (1982) (triangle) and Smith et al.(1983) (diamond). C2H2 observations. Bold solid line: CIRS Cassini observations and 1-σuncertainties at 20◦ S (Guerlet et al., 2009, 2010). Diamond: sub-solar IRTF data (Greathouseet al., 2005). Triangle: sub-solar CIRS Cassini data (Howett et al., 2007). Square: sub-solarCIRS Cassini data (Hesman et al., 2009).
19

Figure 4: Model. Gray solid lines: Abundance profiles of C2H6 and CH3C2H obtainedafter 500 runs. Black solid line: initial profile obtained with the initial chemical scheme.Black dotted line: median profile. Black dashed-dotted lines: 5th and 15th 20-quantilesof the distribution. Black long-dashed lines: 1st and 19th 20-quantiles of the distribution.C2H6 observations. Bold solid line: CIRS Cassini observations and 1-σ uncertainties at 20◦S (Guerlet et al., 2009, 2010). Diamond: sub-solar IRTF data (Greathouse et al., 2005).Triangle: sub-solar CIRS Cassini data (Howett et al., 2007). Square: sub-solar CIRS Cassinidata (Hesman et al., 2009). C3H4 observations. Bold solid line: CIRS Cassini observationsand 1-σ uncertainties at 20◦ S (Guerlet et al., 2009, 2010).
20
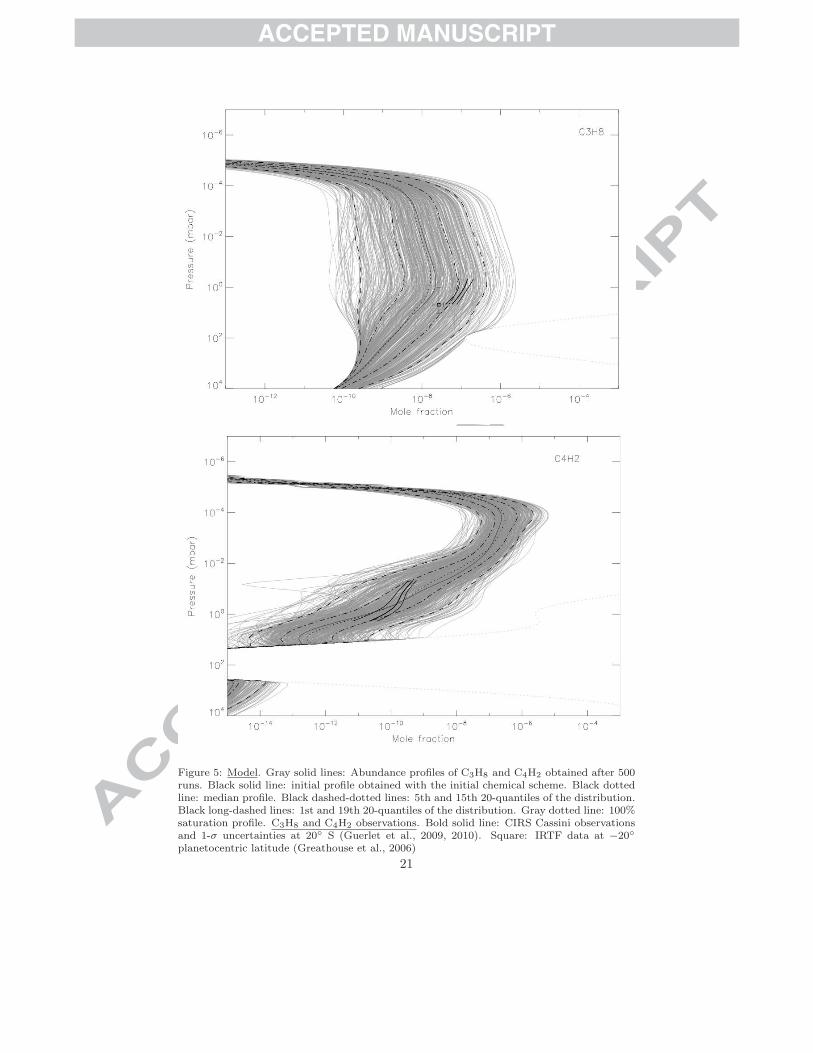
Figure 5: Model. Gray solid lines: Abundance profiles of C3H8 and C4H2 obtained after 500runs. Black solid line: initial profile obtained with the initial chemical scheme. Black dottedline: median profile. Black dashed-dotted lines: 5th and 15th 20-quantiles of the distribution.Black long-dashed lines: 1st and 19th 20-quantiles of the distribution. Gray dotted line: 100%saturation profile. C3H8 and C4H2 observations. Bold solid line: CIRS Cassini observationsand 1-σ uncertainties at 20◦ S (Guerlet et al., 2009, 2010). Square: IRTF data at −20◦planetocentric latitude (Greathouse et al., 2006)
21

Figure 6: Red line: Abundance profiles of CH3 and C2H2 with the reduced chemical scheme.Blue line: initial profile obtained with the initial chemical scheme. Black dotted line: medianprofile. Black dashed-dotted lines: 5th and 15th 20-quantiles of the distribution. Black long-dashed lines: 1st and 19th 20-quantiles of the distribution.
22
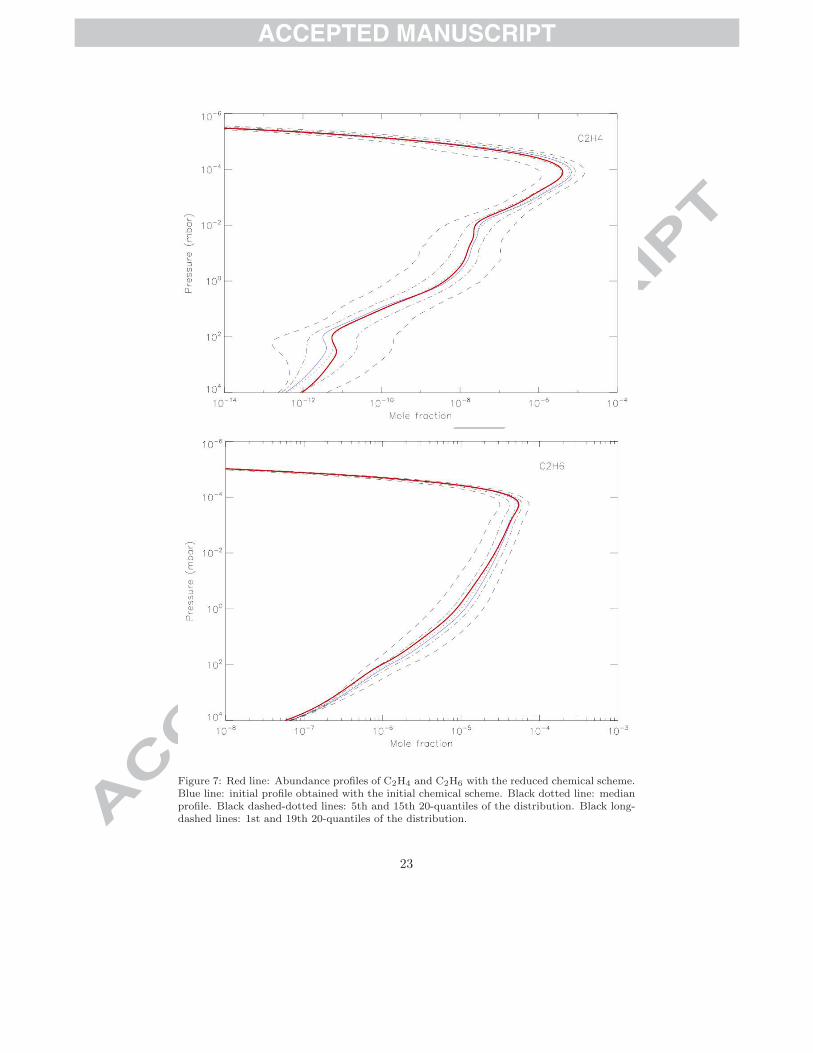
Figure 7: Red line: Abundance profiles of C2H4 and C2H6 with the reduced chemical scheme.Blue line: initial profile obtained with the initial chemical scheme. Black dotted line: medianprofile. Black dashed-dotted lines: 5th and 15th 20-quantiles of the distribution. Black long-dashed lines: 1st and 19th 20-quantiles of the distribution.
23

Figure 8: Red line: Abundance profiles of CH3C2H and C3H8 with the reduced chemicalscheme. Blue line: initial profile obtained with the initial chemical scheme. Black dottedline: median profile. Black dashed-dotted lines: 5th and 15th 20-quantiles of the distribution.Black long-dashed lines: 1st and 19th 20-quantiles of the distribution.
24

Figure 9: Red line: Abundance profiles of C4H2 with the reduced chemical scheme. Blue line:initial profile obtained with the initial chemical scheme. Black dotted line: median profile.Black dashed-dotted lines: 5th and 15th 20-quantiles of the distribution. Black long-dashedlines: 1st and 19th 20-quantiles of the distribution.
25

Figure 10: Abundance profiles of C3H8 for different latitudes. Black lines: Initial chemicalscheme. Gray lines: Reduced chemical scheme. The mean solar zenith angle correspondingto 20◦ S, 40◦ S and 60◦ S are respectively 51◦, 54◦ and 63◦.
26

> This study concerns photochemistry of hydrocarbons in the atmosphere of Saturn.
> We present a methodology to derive a very reduced chemical scheme that can be used in
future 2D (or 3D) photochemical models.
> Our reduced scheme of 25 compounds and 46 reactions gives similar results, within the
error bars of the model, than a 1D photochemical model.