a microarray for assessing transcription from pelagic ... · pdf filea microarray for...
TRANSCRIPT
ORIGINAL ARTICLE
A microarray for assessing transcription frompelagic marine microbial taxa
Irina N Shilova1, Julie C Robidart1, H James Tripp2, Kendra Turk-Kubo1, Boris Wawrik3,Anton F Post4, Anne W Thompson5, Bess Ward6, James T Hollibaugh7, Andy Millard8,Martin Ostrowski8, David J Scanlan8, Ryan W Paerl9, Rhona Stuart10 and Jonathan P Zehr1
1Department of Ocean Sciences, University of California Santa Cruz, Santa Cruz, CA, USA; 2DOE JointGenome Institute, Walnut Creek, CA, USA; 3Department of Microbiology and Plant Biology, University ofOklahoma, Oklahoma, USA; 4Marine Biological Laboratory, Woods Hole, MA, USA; 5Advanced CytometryGroup, BD Biosciences, Seattle, WA, USA; 6Department of Geosciences, Princeton University, Princeton, NJ,USA; 7Department of Marine Sciences, University of Georgia, Athens, GA, USA; 8Department of MarineMicrobiology, University of Warwick, Coventry, UK; 9Marine Biology Research Division, University ofCalifornia San Diego, San Diego, CA, USA and 10Physical and Life Sciences, Lawrence Livermore NationalLaboratory, Livermore, CA, USA
Metagenomic approaches have revealed unprecedented genetic diversity within microbial commu-nities across vast expanses of the world’s oceans. Linking this genetic diversity with key metabolicand cellular activities of microbial assemblages is a fundamental challenge. Here we report on acollaborative effort to design MicroTOOLs (Microbiological Targets for Ocean ObservingLaboratories), a high-density oligonucleotide microarray that targets functional genes of diversetaxa in pelagic and coastal marine microbial communities. MicroTOOLs integrates nucleotidesequence information from disparate data types: genomes, PCR-amplicons, metagenomes, andmetatranscriptomes. It targets 19 400 unique sequences over 145 different genes that are relevant tostress responses and microbial metabolism across the three domains of life and viruses.MicroTOOLs was used in a proof-of-concept experiment that compared the functional responsesof microbial communities following Fe and P enrichments of surface water samples from the NorthPacific Subtropical Gyre. We detected transcription of 68% of the gene targets across majortaxonomic groups, and the pattern of transcription indicated relief from Fe limitation and transitionto N limitation in some taxa. Prochlorococcus (eHLI), Synechococcus (sub-cluster 5.3) andAlphaproteobacteria SAR11 clade (HIMB59) showed the strongest responses to the Fe enrichment.In addition, members of uncharacterized lineages also responded. The MicroTOOLs microarrayprovides a robust tool for comprehensive characterization of major functional groups of microbes inthe open ocean, and the design can be easily amended for specific environments and researchquestions.The ISME Journal (2014) 8, 1476–1491; doi:10.1038/ismej.2014.1; published online 30 January 2014Subject Category: Integrated genomics and post-genomics approaches in microbial ecologyKeywords: marine; microbial; microarray; transcription; molecular
Introduction
Marine microbial communities are complex, com-posed of diverse groups of Bacteria, Archaea, Eukar-yotes and viruses. Molecular techniques frequentlyused in marine microbial ecology have shown strain-specific differences in genetic capabilities and tran-scriptional responses among the most abundantrepresentatives of microbial communities (Fuhrmanet al., 2006; Giovannoni and Vergin, 2012). Clades of
Prochlorococcus in the North Atlantic have morephosphorus-acquisition strategies than clades in theNorth Pacific, as an adaptation to chronic phosphatelimitation (Coleman and Chisholm, 2010). Coastalclades of Synechococcus have higher number ofregulatory systems and the use for metals than openocean clades, the latter being adapted to relativelyconstant oligotrophic conditions (Palenik et al.,2006). To link ocean processes to microbial meta-bolism and to build better models for predictingresponses to future ocean states (Azam and Malfatti,2007), in light of this strain-level heterogeneity, newresearch tools are needed that assess individual andmicrobial community responses.
Microarray technology can complement more com-monly used molecular techniques, such as PCR and
Correspondence: IN Shilova, Department of Ocean Sciences,University of California Santa Cruz, 1156 High Street, Santa Cruz,CA 95064, USA.E-mail: [email protected] 29 May 2013; revised 16 December 2013; accepted 31December 2013; published online 30 January 2014
The ISME Journal (2014) 8, 1476–1491& 2014 International Society for Microbial Ecology All rights reserved 1751-7362/14
www.nature.com/ismej
next-generation sequencing, to provide cost-effectivehigh-throughput gene and transcript detection fromseveral organisms in a single sample. Microarrayshave the advantages of sample replication, standardi-zation and robust interpretations of strain-level varia-tion in functional gene transcriptional patterns andlend themselves to better comparative quantificationof specific genes and transcripts, especially in rareorganisms.
Phylogenetic and functional microarrays havebeen developed and used for identification ofmicroorganisms and their activity in diverse environ-ments. The most comprehensive microbial functionalmicroarray to date, the GeoChip 4.0, targets 410 000sequences represented by 150 genes mainly fromsoil microbial communities and reduction–oxidation processes (He et al., 2007, 2010; Baiet al., 2013; Zhou et al., 2013). In addition tocontaminated soils, acid mine drainage sites andAntarctic soils (Yergeau et al., 2007; Mason et al.,2010; Xie et al., 2011), the GeoChip has been appliedto detect microbial DNA and RNA in the marineenvironment (Lu et al., 2012; Wawrik et al., 2012).Aside from the PhyloChip, which targets 16S rRNAgenes (Brodie et al., 2006), existing microarraystarget a specific genus (Rinta-Kanto et al., 2011), aparticular process (Tiquia et al., 2004; Moisanderet al., 2006, 2007; Ward et al., 2007; Bulow et al.,2008; Wu et al., 2008; Bouskill et al., 2011; Abellet al., 2012) or ecosystem (Rich et al., 2008; Smithet al., 2010; Rich et al., 2011). A comprehensivemicroarray that targets functional genes acrossdiverse pelagic marine microbial communities hasnot yet been reported.
Various strategies have been used to overcome thelack of a priori knowledge of genomic sequences intarget communities, which is a major limitation inthe design of an environmental microarray. Themost common strategy is to search public nucleotide(nt) sequence databases (such as National Center forBiotechnology Information (NCBI)) using key words(Rhee et al., 2004; He et al., 2007; Wu et al., 2008; Heet al., 2010; Smith et al., 2010). The resulting datasets, however, typically do not resemble the naturaldiversity of target genes, a problem that is exacer-bated in undersampled environments. A secondcommon strategy is to PCR-amplify a gene of interestand then either spot the products on a glass surface(Wu et al., 2001) or use the derived sequence data inthe design of oligonucleotide probes. Although thistechnique results in a fingerprint for an uncharac-terized community and is especially valuable forrare targets (Taroncher-Oldenburg et al., 2003;Moisander et al., 2006; Ward et al., 2007; Bulowet al., 2008), the time-consuming cloning processmakes this approach suitable for studying only alimited number of genes. The large nt databasesobtained with next-generation sequencing (meta-genomics) present an additional opportunity toaccess a cross-section of the diversity of a markergene in natural populations.
Here, we report the design and application of ahigh-density oligonucleotide microarray, referred toas the MicroTOOLs (Microbiological Targets forOcean Observing Laboratories) microarray, whichtargets 19 400 sequences across 145 genes associatedwith open ocean and coastal microbial communities.The microarray is based on existing data fromgenomes, metagenomes, metatranscriptomes andPCR-based assays and targets functional genesresponsible for biogeochemical cycling and stressresponses characteristic of the oceanic photic zone.As a proof-of-concept experiment, we analyzedmicrobial community responses to nutrient enrich-ments of inorganic phosphate (P) or ferric iron (Fe)from the oligotrophic Station (Stn.) ALOHA in theNorth Pacific Subtropical Gyre (NPSG). The physics,chemistry and biology of this region is wellcharacterized (Karl and Lukas, 1996; White et al.,2007), and its microbial metagenome is well repre-sented in the nt sequence databases (DeLong et al.,2006; Frias-Lopez et al., 2008; Hewson et al., 2010).In the North Pacific, where N2 fixation is a majorsupply of nitrogen (Karl et al., 1997), phosphorusand iron can be the limiting nutrients for N2 fixationand primary production (Karl et al., 2001; Mooreet al., 2006; Grabowski et al., 2008; Karl and Letelier,2008; Watkins-Brandt et al., 2011). We hypothesizedthat if microbial taxa were Fe limited, Fe additionwould result in decreased transcription of iron-stress genes and increased transcription of genes forenergy, carbon and nitrogen metabolism. If micro-bial taxa were P limited, P addition would result indecreased transcription of P-stress genes andincreased transcription of genes for energy meta-bolism, DNA replication and cell division. However,we expected to see heterogeneous transcriptionalresponses from individual taxa owing to differencesin their genomic capabilities, nutrient requirementsand life strategies (Tolonen et al., 2006; Dupontet al., 2008; Ilikchyan et al., 2009; Stuart et al., 2009;Tetu et al., 2009; Kamennaya and Post, 2011;Thompson et al., 2011).
Materials and methods
Design of the MicroTOOLs microarrayTarget genes for oligonucleotide probe design wereselected based on existing knowledge of genemarkers that target microorganism interactions withtheir environment (for example, Lindell and Post,2001; Webb et al., 2001; Holtzendorff et al., 2002;Chen et al., 2004; Fuller et al., 2005; Dyhrman andHaley, 2006; Zehr et al., 2007; Orchard et al., 2009;Sebastian and Ammerman, 2009; Kamennaya andPost, 2011; Mosier and Francis, 2011; Paerl et al.,2011). Several genes for hypothetical proteins thatwere differentially expressed in response to specificstimuli in cultured marine microorganisms werealso included (Scanlan et al., 1996; Martiny et al.,2009; Shi et al., 2009; Tetu et al., 2009; Thompson
MicroTOOLs microarray for marine microbial taxaIN Shilova et al
1477
The ISME Journal

Table 1 Marker genes targeted in the MicroTOOLs microarray
Process Gene Annotation Counts Process Gene Annotation Counts
Carbon
metabolism
cdcA Cadmium containing carbonic
anhydrase
79 Nitrogen
metabolism
glnB N regulatory protein P-II 53
chpX CO2 hydration protein ChpX 5 hao Hydroxylamine oxidoreductase 103
dca1 Delta carbonic anhydrase 31 metC Cystathionine beta-lyase family pro-
tein involved in Al resistance
113
dxs 1-deoxy-D-xylulose-5-phosphate
synthase
29 narB Assimilatory nitrate reductase in
bacteria
224
fae Formaldehyde-activating enzyme 118 nifB Nitrogenase cofactor biosynthesis pro-
tein NifB
81
fhcD Formylmethanofuran-tetrahydro-
methanopterin formyltransferase
4 nifD nitrogenase reductase 95
gap Glyceraldehyde-3-phosphate
dehydrogenase
47 nifE Nitrogenase MoFe cofactor biosynth-
esis protein NifE
241
gidA Glucose-inhibited division protein A 152 nifH Nitrogenase iron protein NifH 92
icd Isocitrate dehydrogenase 313 nifK Nitrogenase molybdenum-iron protein
beta chain
265
mch Methenyltetrahydromethanopterin
cyclohydrolase
3 nifN Nitrogenase molybdenum-iron cofac-
tor biosynthesis protein NifN
21
mtdB Methylenetetrahydromethanopterin
dehydrogenase
55 nifO Nitrogenase-associated protein NifO 236
mxaF Methanol dehydrogenase 71 nifX Nitrogenase molybdenum–iron pro-
tein NifX
335
pmoA Methane monooxygenase 140 nirA ferredoxin-nitrite reductase 81
ppc Phosphoenolpyruvate carboxylase 104 nirS Dissimilatory nitrite reductase 159
prsA Ribose-phosphate pyrophosphokinase 275 nirX Homeobox domain, in the nirA operon 73
pyk Pyruvate kinase 163 NR Assimilatory nitrate reductase 227
rbcL RuBisCO 1 nrtP Nitrate transporter 98
sbtA Sodium-dependent bicarbonate
transporter
75 ntcA N limitation transcriptional regulator 195
zwf Glucose-6-phosphate dehydrogenase 41 slc17A Amino-acid transporter 540
Cell cycle and
replication
CwatDRAFT_
4045
Transposase CwatDRAFT_4045 41 Tery_2117 Hypothetical protein, expressed as nif 173
dnaA Replication-initiation protein 20 Tery_2900 Hypothetical protein, expressed as nif 476
dnaE DNA polymerase III, alpha subunit 110 Tery_4333 LysR family transcriptional regulator,
expressed as nif
11
elaC Ribonuclease Z 97 ure Urea transporter 229
ftsZ Cell division protein FtsZ 6 ureA Urease alpha subunit 53
kaiC Circadian clock protein KaiC 609 ureB Urease beta subunit 54
pol DNA polymerase 226 ureC Urease 11
recA Recombinase A 222 ureD Urease accessory protein UreD 755
rpoD RNA polymerase sigma factor 42 ureE Urease accessory protein UreE 282
sigA RNA polymerase sigma factors 401 ureF Urease accessory protein UreF 599
DMSP
metabolism
dddD DMSP CoA transferase 80 ureG Urease accessory protein UreG 482
dddL DMSP lyase 238 ureH Urease accessory protein UreH-like
protein
854
dddP DMSP lyase 30 ureX urease subunit 491
dddQ DMSP lyase 4 urtA Urea ABC transporter, substrate-bind-
ing protein
33
dmdA Dimethyl sulfoniopropionate
demethylase
35 Other
metabolisms
bop Proteorhodopsin 552
Energy
metabolism
coxA Cytochrome c oxidase subunit I 16 chrA Chromate transporter 276
coxB Cytochrome c oxidase subunit II 4 cobN Cobaltochelatase CobN 36
cpcB Phycocyanin, beta subunit 5 mopA Heme-binding region from putitive
Mn-oxidase
10
hupS Ni–Fe hydrogenase, small subunit
HupS
51 Other stresses mfs Multidrug efflux transporter, proline/
betaine transporter
374
ndhI NADH dehydrogenase subunit I 11 NiSOD Putative nickel-containing superoxide
dismutase precursor
468
petB Cytochrome b6f 154 NUDIX nudix hydrolase 22
psaA Photosystem I P700 chlorophyll a
apoprotein A1
149 phrB DNA photolyase 172
psaB Photosystem I P700 chlorophyll a
apoprotein A10
30 pip Proline iminopeptidase 177
psbA Photosystem II PsbA protein (D1) 5 pmm1148 EF-1 guanine nucleotide exchange 279
psbA1 Photosystem II PsbA protein (D1) 4 pmm1462 Conserved hypothetical protein
PMM1462
1
psbA2 Photosystem II PsbA protein (D1) 269 ptox Plastoquinol terminal oxidase 9
MicroTOOLs microarray for marine microbial taxaIN Shilova et al
1478
The ISME Journal

et al., 2011). A total of 145 genes provided molecularmarkers for metabolic and cellular processes(Table 1).
To obtain gene probes that adequately representenvironmental nt diversity, we searched all marinemetagenomic and metatranscriptomic databasesalong with sequences from clone libraries for knowngenes. For metagenomic and metatranscriptomicsearches, a seed amino-acid sequence data set wasbuilt for selected taxa (Supplementary Material) foreach targeted gene. This seed data set was used for aTBLASTN query against ‘All Sanger reads’ and ‘All454 reads’ in the Community Cyberinfrastructure forAdvanced Microbial Ecology Research and Analysis(CAMERA, http://camera.calit2.net/, Sun et al.,2011) with loose criteria: an E value cutoff of 1.0E-03 and up to 1000 hits per query. All TBLASTN hitswith lengths 4150 nt were used as queries inreciprocal BLASTX in CAMERA to confirm geneannotation. For this analysis, an E value cutoff of
1E-10 and 60% identity over a minimum 40 aminoacid alignment were used. Subsequent BLASTNsearches in CAMERA were used to retrieve corre-sponding taxonomic information. Sequences with485% identity over 100 nt alignment length totargeted marine microorganisms were selected. Taxo-nomic affiliation means that the target sequence hadthe highest similarity to a specific organism byBLASTN search against the ‘nr’ database. Thus, theaccuracy of affiliation to an organism depended ongene conservation and their representation insequence databases. NimbleGen technology allows5% nt mismatch in the whole probe region, thussequences within a range of 95–100% nt identity to thetarget gene were detected. We use the phrase ‘organ-ism-like genotype’ to refer to target gene affiliation if ntidentity of the target gene to this organism was o95%.After reciprocal BLAST, sequences originatingfrom metagenomic libraries that contained non-transcribed regions were trimmed at 50- and 30-ends
Table 1 (Continued )
Process Gene Annotation Counts Process Gene Annotation Counts
psbB Photosystem II PsbB protein (CP47) 262 sigII Type II alternative sigma-70 family
RNA polymerase sigma factor
5
Iron
metabolism
abc1 ABC1 superfamily protein 55 sodC Cu–Zn superoxide dismutase 1
cirA Ferric iron-catecholate outer mem-
brane transporter
6 Phosphorus
metabolism
acr3 Arsenite transport (efflux) 25
dpsA Ferritin-like diiron-binding domain 15 arsC Arsenate reductase 4
feoA Ferrous iron transport protein A 9 glpQ Glycerophosphoryl diester
phosphodiesterase
40
fepB ABC-type Fe3þ �hydroxamate
transport system
3 phnA Phosphonoacetate hydrolase 252
fepC ABC-type cobalamin/Fe3þ �siderophores transport systems
209 phnD Phosphonate transporter 1
fepD Fe3þ siderophore transport system 1035 phnJ Phosphonate lyase 173
fldA (isiB) Flavodoxin eukaryotic 3 phoA Alkaline phosphatase, Zn2þ binding 600
fldB Flavodoxin 217 phoD Alkaline phosphatase 2
fur Ferric transcriptional regulator 2 phoH P stress-inducible protein 2
idiA Iron (III) transporter 365 phoU Transcriptional regulator, phosphate
transport system protein
143
isiA Iron stress-induced chlorophyll-bind-
ing protein
12 phoX Alkaline phosphatase, Ca2þ binding 2
isiB Flavodoxin 213 polyP1 Poly-phosphate accumulation 4
isiP Iron stress-induced protein 302 psiP Highly expressed under low P 1
pep_m20 Possible Peptidase family M20/M25/
M56
11 pstS Phosphate transporter 1
petF Ferredoxin 16 ptrA Possible P transcriptional regulator 3
piuC Uncharacterized iron-regulated
protein
9 sqdB Sulfolipid biosynthesis protein 3
pmm1359 Predicted membrane protein, iron-
stress responsive
48 Silica
transport
sit Silicon transporter 5
pvsB Vibrioferrin biosynthesis protein PvsB 257 sit1 Silicon transporter 4
sam SAM-methyltransferase 98 sit2 Silicon transporter 167
Nitrogen
metabolism
aapJ Polar amino-acid ABC transporter 66 sit3 Silicon transporter 4
amoA Ammonia oxidation 5 Viral genes dnaPol Viral DNA polymerase 6
amt Ammonium transporter 5 g20 Viral capsid assembly protein g20 7
arg N-acetyl transferase 6 gp23 Viral major capsid proteins 1
carA Carbamoyl-phosphate synthase 5 mcp Viral major capsid proteins 1
cynA Cyanate transporter 5 RdRp RNA-dependent RNA pol 292
glnA Glutamine synthetase 1
Abbreviations: DMSP, dimethylsulfoniopropionate; MicroTOOLs, Microbiological Targets for Ocean Observing Laboratories. Counts refer to geneortholog counts on the array.
MicroTOOLs microarray for marine microbial taxaIN Shilova et al
1479
The ISME Journal

of the open reading frame region. Custom Javaapplications and R scripts were developed to filterall BLAST results and to trim the ends of sequencesand are available upon request. Additionally, targetsequences were added that derived from the clonelibraries of genes (Supplementary Material) andfrom genomes of marine microorganisms containedin NCBI Genbank. Combined sequences were clus-tered using CD-HIT-EST (Li and Godzik, 2006;Huang et al., 2010) at 95% nt similarity. The longestrepresentative sequence from each cluster wasselected as the target sequence for oligonucleotideprobe design. Probe design was performed at RocheNimbleGen (Madison, WI, USA), and six probes of60-nt length were designed for each target. Randomoligonucleotide probes were included in addition tostandard control and alignment NimbleGen probes.All oligonucleotide probes were tested in silico forpossible cross-hybridization (Supplementary Material).Before the MicroTOOLs microarray design, wetested the specificity of oligonucleotide microarraytechnology in detecting transcripts from a mixedcommunity and from environmental samples. Theresults showed cross-hybridization for highly con-served genes (such as the photosystem II psbA geneacross cyanobacteria) when nt sequences wereo5%dissimilar (Supplementary Material, SupplementaryFigure S1). The final design of the MicroTOOLsmicroarray comprised of ca. 116 000 experimentaland 19 000 control probes with one replicationsynthesized on a 12-plex 12� 135 K NimbleGenarray. The platform is available at NCBI GeneExpression Omnibus (www.ncbi.nlm.nih.gov/geo/)under accession number GPL16706.
Nutrient-enrichment incubationAn incubation experiment was performed at Stn.ALOHA (221450 N 1581 W) in the NPSG duringKM1016 cruise (R/V Kilo-Moana). Surface water wascollected on 22 August 2010 from 10 m depth usingNiskin bottles in a rosette mounted to a conductivity–temperature–depth instrument (cast S2c9), filteredthrough 10.0-mm pore-size mesh, and distributed into12 4-l clear polycarbonate bottles. The bottles andtubing were cleaned with 10% HCl, but vigoroustrace-metal cleaning precautions were not takenduring experimental setup. Each treatment was donein triplicate: (1) control (no enrichment), (2) enrich-ment with 1.0mM K2PO4, and (3) enrichment with2.0 nM FeCl3. The bottles were incubated in a deckincubator continuously flushed with surface sea-water to maintain the proper temperature. Neutraldensity screening was used to attenuate sunlight toca. 35% of surface sunlight. Four-liter samples weretaken from the original seawater sample beforenutrient additions (three replicates total) and fromall treatments after 48 h of incubation in the morning.From each bottle, 3.9 l were then filtered ontoSterivex cartridges (0.22mm, Millipore, Billerica,MA, USA) using gentle Masterflex (Cole Parmer,
Vernon Hills, IL, USA) peristaltic pumping ensuringthat filtration time did not exceed 25 min. Sterivexcartridges were immediately flash frozen in liquidnitrogen and stored at � 80 1C until processing. Theremaining 0.1 l from each bottle was used in FastRepetition Rate Fluorometer (FRRF) analysis.
RNA extraction and processing for hybridization to themicroarrayRNA was extracted using the Ambion RiboPure kit(Life Technologies, Grand Island, NY, USA) withmodifications that included mechanical lysis usingglass beads (Supplementary Material). ExtractedRNA was treated with DNase to remove genomicDNA. RNA quantity and quality were determinedwith a NanoDrop 1000 (Thermo Scientific, Waltham,MA, USA) and a 2100 Bioanalyzer (Agilent Techno-logies, Santa Clara, CA, USA) using the RNA 6000Nano kit (Agilent Technologies). Only samples withRNA Integrity Number47.0 and ratios of A260/A230and A260/A280X1.8 were processed further. RNAyield from the incubations of the surface communityat Stn. ALOHA ranged from 280 to 1130 ng l�1, anamount insufficient for the NimbleGen microarray.cDNA was synthesized from 400 ng RNA from eachsample, which was then amplified using theTransPlex Whole Transcriptome Amplification kit(WTA-1, Sigma-Aldrich, St Louis, MO, USA) andantibody-inactivated hot-start Taq DNA Polymerase(Sigma-Aldrich). The amplified cDNA was purifiedwith the GenElute PCR cleanup kit (Sigma-Aldrich),and the quality and quantity of double-stranded (ds)cDNA was determined with NanoDrop 1000 and a2100 Bioanalyzer using the Agilent DNA 7500 kit(Agilent Technologies). Four hundred nanograms oftotal RNA yielded on average 12mg of ds-cDNA. Theamplification efficiency was determined with a Taq-Man quantitative PCR (qPCR) assay targeting a spike-intranscript ERCC-00116 (Invitrogen, Life Technologies).One microliter of 1:100 dilution (corresponding to4.7 attomoles of ERCC-0016) of the ERCC (ExternalRNA Control Consortium, Lemire et al., 2011) RNAspike-in mix 1 (Ambion) was added to RNA samplesbefore amplification. Amplification of one replicatefor Fe treatment was seven times less than theaverage amplification (150-fold), and the samplewas excluded from microarray hybridization. Thelabeling and hybridization of cDNA samples (1.0 mgof ds-cDNA) to the microarray was done at theSandler Center Functional Genomics Core Facility(University of California, San Francisco, CA, USA)according to the protocol in NimbleGen ArraysUser’s Guide: ‘Gene Expression Arrays, version 6.0’.
DNA extraction and estimation of cell abundances fordiazotrophs and Synechococcus spp.DNA was extracted from the organic phase ofthe nucleic acid extract after RNA separationusing the RiboPure kit (Ambion) according to the
MicroTOOLs microarray for marine microbial taxaIN Shilova et al
1480
The ISME Journal

manufacturer’s instructions (Supplementary Material).DNA yield ranged from 9.2 to 26.6mg l�1. Diazotrophabundances were determined with Taqman qPCRassays targeting nifH as described in Moisander et al.(2010). Synechococcus spp. cell abundances wereestimated using the qPCR assay targeting narB (groupG) as described in Paerl et al. (2012). The Tukey’s testwas used to compare the qPCR data.
Microarray data analysisAll data analyses were performed with R (www.R-project.org) and the Bioconductor project(Gentleman et al., 2004), specifically using theLinear Models for Microarray (LIMMA; Smyth,2005), affy (Gautier et al., 2004) and samr (Tusheret al., 2001) packages; plots were made using gplotspackage. Transcription values were obtained usingthe robust multi-array average algorithm (Irizarryet al., 2003) and using Li–Wong across-chip normal-ization (Li and Wong, 2001) (Supplementary Figure S2).The signal-to-noise ratio (SNR) of each chip wascalculated as: SNR¼ (Si–BG)/BG; where Si is thehybridization signal for the gene and BG is the chipbackground signal determined as average of thelowest 5% of all signals. Transcription was con-sidered detected if SNR of a transcript was X5. Thedetection range was estimated based on the ERCChybridization data (Supplementary Figure S3). Thedetection limit as percentage of total mRNA wascalculated for 1000-nt long mRNA and consideringthat rRNA constitutes 95% of total RNA.The relative cell sensitivity limit was estimatedbased on the assumption of 1380 mRNA percell (Neidhardt and Umbarger, 1996). For eachgroup (Eukaryota, Bacteria non-picocyanobacteria,Prochlorococcus, Synechococcus, Viruses, Archaea),gene transcription was scaled to the median of thegroup in each sample. To identify differentiallytranscribed genes, the nonparametric method,Significance Analysis of Microarray (Tusher et al.,2001) was used with the following parametersettings: delta¼ 0.3, 100 iterations, false discoveryrate (FDR)¼ 0.05 (Supplementary Figure S4). Inaddition, LIMMA (Smyth, 2005) was used with thefollowing parameters: fold change in log2 scale¼ 1;FDR¼ 0.05; Po0.1 (Benjamini–Hochberg adjusted,Benjamini and Hochberg, 1995). The separation ofsamples by treatment was supported by a Wilcoxon’stest (Bauer, 1972) performed with at least a100 random resamplings of 1000 gene probes(Supplementary Figure S4). Transcription data wascentered and scaled across genes, and a distancematrix was calculated by Pearson’s correlationcoefficient. The distance matrix was then usedin hierarchical clustering by a completeagglomeration method. Raw and normalized micro-array data were prepared in accordance to theMIAME standards (Brazma et al., 2001) and sub-mitted to NCBI GEO under accession numberGSE44448.
FRRF measurementsChlorophyll a variable fluorescence (Fv) and max-imal fluorescence (Fm) were measured using FRRFas described in Kolber et al. (1998). FRRF measure-ments were taken for each sample in the beginningand after 48 h of incubation in six replications andusing blue light (470 nm) for excitation. The Tukey’stest was used to compare the FRRF data.
Results and discussion
Microarray designThe MicroTOOLs microarray targets marker genesfor three domains of life in marine microbialcommunities along with known viruses. Using ourapproach, a total of 19 400 target sequences repre-senting 145 genes (Table 1) were obtained fromgenomes (B8%) and from metagenomes/metatran-scriptomes (B92%). The design was biased towardthe picocyanobacteria Prochlorococcus and Synecho-coccus spp. and the Alphaproteobacteria cladeSAR11 sequences (Figure 1, Supplementary Table S1)owing to their high abundances in surface oceanicwaters, resulting in high abundances of their ntsequences in metagenomes and metatranscriptomes(for example, DeLong et al., 2006; Hewson et al.,2010) and the fact that gene function and diversity ofthese microorganisms have been relatively wellstudied (Scanlan and West, 2002; Scanlan et al.,2009; Sun et al., 2011; Brown et al., 2012).Genes from less abundant prokaryotic microorgan-isms, such as from marine N2-fixing cyano-bacteria, were also included. Marine eukaryoticphytoplankton were primarily represented by thegenes encoding the large subunit of RuBisCO (rbcL)and nitrate reductase (NR) (Figure 1). Additionaleukaryotic genes were selected based on availablegenomes and/or expressed sequence tags for dia-toms (Armbrust et al., 2004; Bowler et al., 2008).Genes for marine DNA and RNA viruses includedgenes for DNA polymerase, major capsid protein andRNA-dependent RNA polymerase. Probes for Archaeatargeted genes encoding ammonia monooxygenase,RuBisCO and urease (Supplementary Table S1).
As a proof of concept, the transcriptionalresponses of the surface microbial community atStn. ALOHA to phosphate (P) or iron (Fe) amend-ments were analyzed using the MicroTOOLs micro-array. During the time of sampling, surface waters atStn. ALOHA had 54–79 nmol l�1 of P, 4–33 nmol l�1
of nitrate plus nitrite, 0.79–1.07 mmol l�1 of siliconand 67–78 ng l� 1 of chlorophyll a (data from 5–10 mdepths). Fe concentrations were not measuredduring the time of study, but average near-surfaceFe concentration at Stn. ALOHA is 0.44 nmol l�1
(Boyle et al., 2005). The long-term mean P concentra-tions at Stn. ALOHA are 58±3 nmol l�1 (Bjorkmanet al., 2012), and thus, out of P and Fe, Fe wasbelieved to be the limiting nutrient at the time ofincubation, at least for the diazotrophic community.
MicroTOOLs microarray for marine microbial taxaIN Shilova et al
1481
The ISME Journal

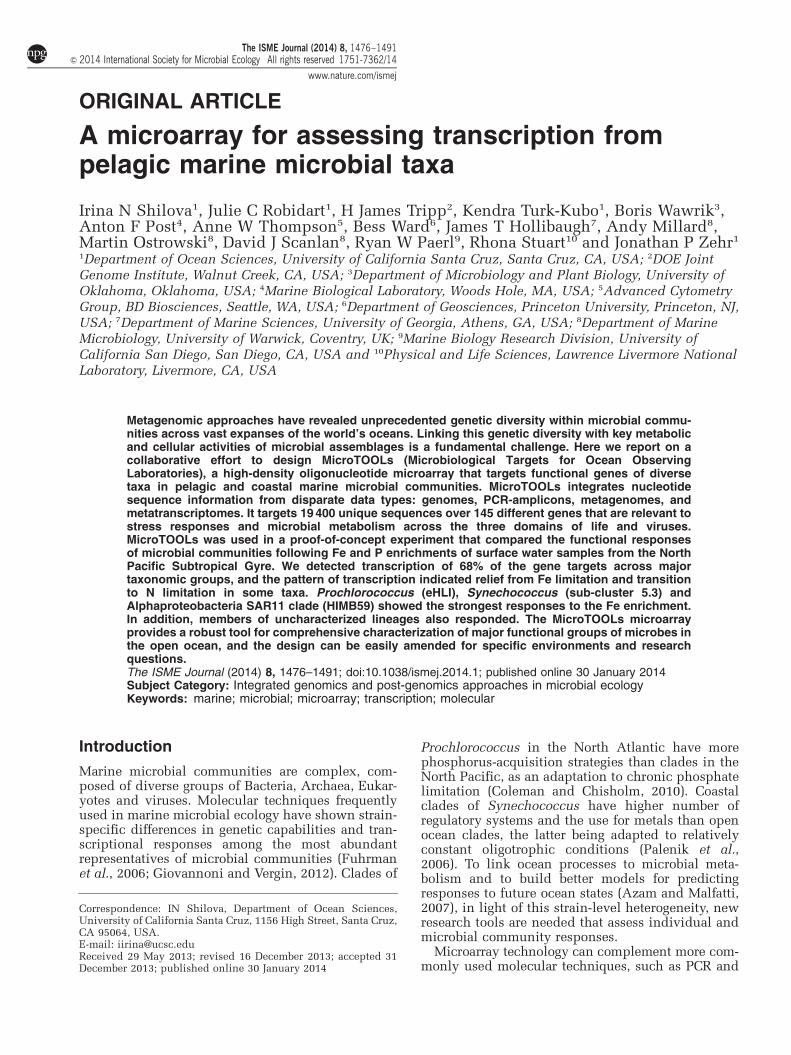
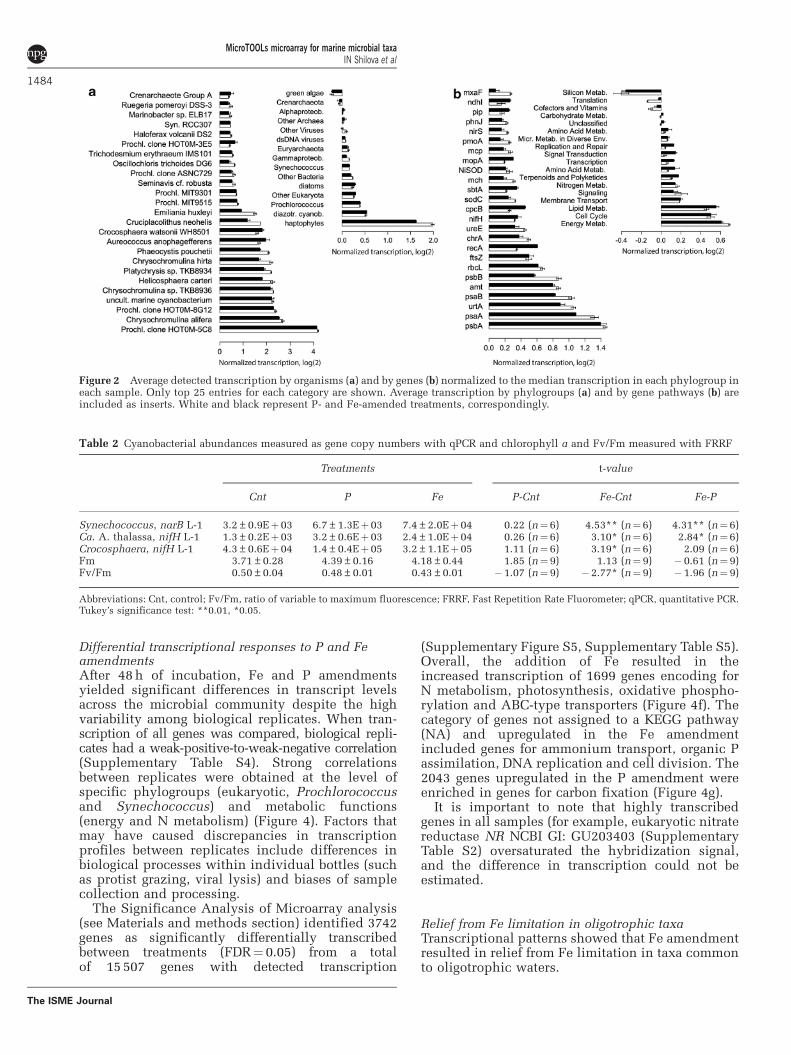
Microbial community transcription at Stn. ALOHAdetected with the MicroTOOLs microarrayHybridization signals above background weredetected for a total of 15 507 genes (68% of themicroarray set), with an average detection of 40%of target orthologs for each gene (SupplementaryTable S3). The range of detection for the microarraywas from 700 to 11Eþ 06 transcript copies based onthe spike-in ERCC data (Supplementary Figure S3).Calculated for a 1000-nt long mRNA, the 700transcript copies (absolute sensitivity) correspondedto 1.8E-06% of the total community mRNA and to0.0025% as the lowest relative abundance of cellswithin the community that can be detected. Averagetranscription from pelagophytes (Aureococcus) andprymnesiophytes (Chrysochromulina, Phaeocystis,Helicosphaera) was up to sixfold higher than themedian transcription in all eukaryotes across samples(Figure 2a, Supplementary Table S2). Average tran-scription among prokaryotes (Prochlorococcus, Syne-chococcus, Proteobacteria,) was distributed aroundthe median transcription of the corresponding tran-scriptome in all samples (Figure 2a, insert). Theexceptions were genes related to an unculturedProchlorococcus species represented by a fosmidclone HOT0M, which had 16-fold higher transcrip-tion than the median (Figure 2a). The mosthighly transcribed genes across all treatments werepsaA (photosystem I), psbA (photosystem II),amt (ammonium transport), urtA (urea transporter)and rbcL (Figure 2b). Among relatively lowabundance taxa, diazotrophic cyanobacteria,Trichodesmium erythraeum IMS101, CandidatusAtelocyanobacterium thalassa (Ca. A. thalassa orunicellular cyanobacterial group A, UCYN-A) andan uncultured heterocystous cyanobacterium (NCBI112280460, Moisander et al., 2007) had highnifH (Fe-nitrogenase reductase) transcription(Supplementary Table S2). The maximum nifHtranscription in these cyanobacteria occurs duringthe early morning hours (Church et al., 2005),when samples from incubations were collected.Another N2-fixing cyanobacterium Crocosphaerawatsonii (Crocosphaera) had high transcription ofpstS (high-affinity phosphate binding) and ftsZ (celldivision) (Supplementary Table S2). Ca. A. thalassaand Crocosphaera cell abundances (Table 2) in theincubations ranged from 0.0002% to 0.04% of thetotal prokaryotic community (8.0Eþ 08 cells l�1,Bjorkmann et al., 2012), overlapping the estimatedrelative cell detection limit for the microarray(0.0025%). In addition, gene transcripts weredetected for members of the Phycodnavirus family,which infects a number of eukaryotic phytoplankton,including Micromonas (Mayer and Taylor, 1979) andAureococcus (Milligan and Cosper, 1994) and also forcyanophages from the Myoviridae family (DNApolymerase and viral capsid genes).
Overall, the genes with detected transcriptionreflected the composition and activity of themicrobial community at Stn. ALOHA as previously
described (DeLong et al., 2006; Frias-Lopez et al.,2008; Church et al., 2009; Hewson et al., 2010).Moreover, the high activity of the pelagophytes andprymnesiophytes was consistent with the detectionof a eukaryotic phytoplankton bloom at that time(Bjorkman et al., 2012).
Transcription by members of unknown lineagesA wide diversity of genotypes of Prochlorococcus,Synechococcus and Alphaproteobacteria weredetected at the study site. Prochlorococcus probesthat yielded detectable signals had a wide range ofnt similarity to sequenced genomes (Figures 3aand d), indicating a broad representation of theknown natural genetic diversity in Prochlorococcus,as well as transcriptional activity in genotypeswith no currently sequenced genome. Gene probeswith detectable transcription had a median of 91%nt identity to Prochlorococcus genome sequences,such as strain CCMP1986 (Figure 3a).
Detected Synechococcus-like transcripts had amedian of 88.5% similarity at the nt level to theirorthologs in known genomes (Figures 3b and d).Especially high transcriptional activity (normalizedtranscription42) was detected for genes similar toSynechococcus sp. RCC307, a strain from Synecho-coccus sub-cluster 5.3A. The low percentage ofsimilarity to known genomes indicates the existenceof an uncharacterized lineage, potentially within thesub-cluster 5.3, at Stn. ALOHA. The presence of thisclade has recently been reported in the open oceanand in the Mediterranean Sea, with higherabundances in warm, low-nutrient waters (Mella-Flores et al., 2011; Post et al., 2011; Ahlgren andRocap, 2012; Huang et al., 2012).
With a median of 80.0% similarity, probesequences targeting Alphaproteobacteria also dis-played a degree of degeneracy relative to knowngenome sequences (Figure 3c), suggesting that new,active strains remain uncharacterized. This is con-sistent with another recent study, where a newgroup of the SAR11 clade was proposed based on16S rRNA gene phylogeny (Allen et al., 2012). Suchuncharacterized genotypes with detectable tran-scription are candidates for further targeted genomicstudies.
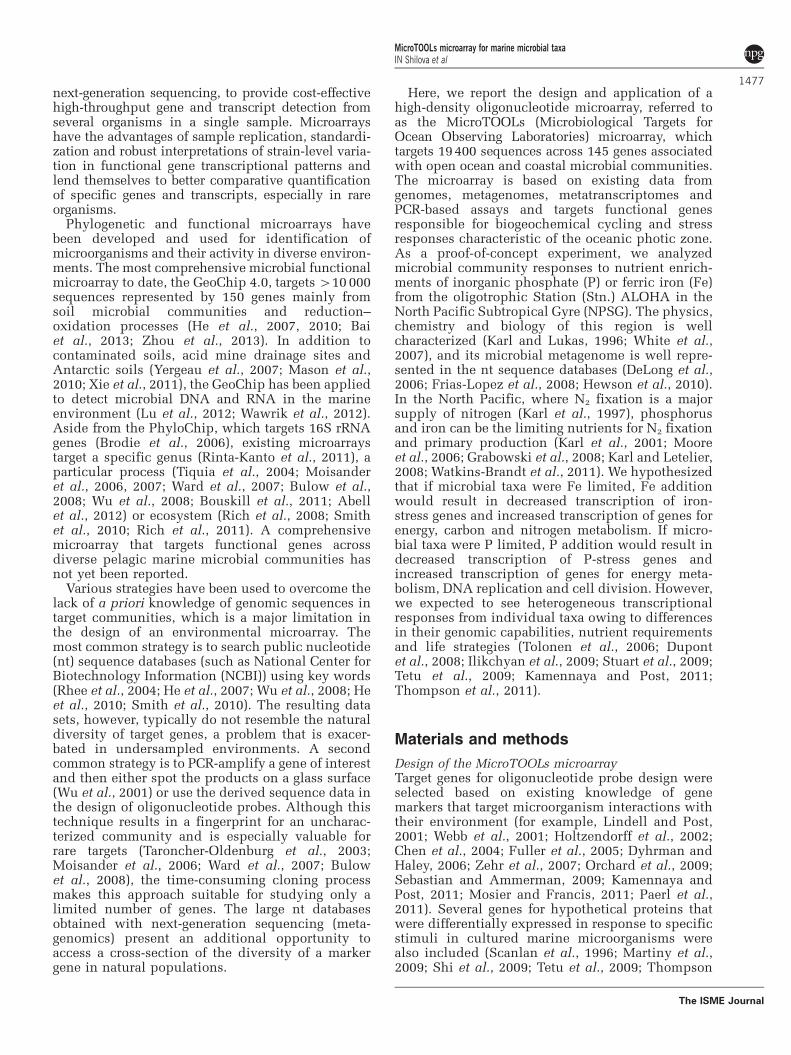
Response to nutrient amendmentsMaximum chlorophyll a fluorescence (Fm) wasnot significantly different between each of theamendments and the control and between P andFe amendments (P40.2, Table 2). The lowerratio of variable to maximum fluorescence (Fv/Fm)in the Fe treatment (Po0.05) may be a resultof either a shift in phytoplankton communitycomposition or lower photosynthetic efficiency inFe-enriched samples due to nutrient limitation(Vogel et al., 2003; Sylvan et al., 2007, 2011).
MicroTOOLs microarray for marine microbial taxaIN Shilova et al
1482
The ISME Journal

Cyanobacterial abundances increased in responseto Fe amendments. Diazotrophic cyanobacteriaCrocosphaera and Ca. A. thalassa and the non-diazotrophic cyanobacteria Synechococcus were 8,19 and 23 times, respectively, more abundant inFe amendments versus the control after incubation,as measured with qPCR (Table 2). Ca. A. thalassaand Synechococcus spp. were 8 and 11 times,
respectively, more abundant in Fe-amendedversus P-amended samples. This high increasein cell abundances in response to Fe and lowresponse to P is consistent with previouslyreported variability in responses of diazotrophsto P and Fe availability in the NPSG (Zehr et al.,2007; Grabowski et al., 2008; Watkins-Brandt et al.,2011).
Figure 1 Microorganisms and viruses with genes targeted in the MicroTOOLs microarray. (a) Phylogenetic tree of all targeted genes withthe number of genes reflected in the size of the circles. (b–e) Distribution of target genes in (b) Prochlorococcus spp. by clade,(c) Synechococcus spp. by clade, (d) bacteria other than Prochlorococcus and Synechococcus by phylogroups and (e) Eukaryota byphylogroup. The details for gene distribution are in Supplementary Table S1.
MicroTOOLs microarray for marine microbial taxaIN Shilova et al
1483
The ISME Journal
Differential transcriptional responses to P and FeamendmentsAfter 48 h of incubation, Fe and P amendmentsyielded significant differences in transcript levelsacross the microbial community despite the highvariability among biological replicates. When tran-scription of all genes was compared, biological repli-cates had a weak-positive-to-weak-negative correlation(Supplementary Table S4). Strong correlationsbetween replicates were obtained at the level ofspecific phylogroups (eukaryotic, Prochlorococcusand Synechococcus) and metabolic functions(energy and N metabolism) (Figure 4). Factors thatmay have caused discrepancies in transcriptionprofiles between replicates include differences inbiological processes within individual bottles (suchas protist grazing, viral lysis) and biases of samplecollection and processing.
The Significance Analysis of Microarray analysis(see Materials and methods section) identified 3742genes as significantly differentially transcribedbetween treatments (FDR¼ 0.05) from a totalof 15 507 genes with detected transcription
(Supplementary Figure S5, Supplementary Table S5).Overall, the addition of Fe resulted in theincreased transcription of 1699 genes encoding forN metabolism, photosynthesis, oxidative phospho-rylation and ABC-type transporters (Figure 4f). Thecategory of genes not assigned to a KEGG pathway(NA) and upregulated in the Fe amendmentincluded genes for ammonium transport, organic Passimilation, DNA replication and cell division. The2043 genes upregulated in the P amendment wereenriched in genes for carbon fixation (Figure 4g).
It is important to note that highly transcribedgenes in all samples (for example, eukaryotic nitratereductase NR NCBI GI: GU203403 (SupplementaryTable S2) oversaturated the hybridization signal,and the difference in transcription could not beestimated.
Relief from Fe limitation in oligotrophic taxaTranscriptional patterns showed that Fe amendmentresulted in relief from Fe limitation in taxa commonto oligotrophic waters.
Figure 2 Average detected transcription by organisms (a) and by genes (b) normalized to the median transcription in each phylogroup ineach sample. Only top 25 entries for each category are shown. Average transcription by phylogroups (a) and by gene pathways (b) areincluded as inserts. White and black represent P- and Fe-amended treatments, correspondingly.
Table 2 Cyanobacterial abundances measured as gene copy numbers with qPCR and chlorophyll a and Fv/Fm measured with FRRF
Treatments t-value
Cnt P Fe P-Cnt Fe-Cnt Fe-P
Synechococcus, narB L-1 3.2±0.9Eþ03 6.7±1.3Eþ 03 7.4±2.0Eþ04 0.22 (n¼6) 4.53** (n¼ 6) 4.31** (n¼ 6)Ca. A. thalassa, nifH L-1 1.3±0.2Eþ03 3.2±0.6Eþ 03 2.4±1.0Eþ04 0.26 (n¼6) 3.10* (n¼ 6) 2.84* (n¼ 6)Crocosphaera, nifH L-1 4.3±0.6Eþ04 1.4±0.4Eþ 05 3.2±1.1Eþ05 1.11 (n¼6) 3.19* (n¼ 6) 2.09 (n¼ 6)Fm 3.71±0.28 4.39±0.16 4.18±0.44 1.85 (n¼9) 1.13 (n¼ 9) � 0.61 (n¼ 9)Fv/Fm 0.50±0.04 0.48±0.01 0.43±0.01 � 1.07 (n¼9) �2.77* (n¼ 9) � 1.96 (n¼ 9)
Abbreviations: Cnt, control; Fv/Fm, ratio of variable to maximum fluorescence; FRRF, Fast Repetition Rate Fluorometer; qPCR, quantitative PCR.Tukey’s significance test: **0.01, *0.05.
MicroTOOLs microarray for marine microbial taxaIN Shilova et al
1484
The ISME Journal

Transcription of genes for energy metabolismincreased in picocyanobacteria upon Fe amendment(Figures 5a and b). Fe additions resulted in atwofold increased transcription of psaA (photo-system I) in both Prochlorococcus and Synechococ-cus spp, with an up to fivefold increase in transcriptlevel for the psaA gene in the SynechococcusRCC307-like genotype. Transcription of the coxAgene (cytochrome c oxidase) in ProchlorococcuseHLI and eHLII genotypes was up to fivefold higherin the Fe-amended treatment. The role of Fe as acofactor in electron transport is consistent withincreases in transcripts for energy-metabolism genesin Prochlorococcus and Synechococcus in Feamendments, a pattern also observed in cultures(for example, Singh et al., 2003; Thompson et al.,2011).
This increased transcription of energy-metabolismgenes was accompanied by the increased transcrip-tion of genes for cellular activity (DNA replicationrecA, cell division ftsZ) in Prochlorococcus (highlight ecotype I, eHLI) in Fe-amended treatments(Supplementary Figure S6). It is possible thataddition of Fe resulted in the increased growth rateof Prochlorococcus as observed in the Eastern SouthPacific (Mann and Chisholm, 2000). The highersensitivity of the HLI ecotype in comparison to LLecotypes to Fe availability (Thompson et al., 2011)may explain the increased cellular activity ofProchlorococcus eHLI in response to the Fe amend-ment. The availability of fixed N from diazotrophs(Mulholland and Capone, 2001; Mulholland et al.,2004) upon Fe amendment may have been anadditional or alternative factor that enhanced the
growth of Prochlorococcus eHLI in these treatments.This hypothesis is consistent with the similarity inresponses of diazotrophs and Prochlorococcus HLspp. to Fe addition, both in this study and in a studyin the Southwest Pacific Ocean (Moisander et al.,2012).
The downregulation of idiA in oligotrophic taxasuch as Prochlorococcus AS9601 (eHLII) and Alpha-proteobacteria SAR11 clade strain HIMB59(Supplementary Figure S6) in Fe amendments wasconsistent with the repression of the gene in Fe-replete cultures (Bagg and Neilands, 1987; Webbet al., 2001; Smith et al., 2010; Thompson et al., 2011).In contrast, idiA transcription by more eutrophicSynechococcus RCC307-like (sub-cluster 5.3A, Mella-Flores et al., 2011) and Pelagibacter HTCC7211-likegenotypes was higher in the Fe-amendment. Thedifferences between coastal and open ocean specieshave been reported before in cultures and includedifferences in Fe requirements and sensing (forexample, Sunda et al., 1991; Palenik et al., 2006),uptake of siderophore- or porphyrin-bound Fe(Hutchins et al., 1999) and post-translational regula-tion by antisense RNA (Hernandez et al., 2006).
This is the first report that validates differential Feresponses across a multitude of taxa in a mixedcommunity. The relatively high (0.44 nmol l�1)average Fe concentrations in the surface waters atStn. ALOHA are not usually considered limiting formicrobial communities (Boyle et al., 2005). Theresponse to Fe amendments reported here indicatesthat either Fe concentrations at the time of studywere lower than average or that much of this Fe wasnot bioavailable, at least for some taxa.
Figure 3 Transcription versus nucleotide similarity to the closest genome for Prochlorococcus spp. (a), with CCMP1986- and NATL1A-like genotypes highlighted; Synechococcus spp. (b), with RCC307- and WH7803-like genotypes highlighted; and Alphaproteobacteria(c) sequences, with HIMB5-and HTCC7211-like genotypes highlighted. Transcription was normalized to the median of each group ineach sample, and only differentially transcribed genes are shown. (d) Distribution of differentially transcribed genes by nucleotidesimilarity to the closest genome for Prochlorococcus, Synechococcus and Alphaproteobacteria.
MicroTOOLs microarray for marine microbial taxaIN Shilova et al
1485
The ISME Journal

Increased N metabolism and N limitation in FeamendmentsThe availability of Fe led to an increased transcrip-tion of N transport and metabolism genes (amt, urtA,nrtP, glnA, nirA, sigAII) in both Synechococcus andProchlorococcus and possibly led to N limitation inProchlorococcus eHL (Figure 5c, SupplementaryTable S6). The observed fourfold downregulationof the rbcL transcripts in Prochlorococcus eHLI andeHLII in the Fe amendment (Figure 5d) might haveresulted from N limitation (Tolonen et al., 2006). Incontrast, Synechococcus spp. had twofold higherrbcL transcription in Fe amendments than in Pamendments (Supplementary Table S6). We spec-ulate that the differences in rbcL transcription weredue to the ability of the majority of Synechococcusspp. to assimilate nitrate, while only few unculturedProchlorococcus spp. have that capability (Mooreet al., 2002; Martiny et al., 2009). Transcription ofnitrite/nitrate-utilization genes (nrtP, nirA and narB)was detected in Synechococcus spp. and wasupregulated in Synechococcus WH8109 (clade II)in Fe amendments (Supplementary Tables S2 and S6).Transcription of the narB gene was also detected fora few uncultured Prochlorococcus spp., butthe precise affiliation of these genes is unknown.
While not measured directly in the incubations,nitrate/nitrite concentrations at Stn. ALOHA duringincubation were relatively high. It is possible thatSynechococcus spp. were able to obtain sufficientnitrogen, and thus carbon fixation in Synechococcuswas not downregulated.
The eukaryotic NR gene was upregulated in Feamendments (Supplementary Table S6) possiblyresulting from increased energy production, bysufficient Fe requirements for the nitrate reductaseenzyme and/or by subsequent N limitation. Althoughtranscription of NR can be induced by the presenceof nitrate alone in eukaryotes (Song and Ward, 2004;Poulsen and Kroger, 2005), the lower Fv/Fm ratiowas possibly due to insufficient N (Tolonen et al.,2006) for the dominant phytoplankton inchlorophyll a measurements, which at that timewere eukaryotic phytoplankton. Similar to Prochloro-coccus, eukaryotic phytoplankton downregulatedrbcL genes in the Fe treatment, especially twoChrysophytes, Epipyxis pulchra and Ochromonasaestuarti, and two Prymnesiophytes, Chrysochro-mulina alifera and Chrysochromulina flava(Figure 5d). The downregulation of rbcL could bedue to a reduced cellular N:C ratio in theseorganisms. Alternatively, if photosynthetic eukaryotic
Figure 4 Correlograms for differentially transcribed genes from (a) Eukaryota (172 genes), (b) Prochlorococcus (2022 genes),(c) Synechococcus (1030 genes), (d) Energy metabolism (699 genes) and (e) Nitrogen metabolism (472 genes). The low triangle from theprincipal diagonal line in each panel contains correlation cells for each pair of samples, and the upper triangle contains pie chartsshowing the strength of correlation. Blue and red represent positive and negative correlations, respectively, and color intensity reflectsmagnitude of the correlation. Columns and rows were reordered based on principal component to reflect samples that group together.Correlation coefficients for all correlograms are in Supplementary Material (Supplementary Table S4). Transcription of genes upregulatedin the Fe amendment (f) and in the P amendment (g) by KEGG pathway. Transcription was normalized to the mean across samples. ‘NA’category comprises of genes not assigned to a KEGG pathway.
MicroTOOLs microarray for marine microbial taxaIN Shilova et al
1486
The ISME Journal

phytoplankton were utilizing nitrate, they wouldhave had to divert ATP and reductant away fromcarbon fixation, which would also result indecreased carbon fixation (Laws, 1991) by down-regulating rbcL transcription.
P limitation or increased P metabolism followed FeadditionIndividual taxa in the Fe treatment showed upregulatedtranscription of P stress-response genes, despite thegenerally high availability of phosphate. Transcriptionof pstS (the high-affinity phosphate-binding protein)in Prochlorococcus MIT9301-like genotypes (eHLII)was twofold higher in the Fe amendments incomparison to the P amendments (SupplementaryFigure S6). The set of iron upregulated geneswas enriched in pstS transcripts from Proteo-bacteria (especially, Alphaproteobacterium HIMB5)and cyanobacteria (Synechococcus WH8102)(Supplementary Table S6). The phosphonate
utilization genes phnJ and phnA in Alphaproteo-bacteria and the alkaline phosphatase gene phoD inGammaproteobacteria were upregulated in the Feaddition (Supplementary Figure S6, SupplementaryTable S6). The 2-mm size fraction of phytoplanktonwas not P-depleted at the time of incubation(Bjorkman et al., 2012), but it is possible that Plimitation was induced by the fast removal of P inthe Fe amendment by some members of thecommunity, such as nitrate utilizers. Alternatively,increased energy generation in microorganismsin the Fe treatment might have provided energy forphosphate acquisition and membrane translocationsystems for proteins involved in alternativeP source assimilation (Cembella et al., 1982;Jansson, 1988; Tetu et al., 2009). Taxa that upregu-lated P transport and metabolism genes were largelydifferent from taxa that demonstrated N limitation,but manifestations of both N and P limitationsoccurred after Fe was supplied, suggesting Fe as aprimary limiting nutrient at that time.
Figure 5 Normalized transcription for top differentially transcribed genes for (a) photosynthesis, (b) oxidative phosphorylation,(c) nitrogen metabolism and stress and (d) carbon fixation. Transcription was normalized to the mean transcription across samples.
MicroTOOLs microarray for marine microbial taxaIN Shilova et al
1487
The ISME Journal

Conclusions
This study reports the design of a high-densityoligonucleotide microarray (MicroTOOLs) thattargets marine microbial communities and wasenabled by currently available environmentalsequence data. We detected differential microbialcommunity responses to nutrient amendments inthe NPSG, ultimately demonstrating strain-specificcommunity responses to relief of Fe stress that wasfollowed by N or P limitation in some taxa. Suchdata provide a mechanistic understanding ofchanges in microbial communities in response tonutrient fluxes or other environmental factors.
Future technological improvements, such as auto-mated probe design including probes for other markergenes and exploratory probes (Chung et al., 2005;Dugat-Bony et al., 2011), would improve the perfor-mance of the microarray. In addition to the utility ofthe MicroTOOLs array for incubation experiments,this microarray could be applied as a tool for pelagicmarine microbiological studies for standardized infor-mation across study types and ocean basins. Thiswould result in a high-resolution map of microbialgenes and their transcriptional activities in theenvironment and provide the baseline for assessingthe impacts of future perturbations of the global ocean.
Conflict of Interest
The authors declare no conflict of interest.
Acknowledgements
This work resulted from two workshops, and the design ofthe microarray was partially supported by the Gordon andBetty Moore Foundation (the MEGAMER facility), by aGordon and Betty Moore Foundation Marine Investigatorgrant (JPZ) and by the NSF Center for Microbial Oceano-graphy (C-MORE, NSF EF0424599). We thank all theparticipants of the October 2010 MicroTOOLs workshopsponsored by the Moore foundation. Particularly, wethank those who provided sequences for the design ofmicroarray: Mahdi Belcaid, Dreux Chappell, Jackie Collier,Chris Francis, Scott Gifford, Jana Grote, Bethany Jenkins,Julie LaRoche, Pia Moisander, Annika Mosier, MicaelaParker, Holly Simon, Mariya Smit, Jody Wright, and LouieWurch. We thank Shulei Sun and the team at CAMERA forsupport during microarray design. We also thank theHawaii Ocean Time-series (HOT) program and C-MORE,specifically the captain and crew of R/V Kilo Moana andchief scientist of KM1016 cruise, Matt Church, for theirexpertise and for providing the opportunity and supportfor conducting experiments at sea. We thank Philip Hellerand Jonathan Magasin for developing Java scripts for themicroarray design and for computational support duringthe MicroTOOLs workshop in October 2010. Finally, wethank Nicole Pereira for help in running the incubationexperiment, Sasha Tozzi for FRRF measurements,Rob Tibshirani for a consultation on microarray datanormalization and analysis and the JPZ laboratorymembers for constructive discussions.
References
Abell GCJ, Robert SS, Frampton DMF, Volkman JK, Rizwi Fet al. (2012). High-throughput analysis of ammoniaoxidiser community composition via a novel, amoA-based functional gene array. PLoS One 7: e51542.
Ahlgren NA, Rocap G. (2012). Diversity and distribution ofmarine Synechococcus: multiple gene phylogenies forconsensus classification and development of qPCRassays for sensitive measurement of clades in theocean. Front Microbio 3: 213.
Allen LZ, Allen EE, Badger JH, McCrow JP, Paulsen IT,Elbourne LDH et al. (2012). Influence of nutrients andcurrents on the genomic composition of microbesacross an upwelling mosaic. ISME J 6: 1403–1414.
Armbrust EV, Berges JA, Bowler C, Green BR, Martinez D,Putnam NH et al. (2004). The genome of the diatomThalassiosira pseudonana: ecology, evolution, andmetabolism. Science 306: 79–86.
Azam F, Malfatti F. (2007). Microbial structuring of marineecosystems. Nat Rev Microbiol 5: 782–791.
Bagg A, Neilands JB. (1987). Ferric uptake regulationprotein acts as a repressor, employing iron (II) as acofactor to bind the operator of an iron transport operonin Escherichia coli. Biochemistry 26: 5471–5477.
Bai S, Li J, He Z, Van Nostrand JD, Tian Y, Lin G et al.(2013). GeoChip-based analysis of the functional genediversity and metabolic potential of soil microbialcommunities of mangroves. Appl Microbiol Biotechnol97: 7035–7048.
Bauer DF. (1972). Constructing confidence sets using rankstatistics. J Am Stat Assoc 67: 687–690.
Benjamini Y, Hochberg Y. (1995). Controlling the falsediscovery rate: a practical and powerful approach tomultiple testing. J R Stat Soc Ser B (Methodological)57: 289–300.
Bjorkman K, Duhamel S, Karl DM. (2012). Microbial groupspecific uptake kinetics of inorganic phosphate andadenosine-5’-triphosphate (ATP) in the North PacificSubtropical Gyre. Front Microbiol 3: 189; doi:10.3389/fmicb.2012.00189.
Bouskill NJ, Eveillard D, O’Mullan G, Jackson GA, Ward BB.(2011). Seasonal and annual reoccurrence in betaproteo-bacterial ammonia-oxidizing bacterial populationstructure. Environ Microbiol 13: 872–886.
Bowler C, Allen AE, Badger JH, Grimwood J, Jabbari K,Kuo A et al. (2008). The Phaeodactylum genomereveals the evolutionary history of diatom genomes.Nature 456: 239–244.
Boyle EA, Bergquist BA, Kayser RA, Mahowald N. (2005).Iron, manganese, and lead at Hawaii Ocean Time-series station ALOHA: temporal variability and anintermediate water hydrothermal plume. GeochimCosmochim Acta 69: 933–952.
Brazma A, Hingamp P, Quackenbush J, Sherlock G,Spellman P, Stoeckert C et al. (2001). Minimuminformation about a microarray experiment(MIAME)—toward standards for microarray data.Nat Genet 29: 365–371.
Brodie EL, DeSantis TZ, Joyner DC, Baek SM, Larsen JT,Andersen GL et al. (2006). Application of a high-densityoligonucleotide microarray approach to study bacterialpopulation dynamics during uranium reduction andreoxidation. Appl Environ Microbiol 72: 6288–6298.
Brown MV, Lauro FM, DeMaere MZ, Muir L, Wilkins D,Thomas T et al. (2012). Global biogeography of SAR11marine bacteria. Mol Syst Biol 8: 595.
MicroTOOLs microarray for marine microbial taxaIN Shilova et al
1488
The ISME Journal

Bulow SE, Francis CA, Jackson GA, Ward BB. (2008).Sediment denitrifier community composition and nirSgene expression investigated with functional genemicroarrays. Environ Microbiol 10: 3057–3069.
Cembella AD, Antia NJ, Harrison PJ. (1982). The utiliza-tion of inorganic and organic phosphorous com-pounds as nutrients by eukaryotic microalgae:a multidisciplinary perspective: Part I. Crit RevMicrobiol 10: 317–391.
Chen F, Wang K, Kan JJ, Bachoon DS, Lu JR, Lau S et al.(2004). Phylogenetic diversity of Synechococcus in theChesapeake Bay revealed by ribulose-1,5-bisphosphatecarboxylase-oxygenase (RuBisCO) large subunitgene (rbcL) sequences. Aquat Microb Ecol 36: 153–164.
Chung WH, Rhee SK, Wan XF, Bae JW, Quan ZX, Park YH.(2005). Design of long oligonucleotide probes forfunctional gene detection in a microbial community.Bioinformatics 21: 4092–4100.
Church MJ, Mahaffey C, Letelier RM, Lukas R, Zehr JP, KarlDM. (2009). Physical forcing of nitrogen fixation anddiazotroph community structure in the North PacificSubtropical Gyre. Glob Biogeochem Cycles 23: GB2020.
Church MJ, Short CM, Jenkins BD, Karl DM, Zehr JP.(2005). Temporal patterns of nitrogenase gene (nifH)expression in the oligotrophic North Pacific Ocean.Appl Environ Microbiol 71: 5362–5370.
Coleman ML, Chisholm SW. (2010). Ecosystem-specificselection pressures revealed through comparativepopulation genomics. Proc Natl Acad Sci USA 107:18634–18639.
DeLong EF, Preston CM, Mincer T, Rich V, Hallam SJ,Frigaard NU et al. (2006). Community genomicsamong stratified microbial assemblages in the ocean’sinterior. Science 311: 496–503.
Dugat-Bony E, Peyretaillade E, Parisot N, Biderre-Petit C,Jaziri F, Hill D et al. (2011). Detectingunknown sequences with DNA microarrays: explora-tive probe design strategies. Environ Microbiol 14:356–371.
Dupont CL, Barbeau K, Palenik B. (2008). Ni uptake andlimitation in marine Synechococcus strains. ApplEnviron Micro 74: 23–31.
Dyhrman ST, Haley ST. (2006). Phosphorus scavengingin the unicellular marine diazotroph Crocosphaerawatsonii. Appl Environ Microbiol 72: 1452–1458.
Frias-Lopez J, Shi Y, Tyson GW, Coleman ML, Schuster SC,Chisholm SW et al. (2008). Microbial community geneexpression in ocean surface waters. Proc Natl Acad SciUSA 105: 3805–3810.
Fuhrman JA, Hewson I, Schwalbach MS, Steele JA,Brown MV, Naeem S. (2006). Annually reoccurringbacterial communities are predictable fromocean conditions. Proc Natl Acad Sci USA 103:13104–13109.
Fuller NJ, West NJ, Marie D, Yallop M, Rivlin T, Post AF et al.(2005). Dynamics of community structure and phosphatestatus of picocyanobacterial populations in the Gulf ofAqaba, Red Sea. Limnol Oceanogr 50: 363–375.
Gautier L, Cope L, Bolstad BM, Irizarry RA. (2004). affyanalysis of Affymetrix GeneChip data at the probelevel. Bioinformatics 20: 307–315.
Gentleman RC, Carey VJ, Bates DM, Bolstad B, Dettling M,Dudoit S et al. (2004). Bioconductor: open softwaredevelopment for computational biology and bioinfor-matics. Genome Biol 5: R80.
Giovannoni SJ, Vergin KL. (2012). Seasonality in oceanmicrobial communities. Science 335: 671–676.
Grabowski M, Church M, Karl D. (2008). Nitrogen fixationrates and controls at Stn. ALOHA. Aquat Microb Ecol52: 175–183.
He Z, Deng Y, Van Nostrand JD, Tu Q, Xu M, Hemme CL et al.(2010). GeoChip 3.0 as a high-throughput tool foranalyzing microbial community composition, structureand functional activity. ISME J 4: 1167–1179.
He Z, Gentry TJ, Schadt CW, Wu L, Liebich J, Chong SC et al.(2007). GeoChip: a comprehensive microarray for inves-tigating biogeochemical, ecological and environmentalprocesses. ISME J 1: 67–77.
Hernandez JA, Muro-Pastor AM, Flores E, Bes MT,Peleato ML, Fillat MF. (2006). Identification of a furAcis antisense RNA in the cyanobacterium Anabaenasp. PCC 7120. J Mol Biol 355: 325–334.
Hewson I, Poretsky RS, Tripp HJ, Montoya JP, Zehr JP.(2010). Spatial patterns and light-driven variation ofmicrobial population gene expression in surfacewaters of the oligotrophic open ocean. EnvironMicrobiol 12: 1940–1956.
Holtzendorff J, Marie D, Post AF, Partensky F, Rivlin A,Hess WR. (2002). Synchronized expression of ftsZ innatural Prochlorococcus populations of the Red Sea.Environ. Microbiol 4: 644–653.
Huang S, Wilhelm SW, Harvey HR, Taylor K, Jiao N, Chen F.(2012). Novel lineages of Prochlorococcus and Synecho-coccus in the global oceans. ISME J 6: 285–297.
Huang Y, Niu B, Gao Y, Fu L, Li W. (2010). CD-HIT suite: aweb server for clustering and comparing biologicalsequences. Bioinformatics 26: 680–682.
Hutchins DA, Witter AE, Butler A, Luther GW. (1999).Competition among marine phytoplankton for differ-ent chelated iron species. Nature 400: 858–861.
Ilikchyan IN, McKay RM, Zehr JP, Dyhrman ST, Bullerjahn GS.(2009). Detection and expression of the phosphonatetransporter gene phnD in marine and freshwaterpicocyanobacteria. Environ Microbiol 11: 1314–1324.
Irizarry RA, Hobbs B, Collin F, Beazer-Barclay YD,Antonellis KJ, Scherf U et al. (2003). Exploration,normalization, and summaries of high densityoligonucleotide array probe level data. Biostatistics4: 249–264.
Jansson M. (1988). Phosphate uptake and utilization bybacteria and algae. Hydrobiologia 170: 177–189.
Kamennaya NA, Post AF. (2011). Characterization ofcyanate metabolism in marine Synechococcusand Prochlorococcus spp. Appl Environ Microbiol77: 291–301.
Karl DM, Bjorkman KM, Dore JE, Fujieki L, Hebel DV,Houlihan T et al. (2001). Ecological nitrogen-to-phosphorus stoichiometry at Station ALOHA.Deep-Sea Res II 48: 1529–1566.
Karl DM, Letelier R. (2008). Nitrogen fixation-enhancedcarbon sequestration in low nitrate, low chlorophyllseascapes. Mar Ecol Prog Ser 364: 257–268.
Karl DM, Letelier R, Tupas L, Dore J, Christian J, Hebel D.(1997). The role of nitrogen fixation in biogeochemicalcycling in the subtropical North Pacific Ocean. Nature388: 533–538.
Karl DM, Lukas R. (1996). The Hawaii ocean time-series(HOT) program: background, rationale, and fieldimplementation. Deep-Sea Res II 43: 129–156.
Kolber ZS, Prasil O, Falkowski PG. (1998). Measurementsof variable chlorophyll fluorescence using fast repeti-tion rate techniques: defining methodology andexperimental protocols. Biochim Biophys ActaBioenerg 1367: 88–106.
MicroTOOLs microarray for marine microbial taxaIN Shilova et al
1489
The ISME Journal

Laws EA. (1991). Photosynthetic quotients, new produc-tion and net community production in the open ocean.Deep-Sea Res Oceanogr A 38: 143–167.
Lemire A, Lea K, Batten D, Gu J, Whitley P, Bramlett K.(2011). Development of ERCC RNA spike-in controlmixes. J Biomol Tech 22: S46.
Li C, Wong WH. (2001). Model-based analysis of oligo-nucleotide arrays: expression index computation andoutlier detection. Proc Natl Acad Sci USA 98: 31–36.
Li W, Godzik A. (2006). CD-HIT: a fast program forclustering and comparing large sets of protein ornucleotide sequences. Bioinformatics 22: 1658–1659.
Lindell D, Post AF. (2001). Ecological aspects of ntcA geneexpression and its use as an indicator of the nitrogenstatus of marine Synechococcus spp. Appl EnvironMicrobiol 67: 3340–3349.
Lu Z, Deng Y, Van Nostrand JD, He Z, Voordeckers J, Zhou Aet al. (2012). Microbial gene functions enriched inthe Deepwater Horizon deep-sea oil plume. ISME J 6:451–460.
Mann EL, Chisholm SW. (2000). Iron limits the celldivision rate of Prochlorococcus in the easternequatorial Pacific. Limnol Oceanogr 45: 1067–1076.
Martiny AC, Kathuria S, Berube PM. (2009). Widespreadmetabolic potential for nitrite and nitrate assimilationamong Prochlorococcus ecotypes. Proc Natl Acad SciUSA 106: 10787–10792.
Mason OU, Nakagawa T, Rosner M, Van Nostrand JD,Zhou J. (2010). First investigation of the microbiologyof the deepest layer of ocean crust. PLoS One 5:e15399.
Mayer JA, Taylor FJR. (1979). Virus which lyses the marinenanoflagellate Micromonas pusilla. Nature 281: 299–301.
Mella-Flores D, Mazard S, Humily F, Partensky F, Mahe F,Bariat L et al. (2011). Is the distribution of Prochloro-coccus and Synechococcus ecotypes in the Mediterra-nean Sea affected by global warming. Biogeosciences8: 2785–2804.
Milligan KLD, Cosper EM. (1994). Isolation of viruscapable of lysing the brown tide microalga, Aureo-coccus anophagefferens. Science 266: 805–807.
Moisander PH, Beinart RA, Hewson I, White AE, Johnson KS,Carlson CA et al. (2010). Unicellular cyanobacterialdistributions broaden the oceanic N2 fixation domain.Science 327: 1512–1514.
Moisander PH, Morrison AE, Ward BB, Jenkins BD,Zehr JP. (2007). Spatial-temporal variability indiazotroph assemblages in Chesapeake Bay using anoligonucleotide nifH microarray. Environ Microbiol 9:1823–1835.
Moisander PH, Shiue L, Steward GF, Jenkins BD, Bebout BM,Zehr JP. (2006). Application of a nifH oligonucleotidemicroarray for profiling diversity of N2-fixing micro-organisms in marine microbial mats. Environ Microbiol8: 1721–1735.
Moisander PH, Zhang R, Boyle EA, Hewson I, Montoya JP,Zehr JP. (2012). Analogous nutrient limitations inunicellular diazotrophs and Prochlorococcus in theSouth Pacific Ocean. ISME J 6: 733–744.
Moore JK, Donney SC, Lindsay K, Mahowald N, Michaels AF.(2006). Nitrogen fixation amplifies the ocean biogeo-chemical response to decadal timescale variations inmineral dust deposition. Tellus Ser B 58: 560–572.
Moore LR, Post AF, Rocap G, Chisholm SW. (2002).Utilization of different nitrogen sources by the marinecyanobacteria, Prochlorococcus and Synechococcus.Limnol Oceanogr 47: 989–996.
Mosier AC, Francis CA. (2011). Determining the distributionof marine and coastal ammonia-oxidizing archaea andbacteria using a quantitative approach. In: Klotz MG(ed) Methods in Enzymology: Research on Nitrificationand Related Processes, Part A, vol. 486. ElsevierAcademic Press: San Diego, CA, USA, pp 205–221.
Mulholland MR, Bronk D, Capone DG. (2004). Dinitrogenfixation and release of ammonium and dissolvedorganic nitrogen by Trichodesmium IMS101. AquatMicrob Ecol 37: 85–94.
Mulholland MR, Capone DG. (2001). Stoichiometry ofnitrogen and carbon utilization in cultured popula-tions of Trichodesmium IMS101: Implications forgrowth. Limnol Oceanogr 46: 436–443.
Neidhardt FC, Umbarger HE. (1996). Chemical composi-tion of Escherichia coli. In: Neidhardt FC, Curtiss III R,Ingraham JL, Lin ECC, Low KB, Magasanik B,Reznikoff WS et al. (eds). Escherichia coli andSalmonella: Cellular and Molecular Biology, 2ndedn. ASM Press: Washington, DC, USA, pp 13–16.
Orchard ED, Webb EA, Dyhrman S. (2009). Molecularanalysis of the phosphorus starvation response inTrichodesmium spp. Environ Microbiol 11: 2400–2411.
Paerl RW, Johnson KS, Welsh RM, Worden AZ, Chavez FP,Zehr JP. (2011). Differential distributions of Synecho-coccus subgroups across the California CurrentSystem. Front Microbiol 2: 59.
Paerl RW, Turk KA, Beinart RA, Chavez FP, Zehr JP. (2012).Seasonal change in the abundance of Synechococcusand multiple distinct phylotypes in Monterey Baydetermined by rbcL and narB quantitative PCR.Environ Microbiol 14: 580–593.
Palenik B, Ren QH, Dupont CL, Myers GS, Heidelberg JF,Badger JH et al. (2006). Genome sequence ofSynechococcus CC9311: Insights into adaptation to acoastal environment. Proc Natl Acad Sci USA 103:13555–13559.
Post AF, Penno S, Zandbank K, Paytan A, Huse S, MarkWelch D. (2011). Long term seasonal dynamics ofSynechococcus population structure in the Gulf ofAqaba, Northern Red Sea. Front Microbiol 2: 131.
Poulsen N, Kroger N. (2005). A new molecular tool fortransgenic diatoms. FEBS J 272: 3413–3423.
Rhee SK, Liu XD, Wu LY, Chong SC, Wan XF, Zhou JZ.(2004). Detection of genes involved in biodegradationand biotransformation in microbial communities byusing 50-mer oligonucleotide microarrays. ApplEnviron Microbiol 70: 4303–4317.
Rich VI, Konstantinidis K, DeLong EF. (2008). Design andtesting of ‘genome-proxy’ microarrays to profilemarine microbial communities. Environ Microbiol10: 506–521.
Rich VI, Pham VD, Eppley J, Shi Y, DeLong EF. (2011).Time-series analyses of Monterey Bay coastal micro-bial picoplankton using a ‘genome proxy’ microarray.Environ. Microbiol 13: 116–134.
Rinta-Kanto JM, Buergmann H, Gifford SM, Sun S, Sharma S,del Valle DA et al. (2011). Analysis of sulfur-relatedtranscription by Roseobacter communities using a taxon-specific functional gene microarray. Environ Microbiol13: 453–467.
Scanlan DJ, Bourne JA, Mann NH. (1996). A putativetranscriptional activator of the Crp/Fnr family fromthe marine cyanobacterium Synechococcus sp.WH7803. J Appl Phycol 8: 565–567.
Scanlan DJ, Ostrowski M, Mazard S, Dufresne A,Garczarek L, Hess WR et al. (2009). Ecological
MicroTOOLs microarray for marine microbial taxaIN Shilova et al
1490
The ISME Journal

genomics of marine picocyanobacteria. Microbiol MolBio Rev 73: 249–299.
Scanlan DJ, West NJ. (2002). Molecular ecology of the marinecyanobacterial genera. FEMS Microbiol Ecol 40: 1–12.
Sebastian M, Ammerman JW. (2009). The alkaline phos-phatase PhoX is more widely distributed in marinebacteria than the classical PhoA. ISME J 3: 563–572.
Shi YM, Tyson GW, DeLong EF. (2009). Metatranscrip-tomics reveals unique microbial small RNAs in theocean’s water column. Nature 459: 266–269.
Singh AK, McIntyre LM, Sherman LA. (2003). Microarrayanalysis of the genome-wide response to iron deficiencyand iron reconstitution in the cyanobacterium Synecho-cystis sp. PCC 6803. Plant Physiol 132: 1825–1839.
Smith MW, Herfort L, Tyrol K, Suciu D, Campbell V,Crump BC et al. (2010). Seasonal changes in bacterialand archaeal gene expression patterns across salinitygradients in the Columbia River coastal margin. PLoSOne 5: e13312.
Smyth GK. (2005). LIMMA: Linear Models for Microarraydata. In: Gentleman R, Carey V, Dudoit S, Irizarry R,Huber W (eds) Bioinformatics and ComputationalBiology Solutions using R and Bioconductor. Springer:New York, NY, USA, pp 397–420.
Song BK, Ward BB. (2004). Molecular characterization ofthe assimilatory nitrate reductase gene and its expres-sion in the marine green alga Dunaliella tertiolecta(Chlorophyceae). J Phycol 40: 721–731.
Stuart RK, Dupont CL, Johnson DA, Paulsen IT, Palenik B.(2009). Coastal strains of marine Synechococcusexhibit increased tolerance to copper shock and adistinctive transcriptional response relative to openocean strains. Appl Environ Microbiol 75: 5047–5057.
Sun S, Chen J, Li W, Altinatas I, Lin A, Peltier S et al.(2011). Community cyberinfrastructure for AdvancedMicrobial Ecology Research and Analysis: the CAM-ERA resource. Nucl Acids Res 39: D546–D551.
Sun J, Steindler L, Thrash JC, Halsey KH, Smith DP, Carter AEet al. (2011). One carbon metabolism in SAR11 pelagicmarine bacteria. PLoS One 6: e23973.
Sunda WG, Swift DG, Huntsman SA. (1991). Low ironrequirement for growth in oceanic phytoplankton.Nature 351: 55–57.
Sylvan J, Quigg A, Tozzi S, Ammerman J. (2007).Eutrophication-induced phosphorus limitation in theMississippi River plume: evidence from fast repetitionrate fluorometry. Limnol Oceanogr 52: 2679–2685.
Sylvan JB, Quigg A, Tozzi S, Ammerman JW. (2011).Mapping phytoplankton community physiology on ariver impacted continental shelf: testing a multi-faceted approach. Estuaries Coasts 34: 1220–1233.
Taroncher-Oldenburg G, Griner EM, Francis CA,Ward BB. (2003). Oligonucleotide microarray for thestudy of functional gene diversity in the nitrogencycle in the environment. Appl Environ Microbiol 69:1159–1171.
Tetu SG, Brahamsha B, Johnson DA, Tai V, Phillippy K,Palenik B et al. (2009). Microarray analysis ofphosphate regulation in the marine cyanobacteriumSynechococcus sp. WH8102. ISME J 3: 835–849.
Thompson AW, Huang K, Saito MA, Chisholm SW. (2011).Transcriptome response of high- and low-light-adapted Prochlorococcus strains to changing ironavailability. ISME J 5: 1580–1594.
Tiquia SM, Wu L, Chong SC, Passovets S, Xu D, Xu Y et al.(2004). Evaluation of 50-mer oligonucleotide arrays fordetecting microbial populations in environmentalsamples. Biotechniques 36: 664–675.
Tolonen AC, Aach J, Lindell D, Johnson ZI, Rector T, Steen Ret al. (2006). Global gene expression of Prochlorococcusecotypes in response to changes in nitrogen availability.Mol Syst Biol 2: 53.
Tusher VG, Tibshirani R, Chu G. (2001). Significanceanalysis of microarrays applied to the ionizing radia-tion response. Proc Natl Acad Sci USA 98: 5116–5121.
Vogel J, Axmann IM, Herzel H, Hess WR. (2003).Experimental and computational analysis of transcrip-tional start sites in the cyanobacterium ProchlorococcusMED4. Nucleic Acids Res 31: 2890–2899.
Ward BB, Eveillard D, Kirshtein JD, Nelson JD, Voytek MA,Jackson GA. (2007). Ammonia-oxidizing bacterialcommunity composition in estuarine and oceanicenvironments assessed using a functional gene micro-array. Environ Microbiol 9: 2522–2538.
Watkins-Brandt KS, Letelier RM, Spitz YH, Church MJ,Bottjer D, White AE. (2011). Addition of inorganic ororganic phosphorus enhances nitrogen and carbonfixation in the oligotrophic North Pacific. Mar EcolProg Ser 432: 17–29.
Wawrik B, Boling WB, Van Nostrand JD, Xie J, Zhou J,Bronk DA. (2012). Assimilatory nitrate utilization bybacteria on the West Florida Shelf as determined bystable isotope probing and functional microarrayanalysis. FEMS Microbiol Ecol 79: 400–411.
Webb EA, Moffett JW, Waterbury JB. (2001). Iron stress inopen-ocean cyanobacteria (Synechococcus, Trichodes-mium, and Crocosphaera spp.): identification of theIdiA protein. Appl Environ Microbiol 67: 5444–5452.
White AE, Spitz YH, Letelier RM. (2007). What factors aredriving summer phyto-plankton blooms in the NorthPacific Subtropical Gyre? J Geophys Res 112: C12006.
Wu L, Kellogg L, Devol AH, Tiedje JM, Zhou J. (2008).Microarray-based characterization of microbial com-munity functional structure and heterogeneity inmarine sediments from the Gulf of Mexico. ApplEnviron Microbiol 74: 4516–4529.
Wu LY, Thompson DK, Li GS, Hurt RA, Tiedje JM, Zhou JZ.(2001). Development and evaluation of functional genearrays for detection of selected genes in the environ-ment. Appl Environ Microbiol 67: 5780–5790.
Xie J, He Z, Liu X, Liu X, Van Nostrand JD, Deng Y et al.(2011). GeoChip-based analysis of the functional genediversity and metabolic potential of microbialcommunities in acid mine drainage. Appl EnvironMicrobiol 2011: 3.
Yergeau E, Kang S, He Z, Zhou J, Kowalchuk GA. (2007).Functional microarray analysis of nitrogen and carboncycling genes across an Antarctic latitudinal transect.ISME J 1: 163–179.
Zehr JP, Montoya JP, Jenkins BD, Hewson I, Mondragon E,Short CM et al. (2007). Experiments linkingnitrogenase gene expression to nitrogen fixation inthe North Pacific subtropical gyre. Limnol Oceanogr52: 169–183.
Zhou A, He Z, Qin Y, Lu Z, Deng Y, Tu Q et al. (2013).StressChip as a high-throughput tool for assessingmicrobial community responses to environmentalstresses. Environ Sci Technol 47: 9841–9849.
Supplementary Information accompanies this paper on The ISME Journal website (http://www.nature.com/ismej)
MicroTOOLs microarray for marine microbial taxaIN Shilova et al
1491
The ISME Journal