a mobile focus + context system
TRANSCRIPT
MOBILE FOCUS + CONTEXT: EXPLORING THE COMBINATION OF
LARGE OVERVIEWS WITH HIGH-RESOLUTION DETAILS IN DYNAMIC,
MOBILE WORK ENVIRONMENTS
by
Majid Nasirinejad
Submitted in partial fulfillment of the requirements
for the degree of Master of Computer Science
at
Dalhousie University
Halifax, Nova Scotia
April 2016
© Copyright by Majid Nasirinejad, 2016

ii
DEDICATION PAGE
Everything in the universe is within you. Ask all from yourself.
~Rumi, 1759 Divan-e Shams

iii
TABLE OF CONTENTS
LIST OF TABLES ....................................................................... vi
LIST OF FIGURES ....................................................................viii
ABSTRACT ............................................................................... xii
LIST OF ABBREVIATIONS USED...............................................xiii
ACKNOWLEDGEMENTS ........................................................... xiv
CHAPTER 1 INTRODUCTION .................................................. 1
1.1 Contributions .................................................................................................... 5
1.2 Structure of the thesis ....................................................................................... 6
CHAPTER 2 RELATED WORK / LITERATURE REVIEW ............. 8
2.1 Information Display ......................................................................................... 8
2.1.1 Portability ............................................................................................ 8
2.1.2 Screen size .......................................................................................... 9
2.1.3 Resolution ......................................................................................... 10
2.1.4 Availability ....................................................................................... 10
2.1.5 Number of users that can use the system concurrently ..................... 11
2.1.6 Precision ............................................................................................ 12
2.1.7 Application of portable information system ..................................... 12
2.2 Large displays ................................................................................................ 13
2.3 Focus + Context Systems ............................................................................... 13
2.4 Off-screen locations techniques ..................................................................... 18
2.5 Overview + Detail Systems ........................................................................... 19
2.6 Augmented/Virtual Reality Systems .............................................................. 23
2.7 Portable Focus + Context System .................................................................. 25
2.8 Projector location ........................................................................................... 26
2.9 Tracking systems............................................................................................ 27
CHAPTER 3 MOBILE FOCUS + CONTEXT SYSTEM ................. 29
3.1 Mobile Focus + Context System (mF+C) ...................................................... 29
3.2 System design ................................................................................................ 43
CHAPTER 4 USER STUDY ..................................................... 50
4.1 Research Questions ........................................................................................ 50

iv
4.2 Study Design .................................................................................................. 50
4.2.1 Interaction Methods .......................................................................... 51
4.2.2 Conditions ......................................................................................... 55
4.2.3 Type of pictures ................................................................................ 57
4.2.4 Tasks ................................................................................................. 58
4.2.5 Experiment ........................................................................................ 69
4.3 Mockup .......................................................................................................... 70
4.3.1 Apparatus .......................................................................................... 70
4.3.2 Software ............................................................................................ 71
4.4 User Study Procedure..................................................................................... 76
4.4.1 System Setup ..................................................................................... 76
4.4.2 The Study Protocol ........................................................................... 78
4.4.3 Data Collection ................................................................................. 79
4.4.4 Participants ........................................................................................ 79
4.5 Data Analysis ................................................................................................. 80
CHAPTER 5 RESULTS ........................................................... 82
5.1 Familiarity with content type ......................................................................... 83
5.2 Conditions Evaluation .................................................................................... 84
5.3 Methods Evaluation ....................................................................................... 86
5.3.1 Methods Time Evaluation ................................................................. 86
5.3.2 Methods in projection conditions evaluation .................................... 87
5.3.3 Methods in task type categories ........................................................ 89
5.3.4 PhoneOnly Evaluation .................................................................... 104
5.3.5 Post-method questionnaires evaluation........................................... 106
CHAPTER 6 DISCUSSION ................................................... 112
6.1 Discussion and analysis ............................................................................... 112
Section 1: Content type ................................................................................ 112
Section 2: Conditions ................................................................................... 113
Section 3: mF+C methods ............................................................................ 114
Section 4: mF+C methods vs. PhoneOnly ................................................... 117
6.2 Limitations ................................................................................................... 119
6.3 Application ................................................................................................... 121
v
6.4 Future work .................................................................................................. 122
CHAPTER 7 CONCLUSION .................................................. 123
BIBLIOGRAPHY ..................................................................... 125
APPENDIX A – INFORMED CONSENT ..................................... 130
APPENDIX B - BACKGROUND QUESTIONNAIRE ..................... 132
APPENDIX C - POST-METHOD QUESTIONNAIRE | IMS ........... 133
APPENDIX C - POST-METHOD QUESTIONNAIRE | SBS ........... 134
APPENDIX C - POST-METHOD QUESTIONNAIRE | SWP .......... 135
APPENDIX C - POST-METHOD QUESTIONNAIRE | PHONE ...... 136
APPENDIX D - POST-EXPERIMENT INTERVIEW ..................... 137
APPENDIX E - PARTICIPANT PAYMENT RECEIPT ................... 138
APPENDIX F - RESEARCH ETHICS BOARD APPROVAL LETTER 139
APPENDIX G - KLM FOR EACH INTERACTION AND TASK ....... 140

vi
LIST OF TABLES
Table 1 Information display properties: portability ........................................................ 9
Table 2 Information display properties: screen size ....................................................... 9
Table 3 Information display properties: resolution ....................................................... 10
Table 4 Information display properties: availability ..................................................... 11
Table 5 Information display properties: number of users that can use the system
concurrently ...................................................................................................... 11
Table 6 Type of Tracking Systems ............................................................................... 28
Table 7 Projected pictures in different sizes and on different types of surfaces ........... 32
Table 8 Comparison between Galaxy S4, Note3, and Tab Pro .................................... 37
Table 9 Advantages and disadvantages of each method ............................................... 51
Table 10 Simulated suboptimal pictures ....................................................................... 56
Table 11 Methods, conditions, types of pictures. ......................................................... 58
Table 12 Task Categories.............................................................................................. 59
Table 13 List of operators and guidelines for calculating the expected time ............... 60
Table 14 Expected time for each task in different methods.......................................... 61
Table 15 Group of tasks for comparing time between Optimal and Suboptimal ......... 67
Table 16 Group of tasks for comparing time between Map and Board ........................ 67
Table 17 Group of tasks for comparing time between PhoneOnly and mF+C ............. 68
Table 18 The order of methods that assigned to each participant ................................. 68
Table 19 The order of methods for each group of participants ..................................... 69
Table 20 The format of the mobile application logger ................................................. 75
Table 21 The format of the mobile application logger for the phone on the head ....... 75
Table 22 List of data collection instruments ................................................................. 79
Table 23 List of questions in post-method questionnaire ............................................. 80
Table 24 List of interview questions ............................................................................. 81
Table 25 List of expected time, average time that participants spent on tasks and ratio
between expected and average time ............................................................... 82
Table 26 Stats for test the effect of familiarity with type of pictures ........................... 84
Table 27 Six participants hand movement visualization ............................................ 108

vii
Table 28 The average of hand movement for each mF+C method............................. 109
Table 29 The percentage of easiness for each method and stats of easiness comparison
between a pair of methods ........................................................................... 110
Table 30 The percentage and stat of lost location for each method............................ 110
Table 31 The rank of methods from participants’ point of view ................................ 111

viii
LIST OF FIGURES
Figure 1 Visitor’s map: Parliament of Canada (left) Eifel tower (right) ........................ 2
Figure 2 Electronic board picture (left) Electronic board diagram (right) ...................... 2
Figure 3 Aircraft technicians need documents during maintenance, documents are
available on their desk (left) or they keep in their hands when he is sitting in
the engine (right) ............................................................................................... 3
Figure 4 An mF+C system: a) Mobile phone position and orientation b) User head
position and orientation c) Line of vision d) Projected screen by embedded
projector ............................................................................................................ 4
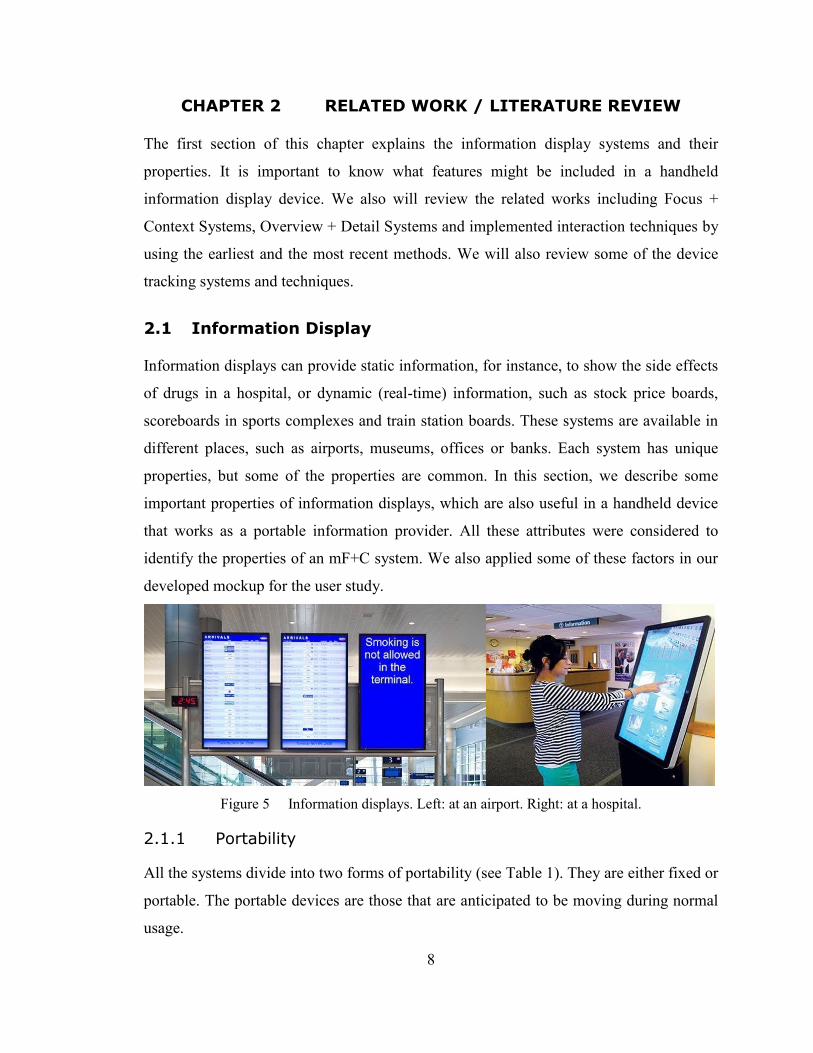
Figure 5 Information displays. Left: at an airport. Right: at a hospital. ......................... 8
Figure 6 Type of displays with high-resolution combined with low-resolution screens.
Left: AVL Systems. Right: Focus+context [2]. .............................................. 10
Figure 7 Diamond Touch Tabletop in MERL ............................................................... 12
Figure 8 Focus plus Context ......................................................................................... 14
Figure 9 F+C on Pocket PC by Lank ............................................................................ 15
Figure 10 F+C with marker by Flider and Bailey ......................................................... 15
Figure 11 A large 2D + 3D Focus + Context Screen developed by Ebert .................... 16
Figure 12 Smart Flashlight ........................................................................................... 17
Figure 13 Halo Technique ............................................................................................ 18
Figure 14 Wedge Technique ......................................................................................... 18
Figure 15 Microsoft PowerPoint with O+D Side Panel ............................................... 19
Figure 16 Overview vs. detail on mobile devices. a) Classic interface b) Split-Screen
interface c) Resizable interface hidden d) Resizable interface - custom
dimensions ................................................................................................... 20
Figure 17 Canyon Technique ........................................................................................ 21
Figure 18 Overview + Detail Interfaces on 3D Public Display .................................... 22
Figure 19 Mobile Augmented Reality System.............................................................. 23
Figure 20 Mobile 3D Graphics and Virtual Reality Interaction ................................... 24
ix
Figure 21 Combining Mobile Projectors and Stationary Display. (Left) Details of map
are projected on a large display. (Right) Mobile projectors provided details
outside of the screen..................................................................................... 25
Figure 22 Head-mounted Projector ............................................................................... 26
Figure 23 Mobile Focus + Context System .................................................................. 29
Figure 24 Optoma PK201 Pico-projector ..................................................................... 30
Figure 25 Mobile phones with built-in projectors. (Left) Ayane (Middle) Galaxy
Beam2 (Right) Galaxy Beam ....................................................................... 35
Figure 26 Mobile phone with built-in projectors. (Left-Middle) SANWA (Right)
SmartCast ..................................................................................................... 36
Figure 27 Number of smartphone users worldwide from 2012 to 2018 ....................... 37
Figure 28 Visible picture through the mobile bumper shows how the picture is related
to the position and orientation...................................................................... 38
Figure 29 Projectable area when projector is embedded with phone ........................... 40
Figure 30 Relation between projection and projectable area ........................................ 41
Figure 31 The projection area in respect of the projectable area & phone movement . 42
Figure 32 Sample of markers for Vuforia SDK that the level of detectability is rated 44
Figure 33 Multiple markers on the wall ........................................................................ 45
Figure 34 Head tracking using Senz 3D depth camera ................................................. 46
Figure 35 Increasing the FoV by adding a wide lens on the front camera ................... 47
Figure 36 A prototype of embedded projector in phone ............................................... 48
Figure 37 Interaction methods: Immersive, find streets marked by numbers ............... 52
Figure 38 User holds phone by left hand ...................................................................... 52
Figure 39 Interaction method: Side-By-Side (SBS) ..................................................... 53
Figure 40 User controlling the viewfinder in SBS method to point on number 1 marker
at the left side of the projection .................................................................... 53
Figure 41 Interaction method: Swipe (SWP) ................................................................ 54
Figure 42 User controlling the location of the projection in SWP method to point on
number 6 marker at the right side of the electronic board ........................... 54
Figure 43 Interaction Methods: PhoneOnly task pictures............................................. 55
Figure 44 Projected picture conditions: Optimal (left) Suboptimal (right) .................. 55

x
Figure 45 Type of pictures: electronic boards (top), maps (bottom) ............................ 57
Figure 46 Expected time calculation procedure............................................................ 62
Figure 47 Structure of the experimental design ............................................................ 69
Figure 48 Polhemus G4 system (left) Sensor on phone (right) .................................... 70
Figure 49 Desktop application (left) Mobile application (right) .................................. 71
Figure 50 Mobile application settings........................................................................... 72
Figure 51 Mobile application task controller ................................................................ 72
Figure 52 Schematic of communication between devices and applications ................. 73
Figure 53 OSC listener function code ........................................................................... 74
Figure 54 Mobile application log function code ........................................................... 74
Figure 55 Sample of mobile application log in CSV format ........................................ 75
Figure 56 Sample of the log from the phone attached to the participant’s head .......... 75
Figure 57 NEC U300X Projector (left) Side view of user interaction area (right) ....... 77
Figure 58 Sensors Location: Front view (left) back view (right) ................................. 77
Figure 59 Setup system: Projection area (left) User side view (right) .......................... 77
Figure 60 Number of participants who selected which type of picture was easier ....... 83
Figure 61 Average of Time for familiarity with type of contents................................. 84
Figure 62 Average total Time to complete a task in both Optimal and Suboptimal
conditions ..................................................................................................... 85
Figure 63 Total time participants spent on Focus/Context in different Conditions on all
tasks that are selected for conditions comparison ........................................ 86
Figure 64 Average of Time for Methods ...................................................................... 87
Figure 65 Average of Time for Methods in each Optimal and Suboptimal conditions 88
Figure 66 (left) Number of times users switched his attention between two screens in
each method for all tasks (right) Amount of time on Focus/Context for each
method.......................................................................................................... 88
Figure 67 "Board with Red and Yellow Connectors" Task .......................................... 90
Figure 68 Time completion of tasks for selected participants in “Board with Red and
Yellow Connectors” ..................................................................................... 90
Figure 69 "Raymond Field" Task ................................................................................. 94
Figure 70 Task completion time for selected participants in "Raymond Field" ........... 94

xi
Figure 71 "Start-Endpoint street and websites" Task ................................................... 97
Figure 72 Time completion of tasks for selected participants in "Start-Endpoint street
and websites" ............................................................................................... 97
Figure 73 "DDR3 Memory" Task ............................................................................... 101
Figure 74 Time completion of tasks for selected participants in "DDR3 Memory"... 101
Figure 75 Average of Time for mF+C system methods and PhoneOnly ................... 105
Figure 76 Post-method questionnaire responses ......................................................... 107
Figure 77 The distribution of device orientation on the pitch axis for all participants109
Figure 78 Structure of experiment design ................................................................... 112

xii
ABSTRACT
This thesis explores the concept of Mobile Focus + Context (mF+C)- using a phone to view
details of content shown on a mobile projected display. A mobile phone and portable
projector can be combined to give a truly mobile information display system. After
defining the characteristics of an ideal mF+C system we present a limited prototype using
off-the-shelf hardware, and define ways to address the limited projection size. Next we
present a mockup that creates the user experience of a fully-featured mF+C system, used
as an experimental apparatus. We identify three candidate interaction techniques for
linking the mobile phone (focus) and the projector (context) displays that we compare in a
user study: Immersive (IMS), where the phone works as a lens controlled by moving it
relative to the projection, Side-by-Side (SBS) where the detail on the phone is highlighted
on the context, and the user pans the focus by swiping, and Swipe (SWP) where the user
simultaneously pans the projected context and the focus by swiping. We find that SWP
took longer and was least preferred of the three techniques to perform a range of tasks
involving maps and electronic diagrams. IMS and SBS were equally preferred, and
performed comparably in terms of time and accuracy. IMS involved fewer shifts in
attention between focus and context, and more overall time spent looking at the focus
screen, and this is correlated with a robustness to degradation in context image quality,
which may be useful in noisy and dynamic work environments.

xiii
LIST OF ABBREVIATIONS USED
mF+C Mobile Focus + Context
AR Augmented Reality
VR Virtual Reality
F+C Focus + Context
O+D Overview plus Detail
OSC Open Sound Control
QR Quick Response
FoV Field of View
MERL Mitsubishi Electric Research Laboratories
AMT Aircraft Maintenance Technicians
CAA Civil Aviation Authority
WI Work Instruction
ppi Pixels per Inch
POI Points of Interests
KLM Keystroke-Level Model

xiv
ACKNOWLEDGEMENTS
First and foremost, I would like to thank my supervisor Dr. Derek Reilly who provided me
with guidance, mentorship and support throughout my studies.
Most special thanks goes to my family who without their support and encouragement I
would not have been able to accomplish this project. To my loving wife, Shabnam for her
encouragement, patience and understanding of what it means for a husband to pursue a
master degree in computer science. To my Mother (Narges) and Father (Reza) for instilling
in me the belief in the importance of education and continuous emotional support in my
pursuit of undergraduate and graduate education.
I also owe special thanks to all GEM Lab members to whom I am thankful for creating a
friendly environment, I would like to especially thank, Dr. Hossein Parvar, Farzaneh and
Mohammad Salimian for helping me through all the times.
Finally, I was fortunate to receive funding from the Boeing Mobile Graphics project
supported by Boeing, the Faculty of Computer Science and Graduate Studies at Dalhousie
University.

1
CHAPTER 1 INTRODUCTION
We are in the information age. This period has seen a shift from analog systems (e.g.
drawing by hand) to digital systems (e.g. plotting by computer using 3d software), and the
creation of digital infrastructures (e.g. data communication via Bluetooth and Wi-Fi).
People have come to expect just-in-time information access, for instance, information
about their surroundings [14], what to eat [29], or available flight tickets [57].
Accessing high level information often leads to a desire to drill down into details. For
example, by using a web search engine, we can easily find that “The Citadel is a famous
historic site in Halifax”, but as a tourist, we may then want answers to the following
questions:
How do I get there?
What is the best time to visit the Citadel?
How much is the ticket?
Can I take photos, or record video?
Are there any restaurants nearby?
What will the weather be like when I visit?
We can find most of this information piecemeal on the internet, but having all the answers
on an interactive portable map may be useful for the tourist, such as highlighting points of
interest and suggested walking routes, and providing links to information about nearby
services. This raises questions, such as how large and information dense the map should
be, whether it should be purely digital or a mix of digital and physical, and how additional
details should be linked.

2
Figure 1 Visitor’s map: Parliament of Canada (left) Eifel tower (right)
An interactive historical site map is just one example of how a large, portable information
display could assist us in our everyday life. There are many examples in the workplace
also. For example, technicians, mechanics, and engineers often work with technical
diagrams to find component locations, read part numbers, and identify items in need of
repair. They work with complex plots in very fine detail that employ a range of visual
markings and attributes, such as numbers, shapes, sizes and colors. They can review,
search, and mark up such documents many times over the course of a job to assist in
decision making and verification. As human computer interaction researchers, we want to
identify and explore approaches that will facilitate doing this on the job site.
Figure 2 Electronic board picture (left) Electronic board diagram (right)
In the aerospace industry, a Work Instruction (WI) is a guide for assembly or maintaining
aircraft elements. It shows how to assemble different parts and how technicians must
perform their tasks [47]. Aircraft Maintenance Technicians (AMTs) are working under

3
limited time, stressful conditions and minimal feedback [32]. Human errors in aerospace
maintenance have an impact on operations [10].
Figure 3 Aircraft technicians need documents during maintenance, documents are available on
their desk (left) or they keep in their hands when he is sitting in the engine (right)
Ott et al. in 1995 [39] (as cited in [36]) reported that aircraft technicians spent 45% of their
work time reading instructions and operation manuals. According to the recent Aircraft
Maintenance Risk Incident analysis [45] and human factors in aircraft maintenance and
inspection [8] provided by the Civil Aviation Authority (CAA1), computer systems are an
essential tool on the job to counter limitations in human working memory. Digital
information is also more easily shared, maintained, and archived across the organization
than information captured on paper.
In the information age, many devices have been invented to make a transition from analog
data to digital data. These days, finding information on electronic devices, such as
desktops, laptops, tablets, and mobile phones is often easier and more convenient than
using printed books, journals, and guidelines. We can store a huge amount of information
on a single device and carry it everywhere. Identifying the appropriate medium
(smartphone, tablet, workstation, etc.) to access this information must take many factors
into account, including the work location, the time available, the desired level of accuracy,
and the work activity itself. For example, a mobile phone or a tablet is portable and has a
touch screen and a high resolution display which is sufficient for operating as a data
provider anywhere. However, the size of the display may not be large enough to have an
1 www.caa.co.uk

4
overview and the information details displayed simultaneously. Returning to the Citadel
example, one might have a small overview map of the Citadel on one screen but need to
navigate away from the map to read information about nearby restaurants. Workstations
and kiosks offer larger information displays but sacrifice portability. In the aerospace
industry this carries large costs as mechanics need to leave the job site to access
information, and then print or otherwise record a hopefully sufficient subset of the
information needed to do their job. Portable projectors offer a large, portable information
display, but projection is affected by environmental factors such as light or the type of
surface that the picture is projected on, and such projectors typically have a lower
resolution, so the provided information may not be as clear as physical displays.
In a Mobile Focus + Context (mF+C) system, a Focus device to show a high resolution
image of the data in detail is a mobile phone, and the Context device providing an overview
of content is a portable projected screen.
Figure 4 An mF+C system: a) Mobile phone position and orientation b) User head position and
orientation c) Line of vision d) Projected screen by embedded projector
The concept of an mF+C system is a mobile phone being operated as a lens to get more
details of the provided content on a large display. While the mobile phone is portable, the
user will be able to work anywhere. A combination of the mobile phone and portable
projection could be used to give a truly mobile information display. For example, our
tourist could access a large interactive map by projecting against the wall of the Citadel,
and our mechanic could explore a schematic from inside or outside the fuselage.

5
To implement an mF+C system, first we need a projected image on a surface. Due to
environmental conditions (e.g., non-planar, non-uniform surfaces, variable lighting) and
projector limitations, the picture may be dark or unclear, texts may not be legible, shapes
may be unrecognizable, and colors may not be distinguishable. In many cases the user may
only see a rather vague overview of the image. However, the user can use the phone to
access details related to the projected image. The high-level goal of the work presented in
this thesis was to explore cases where an mF+C system could be useful and to identify
factors that need to be considered when designing and implementing an mF+C system.
1.1 Contributions
In this thesis, we define the “ideal” mF+C system hardware as a self-tracking handheld
device with an embedded projector on the back, and a wide angle camera in the front to
track the user’s relative viewing angle. Such a system was not available up to the time of
writing. We iteratively experimented with off-the-shelf hardware components and software
APIs, culminating in a limited proof of concept prototype and a set of hardware
requirements for an ideal system. As a result of informal testing we also identified a number
of approaches to address the prototype’s main limitation of small projection size. We then
implemented an additional mockup as an experimental apparatus, using tracking sensors
and a stationary projector, to evaluate the user experience of an mF+C system.
Through a consideration of prior work, we identified three potential methods for linking
detail on the handheld screen with the projected context: Immersive (IMS), where the
phone works as a lens controlled by moving it relative to the projection, Side-by-Side
(SBS) where the detail on the phone is highlighted on the context, and the user pans the
focus by swiping, and Swipe (SWP) where the user simultaneously pans the projected
context and the focus by swiping. We conducted a comparative evaluation of the three
linking techniques with 36 participants, who each performed 14 tasks. We also compared
the techniques with a “phone only” approach as a baseline. For the mF+C methods, we
introduced two projection conditions: optimal and suboptimal. In optimal, the projection
was clear and bright, while in suboptimal, a variety of environmental conditions impacting
projection were simulated (spot lighting, wavy surface, etc.); we assigned six tasks to each

6
condition. We derived an even number of tasks involving maps and electronic circuitry,
inspired by our tourist and mechanic scenarios, respectively. We found that IMS and SBS
performed comparably to phone only in terms of task time and accuracy, while IMS
appeared more robust to changes in projection quality. SWP was ranked as the least favored
method of mF+C by the participants. Familiarity with content type (map or circuitry) was
seen to influence task performance.
To summarize, this research makes the following contributions:
System contributions:
Identified system requirements of an mF+C system
Created a limited prototype of an mF+C system using off-the-shelf hardware, and
defined modes that address limited projection size.
Built a functional mockup using tracking sensors and a stationary projector to create
the user experience of interacting with mF+C methods
Human-centric contributions:
Developed three candidate techniques for linking focus and context views in an
mF+C system, inspired by prior work.
Explored the user experience of mF+C and identified advantages and disadvantages
of each linking technique, including how they compensate for poor context
visibility due to projection on non-planar and/or non-uniform surfaces
Assessed the impact of familiarity with type of content on performance when using
an mF+C system.
1.2 Structure of the thesis
This thesis is divided into seven chapters: Chapter 2 is about information display systems
and related works. Chapter 3 explains the Mobile Focus + Context system, which was
developed in this project by using three methods of interaction. We also discussed why we
need this system. What are the advantages and disadvantages of each method? Which
hardware and software are available to make an mF+C, and what we required to create an
mF+C system? We will also discuss how the mF+C system could be helpful. Chapter 4
begins with the user study introduction, which will be followed by the study design and

7
procedure. In Chapter 5, we analyze the collected data. The discussion, limitations, and
future work will be described in Chapter 6, and Chapter 7 is the conclusion.
8
CHAPTER 2 RELATED WORK / LITERATURE REVIEW
The first section of this chapter explains the information display systems and their
properties. It is important to know what features might be included in a handheld
information display device. We also will review the related works including Focus +
Context Systems, Overview + Detail Systems and implemented interaction techniques by
using the earliest and the most recent methods. We will also review some of the device
tracking systems and techniques.
2.1 Information Display
Information displays can provide static information, for instance, to show the side effects
of drugs in a hospital, or dynamic (real-time) information, such as stock price boards,
scoreboards in sports complexes and train station boards. These systems are available in
different places, such as airports, museums, offices or banks. Each system has unique
properties, but some of the properties are common. In this section, we describe some
important properties of information displays, which are also useful in a handheld device
that works as a portable information provider. All these attributes were considered to
identify the properties of an mF+C system. We also applied some of these factors in our
developed mockup for the user study.
Figure 5 Information displays. Left: at an airport. Right: at a hospital.
2.1.1 Portability
All the systems divide into two forms of portability (see Table 1). They are either fixed or
portable. The portable devices are those that are anticipated to be moving during normal
usage.

9
Portability
Fixed Portable
Large screen in the airport, museums Laptop, mobile, tablet
Table 1 Information display properties: portability
Devices such as mobile phones, laptops, and tablets with different screen sizes are portable,
and if a large screen is required, we can connect them to a video projector. All devices are
small and can be put in a backpack. The fixed systems are typically not movable or cannot
be relocated easily. For example, a large screen at the airport or museum is in a fixed
location. As well, a system with a desktop computer that is connected to a 40” LCD screen
is movable, but it is not easy to carry it everywhere. Due to an mF+C system portability
feature, it can be used anywhere without any additional devices.
2.1.2 Screen size
Screen Size
4” - 5.5” 6.5” 7” - 13” 13” – 18” 18” – 27” +27”
Phone Phablet Tablet
Netbook Laptop
Desktop
Video Projector
All-in-one PC
LCD
Large Dot Matrix
Video Projector
Table 2 Information display properties: screen size
Table 2 shows the variety of screen sizes in an information display. A display with a smaller
screen than a laptop (<18”) is usually portable. All mobile phones, tablets, phablets, and
laptops are common devices with small screen. The displays greater than ~18” are usually
used for stationary devices. All-in-one PCs, LCDs (e.g. monitors, TVs), Dot Matrix screens
are used in systems that are less portable by a person. Video projectors are portable devices
that are available in different sizes from pocket size to stationary size, but even the pocket
size or Pico projectors can provide a large screen with the same size as a desktop or a
stationary display greater than 18”. In an mF+C, it is necessary to have a resizable
overview, which can fit on any surface.

10
2.1.3 Resolution
The quality of screen has an impact on the details of the displayed pictures, texts or
diagrams. A picture on a 100” Dot Matrix screen (369 * 208 pixels) has lower quality than
the same picture on a 100” video projector screen (1024 * 576 pixels). It is because the
pixels density on the Dot Matrix screen (4 ppi) is three times less than a video projector
(12 ppi). These days, LCDs are available with Ultra-HD (4K, 8K with 44-88 ppi) quality,
which can provide a high-resolution picture and text on screens with size of up to 100”.
Resolution
Low resolution High resolution Mixed
LED Dot screen
Video projectors
LCD
LED
LCD + Projector
LCD + Dot matrix
Score board
Advertisement billboards
TV, Tabletops,
Information desks Museums, Art galleries
Table 3 Information display properties: resolution
Several types of displays are categorized in Table 3 based on the resolution. Information
display systems could be made with two different screen qualities (e.g. LED Video Screens
by AVL Systems Ireland2, focus + context by Baudisch et al. [3], see Figure 6). These
provide a high-resolution screen, showing detail, embedded in a low-resolution screen
providing an overview.
Low resolution
Hig
h
Reso
lutio
n
Low
resolution
Low
resolution High
Resolution
Figure 6 Type of displays with high-resolution combined with low-resolution screens.
Left: AVL Systems. Right: Focus+context [2].
A high-resolution detail provider is an important part of an mF+C system.
2.1.4 Availability
The large screen information display system which uses an LCD needs a stand or should
be installed in a fixed location (e.g. on the wall). In addition, a covered location is needed
in some weather conditions (e.g. a rainy day), and the installation location should be at
2 www.avl.ie/products/led-video-screens

11
least the same size as the screen. Whereas a phone, tablet and laptop could be available
everywhere, they have small screens compared to a screen provided by a video projector.
Availability
Fixed location Everywhere
LCD, LED Video Projector, Mobile Phone, Tablet
Table 4 Information display properties: availability
A video projector can project on many types of surfaces, even on a non-planar or a colorful
surface. There is no minimum limitation for the surface size, and if a wall is not available
then the data can be projected onto the floor or ceiling. Since projectors can operate using
rechargeable batteries, they can provide a large screen almost everywhere.
2.1.5 Number of users that can use the system concurrently
Due to the small size of the screen and limited physical space around the display, devices
such as mobile phones, tablets and laptops are typically single user devices.
Number of users that can use the system concurrently
Single Multiple
Mobile Phone, Tablet Tabletop, Video Projector
Table 5 Information display properties: number of users that can use the system concurrently
Table 5 shows several devices for a single user and multiple user categories. There could
be applications that work on mobile phones that let more than one user work on that small
screen, but it is not a common use of a mobile phone. Moreover, there might be large
displays (e.g. information kiosks) that can support one user at time, but that could be
because the application does not support multiple users, or the system only has one-way
inputs (mouse only, no touch screen). However, large display systems such as tabletops
and systems that use a video projector as a screen can offer working areas for more than
one user (Figure 7). An mF+C system can also make it possible to use a large overview by
more than one user.

12
Figure 7 Diamond Touch Tabletop in MERL3
2.1.6 Precision
Tracking the precision of user interaction is a challenge. For example, on a touch screen
display, if the touch area is not calibrated with the application layout, using the system is
not convenient, and the user might not get good feedback. In a 2D system, the user’s
position and orientation do not have an impact on what a user sees as content, but in 3D
systems, the user’s head position and orientation have a direct impact on what part of the
objects are in the user’s view on the screen. In an mF+C system, the amount of precision
is related to how the detail provider is coupled with the overview.
2.1.7 Application of portable information system
A portable information display system that uses a mobile phone and a projector is
applicable for a variety of tasks in different conditions and locations. A mechanic or
technician who needs to look at technical designs at the worksite could use this system to
project the content anywhere; then they can see a big picture of the design and use the
mobile device to get more details. A tour guide can help tourists by showing a 3D model
of famous and historic buildings on the mobile device. While a city map is projected on
the floor, she can use the phone to show the nearby services. A portable information display
system is also useful for teamwork. A group of students, who want to discuss design of a
prototype, can project the 2D model on a wall and see details in 3D view on the phone.
3 Mitsubishi Electric Research Laboratories (MERL) www.merl.com

13
People who deal with high amounts of detailed images are one of the expected groups of
an mF+C system users. This is because the high amount of details in the images make it
difficult for them to have a clear view of these details on a phone screen.
2.2 Large displays
Large displays are physical screens or projected content on a large surface. The physical
screens are less portable, more expensive and cannot be installed everywhere. However, in
the last decade, the dimensions, weight and price of the high-resolution projectors have
decreased. Simon and Manhannan [48] report that users performed MS Excel and
Excel/Word multi-tasks in less time on 21” diagonal screen to compare with 15”, 17” and
19” screens, using the same PC and regular input devices (mouse, keyboard). Czerwinski
et al. [11,12] examined user performance benefits of large displays. They compared the
productivity of multi-application computer tasks on the same PC with common input
devices (mouse, keyboard). They used a 15” LCD screen (1024 * 768) and 42” wide curve
screen, made by three projectors. The display made by projectors was three times wider
but the same height (3072 * 768), like a 15” LCD monitor. They found that users worked
faster on the large display than the small screen. Participants whose computers had large
displays could also memorize more phone numbers than the ones with small display
computers. In our user study when we used a large projected picture as an overview, users
could memorize the names of the locations and recall them for completing the requested
tasks.
2.3 Focus + Context Systems
Focus + Context is a technique to reduce the spatial separation when the focus and context
are merged in the same view. Fisheye [19] is a technique where an overview of data is
available and a focus view with detail exists on the context. However, there is a trade-off
between detail size and context information. Fisheye might be not a useful technique for
very large sized documents (e.g. 3m x 2m with 150dpi – 17717x 5906 px) on mobile phone
screens (3.5” to 5.5” – Full HD 1920x1080) if the overview does not provide useful
information. To overcome this problem, we need a larger overview screen that surrounds
the focus view.
14
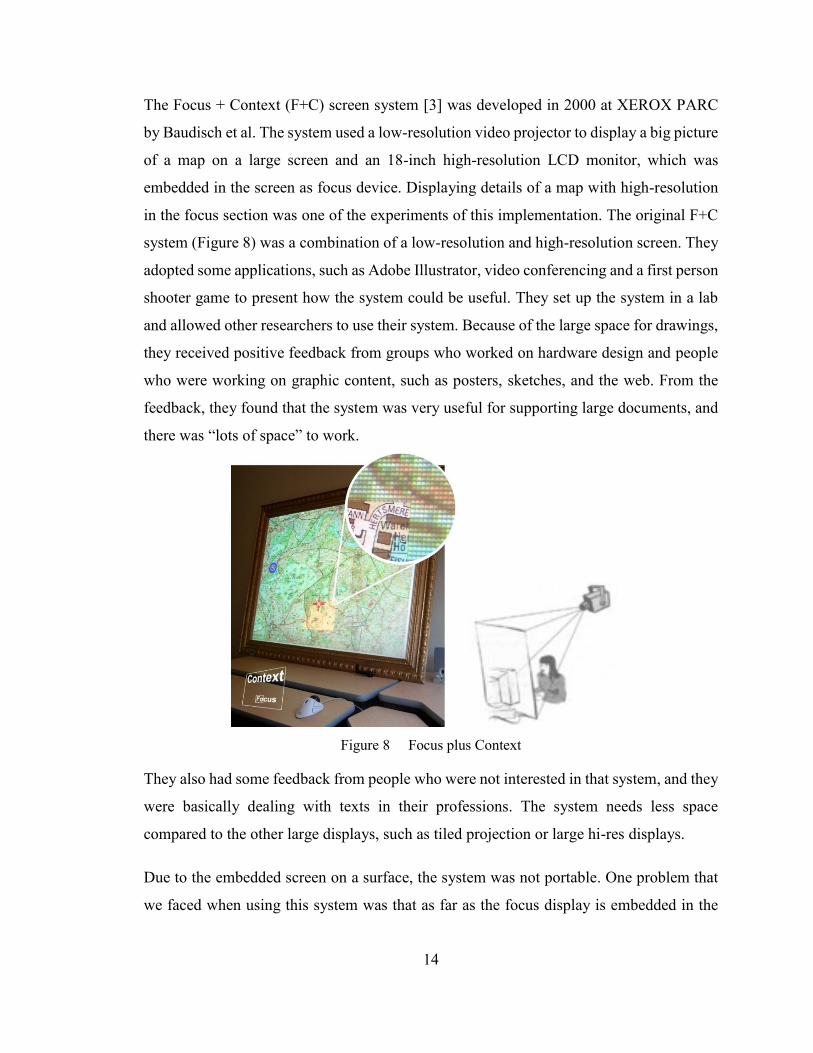
The Focus + Context (F+C) screen system [3] was developed in 2000 at XEROX PARC
by Baudisch et al. The system used a low-resolution video projector to display a big picture
of a map on a large screen and an 18-inch high-resolution LCD monitor, which was
embedded in the screen as focus device. Displaying details of a map with high-resolution
in the focus section was one of the experiments of this implementation. The original F+C
system (Figure 8) was a combination of a low-resolution and high-resolution screen. They
adopted some applications, such as Adobe Illustrator, video conferencing and a first person
shooter game to present how the system could be useful. They set up the system in a lab
and allowed other researchers to use their system. Because of the large space for drawings,
they received positive feedback from groups who worked on hardware design and people
who were working on graphic content, such as posters, sketches, and the web. From the
feedback, they found that the system was very useful for supporting large documents, and
there was “lots of space” to work.
Figure 8 Focus plus Context
They also had some feedback from people who were not interested in that system, and they
were basically dealing with texts in their professions. The system needs less space
compared to the other large displays, such as tiled projection or large hi-res displays.
Due to the embedded screen on a surface, the system was not portable. One problem that
we faced when using this system was that as far as the focus display is embedded in the
15
context surface, the user needs to sit very close to the context screen to see the details in
focus. We considered this problem in our research.
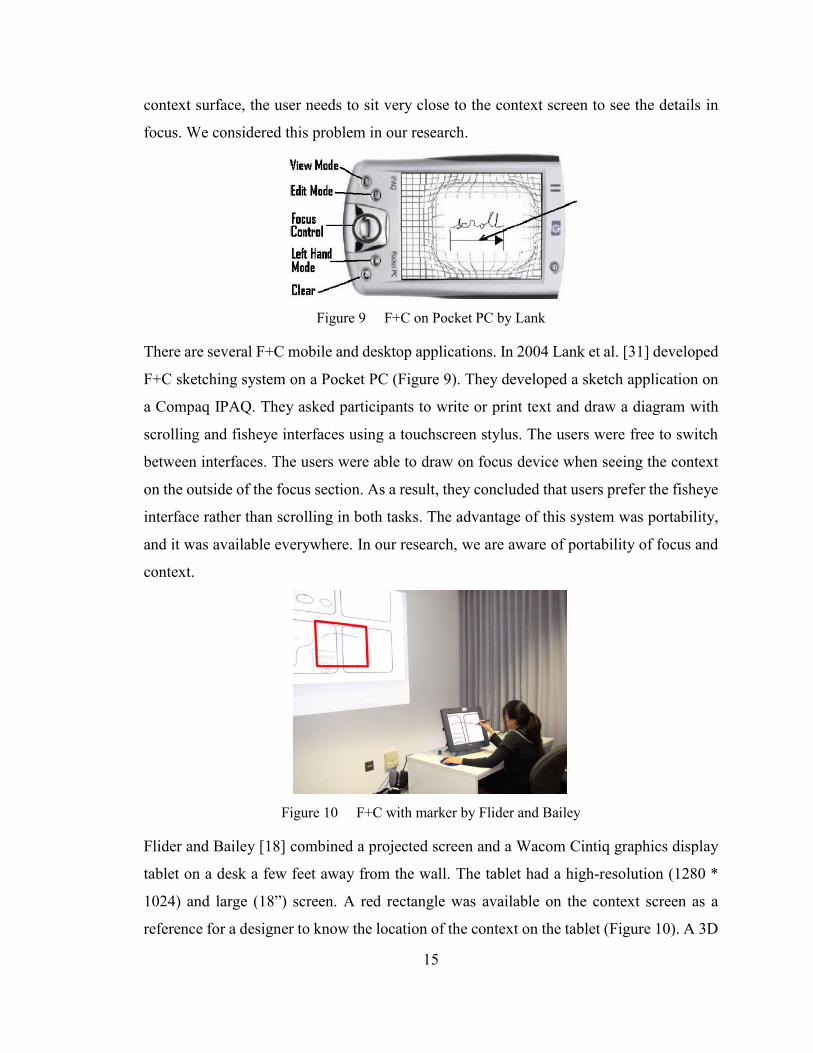
Figure 9 F+C on Pocket PC by Lank
There are several F+C mobile and desktop applications. In 2004 Lank et al. [31] developed
F+C sketching system on a Pocket PC (Figure 9). They developed a sketch application on
a Compaq IPAQ. They asked participants to write or print text and draw a diagram with
scrolling and fisheye interfaces using a touchscreen stylus. The users were free to switch
between interfaces. The users were able to draw on focus device when seeing the context
on the outside of the focus section. As a result, they concluded that users prefer the fisheye
interface rather than scrolling in both tasks. The advantage of this system was portability,
and it was available everywhere. In our research, we are aware of portability of focus and
context.
Figure 10 F+C with marker by Flider and Bailey
Flider and Bailey [18] combined a projected screen and a Wacom Cintiq graphics display
tablet on a desk a few feet away from the wall. The tablet had a high-resolution (1280 *
1024) and large (18”) screen. A red rectangle was available on the context screen as a
reference for a designer to know the location of the context on the tablet (Figure 10). A 3D

16
Connexion Cad mouse was used to control the context position or reference frame. They
evaluated users’ performance, goal error, and satisfaction in two identified methods. The
methods were moving content in the same direction of the 3D mouse movement (Paper
mapping), or in the opposite direction of 3D mouse movement (Scroll mapping). As a
result, they found that most of the users’ attention was on the context screen when
controlling the display. The users also performed Scroll mapping 25% faster, with 70%
less error in panning and 41% less error in zooming compared to Paper mapping. Overall
users were more satisfied with Scroll mapping in comparison with Paper mapping. The two
separated screens that are not on the same plans and moving pointer are considered in our
research.
Figure 11 A large 2D + 3D Focus + Context Screen developed by Ebert
Ebert et al. [16] designed a F+C screen to show high-resolution data on a 2D screen when
it is in a big 3D context (Figure 11). The system was implemented by two 3D projectors to
provide a wall-size screen (2.9m x 2.3m) as a context. There was a Full HD (1920 * 1080)
2D projector to provide a high-resolution screen (0.9m x 1.3m) as a focus, which has 3.5,
times higher resolution than the context. A user study was conducted to evaluate the
reading time and error. The results show that average reading time on 2D-Low-res (1.4
word/sec) was about three times faster than 3D mode (0.5 words/sec); however, in 2D
High-res, the average time was 1.9 words/sec. While the average error of reading tasks was

17
1.26 in 3D mode, it dropped to 0.65 in 2D Low-res and zero in 2D High-res. The results
show that high-resolution 2D focus area improved the time and decreased the error rate.
The system was using multiple projectors; however, installing and calibrating three video
projectors lead to a less portable system and also requires a bright planar surface. The size
of context, quality of focus, and some properties of projection (e.g. planar surface) are
considered in our research.
Figure 12 Smart Flashlight
Dancu et al. [13] developed the Smart Flashlight. They used a combination of a mobile
phone and a Pico-projector to create a bike-mounted projector system to show a large
picture of the map in front of the cyclist. They compared the mounted smartphone display
with the projected display at night, and evaluated how visuo-spatial parameters affect the
interface design for interaction in motion. They used an LG smartphone with 4.7” display
and a Brookstone pocket projector, which was connected to the phone with an MHL
adapter alongside the Viking application. They also attached a GoPro camera to the helmet
to record a video of the journey. Sixteen cyclists conducted the experiment by riding in
four different routes at night to compare map navigation using smartphone display and a
portable projector. 69% of participants found that using a projector was easier and more
helpful than a mobile phone. The report also shows that the projector-based system had a
higher roadand traffic visibility, and 75% of participants reported that the projector-based
system was safer. Participants were interested in the large map by the projector because the
18
street names and map route were clear. For the period that they were using the phone
display, some participants missed the turns because of the small display, and they forgot to
look at it. They reported that they had less safety concerns when they were using the
projected map compared to the phone map because the projected map was in a better view
angle, which allows them to keep their eyes on the road. All participants said that the
projection was bright and clear enough for navigation. Projector location, brightness,
distance from the surface, visibility of data on a small screen vs. a large screen, and
portability were the parameters that we considered in our research.
2.4 Off-screen locations techniques
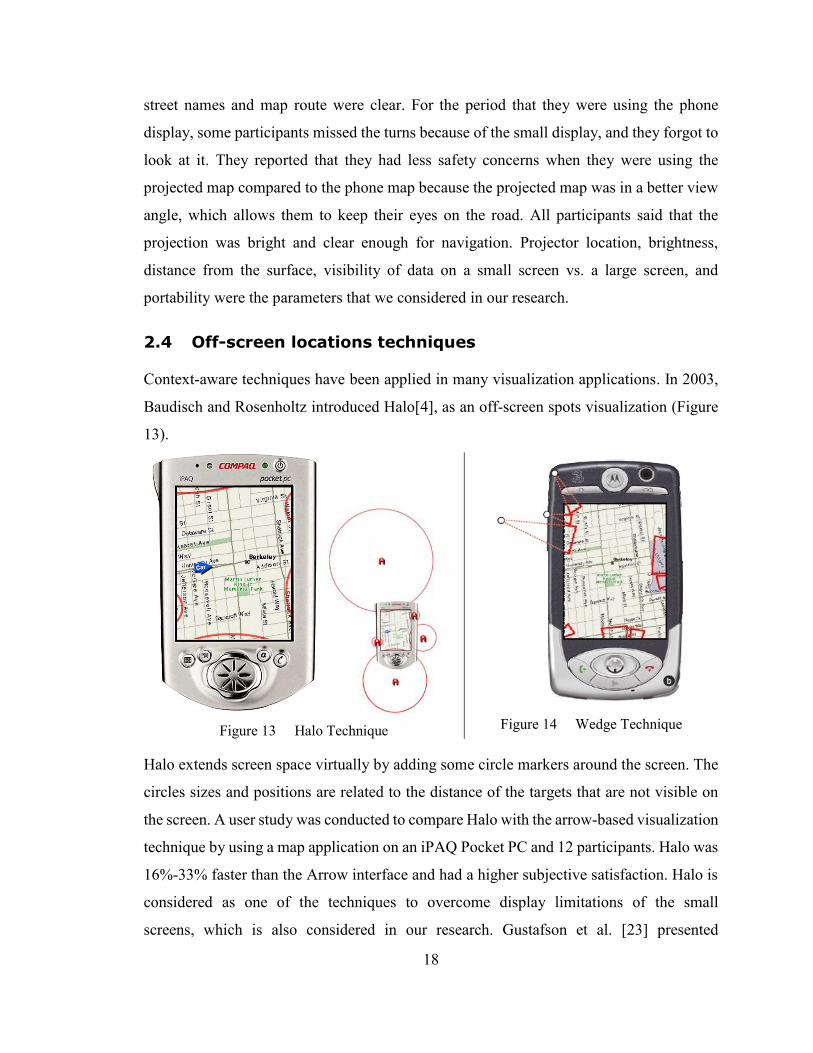
Context-aware techniques have been applied in many visualization applications. In 2003,
Baudisch and Rosenholtz introduced Halo[4], as an off-screen spots visualization (Figure
13).
Figure 13 Halo Technique
Figure 14 Wedge Technique
Halo extends screen space virtually by adding some circle markers around the screen. The
circles sizes and positions are related to the distance of the targets that are not visible on
the screen. A user study was conducted to compare Halo with the arrow-based visualization
technique by using a map application on an iPAQ Pocket PC and 12 participants. Halo was
16%-33% faster than the Arrow interface and had a higher subjective satisfaction. Halo is
considered as one of the techniques to overcome display limitations of the small
screens, which is also considered in our research. Gustafson et al. [23] presented

19
Wedge (Figure 14) as a visualization technique that resolves the multiple overlapped arcs
problem in Halo and also shows the direction to and the distance from the off-screen
locations. They found that while the targets were in the same direction, the number of arcs
increased, so there was a significant clutter of merged arcs that reduced the strength of
Halo. In Wedge, isosceles triangles are used instead of circles for a better representation of
the target’s location. The orientation of triangles solved the overlapping problem in Halo.
A user study was done by 18 participants using a simulated PDA on a desktop computer to
compare Wedge and Halo. The results showed that Wedge was significantly more accurate
than Halo, and the effectiveness was stronger in corners. To overcome the display
limitations, we considered using a single portable device with visual and interactive
pointers that are related to the current user’s point of focus in the developed mockup
2.5 Overview + Detail Systems
To display details of a big picture, Overview + Detail (O+D) is one of the methods. A good
example of this method is Microsoft PowerPoint (Figure 15). The side panel contains some
thumbnails on the left side of the application. By clicking on each thumbnail, the large slide
with details of information will be shown.
Figure 15 Microsoft PowerPoint with O+D Side Panel

20
In the O+D approach, details and context information are displayed in two separate
windows or virtual screens [41].
Figure 16 Overview vs. detail on mobile devices. a) Classic interface b) Split-Screen interface
c) Resizable interface hidden d) Resizable interface - custom dimensions
Goncalves et al. [21], analyzed the effect of the overview scale on mobile O+D interfaces
by using the map application. They used an Android phone with a 3.7” display size and
evaluated four different types of interfaces regarding size and location of the overview
section on detail. Thirty participants performed three tasks, selecting nearest POIs
(selection), finding all highly relevant POIs on the map (explore) and memorizing the two
of them, and POIs approximate location (recall). The results show that people prefer to use
a resizable and non-overlapped overview on a mobile device. They found that users spend
more time on the Explore task in Resizable overview because they have to resize the
overview window during the task; however, the amount of error was less in the Resizable
interface than other methods. Due to the phone’s screen divided for both overview and
detail, the overview section is very small and might not be useful for a large map or
technical diagram without any marker. Having two separated windows for focus and
context, visual markers on context, focus and context on a single portable device, and
optimal focus vs. suboptimal context are considered in our research.

21
Figure 17 Canyon Technique
An interactive O+D information visualization technique has been presented in Canyon
[27], by Ion (Figure 17). The system was implemented by an interactive whiteboard in
3x1.125 m size, with two video projectors and a digital pen. A map application was
designed for the user study. A small screen of off-view objects was attach to the Detail
section. The space between the details screen and the off-view objects was virtually folded.
In Canyon, the overview and detail windows are two separated screens on the same surface
that are not overlapped. Sixteen participants were invited to perform four tasks using
Canyon and Wedge, which is a well-designed off-screen technique. In the Identification
task, Wedge was faster than Canyon; however, in the Movement task, Canyon was more
accurate than Wedge. Moreover, the error in Canyon was less than Wedge in Distance and
Location tasks. The results also shows Canyon improved the accuracy compared to Wedge.
In Canyon, both overview and detail have the same resolution, and they are on the same
plane. Therefore, effects of environmental conditions on the overview might have the same
effects on the detail section, so in this situation having the data on separated screens has
more advantages compared to screens on a same plane. In our research, we considered
interacting with a large projected map and separated screens.

22
Figure 18 Overview + Detail Interfaces on 3D Public Display
Bergé et al. in [5], explored three different interaction methods using a mobile phone in
front of a 3D public display. In the two mid-air navigation techniques, they used a mobile
phone position and a user’s hand position to find the objects in the Overview section. If a
large display was available, the user could use the phone as a details provider. While the
mobile phone was portable, by using a portable overview provider, the entire system was
also portable. In the user experiment, they asked 12 participants to reach a target, which
was randomly placed in a 3D cube. The results showed that the mid-air phone and mid-air
hand, which are immersive methods, performed better than the touch technique, which was
the base method. They also found that mid-air phone method was easier to use and
understand than the mid-air hand method. They reported that the mid-air hand method was
the most, and Touchscreen the least, preferred methods. The limitation in this
implementation is that the picture, which the user sees on the phone, is just related to the
position of the sensors in the tracking system, so if the user is tilting the phone, the picture
on the phone will not change. We consider this problem in two ways in our research. First,
the picture on the phone is related to the device position and orientation that we evaluated
in the first experiment of our research. Second, the data on the phone would be related to
the users’ head position and orientation with respect to the device’s position and
orientation. The results also show the methods that are completely based on users’ hand
movement had a better result than methods with a touch screen, which is considered in our
research.

23
2.6 Augmented/Virtual Reality Systems
Figure 19 Mobile Augmented Reality System
Augmented Reality (AR) applications are using vision based techniques to reveal details
of the item, which would be highlighted by a marker. A marker could be an overview of a
picture or part of a large picture. When the marker is detected by the AR application, the
application can execute functions, such as the display details or additional objects. In our
research, we examined the AR technique with advantages and disadvantages that will be
discussed in the next chapter. Bae et al. [1] developed an application that uses the phone’s
camera to take a picture of buildings; therefore, by comparing the image with pre-collected
site photographs, it can highlight the selected objects on the application. A PC with Intel
Core i7 (quad core) processor with an NVIDIA GeForce GTX560 on an Ubuntu OS was
used as a server for image processing, and several Android phones were used as clients.
The system is portable and does not need any marker or extra sensors, and it is particularly
good for large objects. This is not a real-time system and the user needs to take a photo
and wait for image processing. As the mobile phones do not have a powerful processor for
image processing, the taken picture has to be sent to a server for analyzing, so a network
connection is required. To speed up the file transmission, they established a Wi-Fi
connection instead of the cellular network. The system is supporting multi-user interaction,
24
but because of the third party service (processing on the server), if many users send a
request to the server, it might take a long time to get a result. The results show that the
system could apply to a construction site, and it does not need any external tracking sensors,
which would be considered in our research. The vision-based tracking in this system is
good for the large buildings when small movements (2-10 cm) might not matter, but it is
important in our system.
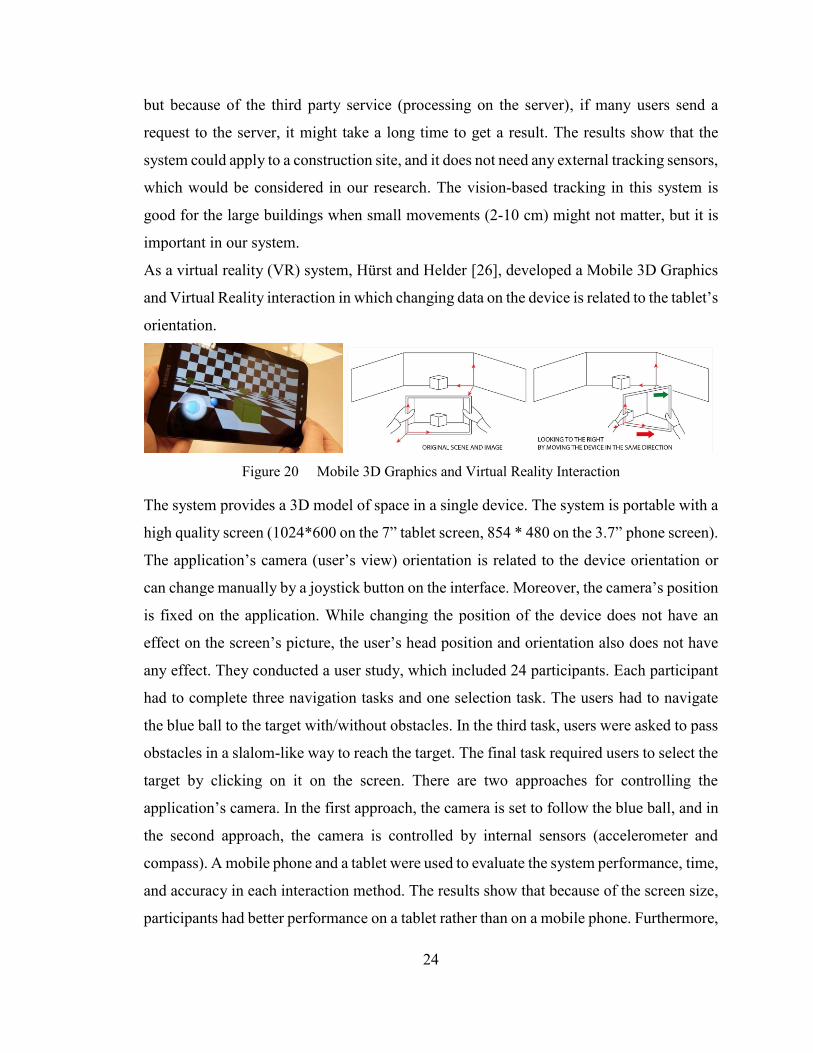
As a virtual reality (VR) system, Hürst and Helder [26], developed a Mobile 3D Graphics
and Virtual Reality interaction in which changing data on the device is related to the tablet’s
orientation.
Figure 20 Mobile 3D Graphics and Virtual Reality Interaction
The system provides a 3D model of space in a single device. The system is portable with a
high quality screen (1024*600 on the 7” tablet screen, 854 * 480 on the 3.7” phone screen).
The application’s camera (user’s view) orientation is related to the device orientation or
can change manually by a joystick button on the interface. Moreover, the camera’s position
is fixed on the application. While changing the position of the device does not have an
effect on the screen’s picture, the user’s head position and orientation also does not have
any effect. They conducted a user study, which included 24 participants. Each participant
had to complete three navigation tasks and one selection task. The users had to navigate
the blue ball to the target with/without obstacles. In the third task, users were asked to pass
obstacles in a slalom-like way to reach the target. The final task required users to select the
target by clicking on it on the screen. There are two approaches for controlling the
application’s camera. In the first approach, the camera is set to follow the blue ball, and in
the second approach, the camera is controlled by internal sensors (accelerometer and
compass). A mobile phone and a tablet were used to evaluate the system performance, time,
and accuracy in each interaction method. The results show that because of the screen size,
participants had better performance on a tablet rather than on a mobile phone. Furthermore,

25
they were faster and also made fewer mistakes on most of the tasks when they used the
tablet compared to the phone. As they mentioned, each of these tasks were designed to be
completed by using two hands: one hand for holding the device, and another hand for
interaction (controlling the joystick on the screen or clicking on the target in the selection
method). Because of the smaller screen size on the phone than the tablet, using two hands
might have an effect a user’s performance, which is not measured in the user experiment.
Using built-in sensors for orientation tracking let us know how the device’s orientation
could be involved in an mF+C system.
2.7 Portable Focus + Context System
Weigel et al. [51], used a mobile projector as a Focus device (Figure 21) to provide more
details of displayed content, such as the name of streets, the name of buildings and POIs.
The details could be available on a Context (Figure 21-left), which is the stationary display.
The system could be portable, but the quality of the focus part is not as good as the picture
on the mobile screen. However, they believed that their system is a toolkit for developing
different applications, so they did not evaluate it.
Figure 21 Combining Mobile Projectors and Stationary Display. (Left) Details of map are
projected on a large display. (Right) Mobile projectors provided details outside of the screen.
They found that tracking the position of the projector using external tracking hardware and
projector brightness were technical limitations. The light issue is known as an
environmental problem. Moreover, we believe that while the details could be projected
anywhere (Figure 21-right), the details could be shared for collaboration; however, because
the details are visible to everyone, it could jeopardize the privacy in case the user does not
want to share with others. It is true that projectors can project anywhere, but as we can see
in this implementation, a planar surface is needed to see the details of the focus section.

26
The details might not be identifiable on a curtain, rug or dark surface. This problem is
discussed in our research.
2.8 Projector location
The location of the projector is one of the most important factors in an mF+C system. The
projector can be attached to the phone [9,43], mounted on a stable part [13], or put on a
head [30,46] or body [34,35,53]. In an mF + C system, a projector must be in a location
where the user’s shadow does not appear on the projection area. A pocket size or a Pico
projector can be installed on the top of the user’s head.
Figure 22 Head-mounted Projector
Chernicharo et al. [7], used an ultra-portable Dell projector on the head (Figure 22) to
broaden the content visibility area over the fixed desktop display by projecting content on
the surface around the fixed screen. In a user study experience with five participants, the
researchers measured the usability of each interaction scenario, such as head-mounted
projector + mouse (HeadMouse) with other methods, handheld + mouse (HandMouse),
handheld + laser (HandLaser), and head-mounted + laser (HeadLaser). The results showed
that HeadMouse was simpler, seamless and more intuitive than other methods. In this
study, the shadow, size and weight of the projector were reported as limitations, so we
considered these problems in our research. The projector’s location and movement were
also considered in our project.
In BrainyHand [50], a head-mounted projector displays information on the user's hand, and
the attached camera is recording the user’s interaction. In the Interactive Dirt [33],

27
McFarlane et al. attached a miniature projector (Dell M109S) to the user’s shoulder. A field
experiment reviewed methods used for system evaluation. They show the projectors could
provide content on different places, such as the body of cars, trees or on the floor.
Projecting on several types of materials is considered in our research. Ota et al. [38],
evaluate projector location on different parts of the body. While some of the locations had
advantages and disadvantages, they reported that projector on the waist had the worst score
because the projected area was affected by the movement. The projector on the head allows
a user to project in a line of eyesight everywhere, so the user can project on a floor or a
ceiling. However, once the user is turning his head to look around, the projection area also
will be turned, which makes interaction more difficult. If the focus of interaction was on a
specific object on the projection area, there were some solutions such as Sticky Light [22],
which is developed by Gunn. In this system, a head mounted camera records the objects,
which were in front of the worker, and sends the data to the expert. The expert chooses the
working area, draws some lines, and sends added information to the worker. A Pico
projector on the hard hat projected the drawing on the objects. The results showed that the
system was operating fine in good light conditions but not in the sunlight due to the
projector lumens. The system also was not working well in a dark environment, because
the camera cannot capture a clear picture.
The projector on the waist is in the opposite direction of the head location. In this situation,
the user needs at least one surface in front of their body to project on, or the projector beam
direction must be adjustable, so the user can look around the projection area by turning his
head without any problems.
2.9 Tracking systems
Tracking the position of a handheld device to move around the screen on a large workspace
is an identified challenge. Sensor-Based, Vision-Based and Hybrid tracking techniques
[37] are three common systems to find the position and orientation of the device, also Zhou
[52] reviewed these tracking systems. Table 6 is based on Zhou’s reviews.

28
Tracking
system Cons Example
Sensor-based
Absorption environmental impact
(magnetic field), Short range, Position
tracking is expensive
Electromagnetic, GPS,
Gyroscope
Vision-based
Short range, Heavy process,
Absorption environmental impact
(light, Sun IR)
VGA Camera, Depth Camera
Hybrid
system
Very different, depending on which
systems are working together
GPS & Accelerometer,
Gyroscope & Depth Camera
Table 6 Type of Tracking Systems
Some example applications were demonstrated for sensor-based technique, including the
retrieval of country information by holding the device in front of a large paper wall map,
and querying bibliographic data from books on a bookshelf. For instance, Fitzmaurice [17]
in 1993 created Chameleon, using a 4” TV with an electromagnetic tracking sensor. As we
described before, Bergé [5] used a Polhemus system for tracking the tablet’s position.
Moreover, Hürst et al. [26], used gyroscope and accelerometer sensors on the 3D model of
space virtual reality application. As a vision-based technique, Sugimoto in Hotaru [49],
used a stereo camera on top of a table to track the position and orientation of a PDA to
make an interactive collaboration system, for example transferring files between two
devices when they are close together. A set of Vicon cameras were used by Weigel et al.
[51] as a motion capture system to track the attached markers on the video projectors for
the focus + context system that we described in 2.4. The Tango [54] VR system, developed
by Google, gave users the chance to create a virtual world of the real environment by using
the built-in depth sensors and camera, which is a hybrid method in device tracking. A
Project Tango device (phone and tablet) can plot its environment in the 3D model in real-
time. The important factors in device tracking are position tracking, orientation tracking,
real-time tracking, and the level of accuracy.

29
CHAPTER 3 MOBILE FOCUS + CONTEXT SYSTEM
In this chapter, we will first describe a Mobile Focus + Context (mF+C) system and how a
mobile phone and projector operate in an mF+C system. We will present how a
combination of a phone and a projector works. We describe how a projected image is
related to the phone’s position. The second part of this chapter is about the system design.
We describe how we observed problems, and how we tried to find a solution and our
successes and failures. We describe what we learned during the system design.
3.1 Mobile Focus + Context System (mF+C)
In the mF+C system, a mobile phone can be used as a high-resolution display that we call
the “Focus” device, and a large display can be used to show an overview of data that we
will mention as the “Context” provider. While the mobile phone is being used as a lens,
more information will be revealed from the context, which is located exactly behind the
phone. In this system, the picture on the phone is totally related to the picture on the large
display. For example, if a city map is on the display, by using the phone in front of the
screen the user can see that part of the map in a high resolution, which is physically
obstructed with the phone (see Figure 23- left).
Figure 23 Mobile Focus + Context System
The data on the phone could be the same as the screen data or in a different view. For
example, a user can see a Satellite version of the map on the phone (Figure 23- left) which

30
is completely synchronized with the City map on the large display. Moreover, the user
might see more details on the phone, which are not shown on the large display, such as the
names of the buildings, streets, or points of interest. In our developed system, we used a
projector as a context provider, which could provide a screen in different sizes (from 20”
to 120”) regardless of the available physical space. Even small and low power projectors
can provide a large screen, which might be not clear, but can provide an overview of the
content. In the case of an unclear overview, we are using a mobile phone to see more details
in high resolution.
Use of a projector in the mF+C system:
These days, projectors are available in different sizes, such as Pico size (similar to iPhone
4/4s – Optoma PK201: 16x60x117mm), pocket size (a bit smaller than a Mac mini -
Optoma ML550: 38x105x105 mm), stationary (Epson EX3220: 294x76x228mm) and
classroom (BenQSH963: 170x432x355 mm). They can project on a curtain or floor, and
on surfaces that are covered by many types of material, such as a concrete wall, wooden
table or an aluminum door. While the pocket-sized projectors are portable and can operate
using rechargeable batteries, they can provide a large screen in many places.
Figure 24 Optoma PK201 Pico-projector
To observe how a projected picture delivered by a Pico projector could be useful, we used
an Optoma PK201 (Figure 24) projector with a rechargeable battery, in 16x60x117mm
dimension, 0.2 kg weight and 20 lumens brightness. This Pico projector with 2.20:1 throw
ratio can project a 60-inch screen from 3 meters, and 21 inches from 100 cm distance. The
following pictures were taken from a small test that we conducted to show how a 20 lumens
Pico projector could provide a picture on different types of surfaces.
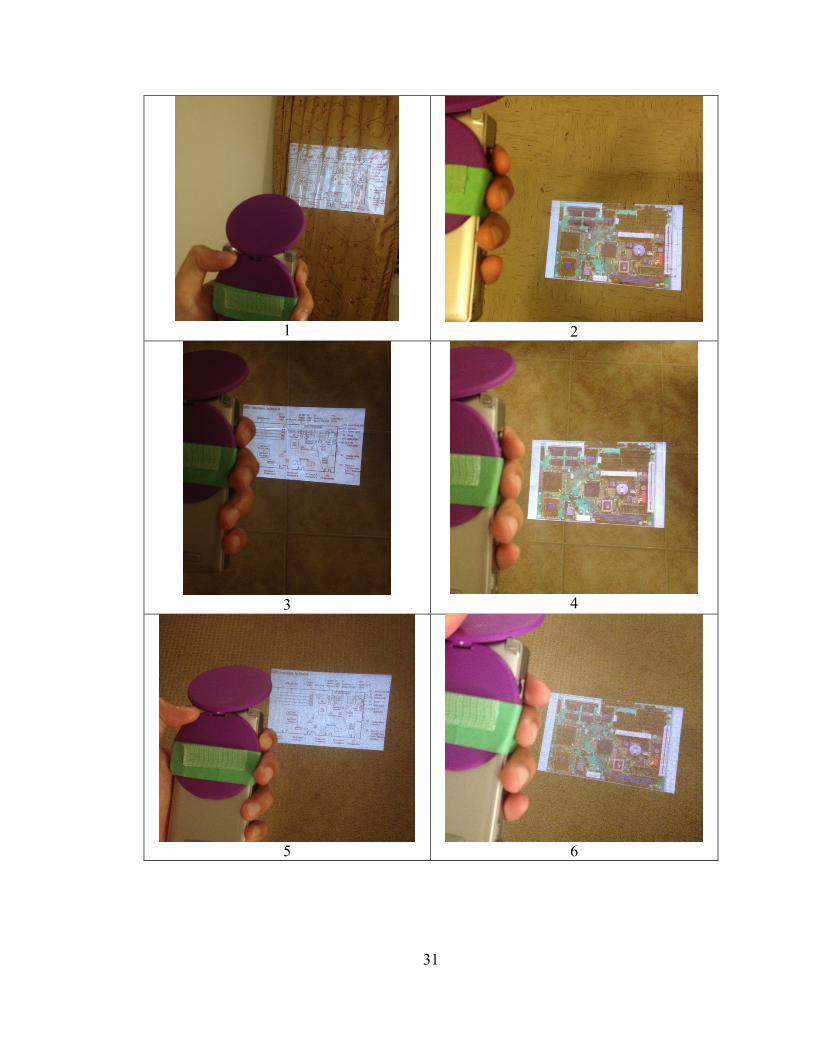
31
1
2
3
4
5
6

32
7
8
9
10
11
12
Table 7 Projected pictures in different sizes and on different types of surfaces
In Table 7, picture 1 shows that how a projected image is visible on an uneven surface. We
projected a technical diagram on a curtain when two 60-watt LED lamps were ON in the
room. While an overview of the picture is visible, in some parts, the texts are readable. The
second picture was taken in the same light condition. The picture is projected on the
laminated floor. As we can see, shapes, colors and components are visible. However, we
knew that there was a name of a company on the top-left white component, but we could
not read it. Additionally, the small words on the board and other components were not

33
identifiable. The mF+C system can help us to find and read these texts in detail. In the third
and fourth pictures, images with dark and bright backgrounds were projected on the
ceramic floor. In the technical diagram with a white background, the texts and shapes were
clearly identifiable, but in the electronic board, which has a dark background, the texts
were not readable. We found that pictures with brighter backgrounds were more
comprehensible than pictures with a dark background. The pictures 5 and 6 are the same
as pictures 3 and 4, but they were projected on a rug. In the white diagram, only large texts
were readable; however, in the board picture, some shapes were faded, texts were not
readable, but colors were distinguishable. Picture 7 shows that the user can project on a
non-planar surface. In this picture, a ~50” image was projected to the corner of the room.
While the texts on the wall were clear and readable, only an overview of the picture on the
curtain was visible. In picture 8, we projected a picture exactly beside the light source.
While reading some small words that were close to the light was difficult, most of the texts
were clear and readable, and we never missed the overview of the information because of
the light. An 86” picture was projected from a 4.2 meters (room width) distance from the
wall in pictures 9 and 10. In picture 9, nothing is visible in the area that was projected on
the paint; however, the texts of the other parts were readable. While on the painted surface,
the projected picture size is increased, but the projector does not have enough power to
deliver a brighter picture. In this test, we found that a low lumens projector is not a good
choice for having a large screen on the opaque surface. In picture 10, the lamps were turned
off, and only one 60-watt LED lamp was ON in another room with 10 meters distance from
the testing area. Similar to the picture 9, we have ~86” screen but on a white wall. In this
picture, large texts were easily readable, but small words were faded. The pictures 11 and
12 were taken in a room with a large window. The pictures were projected beside the
window and affected by the daylight. While some large texts on the technical diagram with
the white background were readable, most of the shapes, colors and texts were not visible
in the board image with the dark background, and even the overview of the picture was not
identifiable. It seems that we needed a projector with more than 20 lumens brightness in
this case. The minimum projected size was 21 inches diagonal (in pictures 2,3,4,5 and 6),
and the maximum was 86 inches (in pictures 9 and 10). By this test, we identified the

34
environmental factors that affect the projected data, and how an mF+C system can cover
those effects and provide access to details of information everywhere.
A projector can project contents in different light conditions. One of the projector
properties is the level of brightness, which is a number in Lumens. As a simple definition,
the lumen is the amount of the light that is emitted from the light source, so more lumens
means more amount of light from the source, and for a projector, this means a brighter
projected picture. The environmental light sources have a direct impact on the projected
picture. As we can see in Table 7 (picture 8), a 41” projected picture by Optoma PK201,
right beside the lamp with 60 watt LED bulb is completely readable from 2 meters. Even
in daylight, we can see an overview of the projected content on the surface, but in the direct
sunlight, the projected picture from this projector was not visible. In an mF+C system
having details of pictures, readable small texts, details of shapes and true colors on the
projection area is not necessary where all of them could be identified by using the mobile
phone as a Focus device. The minimum requirement for a useful context projection
depends on the phone’s width and the distance between the phone and the surface, as well
as the phone and the user’s eyes. By keeping a Nexus5 (137.84x69.17x8.59 mm) in hand,
100 cm away from the surface, and 30cm distance from eyes, we found that an area with
~110mm (width) x ~600mm (height) in the surface is physically obstructed by the phone
and is not visible. Based on our observation and practical tests, we observed that for a
Nexus5 as a Focus device, a 20” diagonal screen (442x248mm, 16:9 aspect ratio) is large
enough to see an overview of a picture. We found that ~165mm of projected picture was
visible from each side of the phone. The 110mm of the surface, which is blocked by the
phone, could be visible through the phone’s screen while using the mF+C system.
A stationary projector can provide a high-resolution picture with high lumens. A short
throw projector (projector with throw ratio less than 1) can provide a picture when it is
very close to the screen. The stationary projector is movable, but it is not as portable as
pocket sized or pico projectors. Some of the smartphones include built-in projectors.
Galaxy Beam4 by Samsung was an Android smartphone that was introduced in 2012 with
4 www.samsung.com/global/microsite/galaxybeam/

35
a built-in DLP overhead projector (Figure 25). The projector had 640*360 resolution, 16:9
aspect ratio, 15 lumens, and 1.8 throw ratio. A 50-inches projection size could be available
from 2 meters away from the surface. To compare with the projector that was used in our
test, this one has a better throw ratio, which means in closer position to the surface it can
deliver a larger picture. In 2014, Samsung released Galaxy Beam 25, a new version of
Galaxy Beam, which was distributed only in China. The new device has a better hardware
specification than the previous Beam, but we could not find the projector’s specification
for this model. Ayane QS4 is another Android phone with an overhead projector, which
uses DLP technology and can provide a screen up to 42 inches with 25 lumens, which is
five units brighter than the Pico projector we tested. Unfortunately, there is also no more
specification available for Ayane QS4.
Figure 25 Mobile phones with built-in projectors. (Left) Ayane (Middle) Galaxy Beam2
(Right) Galaxy Beam
SANWA released PRJ0166, a 35 lumens micro projector with an iPhone holder that makes
it possible to have a projection of the phone screen. The projector with 1.5 throw ratio and
4:3 aspect ratio can provide a 6-60-inches screen from 20-200 cm. A comparison between
the SANWA and our PK201 Pico projector shows that this projector has a better throw
ratio (2.2 vs. 1.5) and better lumens (20 vs. 35). All the phones that include an overhead
projector can be used as an mF+C system; however, because the phone screen is
perpendicular to the projection area, the phone cannot operate as a lens. Since the focus
and the context are not in the same plane, the user’s attention will be on either the focus or
5 www.samsung.com/cn/consumer/mobile-phones/smart-phone/other/SM-G3858MSACHM
6 direct.sanwa.co.jp/ItemPage/400-PRJ016

36
the context or switching between both of them. In May 2015, Lenovo introduced Smart
Cast, a smartphone with a front built-in laser projector, which will be released soon. While
at this time, there is no mobile phone with a projector embedded on the back in the market,
we will show that how we can implement a useful prototype of an mF+C system with off-
the-shelf portable projectors, such as stationary, pocket size, and pico-projectors.
Figure 26 Mobile phone with built-in projectors. (Left-Middle) SANWA (Right) SmartCast
The ideal location of a projector for an mF+C system is on the back of the phone which
would always put the phone in the center of the projection area. Since the projector is
embedded on the phone, when the user is looking directly at the phone screen, the
projection area and the phone screen are in a line with the user’s FoV. The obvious
limitation of this approach is that the projected picture will move as the user moves the
phone; to overcome this issue later in this chapter we will discuss several techniques for an
mF+C system.
Smartphone:
A Smartphone, which in this thesis we will simply mention as “Phone”, is a small
multifunctional, usually touch-driven device with a moderate-sized (3.5”-5.5” diagonal)
high-resolution screen (e.g. iPhone 4s: 640x960 px ~326ppi, Galaxy S6: 1440 x 2560 px
~577ppi). The number of smartphone users worldwide continues to rise from 1.06 billion
devices in 2012 to an estimated 2.56 billion by 2018 [55] (Figure 27).

37
Figure 27 Number of smartphone users worldwide from 2012 to 20187
From the performance point of view, the processing power of smartphones is similar to
phablets and tablets (see Table 8), but they are more portable with less weight and can be
easily held and used in one hand.
Samsung
Galaxy Type
Release
Date Processor
Ram
GB
Display
Size Weight
S4 Phone Mar13 Quad-core 1.6 GHz Cortex-A15 2 5” 130g
Note3 Phablet Sep13 Quad-core 1.9 GHz Cortex-A15 3 5.7” 168g
Tab Pro Tablet Jan14 Quad-core 1.9 GHz Cortex-A15 1 8.4” 336g
Table 8 Comparison between Galaxy S4, Note3, and Tab Pro
Why have a mobile phone + projector?
In our mockup that we set up for testing the limited version of the mF+C system, we used
a stationary video projector to provide an overview of data on a large screen. As we
proposed before, in the mF+C system, a mobile phone should operate as a lens. To achieve
that level of precision, we carefully observed our environment and a large projected picture
on a wall through a simple mobile bumper more than 100 times in a period of 6 months.
7 www.statista.com/statistics/330695/number-of-smartphone-users-worldwide/

38
Figure 28 Visible picture through the mobile bumper shows how the picture is related to the
position and orientation
We found that the view through the bumper depends on the bumper’s location (x, y, z),
orientation (yaw, pitch, roll), size and the distance from the object or the surface. In
addition, the picture that is visible through the bumper is related to our head’s position,
orientation and distance from the bumper. We learned that moving bumper forward and
backward does not change the size of the objects (it is not working as a magnifier), but
affects the field of view. As the first step to create a phone operating as a lens, we made a
mockup in 2D space. In this mockup, a user was able to trace a large projected map. The
picture on the phone was similar to the part of the map that was blocked by the phone, but
it was not related to the user’s head or device orientation. To find the exact area of projected
picture, which was blocked by the phone, we faced implementation challenges due to the
complex geometrical calculation.
The main reason for facing these challenges was because of many variables, such as device
position and orientation, and user’s head position and orientation, which should be
considered in an mF+C system that is supposed to operate in a 3D space.
As two samples of previous research, Hürst [26] used tablet and phone internal sensors to
control the virtual camera’s orientation and a joystick button on the interface to control the
camera’s position in the developed application. Moreover, in Bergé’s [5] project, the

39
position of the marker was controlled by the hand in between the phone and the desktop
display or by phone location. To compare the picture on the phone with these two systems,
in our mF+C system mockup, the data on the phone could be related to the mobile phone’s
position and orientation. The users can trace the large display by moving around the
projection area or just by staying at one point in front of the screen and turning the phone
left/right or up/down. A method to change the picture according to the user’s FoV through
the phone’s screen is added to this system and is being controlled by moving the phone
forward or backward to simulate the content that is visible through the bumper.
Patel in [40], stated how a mobile phone and a Pico projector can be coupled together to
create a single information space by identifying three positions for the phone according to
the projection position. In the first technique, the phone was in front of the projection in
the same direction. In the second approach, the phone was positioned at the side of the
projection, and the projected image was updated by doing any interaction on the phone.
The third method is a combination of the first and the second methods in which the phone
is perpendicular to the projection area while any changes on the phone data will be reflected
on the projection. He developed a prototype of the first configuration (Immersive) by using
an AR application on an iPhone 4s as a details provider and a stationary short throw
projector as a context provider. The developed prototype would just operate if the marker
was available and the picture on the screen was only related to the mobile phone position
and the distance from the surface.
Projection based on the mobile phone location:
Different types of interactions between a user and large screens can take place by tracking
the position of a phone in front of those screens. One of these interactions can be having a
high-resolution version of the low-resolution projected pictures on the phone. To develop
this idea, we propose three methods, which use a phone with an embedded projector. In the
first method, the entire projectable area will be used to present the contents. While the
phone is moving the projectable area will also move, and at the same time, the projected
contents will change based on the phone’s movement direction. In this method, the phone
is always located at the center of the projection.

40
Figure 29 Projectable area when projector is embedded with phone
Figure 29 shows the relation between projectable area and the phone’s location and its
movement in the x-axis (horizontally). The transparent part in the figure is invisible to the
user, and we just intended to show that what is the overview of the map. Figure 29 (top-
left) shows that when the phone is moving to the left, the map moves to the right, so more
parts of the map from the left side is shown in the new content area. On the other picture
(Figure 29, top-right), by moving the phone to the right, the map is shifted to the left, so
more parts of the map from the right side is shown in the new content area. In this method,
losing the overview of the content is an issue. The illustrated figures show that we are
losing the overview of the big map because of the movement, which is just described. For
example, when we are moving to the right (Figure 29, top-right), we are losing the park
area which is located on the left side of the map. Figure 29-bottom shows that what parts
of the map are visible when we are moving to the top-left direction of the initial position.

41
Figure 30 Relation between projection and projectable area
The second method is using a portion of the entire projectable area to show the whole
context. In this method, because the projectable area is bigger than the context view, we
can change the location of the projected content within the projectable area as the phone
moves, such that the projection is effectively kept in a fixed physical position. In the
example shown in Figure 30, the center image shows that a portion of the projectable area
is used to present the overview of the map, and the phone is aligned with the map vertically
at the center. The left image shows that when the phone is moved to the left the projectable
area is also moved in the same direction. As a result of shifting the projected image to the
right, the phone has moved from the center to the left of the context image while the context
remains physically stationary. In this technique, the users would not realize the change of
the projected image location.
As we know, the projection area width is equal to the projector distance from the screen
divided by the projector throw ratio; therefore, in this method by assuming to use 50% of
the projectable area to present the content, there are two ways to have the same projection
area as the first method. The first solution is to use a projector with at least 1/2 throw ratio
of the one used in the first method at the same location. The second method is using the
same video projector and doubling the distance from the screen. In this way, the quality of
the picture depends on the projector specification. Some of the projectors (e.g. Casio XJ-
H2600) can adjust the brightness and focus features automatically to present a sharp
picture; this feature is not currently available in the Pico-projectors.

42
Figure 31 The projection area in respect of the projectable area and phone movement
The third method is a combination of the two previous methods. Figure 31 (from left to
right), shows how this method works for horizontal movement (vertical movement is
supported in an analogous way). In this technique, a portion of the projectable area is used
(image left). By moving to the right until the edge of the projectable area of the initial
position, the projected image location remains unchanged. By passing over the edge of the
projectable area of the initial position, the projected image will also move, and more data
will be revealed. In the other words, by passing the edge of the first projectable area, the
content will move in the same direction as phone movement.
In all three methods, moving in the vertical direction on the y-axis is similar to the x-axis.
While the mobile movement is happening in a 3D space, considering relocation on the z-
axis is important. If we imagine the phone as a lens, moving the phone on the z-axis would
affect the ratio of the focus to the context. Assuming that moving the phone forward and
backward does not affect the projected image size, moving the phone forward would
decrease the range of the focus image on the phone relative to the total context, and moving
it backward would increase the focus range until it contains the entire context at some point.
In all the described methods, the total projectable context area around the phone will
become smaller once the phone moves towards the surface. Moving away will increase the
projectable area, but brightness will be reduced. As we examined a 20 lumens Pico
projector in daylight, with a clear picture and legible texts in 14pt font size, it seems that
brightness would not be a major problem in the daylight or under the artificial lights in the
offices.

43
3.2 System design
For this project, different methods were employed to meet the requirements of an mF+C
system. We started by developing a technique to find the mobile phone position. As we
described, an mF+C system is supposed to operate as a lens. To simulate this factor on a
mobile screen, we should track the phone’s position and orientation.
One option to address the phone tracking challenges is using a vision-based technique for
finding a marker [28,56]. If a marker is a unique object, it can be easily identified, but if it
is part of an object, it would have some limitations to be tracked. Camera vibrations, the
speed of movement and light fluctuations have a direct impact on tracking the marker. The
projected picture on a concrete wall, a rug, and a curtain have less (or maybe not) detectable
features compared to a picture projected on a white planar surface. Therefore, the quality
of picture is important in natural feature tracking. In an mF+C, the projector is embedded
on the phone, so when the phone is moving the marker also moves which might be an issue
for tracking the device location. We developed an Android augmented reality application
using the Vuforia8 plugin developed by Qualcomm in the Unity9 game engine. In this
method, a marker was selected with unique features for adding to a virtual object. At the
time that a marker was detected by the phone’s rear camera the application starts operation.
According to the Vuforia documents, augmentable rating is a range between 0-5 for any
uploaded picture. The image with a higher rate is more detectable. Measureable features
are sharp, spiked or chiseled detail in the image and features should not be a repeatable
pattern. In our informal tests where we used a projected city map, we tried to use some
parts of the map as markers, but the images do not have enough trackable features.
Therefore, we used Quick Response (QR) barcodes as markers.
8 www.qualcomm.com/products/vuforia
9 www.unity3d.com

44
Figure 32 Sample of markers for Vuforia SDK that the level of detectability is rated
A QR barcode has unique features that allow the mobile application to process it very fast
from different distances. In an exploration with our Android app on a Nexus4 mobile
phone, the readable marker from 100cm away of the camera should be in a square with size
at least 7*7cm. When the mobile application is started, the camera stands by to find the
marker. By pointing the camera to the marker, a picture would appear on the phone screen.
As long as half of the marker is in the camera’s FoV, we can move the phone, which would
cause the picture on the phone screen to move at the same time. By changing the distance
between the camera and the marker, the user’s FoV through the phone screen can be also
changed.
Our mobile application, which was developed using Vuforia SDK, is not able to identify
the QR barcodes when they are part of the projected picture on the wall being projected by
a 3100 lumens projector. We believe that it is because of the Vuforia image-processing
algorithm. Therefore, because of this issue a person needs to affix the printed barcodes
onto the projection area. Another issue is that reading a marker by a phone camera can be
affected by various variables, such as camera resolution, autofocus option of the camera,
marker density, marker size, shadows and light intensity[25]. For example, when using our
application on a phone, which has an 8-megapixel camera, in order to interact with a map
from 2 meters, we have to use a square marker, which has the size of at least 14 cm x 14
cm. In order to examine the part of the map that lies outside of the initial region, we have
to add extra markers on the map and assign them to the new objects on the mobile
application. If we have a large map, we need many markers on it. As another example, for
a map with dimension of 3.3m width and 2.5m height, while the phone distance from the

45
wall is 100 cm, we need to pin at least 20 square markers with the size of 7 cm, and also as
the markers are visible they may affect the perception of the content overview.
Figure 33 Multiple markers on the wall
Using a depth camera is a vision-based technique tracking option. A depth camera (e.g.
Microsoft Kinect, Senz3D), uses 2D camera (RGB) plus an IR projector and a depth sensor
to find the depth of the picture in real-time. By adding depth to a 2D picture, the orientation
of the camera can be identified based on the captured picture. There are some limitations
of using a depth camera such as RGB/IR camera’s FoV, such as minimum and maximum
visibility distance, and changes in lighting conditions. However, many solutions have been
provided to overcome the discussed issues, but they could not solve all the problems
because these issues are related to different variables, such as size of the devices, size of
the sensors, device application, and image processing algorithms. According to the Tango
project, which is a real-time camera feed that processes and compares the acquired results
with the pre-designed 3D model of the location, Tango devices do not need any initial
position, and real-time position and orientation are available.
Hybrid methods can increase the level of accuracy and extend the operating space. While
2D cameras can be used for position tracking by collecting data from internal sensors, such
as gyroscopes, compasses and accelerometers, the speed of movement and the orientation
of the device can be added to the application, and they can be calibrated based on the
captured picture by the camera.
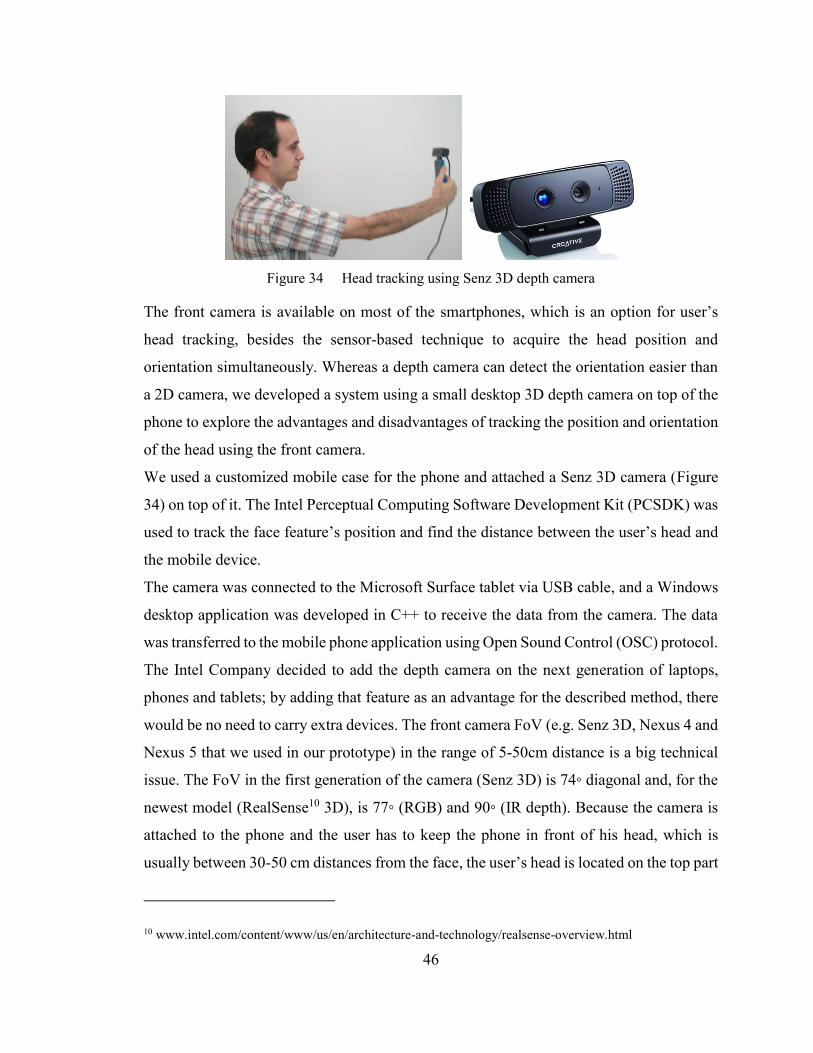
46
Figure 34 Head tracking using Senz 3D depth camera
The front camera is available on most of the smartphones, which is an option for user’s
head tracking, besides the sensor-based technique to acquire the head position and
orientation simultaneously. Whereas a depth camera can detect the orientation easier than
a 2D camera, we developed a system using a small desktop 3D depth camera on top of the
phone to explore the advantages and disadvantages of tracking the position and orientation
of the head using the front camera.
We used a customized mobile case for the phone and attached a Senz 3D camera (Figure
34) on top of it. The Intel Perceptual Computing Software Development Kit (PCSDK) was
used to track the face feature’s position and find the distance between the user’s head and
the mobile device.
The camera was connected to the Microsoft Surface tablet via USB cable, and a Windows
desktop application was developed in C++ to receive the data from the camera. The data
was transferred to the mobile phone application using Open Sound Control (OSC) protocol.
The Intel Company decided to add the depth camera on the next generation of laptops,
phones and tablets; by adding that feature as an advantage for the described method, there
would be no need to carry extra devices. The front camera FoV (e.g. Senz 3D, Nexus 4 and
Nexus 5 that we used in our prototype) in the range of 5-50cm distance is a big technical
issue. The FoV in the first generation of the camera (Senz 3D) is 74◦ diagonal and, for the
newest model (RealSense10 3D), is 77◦ (RGB) and 90◦ (IR depth). Because the camera is
attached to the phone and the user has to keep the phone in front of his head, which is
usually between 30-50 cm distances from the face, the user’s head is located on the top part
10 www.intel.com/content/www/us/en/architecture-and-technology/realsense-overview.html

47
of the FoV cone. Our observations show that when the user holds the phone in hand with
a completely open elbow with minor head movement (10-15cm) from the centerline of the
camera’s vision, the application works precisely. However, trying to move the head in a
slightly wider area (25-30 cm) will cause the head to be placed in the outer range of the
supported region by the camera.
Figure 35 Increasing the FoV by adding a wide lens on the front camera
During informal trials of the mF+C mockup using the Senz3D camera, we found that head
movement in this wider range was quite common, so we tried to use the front camera to
detect the user’s eye. With the aid of Lego elements, we added a wide lens on the original
lens of the front camera to increase the FoV. Figure 35 (right) shows the lens increased the
FoV, and more area of the lab is visible compared to the picture without the wide lens.
Similar to the Senz3D camera problem, because the face was very close to the phone, the
range of head movement was less than 25 cm. Because we concluded that FoV is a major
problem in our prototype, we stopped working on development by using the front camera
and switched to using the sensor-based techniques. Using sensors such as gyroscope and
accelerometer or eye gaze tracker on the user’s head (e.g. smart glasses or hat) are other
techniques. Some head worn electronic devices such as Google glass, Spree11 smart
headband, Spree smart cap and Intelligent Headset12 use built-in sensors to control the
features in their applications or user’s phones. For example, the smart cap is compatible
11 spreewearables.com
12 intelligentheadset.com

48
with a music player controller. Moreover, Intelligent Headset is measuring the head
orientation to arrange a 3D sound based on the user head direction, location and movement.
We considered what a desirable implementation of the mF+C concept might look like. A
phone would need to serve as an all-in-one device, working without any add-on sensors or
additional projection sources and would be a “Turn It On, Use It” system. To achieve the
best solution, the phone should be able to perform the location self-tracking (same as
Google Tango project devices) using the front camera for a user’s head tracking and needs
to include a projector with a brightness of more than 30 lumens, low throw ratio (<1) and
embedded to the back of the phone. With a combination of Nexus 5 mobile phone and a
BenQ Joybee GP2 pocket size projector, we made a mockup to observe the behavior of an
embedded projector on the phone. The phone was attached to the back of the projector in
a position so that the projector lens was at the center of the phone.
Figure 36 A prototype of embedded projector in phone
The projected application was running on a PC and the application’s data was streaming
on Chromecast, which was connected to the projector via HDMI port. The projector was
operating on a battery, and we used a power bank to turn on the Chromecast. A wireless
sensor was attached to the projector to track the position of it. A simple mobile application
included a circle; square and rectangle shapes was developed. By moving the projector to
the left or right, the projected picture’s location was not changing, but the picture on the
phone was changing based on movement direction. However, because of the projector’s
throw ratio, the range of movement was short, and it was just a few centimeters, which lead
us to the conclusion that the prototype was not a success.
While Lenovo produced a prototype of Smart Cast (a phone with a laser projector in top-
front), it seems that there is no technical limitation to have a projector on the other spaces

49
on the phone rather than overhead. We measured the brightness of daylight in our lab,
which was 15-30 lumens, so a projector with more than 30 lumens could present the
contents on a surface in our office without environmental light problems. By looking at the
QS4 Pico projector specifications, we found that it has 35 lumens brightness, which is
enough to work in our office. We also can use the floor surface, which is available
everywhere as a projection plane. To have a picture with 100cm width with a distance of
100cm (approximately above the waistline), the amount of a projector’s throw ratio should
be at least one. As we discussed, the PRJ016 Pico projector by SANWA has a 1.5 throw
ratio. In addition, Microvision SHOWWX is a laser Pico projector with 1.15 throw ratio.
Considering the trends in projector technology, we expect that a better throw ratio (<1) will
be available soon. As a summary, we believe that there are no technical limitations
preventing all of these characteristics to be included in a single device within the next five
years (approximately).
In the next chapter, we will describe the user study that was conducted for this project.

50
CHAPTER 4 USER STUDY
The study focuses on comparing three designed techniques for linking the phone detail to
the projected context. The methods are Immersive (IMS), Side-by-Side (SBS) and Swipe
(SWP). In the IMS method, a user would have to use the phone in front of the projection
area, such that the picture on the phone is related to the user’s position and orientation with
respect to the projected picture. In the SBS method, the user can control a pointer on a
projected picture by swiping on the phone screen, which displays the same data as what
the pointer contains. In the SWP method, the user controls the position of the projected
picture by swiping on the phone while the phone is in front of the projected picture. The
picture on the phone screen shows the section of the projected map which is physically
obstructed by the phone. These techniques will be described in detail in the Interaction
Methods section of this chapter. To gain a better understanding of the impact of the context
of use on the utility of the techniques, we consider different diagram/content types (and
related tasks), and different projection spaces (planar with good projection qualities versus
non-planar, multi-colored and multi-textured). We conduct a within-subject laboratory user
study to answer the research questions. In this chapter, we present research questions, study
design including interaction methods, tasks and conditions, user study procedure and data
analysis.
4.1 Research Questions
In this study, we explore the following research questions:
How does content familiarity affect an mF+C system?
Does providing detail on the phone screen adequately compensate for poor context
visibility due to projecting on non-planar, non-uniform surfaces?
What are the strengths and weaknesses of the three focus + context linking techniques
(Immersive, Side-by-Side, and Swipe)?
4.2 Study Design
As we discussed in Chapter 3, an mF+C system is a mobile device with a powerful
projector embedded on the back along with a self-tracking system. To evaluate how the

51
immersive method could be useful on an mF+C system, we developed a mockup of the
mF+C system and designed Immersive (IMS), Side-by-Side (SBS) and Swipe (SWP)
methods. We included a PhoneOnly technique as a baseline technique (interacting with a
single image on the phone using standard multi-touch pan and zoom). In this user study,
we compared IMS, SBS, SWP, and PhoneOnly methods and explored the advantages and
disadvantages of each method. After method implementation and task design, we
conducted informal tests and noted pros and cons of each method, as listed in Table 9.
Pros Cons
IMS
-Using body movement, tracing on
large content is easier than with
SBS/SWP
-More accurate than SWP
-No need for communication between
focus and context
-Needs device (and user) tracking
SBS
-No need for device tracking
-Picture on the phone is the same as the
marker on the projection
-Tracing (swiping) across a large content area is
tedious
-Needs communication between focus and
context to control the marker position
SWP
-No need for device tracking
-Device works as an indicator to show
the position of the user in the large
context
-Tracing (swiping) across a large content area is
tedious
-Less accurate than IMS/SBS/PhoneOnly
-Needs communication between focus and
context to control the projected content position
Phone
Only
-No need for device tracking
-Single point of focus
-No simultaneous overview + detail
-Small overview
Table 9 Advantages and disadvantages of each method
4.2.1 Interaction Methods
Immersive (IMS):
In the IMS method, the data on the mobile application is completely related to the phone’s
(user’s hand) position, orientation and projected image (Figure 37). In this method, while
the user’s head and mobile screen are in a straight line, the mobile phone works as a lens
and the data on the phone is completely related to the section of the projected picture that
is physically obstructed by the phone. With a 92-inch picture projected on the wall, the
user is free to walk and move around the projection area, using the phone to see more
details or different views of the projected picture.

52
1 2 3
4 5
Figure 37 Interaction methods: Immersive, find streets marked by numbers
In the IMS method, because of the technical constraints (which will be discussed later), the
distance between the user and the surface must be between 1-2 meters. The user is free to
move in any direction; however, in a situation that the user does not have enough space for
movement or does not want to move around the projection, they can tilt their hand left,
right, up or down to move the focus around the context. In this method, the user needs only
one hand to hold the phone (Figure 38). The FoV on the phone can be controlled by moving
the device forward and backward. The text properties, such as font size, weight, and type
vary in different pictures. When the projected pictures contain small or unclear text,
participants can use the FoV feature to make text more legible.
Figure 38 User holds phone by left hand

53
Side-by-Side (SBS):
The second method is SBS. In this method, a rectangular pointer (or viewfinder) is shown
on the projection image (Figure 39), with the same area as is presented on the mobile
screen.
Figure 39 Interaction method: Side-By-Side (SBS)
The user controls the viewfinder position by swiping on the phone. As with all three mF+C
techniques, the displayed data on the phone screen is in high resolution, potentially with
additional details or a different view of the information visible inside the viewfinder on the
projected picture. In this method, there are two buttons for controlling the level of zoom
(similar to FoV in IMS method) and a third for resetting to the initial level.
Figure 40 User controlling the viewfinder in SBS method to point on number 1 marker at the
left side of the projection
In Figure 40-left, user is looking on the context and swiping on the phone to put the
viewfinder on the marker number 1, and then reads the value on the phone (Figure 40-
right). The SBS method is not related to the user’s position or orientation, so the user can

54
stand wherever they wish so long as they can see the viewfinder and projected picture. For
this method, a user can use one hand (depending on hand size and phone dimensions).
Swipe (SWP):
The third method is SWP. This method combines some of the IMS and SBS features. The
user holds the phone in front and center of the projection area and the picture on the phone
relates to the content on the projected display behind the phone (Figure 41).
Figure 41 Interaction method: Swipe (SWP)
In the SWP method, there is no viewfinder on the projection. By swiping on the phone’s
screen, both the picture on the phone and the projected image will move in the same
direction. As with the SBS method, there are two buttons for controlling the level of zoom
and one for resetting to the initial position.
Figure 42 User controlling the location of the projection in SWP method to point on number 6
marker at the right side of the electronic board

55
In Figure 42-left, the user is looking on the context to find the number 6, which is not
visible on the overview. The user then swipes on the phone to move the picture to the left
(Figure 42-right), and they then find the number 6 at the edge of the picture.
PhoneOnly:
In this method, the participants are using the Google photo viewer application to answer
questions about two high-resolution images (Figure 40). An overview of the pictures does
not reveal any answers; however, in the board picture, the colors (red, brown, black, blue
and purple) and shapes (oval, circle, rectangle and square) help participants to find details
needed for answers. In the map, restaurant icons are used to guide the participant.
Participants use pinch, double tap, and swipe gestures to zoom and pan the images.
Figure 43 Interaction Methods: PhoneOnly task pictures
4.2.2 Conditions
We used each interaction technique under both an optimal projection scenario (a
homogenous planar region with good reflective properties for projection) and a suboptimal
one (a non-planar region of varying color and texture) - Figure 44.
Figure 44 Projected picture conditions: Optimal (left) Suboptimal (right)

56
In the optimal condition, the large texts are readable, the colors and shapes can be
identified, and the projected picture is not very noisy, but some specific details are not
available or understandable without using a mobile phone. In the suboptimal condition,
pictures are very noisy or too bright/dark, texts are not readable, shapes are not
distinguishable, or colors are not identifiable. In this situation, to find the objects in the
projection area, the user needs a Focus device to see a high-resolution picture; in this
system, we used a mobile phone as a Focus device.
1
2
3
4
5
6
Table 10 Simulated suboptimal pictures
Table 10 shows a range of simulated suboptimal conditions pictures. In Picture 1, the
natural markers such as a small lake, large lake, highway, and parks are identifiable on the

57
context; however, the name of locations, such as streets, parks and POIs are not readable.
In Picture 2, part of the technical diagram is visible, but there is a spotlight at the center of
the design, which caused missing information. Picture 3 is simulated for projection on the
non-planar surface (e.g. curtain). When the picture is clear enough, but because of the
wrinkles on curtain, the names of streets are not readable over projection. Picture 4 is
simulated as a projection on a rug. In this picture, most of the words are not readable, but
lines are distinguishable, so we can use the lines as a hint to match with the picture on the
Focus device. Moreover, some information is missing in the projected picture, so we are
using a Focus device to have a clearer picture and reveal the missing data. Picture 5 is
simulated as a projection on a dark surface, and picture 6 is simulated as a projection on a
noisy surface.
4.2.3 Type of pictures
Figure 45 Type of pictures: electronic boards (top), maps (bottom)
To alleviate bias based on specific content formats and tasks, we used several documents
falling under two classes: technical diagrams (considered less familiar to the majority of
participants) and street maps (considered more familiar) (Figure 45). We also used a range

58
of different tasks within each class: find a single item, find a group of items, trace paths,
and find items characterized by natural markers or added markers. Urban maps including
transportation network maps, city street maps, and satellite maps were used, which are
familiar to many smartphone users. We used electronic boards and circuit diagrams for the
technical diagram images.
4.2.4 Tasks
We designed 14 tasks. In each task, participants were asked to find the answer to one or
more questions using one of the four methods. Table 11 shows that we have an optimal and
suboptimal condition for each method.
Table 11 Methods, conditions, types of pictures.
All tasks belong to one of the five categories listed in Table 12. In the first category, the
participants find answers based on visible numbers and icons, which were added to the
pictures as markers. In the second category, participants have to find the answers by
following item properties such as color, size, and shape. In the third category, we asked
participants to search in the picture and find answers without any visual hints. Tracing a
route and finding an item based on stated position (e.g. top, left, right) and natural
landmarks (e.g. lake) are the remaining categories.
Category Condition – Picture Type: Question Part
Finding based on added
markers
O-Map: Name of 10 restaurants
O-Map: Name of Location marked 1-5
SO-Map: Name of Streets 1-6
SO-Board: 11 markers on board
SO-Board: Resistor marked by 1
Finding using color-shape
O-Board: Board with RED and Yellow Connectors
SO-Board: BOX of colors, LEDs
O-Board (PhoneOnly): Electronic board
IMS SBS SWP PhoneOnly
OP SO OP SO OP SO Optimal
MA
P
BR
D
MA
P
BR
D
MA
P
BR
D
MA
P
BR
D
MA
P
BR
D
MA
P
BR
D
MA
P
BR
D

59
Search
O-Board: Positive-Voltage Supply
O-Board: DDR 3 Memory
SO-Map: Subway Map
O-Map (PhoneOnly): Restaurant name
Tracing O-Map: Start-Endpoint street and websites
Finding based on position
and natural features SO-Map: Raymond Field
Table 12 Task Categories
The predicted time for each task was estimated using an adaptation of the Keystroke-Level
Model (KLM). We reviewed at least 10 different adapted KLMs for touch-screen devices,
and none of them were valid for our application. For example in this [2] calculation, they
measured 70ms for short untargeted swipe, but in our application we need 9 short swipe to
move from the left edge to the right edge of the picture and it takes 5.10 seconds, which
means each swipe takes about 570ms, includes 70ms (short untargeted swipe) + 500ms(t).
The (t) is the time of application response plus waiting time between swipes and time to
assess where the focus has moved relative to the context. When we found that the KLM on
touch screen is dependent to properties of the application and type of tasks, we decided to
use an adapted KLM, which includes the eight operators as listed in Table 13. Later in this
section, we described each operator in high-level details with an example after Figure 46.
Operator Guidelines – Time(sec)
A: Start Start operation, 0 sec
Q: Time of asking question Average of five times test for each question
G: Gap between question and mentally
preparing or user response 1 sec - Average of five times test
M: Mentally preparing for executing
physical actions 1.35 sec - KLM
S: Search for location or answer 1 sec – numerical /visual markers
2 - 15 sec – without marker
P: Pointing to the location of answer
0.20 sec in IMS in any direction
5.10 sec horizontally leftright | SBS
6.00 sec horizontally leftright | SWP
4.00 sec vertically topdown | SBS/SWP
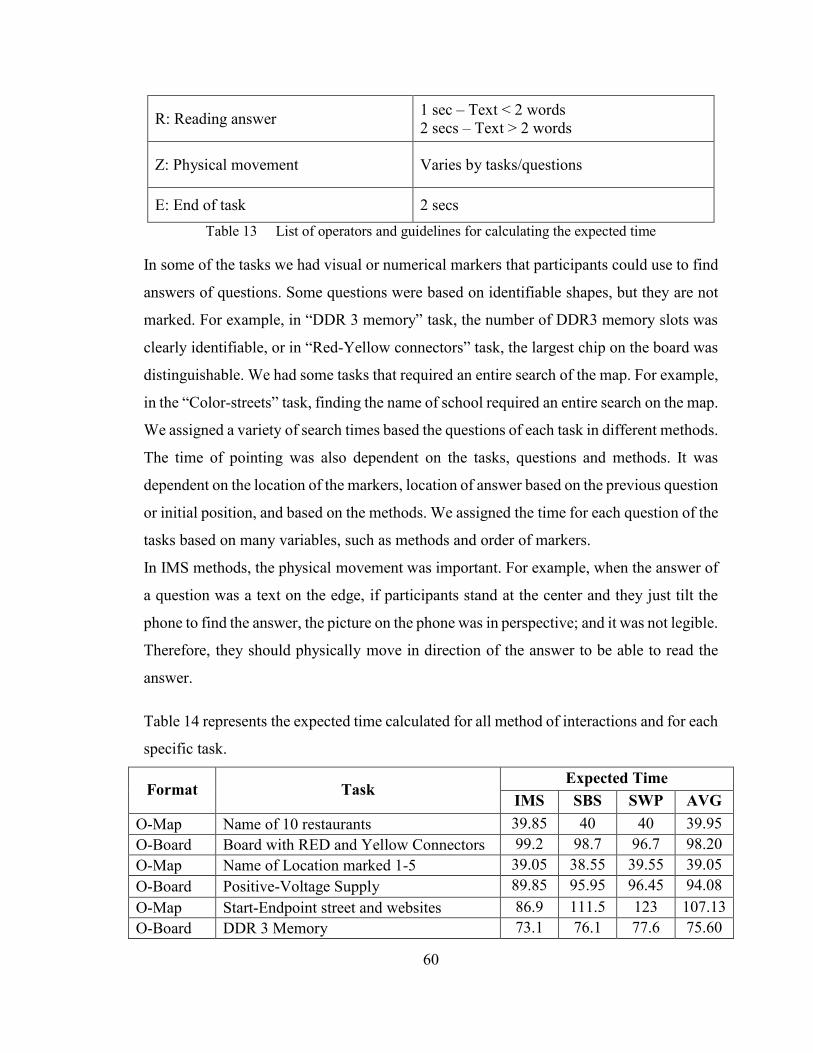
60
R: Reading answer 1 sec – Text < 2 words
2 secs – Text > 2 words
Z: Physical movement Varies by tasks/questions
E: End of task 2 secs
Table 13 List of operators and guidelines for calculating the expected time
In some of the tasks we had visual or numerical markers that participants could use to find
answers of questions. Some questions were based on identifiable shapes, but they are not
marked. For example, in “DDR 3 memory” task, the number of DDR3 memory slots was
clearly identifiable, or in “Red-Yellow connectors” task, the largest chip on the board was
distinguishable. We had some tasks that required an entire search of the map. For example,
in the “Color-streets” task, finding the name of school required an entire search on the map.
We assigned a variety of search times based the questions of each task in different methods.
The time of pointing was also dependent on the tasks, questions and methods. It was
dependent on the location of the markers, location of answer based on the previous question
or initial position, and based on the methods. We assigned the time for each question of the
tasks based on many variables, such as methods and order of markers.
In IMS methods, the physical movement was important. For example, when the answer of
a question was a text on the edge, if participants stand at the center and they just tilt the
phone to find the answer, the picture on the phone was in perspective; and it was not legible.
Therefore, they should physically move in direction of the answer to be able to read the
answer.
Table 14 represents the expected time calculated for all method of interactions and for each
specific task.
Format Task Expected Time
IMS SBS SWP AVG
O-Map Name of 10 restaurants 39.85 40 40 39.95
O-Board Board with RED and Yellow Connectors 99.2 98.7 96.7 98.20
O-Map Name of Location marked 1-5 39.05 38.55 39.55 39.05
O-Board Positive-Voltage Supply 89.85 95.95 96.45 94.08
O-Map Start-Endpoint street and websites 86.9 111.5 123 107.13
O-Board DDR 3 Memory 73.1 76.1 77.6 75.60

61
SO-Map Name of Streets 1-6 46.8 51.6 54.6 51.00
SO-Board BOX of colors, LEDs 159.35 154.25 154.25 155.95
SO-Map Raymond Field 63.95 64.15 66.15 64.75
SO-Board Resistor marked by 1 63.5 75.8 77.3 72.20
SO-Map Subway Map 80.35 88.15 91.15 86.55
SO-Board 11 markers on board 72.55 71.35 74.85 72.92
Optimal PhoneOnly – Map + Board 109.55
Table 14 Expected time for each task in different methods
The expected time is calculated based on the correct way to use the methods. For example,
in SWP we asked participants to stand at the center of the projection and hold the phone in
the direction of the projection. Table 14 shows that the expected time in SBS and SWP for
each task are close to each other. As we described, in SBS the overview is always available,
but in SWP while projection is moving, in many tasks, the part of the context is out of the
projectable area. In SWP, we measured the time for each question of the task based on the
previous question, and we considered that in which question the answer of the next question
was visible in the context. The list of all measurements are available on the Appendix G.
The following example, which is for the “finding the name of 6 streets” task, shows how
we calculated the expected time for each task.

62
Figure 46 Expected time calculation procedure
In all IMS methods for all tasks, we assumed that pointing to the answer takes 0.2 seconds.
We measured the physical movement that the user needs to move in front of the 92”
projection to find the answer from 1-6 is 11 seconds, but there is no movement in SBS and
SWP. In SBS, the amount of time that user needs to move the marker from one side to
another side on a 92” screen is ~5 seconds, and at the beginning of the task, the marker is
located at the center of the projection area, so we calculated the time that the user needs to
point the marker on number 1 and then followed the other numbers. While the SWP method
is very similar to SBS in swiping, in some case that user loses the overview of the picture,
they need more time to find the markers that we considered in our prediction.
As an example, we are describing in high-level details how we calculated the expected time
in each method for this task. In this task, the difference between methods are highlighted
by red colors. In this task, six street names are marked with numbers on the map. The
location of the markers were highly visible and they were large enough to easily read in
the user study area.
In IMS when the picture was projected and participant stood at the center of the projection,
we asked participants to press the Start button. There is a time to get the sense that the Start
button is pressed and we should go to the next step, which is asking the question, we called
this time as a gap and measured as 1 sec. The time of asking each question was measured
as an average of five repetitions for each question. From the KLM model, the brain

63
processing time is measured by 1.35 second. In this task, we had six markers, so we
calculate six times to have participants think about the question. When participants
understand the question, now it is the time for finding the answer. First, they need to search
over the map to find the location of the answer. In IMS methods, the user can see the
overview of the map. Therefore, in a task that the markers are identifiable, by a quick visual
search, they can find the location of the answer, we assumed that it takes 1 sec for searching
the location of the right marker. In the tasks, that finding the location of answer is related
to the question, the time of finding is varies based on the size, position, color, transparency,
contrast and many more variables of the objects. In the case that objects do not have any
marker, but they are visible in the context, for example a large square shape, or thick red
line on a white screen, user can find them faster than those do not have specific properties,
for example finding the name of street on a large map, without any cue. In this task, we
had six large numerical markers, so we multiplied 6 by 1 sec for all search. When the user
finds the location of the marker, then they should find the answer by pointing to the marker.
In IMS, the user is free to move or tilt the phone to point to the marker, but tilting the phone
is not a good solution for reading the names at the side of the projection, when the displayed
picture is in the perspective. So in IMS it is expected that the user moves to the sides to
find the answers, which has a time cost. We assumed 0.2 sec as a time for controlling the
phone to point to the marker, regardless of physical movement. In this task, by 6 markers
we multiplied 6 to 0.2 sec to calculating the pointing time. We measured the physical
movement time for each task based on the questions, and the location of markers. For
example, in this task, finding the answer of number 1 and 2 needs physical movement, but
marker 3 is very close to the number 2, so user can find the answer of it without additional
movement. After that finding the answer for marker 4 needs physical movement to the right
side of the projection area, but no more movement is required for number 5 and 6. We
calculated 11 second movement for this task. At the time user pointed to the marker, he
must read the answer on the phone, which needs context switching from projection to the
mobile screen that costs time. Then user have to identify the answer on the phone. In this
task, the markers were pointed to one specific word and there was no more word on that
area, but in the other tasks that might be 2-3 words are visible in the phone screen, user
needs to justify the location of the phone to find the correct word. We considered the

64
context switch time, and justifying time in “pointing” time. The reading time is different
when some of the answers are short but they are not English words or they have more than
2 words. We assumed that 1 sec for up to 2 word/number/character answers and 2 secs for
more than 2 words answers. In this task, we multiplied 6 to 2 sec for reading the answers.
When participant found the answer of marker 6, he is waiting to know what should he do,
which takes a waiting time, so we asking him to press the End button. This request and
user preparation to operation takes a time that we assumed 2 secs for pressing the end
button. The list of method encoding for this task in IMS is:
Q1:
1- Start the task (A)
2- Waiting for question (G)
3- Asking question (Q)
4- Mental preparation (M)
5- Search for marker 1 (S)
6- Physical movement to location of marker 1 (Z)
7- Point the phone to marker 1 (P)
8- Read the value of marker 1 (R)
Total:
A+G(1)+Q(5.5)+M(1.35)+S(1)+
Z1(3.55)+P(0.2)+R(2)
= 14.6
Q2:
1- Mental preparation (M)
2- Search for marker 2 (S)
3- Physical movement to location of marker 2 (Z)
4- Point the phone to marker 2 (P)
5- Read the value of marker 2 (R)
Total:
M(1.35)+S(1)+Z2(2.45)+P(0.2)
+R(2)
= 7
Q3:
1- Mental preparation (M)
2- Search for marker 3 (S)
3- Point the phone to marker 3 (P)
4- Read the value of marker 3 (R)
Total:
M(1.35)+S(1)+P(0.2)+R(2) =
4.55
Q4:
1- Mental preparation (M)
2- Search for marker 4 (S)
3- Physical movement to location of marker 4 (Z)
4- Point the phone to marker 4 (P)
5- Read the value of marker 4 (R)
Total:
M(1.35)+S(1)+Z3(5)+P(0.2)+R(
2)
= 9.55
Q5:
1- Mental preparation (M)
2- Search for marker 5 (S)
3- Point the phone to marker 5 (P)
4- Read the value of marker 5 (R)
Total:
M(1.35)+S(1)+P(0.2)+R(2)
= 4.55

65
Q6:
1- Mental preparation (M)
2- Search for marker 6 (S)
3- Point the phone to marker 6 (P)
4- Read the value of marker 6 (R)
Total:
M(1.35)+S(1)+P(0.2)+R(2)+
E(2)
= 6.55
A+G(1)+Q(5.5)+6M(1.35)+6S(1)+Z1(3.55)+Z2(2.4
5)+Z3(5)+6P(0.2)+6R(2)+E(2)
Total time task completion
=46.8
In SBS, when user can see the overview of picture, the time for some of the operators is
same as IMS method. The question time, gap, mental preparation, search on the overview,
reading the answers and pressing the end button are similar to IMS. One difference is that
in SBS, user do not need a physical movement, but the pointing to the location of marker
is different. At the beginning of task, the viewfinder is in the center of the projection. In
this task, when participant find the number 1, he must look at the context to know the
location of the viewfinder. At the same time of looking on the context, he should swipe on
the phone screen to control the location of the pointer and put the viewfinder on the marker
1. There is a context switch between projection and phone screen to read the value of
marker. Then he needs a mental preparation to find the number 2 and there is another
context switching cost when he needs to look at the projection. Now it is the time for
pointing to number 2 read it and then continue to the end. In SBS, we measured each
pointing time for each question of tasks, based on many variables, such as the type of tasks,
visibility of the markers (if exist), visibility of the answers, the location of the answers
which needs deep search, and the answer of previous questions when the user can recall
the location.
The method encoding for this task in SBS is:
Q1: A+G(1)+Q(5.5)+M(1.35)+S(1)+P1(2.5)+R(2) = 13.35
Q2: M(1.35)+S(1)+P2(2.5)+R(2) = 6.85
Q3: M(1.35)+S(1)+P3(1.5)+R(2) = 5.85
Q4: M(1.35)+S(1)+P4(3.5)+R(2) = 7.85
Q5: M(1.35)+S(1)+P5(3)+R(2) = 7.35
Q6: M(1.35)+S(1)+P6(4)+R(2)+E(2) = 10.35
Total: A+G(1)+Q(5.5)+6M(1.35)+6S(1)+P1(2.5)+P2(2.5)+P3(1.5)+P4(3.5)+P5(3)+
P6(4)+E(2) =51.6
In SWP, at the beginning of the task, user can see the overview of the picture, so similar to
SBS, the time for some of the operators is same as IMS method. The question time, gap,
mental preparation, search on the overview, reading the answers and pressing the end

66
button are similar to IMS and SBS. In the when user is stand at the center of the projection,
and holed up the phone in direction of the projection, he wants to find the value of number
1. When he is looking at the context, he swiping on the phone screen to move the projection
and put the marker 1 on the position that he could be able to see the answer of the marker.
In SBS, there was a viewfinder which works as a pointer and user was completely sure that
the data on the viewfinder is exactly same as on the phone screen, but in this method,
justifying the location of the marker to be in a right place that user can see the answer on
the phone is more challengeable that SBS. To justify the location, user needs more context
switching between projection and the phone screen, which costs the time. In this task when
user moved the projection to the right side, after finding the number 1, only a quarter of
the map is visible on the projection. To find the answer of number 2, user can find the
marker very fast by a quick visual scan on the small map. But after user finding the answer
of number 3, the number 4 is not visible on the overview. At this time user should move
the map until to put in the initial position or finding the location of the next marker. In this
case, pointing to the next marker takes time to find the location of marker, but we believe
that most of these actions will be happened during a short period of time and many of them
are happened at the same time. For example, when user moving the projection to the left
he also visually scan the new area that is available, so there is no extra search time. In
addition, if he needs 5 second from marker 3 to 4, when he is moving the projection to the
left, and he find the marker 4 on the right when the whole projection is visible, now he
needs only 2 seconds to reach the new location, which is marker 4. Same as SBS, we
measured each pointing time for each question of tasks, based on many variables, such as
the type of tasks, visibility of the markers (if exist), visibility of the answers, the location
of the answers which needs deep search, and the answer of previous questions when the
user can recall the location.
The method encoding for this task in SWP is:
Q1: A+G(1)+Q(5.5)+M(1.35)+S(1)+P1(2.5)+R(2) = 13.35
Q2: M(1.35)+S(1)+P2(2.5)+R(2) = 6.85
Q3: M(1.35)+S(1)+P3(1.5)+R(2) = 5.85
Q4: M(1.35)+S(1)+P4(4.5)+R(2) = 8.85
Q5: M(1.35)+S(1)+P5(5)+R(2) = 9.35
Q6: M(1.35)+S(1)+P6(4)+R(2)+E(2) = 10.35
Total: A+G(1)+Q(5.5)+6M(1.35)+6S(1)+P1(2.5)+P2(2.5)+P3(1.5)+P4(4.5)+P5(5)+
P6(4)+E(2) =54.6

67
We calculated the expected time for all other tasks, which are available in the Appendix G,
using the described formula.
Different pictures and tasks were used for the Optimal and Suboptimal conditions;
therefore, we use the same approach for comparing time between these conditions.
Participants performed all tasks using all methods, so we used all tasks for method
comparison.
Optimal vs. Suboptimal
Expected Time (sec)
Optimal Suboptimal
Name of 10 restaurants
Board with RED and Yellow Connectors
Name of Location marked 1-5
Positive-Voltage Supply
Start-Endpoint street and websites
DDR 3 Memory
Total:
39.95
98.20
39.05
94.08
107.13
75.60
454.02
Name of Streets 1-6
BOX of colors, LEDs
Resistor marked by 1
Subway Map
11 markers on board
Total:
51.00
155.95
72.20
86.55
72.92
438.62
Table 15 Group of tasks for comparing time between Optimal and Suboptimal
Table 15 shows that six optimal tasks have similar total times with the five suboptimal
tasks, so we are comparing these two sets with times that participants spent on each to find
the differences between the conditions.
Similar to the condition comparison, we used sets of tasks that are similar in expected time
for comparing the familiarities with the type of content.
Map vs. Board
Expected Time (sec)
Map Board
Name of 10 restaurants
Name of Location marked 1-5
Start-Endpoint street and websites
Name of Streets 1-6
Raymond Field
Subway Map
Total:
39.95
39.05
107.13
51.00
64.75
86.55
388.43
DDR 3 Memory
BOX of colors, LEDs
Resistor marked by 1
11 markers on board
Total:
75.60
155.95
72.20
72.92
376.67
Table 16 Group of tasks for comparing time between Map and Board

68
Table 16 shows that the total expected time for six map tasks (388.43) are close to the four
board tasks (376.67); so we compared these two groups of tasks with the times that
participants spent on each task to find the time relation between Map and Board.
We are using the phone to see high-resolution pictures, so in the PhoneOnly method there
were only Optimal pictures. To compare the PhoneOnly method with the other mF+C
techniques, we calculated the expected time of task completion for a PhoneOnly method
on board task using modified KLM assessment. We selected one board from a group of the
mF+C methods with similar type of tasks - Table 17.
PhoneOnly vs. mF+C methods
Expected Time (sec)
PhoneOnly Optimal mF+C system
Optimal Board 52.15 Board with RED and Yellow Connectors 98.20
Table 17 Group of tasks for comparing time between PhoneOnly and mF+C methods
Each interaction method has one map and one electronic board. We made a counterbalance
for an order of assigning the methods, conditions, and tasks for each participant (Table 18).
In this table, for each user, the first character stands for condition (Optimal, Suboptimal);
the second character is the type of picture (Map, Board). Four tasks were completed for
each F+C method, and the final two assignments in each ordering (after the dash) are for
the PhoneOnly method.
ID 1,13,25 2,14,26 3,15,27 4,16,28
OM|OB|SM|SB - OM|OB OB|SM|SB|OM - OB|OM SM|SB|OM|OB - OM|OB SB|OM|OB|SM - OB|OM
ID 5,17,29 6,18,30 7,19,31 8,20,32
OM|SM|SB|OB - OM|OB SM|OB|SB|OM - OB|OM OB|SB|OM|SM - OB|OM SM|OM|OB|SB - OM|OB
ID 9,21,33 10,22,34 11,23,35 12,24,36
OB|OM|SM|SB - OM|OB OM|SM|OB|SB - OM|OB SB|SM|OM|OB - OM|OB OM|SB|OB|SM - OB|OM
Table 18 The order of methods that assigned to each participant

69
4.2.5 Experiment
A within-subject design was used with three different interaction methods (IMS, SBS,
SWP), simulated projection conditions (Optimal, Suboptimal), and content types (Map,
Board).
Group1 – 12 Participants IMS SBS SWP
Group2 – 12 Participants SWP IMS SBS
Group3 – 12 Participants SBS SWP IMS
Table 19 The order of methods for each group of participants
For testing the methods, we divided participants into three groups (see Table 19). The
method order for the first group of participants was IMS-SBS-SWP, for the second group
it was SWP-IMS-SBS and for the last group it was SBS-SWP-IMS; each includes 12
participants to perform all tasks in different conditions and uses different interaction
methods. While participants were completing tasks on IMS, SBS, and SWP, they had to
perform two more tasks, in the PhoneOnly method (one Map, and one Board).
Figure 47 Structure of the experimental design
Figure 47 represents the structure of the experimental design. We use this structure to
organize our results in Chapter 5 (Results), and consider how each level is related to others
and the research questions in Chapter 6 (Discussion).

70
4.3 Mockup
In this section, we describe the hardware and software used in the study.
4.3.1 Apparatus
We implemented an experimental apparatus to evaluate the user experience of mF+C
system for our study. We used a Polhemus13 G4, which is an electromagnetic-field based
sensor and a 6-degree of freedom (DoF) motion tracking system for tracking the mobile
phone and the participant’s head position.
Figure 48 Polhemus G4 system (left) Sensor on phone (right)
G4 is a precise device, but because it operates using an electromagnetic field, any metal
objects near the sensors or the “Source” can have distortion effects on the collected data.
When we tried to attach a sensor directly to the back of the phone, we received strange data
because of the phone’s battery and other modules that generate an electromagnetic field.
We attached the sensor to a piece of rubber ribbon (Figure 48), so participants had to put
their fingers in between the ribbon and phone, but they could hold the phone with their left
or right hand. Another limitation of the Polhemus is the range of the supported area. The
device datasheet shows that the optimal performance range is 3.66m, but in our exploration
the best distance of the sensor from the source was 2.6 m on x-axis, 2.4 m on y-axis and
2m on z-axis. More details of the system set up will be described in detail in the following
sections. We also used an ultra-short throw projector, manufactured by NEC14, with a
throw ratio of 0.3 to 1. The projector provided a 92-inch projectable area, and the phone
could be held within 0.5 meters from the projection without any shadow. The projection
13 www.polhemus.com
14 www.necdisplay.com/p/multimedia-projectors/np-u300x?type=support

71
brightness is 3100 lumens, which is 6+ times brighter than current commodity pocket-sized
projectors. In the Immersive and Swipe methods, the initial distance of the phone is 1.5
meters from the screen. In this location, the phone operates as a piece of glass, which means
the picture on the phone is the same as the part of the projection that is located exactly
behind the phone. Moreover, the large projector and phone are not attached, so if we take
the phone closer to the projection, it will not decrease the size of the projection. Generally,
once the projector is coupled with the phone, we can use the entire projectable region for
context without making adjustments due to phone movement. Using a large projector
means losing the portability of a pico-projector.
4.3.2 Software
Figure 49 Desktop application (left) Mobile application (right)
A Windows desktop application was developed and installed on a PC to control the
projector, and an Android application was developed for a mobile phone. Both applications
were developed in the Unity game engine using C# scripts. All game objects in Unity have
“transfer” and “rotation” properties with x, y and z variables that let us control the objects’
position and orientation easily. Unity’s main camera has “transfer”, “rotation” and “field
of view” properties, which are very useful for controlling the FoV and controlling the
picture on the phone with sensor data.

72
Figure 50 Mobile application settings
On top of the mobile application screen, there are magnifier icons for controlling the level
of FoV (in SWP and SBS). There is a box for setting the IP address for communicating
with the PC and a button to turn on/off the Gyroscope sensor, which is used in IMS to
control the orientation of camera. There are reset buttons to reset the position of the camera
in the application and the position of the projected map to the initial position. The Start
button is used to start logging the sensor data for each task.
Figure 51 Mobile application task controller
On the bottom part of the application screen, there are 15 buttons. The first 12 buttons
(C1-C12) are designed for changing the main tasks, and last three buttons (C13-C15)
change the training tasks which are designed to provide a better understanding of what is
going on when the methods are in operation. By clicking on the Start button, all buttons
except the magnifiers and Start (which changes to End) become hidden. By touching the
End button, the task will stop, and the entire key will be visible. Similar to the mobile app,
there is a task controller on the desktop app, which can be shown or hidden by pressing the
“G” key on the PC keyboard. The application displays the PC’s IP address and the mobile
phone connection status.
To control the viewfinder in SBS (and same for projected image in SWP), we first proposed
a mode where touching an edge of the screen would move the window quickly in the same
direction which required less finger movement on the screen. However, we finally agreed
to use the normal swipe gestures, which is a common method of interaction for touch
screens.

73
The Polhemus SDK was used to collect the position (x, y, z) from each sensor relative to
the source position, and this data was sent from the PC to the mobile phone at
approximately 120 fps.
Figure 52 Schematic of communication between devices and applications
There are two applications running on the PC, one for collecting the Polhemus sensor data
and another one for controlling the projected picture. Moreover, the location of the user’s
finger while swiping on the screen (in SBS and SWP methods) was sent from the mobile
application to the projection controller. A real-time port listener function on the desktop
application receives the bundle of data from the mobile application and the Polhemus
application. It then applies the appropriate functions, such as moving the marker (in SBS)
or projected picture (in SWP). On the mobile application, similar to the desktop
application, a real-time port listener receives Polhemus data and changes the position of
the picture in the IMS method.
We used the OSC protocol for handling the communication between the applications. On
the client side of the OSC protocol, each packet of data includes the name of the sender,

74
the destination IP, the destination port and an array of data. On the server side, the OSC
opens a port to listen, checks the name of the sender and passes the data to the right
function. Figure 53 shows an example of the OSC listener function on the mobile
application while the port is open.
Figure 53 OSC listener function code
On the mobile application, a log procedure runs during the entire process to record the
position and orientation of the phone and the user's head. Figure 54 shows the log function
and format.
Figure 54 Mobile application log function code

75
The comma separated values (CSV) format (supported by Microsoft Excel) was used for
logging. Each record is a row, and the value of each cell is equal to the values between
commas. The data recording speed was 5-8 fps. Table 20 shows the log format.
Time (h:m:s.ms)
Status (Start/End)
Task # DP Device
position (x,y,z)
DR Device
orientation (y,p,r)
HP Head
position (x,y,z)
Table 20 The format of the mobile application logger
Figure 55 Sample of mobile application log in CSV format
We tried to obtain the user’s head orientation using the Polhemus device, but due to the lab
environment the sensor’s orientation data was not correct, so we attached another phone
on the back of the user’s head to use its gyroscope sensor for tracking the user’s head
orientation. We logged the orientation data from the phone attached to the head using the
same time format as the first phone, so the two files could be merged.
Time (h:m:s.ms)
Device orientation (y,p,r)
Table 21 The format of the mobile application logger for the phone on the participant’s head
Figure 56 Sample of the log from the phone attached to the participant’s head

76
Our attempts to create the mF+C experience involved creating a user experience in IMS in
which the phone screen operated much like a piece of glass overlaid on the projected
context. To achieve a true immersive lens, we identified several variables such as the user’s
head position and orientation, the phone position and orientation, the distance between the
user’s head and phone, and the distance between the phone and the screen. Based on the
identified variables, we developed an application for which results were fine in the initial
position, but in some situations, they were incorrect. Therefore, we reviewed the algorithm
and realized that a true immersive lens function is not based on head orientation alone, but
rather the user’s head position relative to the phone’s screen position and orientation. We
made a mockup of a system that incorporated these variables, but in testing we found that
sensors were not operating reliably because of the noisy operating environment (to be
discussed later). Moreover, while even 1 degree or 1 cm error has an impact on the final
results, geometric calculations must be very accurate.
Finally, we decided to evaluate a more limited mockup in the user study, and leave
evaluation of a true immersive lens for future work. The version we used in the study does
not update the detail view on the phone according to the user’s viewing distance and angle,
only the position and orientation of the phone itself.
4.4 User Study Procedure
4.4.1 System Setup
To setup the system for running the user study we used an NEC U300X Ultra short throw
lens (0.377:1 throw ratio, 3100 lumens)15 projector with 80 centimeters distance from the
wall to a have 92 inches (diagonal) screen. We put the Polhemus source on top of the
projector with an 80 cm distance from the wall and marked the walking area in front of the
projection area with a green tape (Figure 59). The PC was connected to the projector with
an HDMI cable. A GoPro16 headband was used to attach a sensor for user’s head tracking.
One Polhemus sensor was connected to the front part of the headband.
15 www.necdisplay.com/p/multimedia-projectors/np-u300x?type=support
16 www.gopro.com

77
Figure 57 NEC U300X Projector (left) Side view of user interaction area (right)
Figure 58 Sensors Location: Front view (left) back view (right)
A mobile case with a Nexus4 mobile phone was fixed to the back of the headband. Another
sensor was attached by a rubber ribbon to the back of the mobile phone for tracking the
phone’s location (Figure 58).
Figure 59 Setup system: Projection area (left) User side view (right)
Both sensors were connected to the Polhemus Hub, which was attached to the user’s pocket
or belt. The hub operates with USB cable or wirelessly. Because of the lag in the wireless
Polhemus
HUB

78
mode, we connected the hub to the PC with a USB cable. During the study, all the lab lights
were ON, and two cameras were recording the entire study from the front and back angles.
4.4.2 The Study Protocol
1- Participants were selected by sending the recruitment notice to different faculty
e-mail lists, specifically Engineering, Science, Architecture and Planning,
Management, Computer Science, and Medicine.
2- We arranged the schedule for selected participants using Doodle web application
3- At the beginning of the study, we informed participants that the entire study would
be recorded by two cameras.
4- We asked participants to read and sign the consent form and fill out the background
questionnaire.
5- We had one trial task that took about 1-2 minutes to introduce each method. In the
trial task, participants were briefed on how the system works and how they have to
put their fingers in between the sensor and phone. A picture of a building was
projected, and they were free to use the system and ask questions of how the system
works. The trial task let the participants get familiar with the system and methods,
but not the conditions and types of tasks.
6- Participants could rest for 1-2 minutes between tasks
7- After all tasks were completed for a method (IMS, SBS, SWP and PhoneOnly),
participants filled out a post-method questionnaire. Performing each task took
about 3-5 minutes. Participants usually completed questionnaires in less than 2
minutes.
8- At the end of the study, participants answered a few questions as a short interview,
which took about 4-6 minutes.
9- Participants received compensation and signed the compensation form.

79
In total, the study took about an hour and a half to complete for each participant.
4.4.3 Data Collection
To answer the research questions in this study, we found that measuring the time of each
task could help us to know about user behavior for each method quantitatively. We can
also understand the relation between time in different types of pictures and conditions. We
collected data before, during and after tasks by using diverse methods (see Table 22). Most
of the measuring instruments are available in the appendices section.
Instrument Description
Background
Questionnaire Demographic
Observation
Notes Hand-written notes about the participants’ behaviors by researcher
Tasks
Answer sheet
Evaluation tasks questions regarding participant’s answer in True/False
format by researcher
Video Video recordings of participant behavior while performing the tasks
Logging Data Time, mobile phone and participant’s head position and orientation,
and task number and status in 5-8fps.
Post-method
Questionnaire Participants’ answers in regards to each method in Likert scale
Interview Participants’ explanations about their overall experience, feedback
about the techniques used in each task, and any other comments
Table 22 List of data collection instruments
4.4.4 Participants
For this user study, we tried our best to recruit a varied sample of participants. This
diversity could allow us to gather a set of opinions about mF+C and mitigate the impact of
specific background knowledge or skills on the results. We recruited 36 participants (13
females and 23 male) including students, faculty members, and staff. The average age of
participants was 30 years (18-66). We recruited 12 undergrads, 16 graduate and eight
staff/faculty from Computer Science (11), Engineering (8), Science (10) and other
disciplines (7). The number of Android phone users and iPhone users were the same (17),
and two participants used BlackBerry phones. All participants were familiar with at least

80
one smartphone. Whereas 13 participants were using their smartphone for more than 4
hours a day, 17 participants were spending 2-4 hours on their phone, and for six of them,
this time was less than 2 hours. All participants had experience using, at least, one of the
mobile map applications such as Google Map, Apple map, MapMyFitness, Bus/Train Map,
Offline navigation applications or others. All participants were familiar with one of the
zooming technique on the phone such as tap, double tap or pinch; they also had the
experience of using, at least, one of the mobile phone sensors such as GPS, Compass,
Gyroscope, NFC, Fingerprint, Proximity, Magnetic, Accelerometer, Pressure or Light.
While 27 participants used their personal phone for a specific task that was related to their
job, two of them did not prefer to use their personal phone, but they might have used their
personal device for their job if they would not have had any other choice, and seven
participants had never used their device for their job. Seventeen participants were using
their phone as a remote controller, such as TV remote, presentation remote or music
controller. The participants attended individually, and it took about 1 hour and 30 minutes
for each one to finish the study. $20 was paid as compensation to each participant.
4.5 Data Analysis
After the study, we used the responses to the post-method questionnaires, shown in Table
23, to analyze the user preference and satisfaction about each method of interaction.
1 It was easy to use the application
2 The information provided on the phone was accurate and properly aligned with the
projected image.
3 The application worked in real time, without noticeable lags.
4 I sometimes lost track of my current location
5 The distance between the projection and the mobile device was acceptable
6 This method was easy to use
7 I felt physical discomfort during these tasks
8 Finding target objects was easy using this interaction technique
Table 23 List of questions in post-method questionnaire
For each method, the amount of physical discomfort and the satisfaction of the distance
between the phone and the screen could be obtained from the survey responses. We used

81
time logs and task answer sheets for each user to calculate the time for performing the
tasks, and we used the camera video to observe the participant’s behavior. For example,
we counted the number of the times that a participant switches their attention between
Focus and Context and the amount of the time looking at Context vs. Focus. The
observation notes and interviews were used to give context to and resolve ambiguities in
the survey responses. From the video, we found that in many cases for switching between
focus and context, participants just turn their eyes instead of their head; therefore, the head
orientation information was not used to determine context switching. Instead, the video
was coded for attention switches.
During each task, we asked participants 1-6 questions, and they were supposed to find
answers by looking at the projected picture and/or using the phone or a combination of
both.
1 Overall, what was your experience interacting with linked projected content
and mobile phone detail?
2 Did you find any difference between map and board?
3 How was the distance between you and projection?
4 Which method was your favorite? Which one did you like better?
5 Do you have any suggestions to help make any of these methods more useful?
6 Do you believe the techniques could be useful in your work?
If so, how? If not, why not?
Table 24 List of interview questions
At the end of the study, we asked participants some questions as a short interview, listed
in Table 24. The participant responses were used to provide context for quantitative
observations and post-method questionnaire analyses.

82
CHAPTER 5 RESULTS
In this chapter, we present our analysis of the collected data from the user study to address
the research questions and objectives, which are listed below:
How does content familiarity affect an mF+C system?
Does providing details on the phone screen adequately compensate for poor context
visibility due to projecting on non-planar, non-uniform surfaces?
What are the strengths and weaknesses of the three focus + context linking
techniques (Immersive, Side-by-Side, and Swipe)?
Table 25 represents the expected time that was calculated by using the described model in
the study design chapter, the average time that participants spent for each task during the
user study, and the ratio between expected time and average time. In all figures and tables,
the unit of time is in seconds, and the unit of displacement (e.g. x-y) is in centimeters.
Format Task Expected
Time
AVG
Time Ratio
O-Map Name of 10 restaurants 39.95 74.71 53%
O-Board Board with RED and Yellow Connectors 98.20 177.55 55%
O-Map Name of Location marked 1-5 39.05 68.86 57%
O-Board Positive-Voltage Supply 94.08 154.62 61%
O-Map Start-Endpoint street and websites 107.13 184.58 58%
O-Board DDR 3 Memory 75.60 123.32 61%
SO-Map Name of Streets 1-6 51.00 86.21 59%
SO-Board BOX of colors, LEDs 155.95 264.10 59%
SO-Map Raymond Field 64.75 99.54 63%
SO-Board Resistor marked by 1 72.20 129.49 56%
SO-Map Subway Map 86.55 148.53 58%
SO-Board 11 markers on board 72.92 143.26 52%
Table 25 List of expected time, average time that participants spent on tasks and ratio between
expected and average time
As we can see, there is a range of 52% to 63% between expected times and average times
for tasks, which shows that the expected time, while a significant overestimate, is related
to the average time.
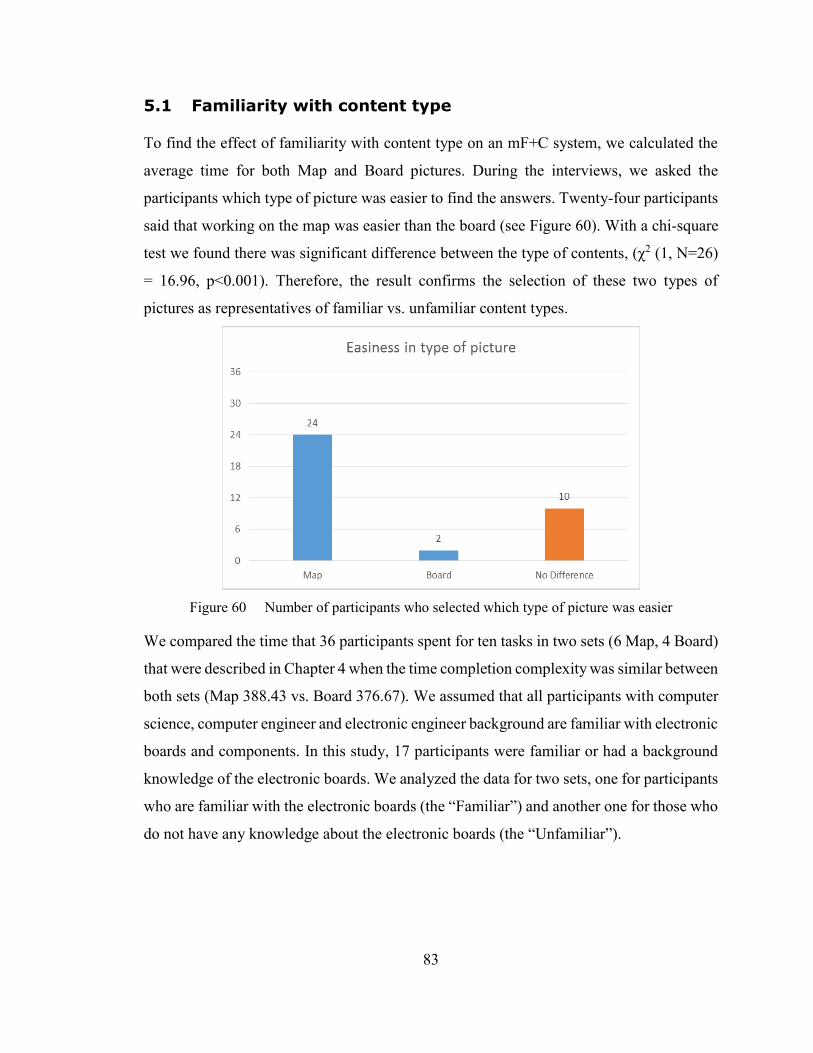
83
5.1 Familiarity with content type
To find the effect of familiarity with content type on an mF+C system, we calculated the
average time for both Map and Board pictures. During the interviews, we asked the
participants which type of picture was easier to find the answers. Twenty-four participants
said that working on the map was easier than the board (see Figure 60). With a chi-square
test we found there was significant difference between the type of contents, (χ2 (1, N=26)
= 16.96, p<0.001). Therefore, the result confirms the selection of these two types of
pictures as representatives of familiar vs. unfamiliar content types.
Figure 60 Number of participants who selected which type of picture was easier
We compared the time that 36 participants spent for ten tasks in two sets (6 Map, 4 Board)
that were described in Chapter 4 when the time completion complexity was similar between
both sets (Map 388.43 vs. Board 376.67). We assumed that all participants with computer
science, computer engineer and electronic engineer background are familiar with electronic
boards and components. In this study, 17 participants were familiar or had a background
knowledge of the electronic boards. We analyzed the data for two sets, one for participants
who are familiar with the electronic boards (the “Familiar”) and another one for those who
do not have any knowledge about the electronic boards (the “Unfamiliar”).

84
Figure 61 Average of Time for familiarity with type of contents
According to Figure 61, there is a difference in time between Map and Board on both
Familiar and Unfamiliar. The statistical test results are presented in Table 26.
Map Board ANOVA test
Time Familiar Mean=115 Mean=119 F(1,145)=0.21, p=0.6
Unfamiliar Mean=114 Mean=136 F(1,165)=6.76, p=0.01
Table 26 Stats for test the effect of familiarity with type of pictures
As we can see on Table 26, Familiar and Unfamiliar spent the same amount of time on the
map. As a result, with less time the participants who were familiar with electronic boards
performed the tasks better than who were not familiar with the boards, so the results show
that the familiarity with content type has direct impact on improving the performance,
particularly on task completion time.
5.2 Conditions Evaluation
Because the tasks and images used in optimal vs. suboptimal conditions were different, to
better evaluate how environmental effects (impacting the visibility of the projected image)
are important in task performance, time for each task were recorded for all participants in
all methods and conditions.

85
Figure 62 Average total Time to complete a task in both Optimal and Suboptimal conditions
The bar chart on Figure 62 depicts the average total time of performing tasks in different
conditions. To evaluate this, we selected 11 tasks in two sets (6 Optimal, 5 Suboptimal)
with similar time (445.65 vs. 444.65). Note that this is almost the entire task set, minus one
in the suboptimal conditions. Since per-method averages are reported in Figure 65,
including the extra Suboptimal task this does not significantly impact the comparison. As
it is clear from the bar chart, participants finished tasks in less time in the optimal
conditions than the suboptimal conditions. An ANOVA test result show that there is a
significant difference in Time between Optimal and Suboptimal conditions
(F(1,382)=12.44, p<0.001).
We measured the number of times a user's eyes switched between the mobile phone screen
and the projected screen for all 12 tasks for 36 participants by watching the recorded videos
with a front camera and using a simple JavaScript application for coding. While the
application and the video player were running, by pressing two buttons (F for mobile
phone, and C for projection) the application logged the time between two events, which
were looking at the phone screen (focus) or projected screen (context), and finally the total
number of each event was listed in a table.
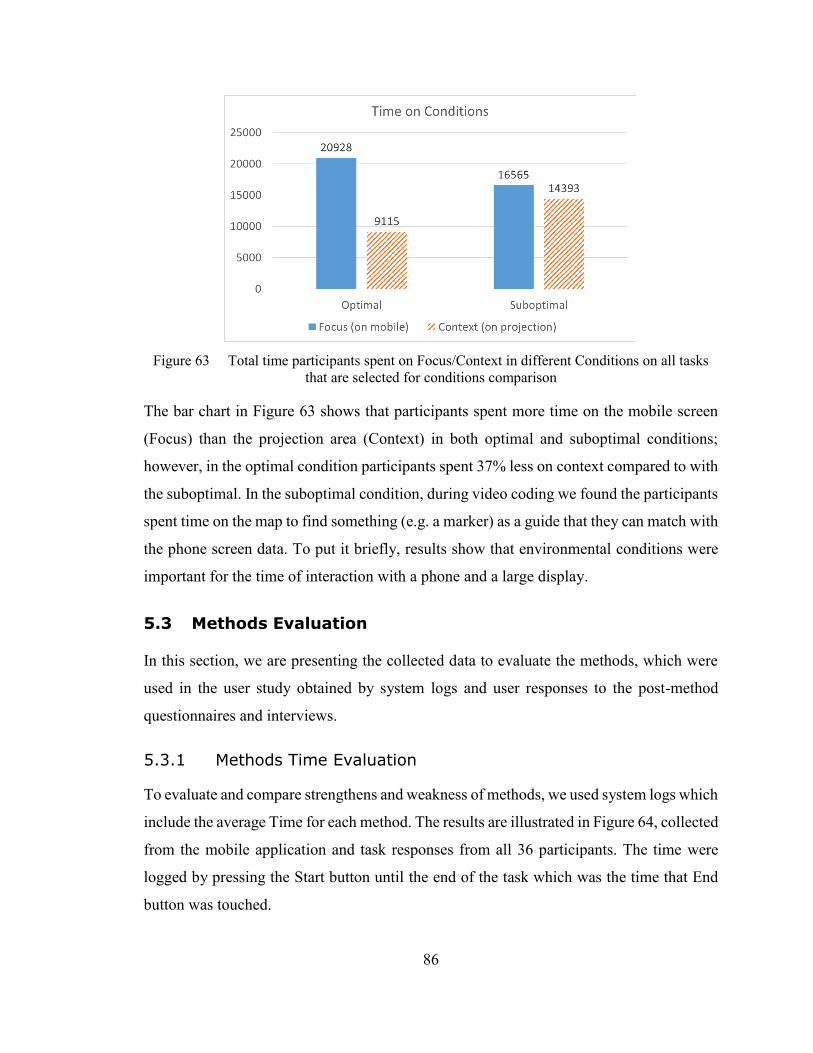
86
Figure 63 Total time participants spent on Focus/Context in different Conditions on all tasks
that are selected for conditions comparison
The bar chart in Figure 63 shows that participants spent more time on the mobile screen
(Focus) than the projection area (Context) in both optimal and suboptimal conditions;
however, in the optimal condition participants spent 37% less on context compared to with
the suboptimal. In the suboptimal condition, during video coding we found the participants
spent time on the map to find something (e.g. a marker) as a guide that they can match with
the phone screen data. To put it briefly, results show that environmental conditions were
important for the time of interaction with a phone and a large display.
5.3 Methods Evaluation
In this section, we are presenting the collected data to evaluate the methods, which were
used in the user study obtained by system logs and user responses to the post-method
questionnaires and interviews.
5.3.1 Methods Time Evaluation
To evaluate and compare strengthens and weakness of methods, we used system logs which
include the average Time for each method. The results are illustrated in Figure 64, collected
from the mobile application and task responses from all 36 participants. The time were
logged by pressing the Start button until the end of the task which was the time that End
button was touched.
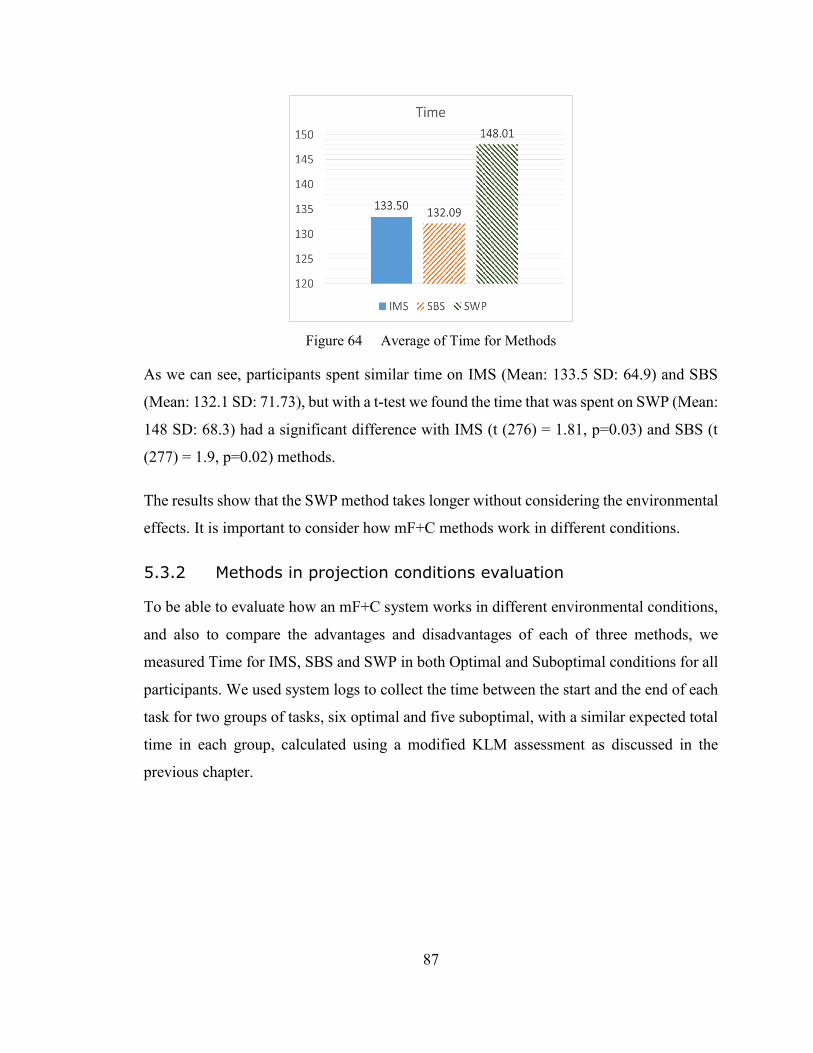
87
Figure 64 Average of Time for Methods
As we can see, participants spent similar time on IMS (Mean: 133.5 SD: 64.9) and SBS
(Mean: 132.1 SD: 71.73), but with a t-test we found the time that was spent on SWP (Mean:
148 SD: 68.3) had a significant difference with IMS (t (276) = 1.81, p=0.03) and SBS (t
(277) = 1.9, p=0.02) methods.
The results show that the SWP method takes longer without considering the environmental
effects. It is important to consider how mF+C methods work in different conditions.
5.3.2 Methods in projection conditions evaluation
To be able to evaluate how an mF+C system works in different environmental conditions,
and also to compare the advantages and disadvantages of each of three methods, we
measured Time for IMS, SBS and SWP in both Optimal and Suboptimal conditions for all
participants. We used system logs to collect the time between the start and the end of each
task for two groups of tasks, six optimal and five suboptimal, with a similar expected total
time in each group, calculated using a modified KLM assessment as discussed in the
previous chapter.

88
Figure 65 Average of Time for Methods in each Optimal and Suboptimal conditions
Figure 65 represents the time for optimal and suboptimal conditions for IMS, SBS and
SWP methods. As we can see, participants spent similar time using IMS and SBS on both
optimal and suboptimal conditions; however, they spent at least 6% more time in optimal
and 17% more time in suboptimal conditions on SWP. In IMS, finding the answer is
completely related to the device position and orientation, but in SBS, the answer is directly
related to the pointer’s location.
Figure 66 (left) Number of times users switched his attention between two screens in each
method for all tasks (right) Amount of time on Focus/Context for each method
Figure 66 (left) shows the number of times participants switched their attention between
Mobile screen and projection Content. As we can see, in IMS participants switched
between screens 18.8% less than SBS (F(1,283)=4.32, p=0.03) and 32.3% less than SWP
(F(1,281)=16.5, p< 0.001). It shows that, in IMS a user needs to switch between two
screens fewer times. This might be because of the quick matching between the focus and
the context. To compare with SBS and SWP, in IMS a user does not need to go back and

89
forth many times to check whether the pointer in the context, or the projected picture is in
the right place and whether the corresponding data is available on the phone or not. With
an ANOVA test, we found there was also a significant difference between SBS and SWP
(F(1,280)=4.27, p=0.039). Obviously, participants spent more time (Figure 66-right) on
the mobile phone screen (Focus) than the projected picture (Context) in all methods;
however, in IMS user spent time 39.5% less than SBS and 35.2% less than SWP on the
projected picture. In SBS, a user needs to control the location of pointer, in SWP a user
should control the location of the projected picture, so they have to spent time on the
Context. In IMS the Overview is in a fixed place behind the Focus device, and while the
user knows that the Focus data is related to the phone position and orientation, most of
their attention is on finding the answer of the question rather than trying to match the Focus
and Context. In summary, we believe that the IMS method is less dependent on Overview
visibility.
5.3.3 Methods in task type categories
To consider how the interaction methods worked in certain types of tasks, we evaluated all
methods in one task of four different categories. We deeply reviewed the users’ behavior
for 6 selected participants and observed their unexpected actions while performing the
tasks. We compared the participants task completion time and interactions with the
expected time and operations that we calculated using the adapted KLM model described
in chapter 4.
The first task is from the category of “Finding based on shape-colors”.
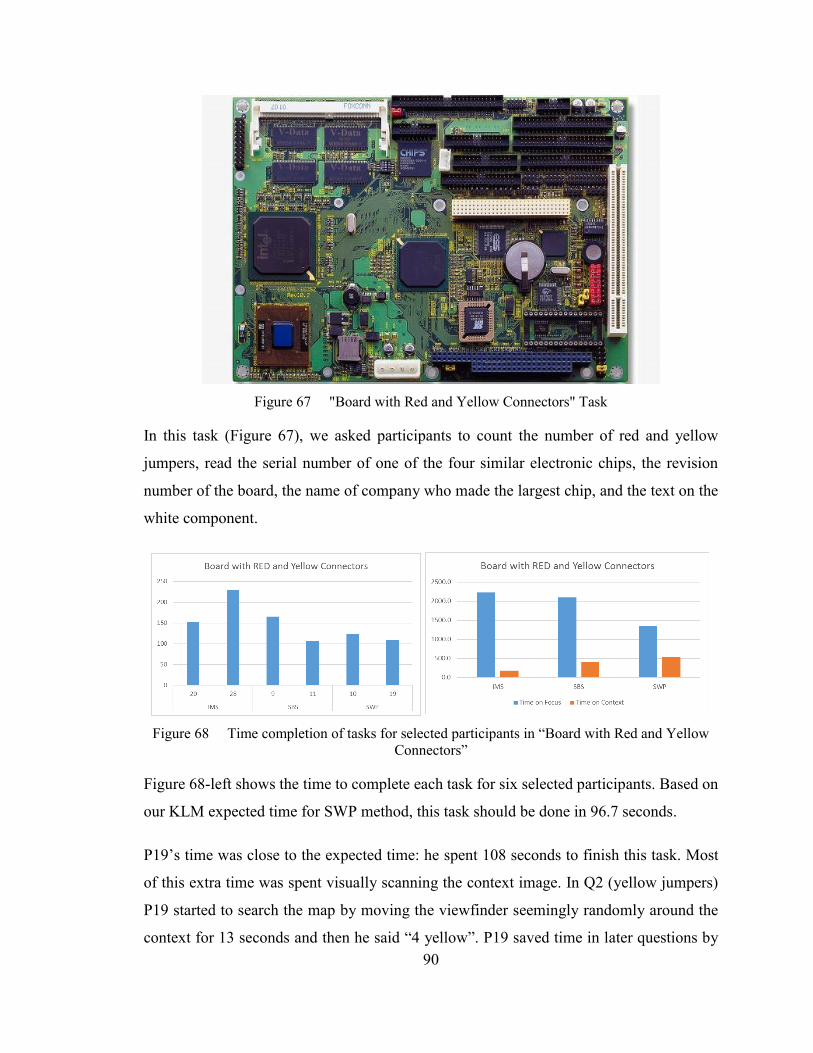
90
Figure 67 "Board with Red and Yellow Connectors" Task
In this task (Figure 67), we asked participants to count the number of red and yellow
jumpers, read the serial number of one of the four similar electronic chips, the revision
number of the board, the name of company who made the largest chip, and the text on the
white component.
Figure 68 Time completion of tasks for selected participants in “Board with Red and Yellow
Connectors”
Figure 68-left shows the time to complete each task for six selected participants. Based on
our KLM expected time for SWP method, this task should be done in 96.7 seconds.
P19’s time was close to the expected time: he spent 108 seconds to finish this task. Most
of this extra time was spent visually scanning the context image. In Q2 (yellow jumpers)
P19 started to search the map by moving the viewfinder seemingly randomly around the
context for 13 seconds and then he said “4 yellow”. P19 saved time in later questions by

91
starting to search as the question was being asked and navigating directly to the target. For
example, Q3 and Q4 were completed 2 and 4 seconds less than expected, respectively.
Anticipatory navigation lead to extra time for Q5. The answer to Q5 was visible by looking
at the context and it was also in the same location as Q4, so we predicted 2 seconds answer.
P19 moved the context immediately, and took 6 seconds to return to the location and read
the answer. Perhaps because of the familarity built up with the context in this region for
Q5, and because of the small visible area in the overview, Q6 was answered almost
immediately after it was asked (1sec actual vs. 4.1 secs expected).
User P19
Q1: 23 sec, two times search
entire map
Read: 1sec
Q2: User asked question: which
connector, 1 sec
We repeated “Yellow”: 1 sec
Search entire map: 14 sec
Read: 1 sec
Q3: during the question he
moved the picture:4 sec
Read: 1 sec
Q4: Search+Point+read=4 sec
Q5: Search+Point+read=6 sec
Q6: during the question, he
moved picture to the right place
Read: 1 sec
End: 2 sec
Q1: A+G(1)+Q1(4.4)+M(1.35)+S(23)+R(1)
=30.75
Q2: G(1)+Q2(4.4)+M(1.35)+Error(2)+S(14)+R(1)
=24.75
Q3: G(1)+Q3(11)+M(1.35)+SP(4)+R(1)
=18.35
Q4: G(1)+Q4(4)+M(1.35)+SPR(4)=10.35
Q5: G(1)+Q5(4)+M(1.35)+SPR(6)=12.35
Q6: G(1)+Q6(6)+M(1.35)+SPR(1)+E(2)
=11.35
Time: 30.75+24.75+18.35+10.35+12.35+11.35= 107.9
With the exception of Q1, P10 finished the task using SWP in a manner and time close to
expected. P10 spent 41 seconds to find the answer in Q1. Starting by looking at the context
only, he found the location of the red jumpers, and after 10 seconds he said that the number
of red jumpers are 2. But he then pointed to the phone screen and seeing the detail asked
“do I have to count each one ?” He then used the focus to count individual jumpers.
P20 performed this task using the IMS method and finished it in 152 seconds, which was
53 seconds longer than the expected time (99.2 seconds). This was due to longer than
expected visual searching, asking for question clarification, and longer time counting
jumpers in the lower-right cluster using the detail view. In question 2 the jumpers were

92
visible on the context view but P20 used the focus view mainly and spent 20 seconds rather
than the expected 7 seconds, since visually scanning using the focus requires looking at the
focus and ensuring that he is covering the desired area of the context when searching. This
behaviour continued in subsequent questions.
P28 spent 230 seconds on this task using IMS: 131 seconds longer than the expected time.
Much of this time was spent searching the diagram (15 seconds in Q1, 80 seconds in Q2,
40 seconds in Q3). P28 was not methodical in their method of searching the context,
seeming to move in a random pattern. In Q2 for example, he searched the entire map three
times. On two occasions he was very close to the location of the answer, but suddenly
changed direction. Despite this randomness, the participant seemed to move the focus
device very slowly, being careful how they tilted it in relation to the projection.
For the SBS method, the expected time for this task was calculated to be 98.7 seconds using
our adapted KLM. P11 was very close to this, taking 107 seconds. This participant’s
behaviour was also closely modelled by the KLM estimate.
P9 also used SBS, but took 165 seconds. Some of this time was due to using the software
zoom feature: he took 30 seconds rather than the expected 15 for Q1 as he zoomed out and
couldn’t count the jumpers, then returned to the normal zoom level to answer the question.
For the second question, he used the focus rather than the context for visual search, taking
twice as long as expected; he repeated this behaviour for Q4.
We believe that in the tasks that users have to search on the map and they are not dependent
to the context, because there are no guides on overview or the overview is noisy, they prefer
to use the focus device which contains more legible and identifiable data.
In addition, because of the order of questions, in SBS and SWP, when users found the
answers, they did not change the location of the marker or projection before the next
question, but in IMS both participants rapidly returned to the initial position at the center
of the projection after the answer was found. In general, this meant that if several questions
were in the same region, minimal interaction was required in SBS and SWP. In IMS for
questions one, two and four both participants searched the entire map to find the answers

93
using focus device. In this task, the targets for the last three questions were very close to
each other, so in SBS and SWP the participants found the answer through small movements
on the phone and saved time. We had five white components on the picture, but only one
of them had text on it. In IMS and SBS, when the overview of the picture was visible,
participants looked on the context to see which component has text, but in SWP, because
of the previous question, only two white components were visible in the projection and the
component with text was exactly in front of the participants, so it was easy to find the
answer. We found therefore that the order of questions has an impact on performance.
Figure 68-right bar chart shows the amount of time that these 6 participants used the focus
vs. context. Since the answer to each question was based on searching for colors and
shapes, this task was not dependent on seeing information that was only presented on the
context. Even so, the context had enough data to find the location of a question’s target for
at least 4 of 6 cases, since the colours and shapes were visually distinguishable using the
context alone. It might be true that IMS is easier to use because of the fast responsiveness
to user interaction, but it seems that it also depends on the task, since the context might
have enough useful data which can help participants use the focus device only when
absolutely needed. In addition, when relevant details are in close proximity to each other,
the stable relationship between focus and context in SBS and SWP can be an advantage.
The second task that we evaluate for how participants used the interaction methods is
finding answer of questions based on position and natural features on the projection.

94
Figure 69 "Raymond Field" Task
In this task (Figure 69) we asked participants to find the name of the field located on the
top-left side of the map, the name of the library that marked with a library icon, the name
of the town located near the edge of a small lake, the name of the restaurant at the bottom-
right side of the map, and the location marked on the surface with an up-arrow.
Figure 70 Task completion time for selected participants in "Raymond Field"
Figure 70-left shows the time taken for this task for six selected participants.
Our KLM expected time for the SWP method is 66.15 seconds. P19 finished this task in
117 seconds, which was 50 seconds more than the expected time. This was due mainly to
spending 44 seconds visually scanning the context for the library icon and an additional
17 seconds looking for it using the focus device. There was only one library marked with

95
an icon on the map, but P19 did find another library and asked “this library?”, then
continued to search when told the target had an icon. This is an example of the difficulty
one might encounter when relying on the context to search for less conspicuous items.
User P19
Q1: User asked question “ the
field?”: 1 sec
Search: 1sec
Point: 5 sec
Read: 1 sec
Q2: Search entire map: 42 sec
Found library without icon and
asked “this library?”: 1 sec
We said “no, the library that
has icon”: 2 sec
Search: 11 sec
Read: 1 sec
Q3: Point: 7 sec Read: 1 sec
Q4: Point: 4 sec Read: 1 sec
Q5: Point: 6 sec Read: 1 sec
End: 2 sec
Q1:
A+G(1)+Q1(4.4)+M(1.35)+Error(1)+S(1)+P(5)+R(1)
=14.75
Q2:
G(1)+Q2(2)+M(1.35)+S(42)+Error(3)+S(11)+R(1)
=61.35
Q3: G(1)+Q3(5)+M(1.35)+SP(7)+R(1)=15.35
Q4: G(1)+Q4(4.1)+M(1.35)+SP(4)+R(1)=11.45
Q5:
G(1)+Q5(2.9)+M(1.35)+SP(6)+R(1)+E(2)=14.25
Time: 14.75+61.35+15.35+11.45+14.25=117.15
P10 spent 107 seconds vs. the expected 66.15 seconds on this task using the SWP method.
In this case, visually scanning the context to find the library icon took 12 seconds more
than the expected time. P10 was 2-3 seconds slower than our expected for all questions in
controlling the viewfinder. Possibly due to difficulty using the interface, P10 tried to use
the context, for example to read the name of the restaurant in Q4, and only turning to the
focus device when unsuccessful, adding to the task time.
P28 spent 80 seconds on this task using IMS: this was close to expected (16 seconds over,
due mainly to asking for clarification and explaining their answer to Q3). P20 also used
IMS but took141 seconds, which was 77 seconds longer than expected. The library
question was answered quickly, but he was confused about the lake question (Q2), which
took 65 seconds to answer. The remaining questions were answered efficiently.
Using SBS, P11’s interactions were close to the expected in our KLM. P9’s behaviour was
different: with the exception of Q2, P9 found the target locations by visually scanning the

96
context only. In question 2, he quickly searched the context and he said that “I can’t see
the library icon here” and then traced the whole map using the focus device, taking 18
seconds. P9’s total time was 84 seconds, 20 seconds more than expected (64.15).
In this task, during using IMS method, because of the different questions, location of the
answers, and visibility of the texts, participants required physical movement to find the
answers. In addition, similar to the other tasks, in IMS, when both participants found the
answer of each question, they came back to the initial position for the next question. While
three out of five questions were located on the edge of the picture, in SWP method, for four
questions, the overview of picture was missed, so after finding the answer of each question
(except question 1), there was a noticable preparation time that participants spent to get the
location of the next question. When the answer of the second question was very close to
the first one, 2 of 4 participants in SBS and SWP found the answer quickly. While questions
three to five were located on the right side of the map, there was no shifts between
locations, and because of the picture on the phone was not related to the device orientation,
the texts were clear enough to read, so user performed this task in SBS faster than IMS and
SWP. There were two libraries on the map but only one of them had an icon, and our
question was the name of library which was marked by library icon. When the library icon
was not identifiable on the context, all participants just used the phone screen for that
question. Answering to this question takes a longer time than our predicted time. Natural
features, and position guides that we mentioned in this series of questions, (e.g. top-left,
bottom-right), were causes that make the task less dependent to the context for at least 3
out of 5 questions, so same as previous task, in IMS user prefered to use the phone which
provides clear picture than nosiy projected map, but in SBS and SWP, because the
participants should control the location of the viewfinder or projected picture, they spent
more time on context to compare with IMS (Figure 70-right).
The third task that we evaluated is from tracing category. In this task (Figure 71) we asked
participants to follow the colored line and find the names that are connected by lines.

97
Figure 71 "Start-Endpoint street and websites" Task
The order of questions was important to make the task challenging. The last question was
finding the name of school on the map. We highlighted one building with light-blue color
but there was no question for that particular section.
Figure 72 Time completion of tasks for selected participants in "Start-Endpoint street and
websites"
Figure 72-left shows the time completion of each task for selected participants. We
consider P19’s behavior first. Based on our expected time for the SBS method, this task
should be done in 115. 5 seconds, but P19 spent 134 seconds to finish it. P19 took longer
than expected both to swipe and to locate targets: 6 seconds vs. 2 seconds for Q1, and 6
seconds vs. 1.5 seconds in Q4, and 13 seconds vs. 2.5 seconds in Q5. Additional time was
taken asking for questions to be repeated and for more detail about the targets. P19’s
performance improved at the end of the task. The expected time for finding the location of

98
question 6 was 13 seconds, but while the question was being read he moved the viewfinder
on the projection, so he took only 9 seconds, which was 4 seconds less than our predicted
time in this question. We expected that participants would point to a circled building for
the school name, and when they realized that it wasn’t a school, they would search the
entire map. However, P19 saw that the circled building was not a school, and visually
scanned the context to see a candidate building on the bottom part of the map, then rapidly
moved the viewfinder to get the answer.
User P19
Q1: Question time: 6 sec
Search-Point1: 6 sec
Read: 2 sec
Search-Point2: 4 sec
Read: 1 sec
Q2:
Search-Point1: 3 sec
Read: 2 sec
Search-Point2: 6 sec
Read: 2 sec
Q3: User asked to repeat the
question: 3 sec
Search-Point1: 3 sec
Read: 3 sec
He was confused by question, we
described: 3 sec
Search-Point2: 4 sec
Read: 2 sec
Q4: User asked to repeat the
question: 2 sec
Search-Point1: 6 sec
Read: 2 sec
Search-Point2: 4 sec
Read: 1 sec
Q5:
Search-Point1: 13 sec
Read: 3 sec
Search-Point2: 5 sec
Read: 2 sec
Q6:
Point to the highlighted: 5 sec
Pointed to the answer: 4 sec
End: 2 sec
Q1: A+G(1)+Q1(6)+M(1.35)+SP1(6)+R(2)
+SP2(4)+R(1)
=21.35
Q2: G(1)+Q2(4.2)+M(1.35)+SP1(3)+R(2)
+SP2(6)+R(2)
=19.55
Q3: G(1)+Q3(4.4)+M(1.35)+Error(3)+SP1(3)
+R(3) +Error(3)+SP2(4)+R(2)
=24.75
Q4: G(1)+Q4(4.2)+M(1.35)+Error(2)+SP1(6)
+R(2) +SP2(4)+R(1)
=21.55
Q5: G(1)+Q5(4.4)+M(1.35)+ SP1(13)+R(3)
+SP2(5)+R(1)
=28.75
Q6:
G(1)+Q6(5)+M(1.35)+SP1(5)+SP2(4)+E(2)
=18.35
Time: 21.35+19.55+24.75+21.55+28.75+18.35 = 134.3

99
P10 performed the task in 264 seconds in SBS method which was 153 seconds more than
our expected time. We expected 2 seconds for searching for and pointing to the target of
Q1, but he spent 6 seconds reviewing the context, and took 25 seconds to put the viewfinder
on one side of the red line. On two ocassions the viewfinder was over the target street name
but during swiping he suddenly moved the viewfinder away. For the remaining questions
P10 was generally very slow and cautious when swiping, perhaps to be sure that the pointer
was located at the correct location. At the same time, the participant did not always
carefully view the focus while locating a target. For example, the target location of question
4 was at the same position of the previous question, requiring just reviewing the focus
screen and no swiping. However P10 rapidly moved the viewfinder at the start of the
question and took 13 seconds move it back over the target. For Q6 (finding the school),
P10 started moving the viewfinder and looking at the focus device, but after 10 seconds he
switched to the context and tried to find the school by scanning from top-left to bottom
right of the map. He saw the school after 15 seconds, then navigated the viewfinder over
the school to be certain.
In SWP method, P20 spent 185 seconds to finish the task which was 62 seconds more than
our expected time. In question 1, the participant identified the area of the target in 3 seconds
but took 11 seconds to adjust the focus to the correct position so that he could read the
answer. P20 took longer than expected when moving the focus for subsequent questions as
well, including 2-3 seconds extra time for each due to difficulties controlling the projection.
In Q6 P20 first moved the focus to the highlighted section, and upon realizing that it was
not a school, he used the focus device to search the bottom side of the map, finding the
school after 8 seconds.
P28 spent 205 seconds on the task; 82 seconds more than our expected time. The participant
used only one hand and swiped on the screen with his thumb, reducing the distance covered
with each swipe. This accounted for 71 seconds of the additional time. We note that this
time was due to the mechanics of swiping, and was not obviously related to interface
differences between SBS and SWP.

100
Using the IMS method, P11, spent 103 seconds which was close to the expected time (16
seconds more, most of which was due to asking for a question to be repeated rather than
interaction behaviour). The participant stood at the center of the projection, and held the
phone just above the waistline, quickly moving it to point to targets.
P9 spent 166 seconds using the IMS method, which was 79 seconds more than our expected
time. As with P11, this was not directly related to interaction behaviour: the participant
spent a lot of time describing the locations of answers, accounting for about 50 seconds of
the extra time, and took additional time redoing a question. As with other participants, P9
moved the focus to the circled region when looking for the school, read the detail to see
that it wasn’t a school, then visually scanned the context for the school location, then
moved the focus to the correct location to read the answer.
The colored line on the context were working as a marker, so they were invisible on the
phone screen. In IMS and SBS, participants were able to directly point to the start and end
of the lines without following them, but in the SWP, both participants spent time to adjust
the location of the markers at the correct place that they can read the answer. Because of
the guidelines on the map, this task was completely dependent to the context, so even in
IMS method, participants should use the projected picture to find the start point and end
point of the lines, and then use the phone to find the answer. Figure 72-right shows that
SBS and SWP were more dependent to the context than IMS, but in this task there was no
big difference between the time on focus and context. In the last question of task, we asked
participants to find the location of a school. All participants used the context, and when
they found a name, they used their phone to check the name of school. While 5 of six
participants pointed to the highlighted building, they found that there was no school, so
they traced the entire of map to find the answer, and because the school was located on the
bottom part of the map, they spent many time on the context.
The last task that we evaluated is “DDR3 memory” diagram (Figure 73) from the search
category. In this task, some text was legible in the projection, but there were no markers or
guides on the image, and all questions were based on searching for text.

101
Figure 73 "DDR3 Memory" Task
The first question was “how many DDR3 memory slots exist on the board?”. The projected
picture was blurry, but the large text was legible, however 5 of 6 participants prefered to
use the clear picture on the focus device. In the second question we asked about the series
of processor on the board. Similar to the first question, the third question (“what is P20
port?”) was legible on the context. In the next question, we asked participants to find the
“analog video interface port number”. In the fifth question, which was “what is the PS/2
mouse port number?”, when the answer of question was very close to the question 4, in
SBS and SWP participants found the answer faster than IMS. The last question was: “what
is the digital video port number?”.
Figure 74 Time completion of tasks for selected participants in "DDR3 Memory"

102
Based on our expected time for SBS method, this task should be done in 76.1 seconds. P19
spent 71 seconds which was was close to the expected time (5 seconds less, was due to the
answer’s location of Q3-Q5 and faster searching and pointing on the diagram).
User P19
Q1:
Search-Point: 3 sec
Read: 1 sec
Q2:
Search-Point: 4 sec
Read: 1 sec
Q3: User asked to repeat the
question: 2 sec
Search-Point: 8 sec
Read: 1 sec
Q4:
Search-Point: 2 sec
Read: 1 sec
Q5:
Search-Point: 9 sec
Read: 1 sec
Q6:
Search-Point: 6 sec
Read: 1 sec
End: 2 sec
Q1: A+G(1)+Q1(3.9)+M(1.35)+SP(3)+R(1)
=10.25
Q2: G(1)+Q2(2)+M(1.35)+SP(4)+R(1)
=9.35
Q3: G(1)+Q3(1.3)+Error(2)+M(1.35) +SP (8)
+R(1)
=14.65
Q4: G(1)+Q4(2.8)+M(1.35)+SP(2) +R(1)
=8.15
Q5: G(1)+Q5(2.9)+M(1.35)+ SP(9)+R(1)
=15.25
Q6: G(1)+Q6(2.5)+M(1.35)+SP(6)+R(1)+E(2)
=13.85
Time: 10.25+9.35+14.65+8.15+15.25+13.85 = 71.5
The participant P10, spent 121 seconds to finish this task: which was 45 seconds more than
the expected time (76.1 seconds). In visually scanning the context, he first found 2 slots of
DDR 3, but by moving forward and counting on the context, he changed his answer to 4,
which costs additional 5 seconds. P10 used only focus device to scanning the entire of map
for question 2, and he spent 17 seconds ( 13 seconds more than the expected time, when it
was visible on the context). Finding the answer of this question takes 33 seconds: which
was because of the location and small text size of the Q5’s answer. 10 seconds visually
scanning context was not helpful, so P10 used the focus device to search the entire of map,
which was 21 seconds more than our expected time.
In IMS method, P11 completed the task in 85 seconds: which was 12 seconds more than
the expected time, because of repeating the question.

103
P9 used IMS method and he looked at the context area only one time for 1.2 second. He
finished the task in 96 seconds: 23 seconds more than our expected time, which was due to
search the entire of map in 13 seconds. In question 3, he did not not pay enough attention
to the data on the phone because of the fast responsiveness of IMS. He moved one step
back to be more far from the projected screen and have a better control on the phone screen.
After that he searched again a bit slowly and found the answer, but he spent 17 seconds,
which was 11 seconds more than our expected time.
P20 never looked at the context screen, and he spent 85 seconds on this task using SWP:
only 7 seconds more than our expected time. All of this time was spent on the first question.
In this task, P28 spent 123 seconds to complete the task: 45 seconds more than our
prediction. Much of this time was for tracing the entire of map (17 seconds for Q2). As we
said before, he was very slow in swiping bu thumb. P28 had little attention in searching
action. In three occasions, he did not complete the search action and he just turned when
the location of Q3 answer was very close to be visible on the focus device. (34 seconds for
four times searching, 24 second more than the expected time).
In IMS, both participants searched the entrie of the projection more than one time to find
the answer of each question. We believe that they did not pay enough attention to the texts
at the first time.
As we can see in Figure 74-right, in IMS and SWP, the amount of time that participants
spent on context was very small. The collected data show that, one participants in IMS and
both participants in SWP used context for less than 4 seconds in this task, which we could
assume that they did not use the context and they just looked at it. When the location of
answer in the last question was on top of the picture, the user spent more time than our
predicted time to find the answer. When most of the previous question were on the right
side and bottom of the picture, the participant most attention was on that part of the
diagram.
To put it briefly, in SBS, when the overview of picture had some useful information on the
context, participants spent more time on that, and they tried to use it as a guide to find the

104
location of answers. On the other hand, in IMS method, because of the fast responsiveness
to user interaction, the participants had little pay attention to the focus device and they
spent more time than they required to complete a task because of the two or three times
entire search. In the search type tasks, the SWP method was very similar to SBS if the
context does not have enough useful data, but in the tasks with marker, the SWP required
a bit more time than SBS, as we can call it “adjusting time”.
In summary, we learned that if some guides, such as markers (e.g. colors, texts), and natural
features (e.g. small lake) were available on the focus device, users less looking to the
context, however, users are dependent to the context on tasks that included markers as a
guide (e.g. added numbers, colors) which were invisible on the focus device. Moreover,
we learned that in the search tasks, the IMS method is less dependent to the context, when
it is fast responsive. We learned that there are other factors that might affect the
performance. For example while searching to find the location of the answer takes long
time, they may forgot the question. We found that the ambiguous question, or not
completely attention to the goals of the question were causes for repeating the question or
describing it. We learned that users abilities to use the touch screen device was different
and some users are naturally working slower on swipe gestures but some of them are very
fast.
5.3.4 PhoneOnly Evaluation
To evaluate how a user interaction is different between using an mF+C system and the
current applications, we compared Time of the three mF+C methods with a PhoneOnly
method that uses a basic photo viewer application. A stopwatch was used to record the time
for the PhoneOnly method. We measured the time in the same way as previous evaluations
for mF+C system methods.
Since we had only two tasks in the PhoneOnly method (one map and one board), and by
default in optimal condition, we compared the PhoneOnly board tasks with an optimal
board with similar type of tasks. The expected time complexity for PhoneOnly method is
47% faster than mF+C methods. We also ignore comparison between the content types

105
(Map vs. Board) in the PhoneOnly method since we do not have comparable tasks with
similar characteristics.
Figure 75 Average of Time for mF+C system methods and PhoneOnly
The average expected time (using adapted KLM) for performing board task in the
PhoneOnly method is 52.15 seconds, and we selected one optimal board task with a similar
type of task with expected time of 98.20 seconds that we used for IMS, SBS, and SWP.
We acknowledge that this comparison is problematic since diagrams are differ between
PhoneOnly and the other methods, but we report it here as a rough point of comparison.
Because of the task design, the expected time on PhoneOnly task was about 47% faster
than the average of expected time in mF+C method. Figure 75 show that, the SBS and SWP
are about 50% slower than PhoneOnly method which is quite similar to the expected time,
but PhoneOnly is faster than IMS, however by considering the 47% difference because of
the task design, this amount of difference is not significant. We believe that familiarity
with the method has an impact on the time of using the mF+C system. In the PhoneOnly
method, the last question in the board task was finding the value of a component on the
black square marker. The observation notes show that 33 participants spent 15 secs more
than similar questions that had different color or shapes rather than black-square to find the
answer, and three participants could not find it. In the interview, participants reported that
because of the black square, which was similar to the electronic components, it was
difficult to find it in an overview. As a result, when the participants were not significantly
faster in completing the tasks on PhoneOnly compared to mF+C methods, so we cannot
prove that the mF+C method is taking more time for task completion.

106
5.3.5 Post-method questionnaires evaluation
As we mentioned in the previous chapter, after completing four tasks with one interaction
method, participants filled out a questionnaire with 6 to 8 questions about the method
experience. In this section, we are looking at the participants’ responses and finding the
reason for the significant differences between the responses. We use the results from the
other data collection instruments, such as sensor logs, recorded videos, and observation
notes. Figure 76 on the next page shows the participants view in Likert scale for each
interaction method for different questions.
According to the questionnaires, with a chi-square test, we found that most of the
participants agree that information provided on the phone was accurate and properly
aligned with the projected picture in IMS (χ2 (1, N=36) = 42.06, p<0.001), SBS (χ2 (1,
N=36) = 76.50, p<0.001) and SWP (χ2 (1, N=36) = 27.61, p<0.001).

107
Figure 76 Post-method questionnaire responses
While none of the participants felt physical discomfort during the tasks using PhoneOnly
method, 8.34% of the participants on SBS and 16.67% on SWP reported their discomfort
using those methods. With a chi-square test we found that participants who used IMS
method were significantly uncomfortable on this method (χ2 (1, N=32) = 0.28, p=0.6).
Samples of the collected data from sensors for six participants are represented in Table 27.
The X-axis represents the left-right participants hand movement for 160 cm and Y-axis
represents top-down participants’ hand movement from 80 to 180 cm from the floor. The
8. Finding target objects was easy
using this interaction technique
7. I felt physical discomfort during
these tasks
6. Moving the mobile device in front
of the projection let me easily tell the
exact location of the mobile device
content/ It was easy to find answers
by pinch/stretch on the phone screen
5. The distance between the
projection and the mobile device was
acceptable
4. I sometimes lost track of my
current location
3. The application worked in real
time, without noticeable lags.
2. The information provided on the
phone was accurate and properly
aligned with the projected image.
1. It was easy to use the application

108
IMS method is shown in light brown, the dark brown is for SWP, and the black line
indicates SBS method. It can be clearly observed that all the participants moved more
lateral in IMS than SBS and SWP. Moreover, none of the participants holds the phone
higher than 135cm from the floor, which is between the waistline and the chest, in all SBS
and SWP methods, except user P2 that holds the phone between 122 cm to 141 cm in SWP.
However, in IMS method, all participants hold the phone higher than SBS and SWP.
ID: 2
ID: 6
ID: 15
ID: 18
ID: 19
ID: 36
Table 27 Six participants hand movement visualization
The average of participants’ hand movement in X (horizontally) and Y (vertically) is
available on Table 28. While the average height that participants hold the phone in SBS
and SWP is 118, this average for IMS is 16% more than other methods.

109
Method Average of X-movement (width) Average of Y movement (height)
IMS 120 137
SBS 31 118
SWP 27 118
Table 28 The average of hand movement for each mF+C method
Considering that all tasks are performed in all the mF+C methods, the average movement
for SBS and SWP may be due to less required device movement to/from the center of the
context screen while for IMS the device is moved all around the context screen.
Furthermore, referring to the recorded videos from the front camera, we observed that all
participants hold the phone at an angle of 65 to 90 degrees based on the pitch axis, which
is in the direction of the projected picture on the wall. Figure 77 shows that based on the
collected data from the phone gyroscope sensor, participants hold their phones at an angle
of about 80 to 110 degrees.
Figure 77 The distribution of device orientation on the pitch axis for all participants
We believe that the number of questions in the sequence has an impact on physical
discomfort in IMS. The average time to finish the tasks in this method was 522 seconds (8
min and 48 sec) which seems too long for holding a mobile phone in line with the projected
picture using a raised hand in front of the projection area. Because of this hand fatigue
while using IMS method, two participants (ID 6, 26) switched their hand to hold the phone
in between the tasks.

110
Method
Percentage of
users who found
method was easy
Pair Mean SD t df p-value
SWP 55.56 IMS - SBS .194 1.11 1.04 35 .303
IMS 86.12 IMS - SWP .722 1.27 3.38 35 .002
SBS 91.67 IMS - Phone .416 .87 2.86 35 .007
Phone 97.20 SBS - SWP .916 1.50 3.66 35 .001
SBS - Phone .222 .95 1.39 35 .173
SWP - Phone 1.138 1.29 5.29 35 <0.001 Table 29 The percentage of easiness for each method and stats of easiness comparison between
a pair of methods
Since a bit more than half (55.56%) of the participants in SWP and 91.67% in SBS reported
that using the method was easy, there was no significant difference between IMS (86.12%)
and PhoneOnly (97.20%) methods, however, there was a significant difference between
SWP and all other methods (see Table 29).
Method Lost location (%) Chi-square test
SWP 50 χ2 (1, N=32) = 0.28, p=0.6
SBS 33.34 χ2 (1, N=33) = 1.94, p=0.17
IMS 25 χ2 (1, N=33) = 5.94, p=0.015
Phone 16.67 χ2 (1, N=36) = 14.7, p<0.001
Table 30 The percentage and stat of lost location for each method from user responses
Table 30 shows that half of the participants in SWP and 33.34% of participants in SBS
reported that while performing the tasks, they lost their location with respect to the
projected picture, which is significant with IMS and PhoneOnly. In SWP, participants
needed to match the picture on the phone with the projection by moving the projected
picture and putting it in the direction of the phone location. During the trial task,
participants learned how to control the picture and how the pictures are related, but it was
common that participants were unclear about how the system works during the first or
second task. Since participants need to switch between two screens to find the answers,
they might lose the location of the viewfinder during the tasks. In summary, the participants
were more confident with IMS and PhoneOnly methods as they did not lose their location
significantly.

111
Best - 1 Mid - 2 Worst - 3
SBS 18 15 3
IMS 17 14 4
SWP 1 7 29
Table 31 The rank of methods from participants’ point of view
Table 31 shows the favorite methods sorted by participants from one to three where one is
the best method. In total, 18 participants selected SBS and 17 participants chose IMS as
the best method. In addition, 29 participants (80%) found that SWP was the least favored
method, χ2 (1, N=36) = 36.17, p<0.001.
In the next chapter, we will discuss what the results indicate with respect to the research
questions of this thesis.

112
CHAPTER 6 DISCUSSION
In this chapter, we will discuss what we have learned from the mockup implementation,
user study, and how the results answer the research questions. As the graph of our user
study for mF+C system > Methods > Conditions > Type of contents is illustrated in Figure
78, we are discussing the highlighted sections upward from level (1) to level (4).
Figure 78 Structure of experiment design
6.1 Discussion and analysis
The experimental apparatus and mF+C methods are designed to evaluate how we can
access the information on a large display with details everywhere. In this research, we
considered three types of interaction techniques with a provided large content, using a
mobile phone. We conducted a laboratory user study to find the advantages and
disadvantages of each interaction method, and to evaluate how well mF+C works in
situations with poor context visibility and finally, how content type familiarity affects an
mF+C system.
Section 1: Content type
In the user study, the tasks were related to two types of pictures. We used maps as a type
of picture known to all participants and electronic boards as a type that about half (17) of
the participants felt familiar with. According to the interviews, 24 participants agreed that
finding the answers on the map was easier than the board, 10 participants did not find any
differences between map and board and two participants considered the board easier than
the map, so, the result confirms the selection of two diagram types as representative of
familiar vs. unfamiliar content type. Since urban maps are more familiar to many people

113
than electronic diagrams we were anticipating that in the mF+C methods, finding answers
of tasks on a map would be faster and more accurate than an electronic diagram because
people would bring prior experience to bear when working with a map. The results show
that there was a difference in completing the tasks between types of pictures. The results
indicate that all participants performed tasks on Map faster than Board; however, for those
participants who were familiar with the board, the spent time on the board was not
significantly different from the time on the map.
Familiarity with the type of content is important when it has direct impact on how people
use the context. For example, Familiar user with electronic board need less visual markers
on the board and they are less dependent to use the context, however the Unfamiliar are
looking for additional markers that can help them to find an object on the context, and
regardless of methods, they are more dependent to the context, so an application developer
should consider this factors in designing process.
In previous F+C, O+D, or off-screen location technique such as, Wedge[23], Halo[4], and
Canyon[27] the user’s familiarity with the content type was not considered as a factor when
considering the usability of the system, however we show that familiarity with content type
has impact on performance on using an mF+C system.
Section 2: Conditions
In regards to our research question, “how do details on the phone screen adequately
compensate for poor context visibility due to projecting on non-planar and/or non-uniform
surfaces”, when the projected pictures were manipulated to represent content in different
light conditions and surface materials.
In particular, participants spent more time on suboptimal than optimal conditions.
However, there was no significant difference in time between optimal and suboptimal for
the IMS and SBS methods. From the videos and observation notes, we observed that in the
optimal condition, participants tried to guess the answer or find the answer location by
looking at the projection area. However, in suboptimal condition, the projected picture does
not have enough details that user can find the answer just by looking at it; so they spent
more time to find the answer or the area of the answer than in optimal conditions. In tasks
that finding the answer of question was dependent to the marker on the context, while the

114
markers were not visible on the phone screen, participants should use the context. In
optimal tasks, by pointing to the markers and matching the surrounded shapes on the
context with the phone screen, finding answer was easier than suboptimal condition when
the context was fuzzy and participants required more time on context to find the correct
answer.
The result shows we can access to the information on a large display with distributed details
and without concern for the environmental effects. SWP and SBS appear less able to
compensate for loss of projection visibility. An analysis of attention on focus vs. context
screens suggests that the SWP and SBS methods require more frequent viewing of the
context image, particularly in suboptimal display conditions.
When in Canyon[27], both overview and detail were in the same plane, the environmental
effects such as light or unclear surfaces have an impact on details of the information.
However, in the mF+C system, with a high-resolution focus device in hand and projected
content on a surface, users can have access to the detail of information regardless of the
environmental effects.
Section 3: mF+C methods
According to the post-study interviews, the number of participants who preferred to use
SBS or IMS was about equal, while 29 out of 36 participants reported that the SWP was
their last choice. By analyzing the post-methods questionnaires responses and interviews,
we identified that feeling the physical discomfort during the tasks was the primary concern
about IMS. As we mentioned in chapter 5, the average of time to completing the tasks in
IMS method was more than 8 minutes, and during this time participant held up the phone
in front of the large picture, so this exhaustion likely affected the choice of favorite method.
According to the post-methods questionnaires results, SBS was ranked the most favored
method as to whether the information provided on the phone was accurate and properly
aligned with the projected content. From the interviews, we observed the viewfinder on the
projection area was a second motivation of participants to prefer SBS to IMS. In addition,
two participants reported that “if IMS had a viewfinder”, that method was absolutely their
first choice. Furthermore, from the same questionnaire, the participants reported that they
lost track on the IMS less than SBS and SWP. After analyzing the interviews, we

115
recognized that the participants who preferred the IMS method believed that moving
around the projected content was easier than swiping on the screen in SBS method.
Participants 1 and 26 stated that “because the application operates in all directions”, they
got a good sense of working without noticeable lags. Discussing technically, SBS and SWP
do not require phone location tracking; however, the IMS needs a tracking system to know
how to calibrate the phone content with projected picture, therefore, implementing the IMS
method is technically more challenging than SBS and SWP.
In SWP implementation, finding the answer of question is dependent to the location of the
previous question, because in SWP method, while users moving the projected picture, they
lose the overview of the context, so if the answer of the question will be outside of the
projection, they could not find it at a glance, and they have to relocate the projection to the
center and in this time, they might be forgot the question. In SWP the projected image was
synchronized with the phone in the center of the projectable area, which means moving the
phone does not affect the image position. If the projected image position was related to the
phone position/orientation, users would have always known where the phone image was
relative to the projected image, which might have helped them to have a better performance
on tasks. However, before starting tasks and during the training tasks we had informed
participants that the phone had been calibrated with the projected image in the initial
position. We consider this problem as one of the causes that SWP was ranked by the users
as the least favored method.
As we described in methods implementation section, for SBS and SWP, we first proposed
a mode for touching the edge of the screen to control the movement of the viewfinder or
projected image, however in the final implementation we used normal swipe gesture. In
our application, by swiping nine times on the screen the user can reach to the left edge of
the picture from the right edge. For moving from top to bottom, they need four times swipe
from the edge top to the bottom edge. If a picture is extra-large or the task needs more
jumping from left to right and top to bottom and vice versa, user may feel discomfort in
using this method, while this does not happen in the first proposed method. Assessing the
usability of this method and comparing it with the normal swipe gesture can be an
interesting topic for future research.
116
SBS has a pointer, and it is easy to put the pointer on the markers and find the answer. But
there are some problems. First, the pointer is a part of the projection, so if the projection is
affected by environmental effects, the pointer is also affected. As a temporary solution we
can adjust some of the properties of a pointer to be more visible, for example by changing
the contrast or color of the pointer when it is projected on a dark surface. In SBS user have
access to the overview of the projection anytime, but same as SWP, the SBS is also
dependent to the context.
We found that in IMS, the number of switches between the two screens and the time on the
projection area were both less than SBS and SWP. This result shows that the participants
could focus more on finding answers rather than on how the system is working, or if the
pointer is in the right place, or if has the projected picture has moved to the right be aligned
with the phone position, so we concluded that IMS is less dependent to Context visibility.
In IMS, when there is no pointer, or user do not need to control the projected image, so
user is less dependent to the projection. Here is the point that why immersion is important
in IMS method. When SBS and SWP are dependent to the context, in IMS user just need
and overview of the picture behind of the phone. According to the Bernstein [15], the
perception can be divide into two process. The first is transform low-level information to
high-level information, for example, extracts shapes for object recognition, the second, is
processing which is connected to the person’s concept and expectation or knowledge and
attention that influence perception. So, when they are aware of their surroundings, they are
using their senses to explore and understand what is the projected, how the method works,
processing questions and making a decision to answer the question, but they do not need
to staring at the context. According to the Goldstein [20], perception is mostly effortless,
because this processing, happens outside conscious awareness.
As a result, in IMS, there was no significant difference in time between optimal and
suboptimal conditions and by considering participants’ answers, comments, and
suggestions, we can state that, in the suboptimal condition, the IMS method has more
advantages than SBS and SWP methods.

117
Section 4: mF+C methods vs. PhoneOnly
There are few types of interaction on a smartphone while using simple applications such
as photo viewer and document management. Single/multiple taps, swiping, pinch, stretch,
and the amount of pressure on the screen are common methods of interaction. We evaluated
how people find the answers to questions in a large document using a mobile phone with a
simple photo viewer application, in comparison with methods developed for mF+C. The
nature of SBS is same as PhoneOnly when the data on the phone screen is the same as the
data on the projection area viewfinder and because the SBS is not related to the device
position and orientation. The SBS/SWP method is only showing a portion of the image,
while PhoneOnly shows the entire image. If one zooms out on SBS/SWP, using the
controls and does not pay much attention to the projection then it is truly like PhoneOnly
(the only difference is how zoom + pan works). If one does not zoom out, then these
methods are not the same as PhoneOnly, and they need to context switch to navigate. In
SBS and SWP, the context can help users to find the answers by following the additional
visual markers (if they exist) which are not available on the details. In addition, in all IMS,
SBS and SWP methods the picture on context and focus could be related to each other
while they are not the same. Based on our collected data, we could not identify a significant
difference between PhoneOnly and SBS, which can be an interesting experiment for future
work.
Considering the time, the PhoneOnly method was 8% faster than IMS and SBS with a
significant difference with SWP. In PhoneOnly, participants only used the phone screen,
however in the mF+C methods the participant’s attention was divided between Focus and
Context. When users have difficulty to find target objects while switching between multi
screens, visual markers can help them to reduce this problem[24]. The results of our study
also show that the participants spent more time on context in the suboptimal condition
compared to the optimal condition. In addition, the cost of switching between displays is
calculated in [44] based on attention shifts, visual/input space mismatch and distraction
factors. The results also indicate that the task completion time and the number of gaze shifts
are directly related to each other. As a result, because in PhoneOnly, the participant’s

118
attention is on a single small screen instead of two, and there were no gaze shifts, they
performed tasks faster than mF+C methods.
From the demographic questionnaire, we observed that all participants were familiar with
at least one of the zooming techniques, such as double tap, pinch or stretch. In addition, all
participants had experience using at least one of the currently popular mobile map
applications; therefore, they did not need to become familiar with a new technique. The
User’s background knowledge of how to use the system is another reason for supporting
the better time in the PhoneOnly method. As we described in results section, 33 out of 36
participants had spent 15 seconds more time to find a black square marker on board
compared to the other markers in different shape or color, when it was difficult to find it in
an overview. We agree that because of the phone screen size (~5” in our case), and
increasing the density of elements on the content, finding objects in an overview on the
phone takes a longer time (or maybe impossible) than an overview on the projected picture
(92” in our user study). We believe that a PhoneOnly method might be useful for
documents and pictures with low-density content when items are identifiable in an
overview; however, the overview is missing in PhoneOnly when users are looking at
details. We believe that an mF+C system is useful for large and complex maps, such as
aircraft technical diagrams, technical guides, and schematics, or Google map, but based on
our results, we could not prove this theory at this time.
According to [3], because of the large available drawing area, there was “lots of space” to
work in original F+C system for people who were working on large documents from
hardware designs to graphic contents such as posters, sketches and web. However, people
who were working on text documents were not interested on F+C. We consider that extra-
large documents with super high amount of details (e.g. blueprints of an airplane engine)
could not be useful on a small display of a phone or a tablet, while users need to see them
on a large screen. In this case, an mF+C can be a solution. An mF+C with a large overview
provider and high-resolution details in hand is portable and available everywhere. While
in PhoneOnly the user attention is just on a single point of focus, in mF+C the overview of
data is always available and can also be shared with other users. This lead us to open a
research question for future study, “What type of data need an mF+C system?”

119
Whereas both the mF+C system and the PhoneOnly method are portable but the mF+C
system,would let the users to have different linked views of information at the same time.
As we described in related work, Goncalves et al. [21] analyzed the effect of the overview
scale on mobile O+D interfaces, using map application in Classic, Split-Screen, and
Resizable interfaces. We believe that the accessible information in an overview is directly
related to many factors such as the content density, number, and size of the visual markers
and size of the device screen. However, in the mF+C system, when the large (e.g. 92-inch)
picture is projected for an overview, we can use the whole area of the phone’s screen only
for information details. In addition, the portable focus device in hand let users stand away
from the context, so they can have a better overview of the projected picture,
Currently, the IMS method poses some technical hurdles because of the need for device
tracking. There are two options available; first, using the external sensors such as
Polhemus, or Vicon cameras, which are difficult to use in a real situation. The second
choice is using a self-tracking device, such as Google Tango, which is still under
development. Today, Tango devices are not available in the market (only researchers can
order a developer kit), and the system is not stable yet, but we can predict that the
commercial devices will be available soon. Until that day, by forgoing some of the features
(e.g. movement in any direction, interactive zoom, user’s head relation), we can use built-
in sensors (e.g. gyroscope, accelerometers) which are available on the most of the phones
for interactions.
While in all tasks we used static images, we believe that mF+C is also good for animated
images. Dynamic graphs and visualized data could be applied to the mF+C system. IMS is
fast response technique, so we can track a live motion from side to side of the projection if
the speed of movement does not make the fuzzy picture on the phone.
6.2 Limitations
There were some limitations for this project.
Method design: In SBS we had two buttons to control the level of zoom, but during
zooming in/out the rectangular pointer size on projection was not changing, which was one
of the SBS method design mistakes. In SBS and SWP there was no notification feature to

120
notify the user about the zoom level of the picture on the phone whether it is in the initial
zoom or in any other zoom level. As we discussed before, in SWP the projection image
and the phone were coupled in the center of the projectable area, and the projected image
position was fixed regardless of any changes in the phone position/orientation, which was
because of the fixed location of the projector. Since the projector was not attached to the
phone, moving the phone was not causing the projector to move, therefore the projectable
area was fixed. Moving the projection image according to the phone movement, would
lead to losing the overview of the picture, so we decide to inform participants that they
should stand in the center of projectable area.
Task design: While 12 different pictures helped us to prepare different types of questions,
but because the tasks were not counterbalanced according to PhoneOnly/mF+C methods
and Optimal/Suboptimal, we could not use all tasks for all time comparison, so we made a
group of similar tasks with the same expected time for evaluation and comparing the results
of each group.
Training tasks: We designed three training tasks and asked participants to work on them
to get more familiar with the system and methods. The time for doing training tasks was 2-
3 minutes. Since the training tasks design was not including an enough amount of
challenges compared to the main tasks, some of the participants had difficulties during
doing the first or second main task, specifically in SWP method that they did not understand
how the method was working.
Condition design: We manipulated the pictures to simulate different projection optimality,
however if have used the non-planar or noisy surfaces instead of this simulation, we could
have a better real comparison between two same optimal pictures, that one of them was
projected on a clear surface and the other same picture was projected on uneven surface.
Tracking system: The Polhemus tracking system-supporting range was about two meters
from the Source, but because it is using the electromagnetic field technology, any metal
objects on the lab make distortion and has a negative effect on the data. In our lab, because
of the building structure, furniture and large electronic devices (e.g. tabletops, 4 x 60” LCD
screen on the wall, ceiling lights), the sensors were not working fine. A Polhemus system
providing position and orientation data for each sensor, but unfortunately in our lab, the
orientation data was completely strange and unusable. We could cover the walls and floor

121
with a wooden board to stop building’s distortion, but we could not find any large and
empty space without furniture in our level of the building that we can use it for a month.
In addition, we had another user study running at the same time in the lab, so we could not
move shared hardware and stuff such as video cameras and tripods every days or hour. To
solve the orientation problem, we used the additional phone, which was attached to the
back of a headband, and we collected the phone’s gyroscope data for tracking the user’s
head orientation. During the study, we never observed any complaint from participants
about the phone on the back of the head.
The Polhemus hub, which sensors are connected to it, could transfer data to PC via a USB
cable or wirelessly on 2.4 GHz RF. At first, we tried to use wireless mode, but because of
the noticeable lags, we switched to the wire mode. However, because of the USB cable
length support, which was limited to 2 meters, the experiment working space was
decreased.
Head Tracking: We found that using mobile phone on the back of the head was not a
useful method because we could not collect valid required data from the sensors, which
was a result of the phone instability on the head. Another issue raised for the female
participants who had tied their hair on the back or top of their head, which made it difficult
for them to keep the headband and the phone in the right place at the back of their head.
6.3 Application
In this project, we were inspired by the work of aircraft mechanics, technicians, engineers
and others who work with large technical documents that need to be accessed in suboptimal
conditions while performing physical and/or mobile work. As we learned the mF+C system
could cover the environmental effects, and generally, it works in an acceptable time, we
found that an mF+C system, particularly an IMS approach, is useful when the projected
screen operates as an overview of data and a mobile phone with a high-resolution screen
would show the information details. Train the users to use the system and user familiarities
with content type are other notable factors in using an mF+C method.
mF+C system could be useful in projection mapping. For example, while inside of a device
is not visible, by projecting an overview of the device on the body, the person can see the
details of the device on the phone screen. It is also useful for large 3D objects. For example,

122
to find how two parts of a car are connected by pipe, when the overview is projected on
the hood and the particular parts are highlighted, user can trace the highlighted pipe.
6.4 Future work
In the theory of the immersive mF+C system, we have identified some features that are not
finalized or fully implemented yet, and these can be considered in future work. In the IMS
method, a picture on the phone screen was related to the device position and orientation,
which works well, but in the real world, a picture that a person observes through a lens is
related to both lens position and orientation, and the user’s head position and orientation.
To achieve this level of accuracy we have to add a parallax feature. We are working on it,
and most of the implementation is already completed using two Polhemus sensors, but
more testing and calibration is required before building a prototype that works well.
Another improvement on the mF+C mockup used in the study would be using a portable
projector instead of the stationary one. We can evaluate how a pocket size or a Pico
projector on the phone or on the user's head, shoulders or waist is more or less appropriate
for mF+C. Shared displays can play a role in creating team working concept[42], so, in
field studies, we can assess how multiple user configurations in mF+C system might be
useful and where “availability everywhere” F+C has real value. As Bishop et al. [6]
reported that users do not have much privacy on large projected displays, we can evaluate
mF+C from a privacy perspective, in which a big picture is projected but details are only
available on the device which is in the user’s hand.

123
CHAPTER 7 CONCLUSION
In this thesis, by using a mobile phone and a video projector we designed a system called
“Mobile Focus + Context (mF+C)”. In this system, a mobile phone provides details (or
another view) related to a contextual view presented on a large screen. To implement an
mF+C system, first we need a projected picture on a surface. Due to environmental
conditions, pictures may not be clear, text may be not legible, shapes may be
unrecognizable, or colors may not be distinguishable, so the user has a suboptimal
presentation of the large image. However, the user can use a phone in front of the projected
picture and see details on the mobile phone. To have an mF+C system, we need a mobile
phone with self-tracking system and an embedded projector on the back of it. Due to
technical limitations, a system was not available at the time of this study, so we made a
limited version of this system, with on the market devices, to assess what is currently
possible. We also developed an experimental apparatus that approximates how an mF+C
system would work from the user’s perspective.
We implemented three interaction methods using the apparatus, and conducted a user study
to evaluate how the mF+C system would be useful, what are the advantages and
disadvantage of the interaction methods and how a focus device can sufficiently overcome
the effects of the environmental conditions on content. We recruited 36 participants to
perform 14 tasks with two different types of pictures (maps and electronic circuit boards).
The experimental factors were the interaction methods used, and the optimality (overall
visibility) of the projected context image.
We learned that an mF+C system could provide information with details on a large display
in any location without concerning about the effects of the environmental conditions. In
addition, we found that in the mF+C system, the familiarity with the type of the content
has an impact on the performance of using the methods.
We found because of using two separated screens in the mF+C system, the user requires
time to switch between screens. However, the user needs less time to switch between the
screens when using IMS compared to SBS and SWP. Users also spend more time on the
mobile device rather than projected picture using the IMS method, which helps them to
focus more on the high-resolution focus view. Because of less time spent on Context in

124
IMS compared with SBS and SWP, we found that IMS needs less context visibility, which
is helpful in suboptimal conditions.
Finally, we believe that an mF+C system is useful for those who need a large overview of
data with high-resolution details in any location.

125
BIBLIOGRAPHY
1. Hyojoon Bae, Mani Golparvar-Fard, and Jules White. 2013. High-precision vision-
based mobile augmented reality system for context-aware architectural,
engineering, construction and facility management (AEC/FM) applications.
Visualization in Engineering 1, 1: 3. http://doi.org/10.1186/2213-7459-1-3
2. Karim El Batran and Mark D. Dunlop. 2014. Enhancing KLM (keystroke-level
model) to fit touch screen mobile devices. Proceedings of the 16th international
conference on Human-computer interaction with mobile devices & services -
MobileHCI ’14: 283–286. http://doi.org/10.1145/2628363.2628385
3. Patrick Baudisch, Nathaniel Good, and Paul Stewart. 2001. Focus plus context
screens. Proceedings of the 14th annual ACM symposium on User interface
software and technology - UIST ’01, ACM Press, 31.
http://doi.org/10.1145/502348.502354
4. Patrick Baudisch and Ruth Rosenholtz. 2003. Halo. Proceedings of the conference
on Human factors in computing systems - CHI ’03, ACM Press, 481.
http://doi.org/10.1145/642611.642695
5. Louis-pierre Bergé, Marcos Serrano, Gary Perelman, and Emmanuel Dubois.
2014. Exploring Smartphone - Based Interaction with Overview + Detail
Interfaces on 3D Public Displays. MobileHCI 2014: 125–134.
http://doi.org/10.1145/2628363.2628374
6. Gary Bishop and Greg Welch. 2000. Working in the Office of Real Soon Now’'.
IEEE Computer Graphics and Applications 20, 4: 76–78.
http://doi.org/10.1109/38.851754
7. Jorge H. Dos S. Chernicharo, Kazuki Takashima, Yoshifumi Kitamura, Jorge H
dos S Chernicharo, Kazuki Takashima, and Yoshifumi Kitamura. 2013. Seamless
interaction using a portable projector in perspective corrected multi display
environments. Proceedings of the 1st symposium on Spatial user interaction - SUI
’13: 25. http://doi.org/10.1145/2491367.2491375
8. Civil Aviation Authority. 2002. Human factors in aircraft maintenance and
inspection [CAP 718]. 12: 51. Retrieved from
http://www.caa.co.uk/docs/33/cap718.pdf
9. Lisa G. Cowan, Nadir Weibel, William G. Griswold, Laura R. Pina, and James D.
Hollan. 2011. Projector phone use: practices and social implications. Personal and
Ubiquitous Computing 16, 1: 53–63. http://doi.org/10.1007/s00779-011-0377-1
10. Francesca De Crescenzio, Massimiliano Fantini, Franco Persiani, Luigi Di
Stefano, Pietro Azzari, and Samuele Salti. 2011. Augmented reality for aircraft
maintenance training and operations support. IEEE Computer Graphics And
Applications 31, 1: 96–101. http://doi.org/10.1109/MCG.2011.4
11. Mary Czerwinski, George Robertson, Brian Meyers, Greg Smith, Daniel Robbins,
and Desney Tan. 2006. Large display research overview. CHI ’06 extended

126
abstracts on Human factors in computing systems - CHI EA '06, ACM Press, 69.
http://doi.org/10.1145/1125451.1125471
12. Mary Czerwinski, Greg Smith, Tim Regan, Brian Meyers, George Robertson, and
Gary Starkweather. 2003. Toward characterizing the productivity benefits of very
large displays. (2003) Interact 2003, IOS Press. Retrieved from
http://research.microsoft.com/apps/pubs/default.aspx?id=64317
13. Alexandru Dancu, Zlatko Franjcic, and Morten Fjeld. 2014. Smart flashlight.
Proceedings of the 32nd annual ACM conference on Human factors in computing
systems - CHI ’14, ACM Press, 3627–3630.
http://doi.org/10.1145/2556288.2557289
14. Hopey Don. 2014. Press, Public Thirsty for Information, But Agencies Turning
Off Spigot. 1. Retrieved from http://www.sej.org/publications/sejournal-
sp14/press-public-thirsty-information-agencies-turning-spigot
15. Douglas Bernstein. 2010. Essentials of Psychology. Wadsworth Publishing.
Retrieved from
https://books.google.ca/books?id=5k9tCgAAQBAJ&printsec=frontcover&source=
gbs_ge_summary_r&cad=0#v=onepage&q&f=false
16. Achim Ebert, Peter Dannenmann, Matthias Deller, Daniel Steffen, and Nahum
Gershon. 2008. A large 2d+3d focus+context screen. Proceeding of the twenty-
sixth annual CHI conference extended abstracts on Human factors in computing
systems - CHI ’08, ACM Press, 2691. http://doi.org/10.1145/1358628.1358746
17. George W. Fitzmaurice. 1993. Situated information spaces and spatially aware
palmtop computers. Communications of the ACM 36, 7: 39–49.
http://doi.org/10.1145/159544.159566
18. Mark J. Flider and Brian P. Bailey. 2004. An evaluation of techniques for
controlling focus+context screens. 135–144. Retrieved January 24, 2015 from
http://dl.acm.org/citation.cfm?id=1006058.1006075
19. George W Furnas. 1986. Generalized fisheye views. Proceedings of the SIGCHI
conference on Human factors in computing systems - CHI ’86, ACM Press, 16–23.
http://doi.org/10.1145/22627.22342
20. E. Bruce Goldstein. 2009. Sensation and Perception. Wadsworth Publishing.
21. Tiago Gonçalves, Ana Paula Afonso, Maria Beatriz Carmo, and Paulo Pombinho.
2012. Overview vs detail on mobile devices: a struggle for screen space. 233–238.
Retrieved January 24, 2015 from
http://dl.acm.org/citation.cfm?id=2377916.2377944
22. Chris Gunn, Csiro I C T Centre, and Matt Adcock. 2011. Using Sticky Light
Technology for Projected Guidance. System: 131–134.
http://doi.org/10.1145/2071536.2071557
23. Sean Gustafson, Patrick Baudisch, Carl Gutwin, and Pourang Irani. 2008. Wedge.
Proceeding of the twenty-sixth annual CHI conference on Human factors in
127
computing systems - CHI ’08, ACM Press, 787.
http://doi.org/10.1145/1357054.1357179
24. Raphael Hoffmann, Patrick Baudisch, and Daniel S Weld. 2008. Evaluating visual
cues for window switching on large screens. Proceedings of ACM CHI 2008
Conference on Human Factors in Computing Systems 1: 929–938.
http://doi.org/10.1145/1357054.1357199
25. Eva Hornecker and Thomas Psik. 2005. Using ARToolKit markers to build
tangible prototypes and simulate other technologies. Lecture Notes in Computer
Science (including subseries Lecture Notes in Artificial Intelligence and Lecture
Notes in Bioinformatics), 30–42. http://doi.org/10.1007/11555261_6
26. Wolfgang Hürst and Matthias Helder. 2011. Mobile 3D graphics and virtual reality
interaction. Proceedings of the 8th International Conference on Advances in
Computer Entertainment Technology - ACE ’11: 1.
http://doi.org/10.1145/2071423.2071458
27. Alexandra Ion, Y.-L. Betty Chang, Michael Haller, Mark Hancock, and Stacey D.
Scott. 2013. Canyon. Proceedings of the SIGCHI Conference on Human Factors
in Computing Systems - CHI ’13, ACM Press, 3149.
http://doi.org/10.1145/2470654.2466431
28. H. Kato and M. Billinghurst. 1999. Marker tracking and HMD calibration for a
video-based augmented reality conferencing system. Proceedings 2nd IEEE and
ACM International Workshop on Augmented Reality (IWAR’99), IEEE Comput.
Soc, 85–94. http://doi.org/10.1109/IWAR.1999.803809
29. Markos Kourgiantakis, Nikos Matsatsinis, and Athanasios Migdalas. 2012. E-
commerce: A survey for Cretan agro-food sector. URL: http://ressources. ciheam.
org/om/pdf/c61/00800165. pdf 28.
30. David M. Krum, Evan a. Suma, and Mark Bolas. 2012. Augmented reality using
personal projection and retroreflection. Personal and Ubiquitous Computing 16, 1:
17–26. http://doi.org/10.1007/s00779-011-0374-4
31. Edward Lank and Son Phan. 2004. Focus+Context sketching on a pocket PC.
Extended abstracts of the 2004 conference on Human factors and computing
systems - CHI ’04, ACM Press, 1275. http://doi.org/10.1145/985921.986042
32. Kara a. Latorella and Prasad V. Prabhu. 2000. A review of human error in aviation
maintenance and inspection. International Journal of Industrial Ergonomics 26, 2:
133–161. http://doi.org/10.1016/S0169-8141(99)00063-3
33. Daniel C Mcfarlane, Steven M Wilder, Executive Campus, and Cherry Hill. 2009.
Interactive Dirt : Increasing Mobile Work Performance with a Wearable Projector-
Camera System. UbiComp ’09: 205–214. http://doi.org/10.1145/1620545.1620577
34. Pranav Mistry, Pattie Maes, and Liyan Chang. 2009. WUW - wear Ur world.
Proceedings of the 27th international conference extended abstracts on Human
factors in computing systems - CHI EA ’09, ACM Press, 4111.

128
http://doi.org/10.1145/1520340.1520626
35. Satoshi Murata, Masanori Suzuki, and Kaori Fujinami. 2013. A wearable
projector-based gait assistance system and its application for elderly people.
Proceedings of the 2013 ACM international joint conference on Pervasive and
ubiquitous computing - UbiComp ’13, ACM Press, 143.
http://doi.org/10.1145/2493432.2493472
36. U. Neumann and A. Majoros. 1998. Cognitive, performance, and systems issues
for augmented reality applications in manufacturing and maintenance.
Proceedings. IEEE the Virtual Reality Annual International Symposium (VRAIS):
4–11. http://doi.org/10.1109/VRAIS.1998.658416
37. J. Newman, M. Wagner, M. Bauer, et al. 2004. Ubiquitous Tracking for
Augmented Reality. Third IEEE and ACM International Symposium on Mixed and
Augmented Reality, IEEE, 192–201. http://doi.org/10.1109/ISMAR.2004.62
38. Shuhei Ota, Yoshinari Takegawa, Tsutomu Terada, and Masahiko Tsukamoto.
2010. A Method for Wearable Projector Selection That Considers the Viewability
of Projected Images. Comput. Entertain. 8, 3: 17:1–17:16.
http://doi.org/10.1145/1902593.1902596
39. James Ott. 1995. Maintenance executives seek greater efficiency. Aviation Week &
Space Technology 142, 20: 43. http://doi.org/0005-2175
40. Jihal Patel. 2013. Creating a Focus Plus Context Scenario Using Mobile Phone
and Pico Projector. Halifax, NS.
41. C. Plaisant, D. Carr, and B. Shneiderman. 1995. Image-browser taxonomy and
guidelines for designers. IEEE Software 12, 2: 21–32.
http://doi.org/10.1109/52.368260
42. Christopher Plaue and John Stasko. 2009. Presence & Placement: Exploring the
Benefits of Multiple Shared Displays on an Intellective Sensemaking Task.
GROUP ’09: Conference on Supporting Group Work: 179–188.
http://doi.org/10.1145/1531674.1531701
43. Tania Pouli and Sriram Subramanian. 2012. Mobile projectors versus mobile
displays: an assessment of task performance. Proceedings of the ACM Symposium
on Applied Perception - SAP ’12 1, 212: 103–110.
http://doi.org/10.1145/2338676.2338698
44. Umar Rashid, Miguel A. Nacenta, and Aaron Quigley. 2012. The Cost of Display
Switching: A Comparison of Mobile, Large Display and Hybrid UI
Configurations. Proceedings of the International Working Conference on
Advanced Visual Interfaces (AVI’12): 99–106.
http://doi.org/10.1145/2254556.2254577
45. Safety-Regulation-Group. 2009. Aircraft Maintenance Incident Analysis.
Retrieved from http://www.caa.co.uk/docs/33/2009_05.pdf
46. Antti Sand and Ismo Rakkolainen. 2013. Mixed reality with multimodal head-

129
mounted pico projector. Proceedings of the Virtual Reality International
Conference on Laval Virtual - VRIC ’13, ACM Press, 1.
http://doi.org/10.1145/2466816.2466831
47. J. Serván, F. Mas, J.L. Menéndez, and J. Ríos. 2012. Assembly Work Instruction
Deployment Using Augmented Reality. Key Engineering Materials 502, October
2015: 25–30. http://doi.org/10.4028/www.scientific.net/KEM.502.25
48. T. Simmons and M. Manahan. 1999. The Effects of Monitor Size on User
Performance and Preference. Proceedings of the Human Factors and Ergonomics
Society Annual Meeting 43, 24: 1393–1393.
http://doi.org/10.1177/154193129904302411
49. Masanori Sugimoto, Kosuke Miyahara, Hiroshi Inoue, and Yuji Tsunesada. 2005.
Hotaru: Intuitive manipulation techniques for projected displays of mobile devices.
Lecture Notes in Computer Science (including subseries Lecture Notes in Artificial
Intelligence and Lecture Notes in Bioinformatics), Springer Berlin Heidelberg, 57–
68. http://doi.org/10.1007/11555261_8
50. Emi Tamaki, Takashi Miyak, and Jun Rekimoto. 2010. BrainyHand. Proceedings
of the International Conference on Advanced Visual Interfaces - AVI ’10: 387.
http://doi.org/10.1145/1842993.1843070
51. Martin Weigel, Sebastian Boring, Nicolai Marquardt, Jürgen Steimle, Saul
Greenberg, and Anthony Tang. 2012. From Focus to Context and Back:
Combining Mobile Projectors and Stationary Displays. Retrieved January 24, 2015
52. Feng Zhou, Henry Been Lirn Dun, and Mark Billinghurst. 2008. Trends in
augmented reality tracking, interaction and display: A review of ten years of
ISMAR. Proceedings - 7th IEEE International Symposium on Mixed and
Augmented Reality 2008, ISMAR 2008, IEEE, 193–202.
http://doi.org/10.1109/ISMAR.2008.4637362
53. Yun Zhou, Bertrand David, and René Chalon. 2012. PlayAllAround. Proceedings
of the 2012 Conference on Ergonomie et Interaction homme-machine - Ergo’IHM
'12: 105–112. http://doi.org/10.1145/2652574.2653418
54. Project Tango – Google. Retrieved March 27, 2015 from
https://www.google.com/atap/projecttango/#project
55. Number of smartphone users worldwide from 2012 to 2018 (in billions). Retrieved
from http://www.statista.com/statistics/330695/number-of-smartphone-users-
worldwide/
56. ARToolKit Home Page. Retrieved March 31, 2015 from
http://www.hitl.washington.edu/artoolkit/
57. 2015. Routehappy Integrates Happiness Factors Into Google Flights Results.
Retrieved from http://www.prnewswire.com/news-releases/routehappy-integrates-
happiness-factors-into-google-flights-results-300049853.html

130
APPENDIX A – INFORMED CONSENT
Using a smartphone to interact with projected content Principal Investigators: Majid Nasirinejad, Faculty of Computer Science, [email protected]
Dr. Derek Reilly, Faculty of Computer Science, [email protected]
Dr. Gary Hu, Faculty of Computer Science, [email protected]
Huiyuan Zhou, Faculty of Computer Science
Mohamad Hossein Salimian, Faculty of Computer Science
Mohammed Alnusayri, Faculty of Computer Science
Contact Person: Majid Nasirinejad, Faculty of Computer Science, [email protected]
We invite you to take part in a research study being conducted by Majid Nasirinejad at
Dalhousie University. Your participation in this study is voluntary and you may withdraw
from the study at any time. Your academic (or employment) performance evaluation will
not be affected by whether or not you participate. To be eligible to participate in the study,
you must be a Dalhousie University student, staff or faculty currently, and have experience
using touch screen smartphones. There are very low risks associated with this study. There
is a low risk that some users may become frustrated or embarrassed if they experience some
difficulty performing the tasks during the study but the researcher will always be available
during the study to answer any questions. The study is described below. This description
tells you about the risks, inconvenience, or discomfort which you might experience.
Participating in the study might not benefit you, but we might learn things that will benefit
others. You should discuss any questions you have about this study with Majid Nasirinejad.
This study has been funded by the Natural Sciences and Engineering Research Council of
Canada.
The purpose of the study is to help us to assess a number of different techniques for linking
smartphone screens with content projected onto nearby walls. You will be asked to
participate in an hour and a half study where you will perform a set of tasks using a
smartphone. You will be asked to “think aloud” while completing the tasks and this will
be video recorded. Note that this video is for analysis only; it will not be used when
presenting results at conferences or elsewhere.
You will be compensated $20 for participating in the study; you can withdraw from the
study at any time without consequence. A researcher is always present during the study to
answer any questions you may have or address any problems that you may experience with
the tasks.
At the beginning of the study, you will meet with an investigator (at the Mona Campbell building).
You will be asked to give consent to do the study and to fill in a background questionnaire detailing
your experience on using touch screen mobile devices. You will be given a general description of
the type of tasks we want you to do with the application during the study. After doing a set of tasks,
you will fill in a questionnaire asking you about your experiences with the application. You will
complete fourteen tasks in four conditions this way. At the end of the study, you will answer post-
experiment interview questions that will ask you to reflect on interface configurations that are
presented to you during the tasks and on your general experience with the application.
All personal and identifying data will be kept confidential. The informed consent form and all
research data will be kept in a secure location under confidentiality in accordance to University

131
policy for 5 years post publication. Anonymity of textual data will be preserved by using
pseudonyms. All data collected in the video, questionnaires and interviews will use pseudonyms
(e.g., an ID number) to ensure your confidentiality.
In the event that you have any difficulties with, or wish to voice concern about, any aspect
of your participation in this study, you may contact Catherine Connors, Director, Office of
Research Ethics Administration at Dalhousie University’s Office of Human Research
Ethics for assistance: phone: (902) 494-1462, email: [email protected].
“I have read the explanation about this study. I have been given the opportunity to
discuss it and my questions have been answered to my satisfaction. I understand
that being video taped is necessary to participate in the study. I hereby consent to
take part in the study. However, I understand that my participation is voluntary and
that I am free to withdraw from the study at any time.”
Participant Researcher
Name: _______________________________ Name: __________________
Signature: ____________________________ Signature: _______________
Date: ________________________________ Date: ___________________
Please select one of the options below:
“I agree to let you directly quote any comments or statements made in any
written reports without viewing the quotes prior to their use and I understand
that the anonymity of textual data will be preserved by using pseudonyms.”
Participant Researcher
Name: ______________________________ Name: __________________
Signature: ___________________________ Signature: _______________
Date: ______________________________ Date: ___________________
Or
“I want to read direct quotes prior to their use in reports and I understand that
the anonymity of textual data will be preserved by using pseudonyms.”
[if this option is chosen, please include a contact email address:
____________________________]
Participant Researcher
Name: ______________________________ Name: __________________
Signature: ___________________________ Signature: _______________
Date: ______________________________ Date: ___________________
If you are interested in seeing the results of this study, please check below and provide
your email address. We will contact you with publication details that describe the
results.
“I would like to be notified by email when results are available via a publication.”
[if this option is chosen, please include a contact email address:
____________________________]

132
APPENDIX B - BACKGROUND QUESTIONNAIRE
PART I - PLEASE FILL IN THE FOLLOWING INFORMATION:
1. Date of Birth: ----/----/---- format: mm/dd/yyyy
2. Gender: Male Female
3. Faculty/unit at Dalhousie: ________ If a student:
____ Year Undergraduate Master PhD Other _____
4. What brand/operating system of smartphone do you use?
iPhone Android Blackberry Windows Phone Other:
5. How much time do you spend using smartphone applications every day?
Below 2 hrs 2-4 hrs more than 4 hrs
6. Do you ever use your personal phone in a specific task related to your job?
(e.g. take a picture, calculation, record data, use sensors like GPS)
Yes No I don’t prefer to but I’ll use it if needed
7. Do you use any application that works with your device’s sensors? (GPS,
Compass, gyro)
Yes No I don’t know what those are
If yes, please specify the sensors that you are using:
□ Proximity □ Magnetic field □ Gyroscope □ Accelerometer □ Fingerprint
□ GPS □ Compass □ Pressure □ NFC □ Light Others: ___
8. Did you ever used any remote control applications on your phone?
Yes No
□ TV Remote □ Game console remote □ Drone Remote
□ Presentation software remote □ Music Remote □ Robot Remote
9. Do you use any map application on your phone? Yes No
□ Google Map □ AppleMap □ MapMyFitness
□ Bus/Train Map □ Offline Map (GPS Navigation) Others: ___
10. Are you familiar with zoom in/out techniques on applications? (pinch, double
tap, etc)
Yes NO

133
APPENDIX C - POST-METHOD QUESTIONNAIRE | IMMERSIVE
Please respond to the following statements using the given scale (circle response):
1 2 3 4 5
Strongly Disagree
Somewhat Disagree
Neutral Somewhat Agree
Strongly Agree
1. It was easy to use the
application
1 2 3 4 5
Strongly
Disagree
Somewhat
Disagree
Neutral Somewhat
Agree
Strongly
Agree
2.
The information provided on
the phone was accurate and
properly aligned with the
projected image.
1 2 3 4 5
Strongly
Disagree
Somewhat
Disagree
Neutral Somewhat
Agree
Strongly
Agree
3. The application worked in real
time, without noticeable lags.
1 2 3 4 5
Strongly
Disagree
Somewhat
Disagree
Neutral Somewhat
Agree
Strongly
Agree
4. I sometimes lost track of my
current location
1 2 3 4 5
Strongly
Disagree
Somewhat
Disagree
Neutral Somewhat
Agree
Strongly
Agree
5.
The distance between the
projection and the mobile
device was acceptable
1 2 3 4 5
Strongly
Disagree
Somewhat
Disagree
Neutral Somewhat
Agree
Strongly
Agree
6.
Moving the mobile device in
front of the projection, let me
easily tell the exact location of
the mobile device content.
1 2 3 4 5
Strongly
Disagree
Somewhat
Disagree
Neutral Somewhat
Agree
Strongly
Agree
7. I felt physical discomfort
during these tasks
1 2 3 4 5
Strongly
Disagree
Somewhat
Disagree
Neutral Somewhat
Agree
Strongly
Agree
8. Finding target objects was easy
using this interaction technique
1 2 3 4 5
Strongly
Disagree
Somewhat
Disagree
Neutral Somewhat
Agree
Strongly
Agree
1. How the mobile screen size was large enough to see the details?
O Very small O Small O Neutral O Large O Very
Large
2. How the projected content was large enough to focus on?
O Very small O Small O Neutral O Large O Very
Large

134
APPENDIX C - POST-METHOD QUESTIONNAIRE | SIDE-BY-SIDE
Please respond to the following statements using the given scale (circle response):
1 2 3 4 5
Strongly
Disagree
Somewhat
Disagree
Neutral Somewhat
Agree
Strongly
Agree
1. It was easy to use the application
1 2 3 4 5
Strongly
Disagree
Somewhat
Disagree
Neutral Somewhat
Agree
Strongly
Agree
2.
The provided information by
application was accurate and
exactly related to the context.
1 2 3 4 5
Strongly
Disagree
Somewhat
Disagree
Neutral Somewhat
Agree
Strongly
Agree
3. The application works in real
time.
1 2 3 4 5
Strongly
Disagree
Somewhat
Disagree
Neutral Somewhat
Agree
Strongly
Agree
4. I sometimes lost track of my
current location
1 2 3 4 5
Strongly
Disagree
Somewhat
Disagree
Neutral Somewhat
Agree
Strongly
Agree
5.
The distance between context
and mobile device was
acceptable for interaction
1 2 3 4 5
Strongly
Disagree
Somewhat
Disagree
Neutral Somewhat
Agree
Strongly
Agree
6.
The marker allowed me to easily
tell the exact location of the
mobile device content.
1 2 3 4 5
Strongly
Disagree
Somewhat
Disagree
Neutral Somewhat
Agree
Strongly
Agree
7. I felt physical discomfort during
these tasks
1 2 3 4 5
Strongly
Disagree
Somewhat
Disagree
Neutral Somewhat
Agree
Strongly
Agree
8. Finding objects was easy using
this interaction technique
1 2 3 4 5
Strongly
Disagree
Somewhat
Disagree
Neutral Somewhat
Agree
Strongly
Agree

135
APPENDIX C - POST-METHOD QUESTIONNAIRE | SWIPE
Please respond to the following statements using the given scale (circle response):
1 2 3 4 5
Strongly Disagree
Somewhat Disagree
Neutral Somewhat Agree
Strongly Agree
1. It was easy to use the
application
1 2 3 4 5
Strongly
Disagree
Somewhat
Disagree
Neutral Somewhat
Agree
Strongly
Agree
2.
The information provided on
the phone was accurate and
properly aligned with the
projected image.
1 2 3 4 5
Strongly
Disagree
Somewhat
Disagree
Neutral Somewhat
Agree
Strongly
Agree
3. The application worked in real
time, without noticeable lags.
1 2 3 4 5
Strongly
Disagree
Somewhat
Disagree
Neutral Somewhat
Agree
Strongly
Agree
4. I sometimes lost track of my
current location
1 2 3 4 5
Strongly
Disagree
Somewhat
Disagree
Neutral Somewhat
Agree
Strongly
Agree
5.
The distance between the
projection and the mobile
device was acceptable
1 2 3 4 5
Strongly
Disagree
Somewhat
Disagree
Neutral Somewhat
Agree
Strongly
Agree
6.
Swiping the mobile device in
front of the projection, let me
easily tell the exact location of
the mobile device content.
1 2 3 4 5
Strongly
Disagree
Somewhat
Disagree
Neutral Somewhat
Agree
Strongly
Agree
7. I felt physical discomfort
during these tasks
1 2 3 4 5
Strongly
Disagree
Somewhat
Disagree
Neutral Somewhat
Agree
Strongly
Agree
8.
Finding target objects was
easy using this interaction
technique
1 2 3 4 5
Strongly
Disagree
Somewhat
Disagree
Neutral Somewhat
Agree
Strongly
Agree

136
APPENDIX C - POST-METHOD QUESTIONNAIRE | PHONEONLY
Please respond to the following statements using the given scale (circle response):
1 2 3 4 5
Strongly Disagree
Somewhat Disagree
Neutral Somewhat Agree
Strongly Agree
1. It was easy to use the
PhoneOnly application
1 2 3 4 5
Strongly
Disagree
Somewhat
Disagree
Neutral Somewhat
Agree
Strongly
Agree
2. The application worked in real
time, without noticeable lags.
1 2 3 4 5
Strongly
Disagree
Somewhat
Disagree
Neutral Somewhat
Agree
Strongly
Agree
3. I sometimes lost track of my
current location
1 2 3 4 5
Strongly
Disagree
Somewhat
Disagree
Neutral Somewhat
Agree
Strongly
Agree
4.
It was easy to find answers by
pinch/stretch on the phone
screen
1 2 3 4 5
Strongly
Disagree
Somewhat
Disagree
Neutral Somewhat
Agree
Strongly
Agree
5. I felt physical discomfort during
these tasks
1 2 3 4 5
Strongly
Disagree
Somewhat
Disagree
Neutral Somewhat
Agree
Strongly
Agree
6. Finding target objects was easy
using this interaction technique
1 2 3 4 5
Strongly
Disagree
Somewhat
Disagree
Neutral Somewhat
Agree
Strongly
Agree

137
APPENDIX D - POST-EXPERIMENT INTERVIEW
1. Overall, what was your experience interacting with linked projected content
and mobile phone detail?
2. Did you find any difference between map and board?
3. How was the distance between you and projection?
4. Which method was your favorite? Which one did you like better?
5. Do you have any suggestions to help make any of these methods more useful?
6. Do you believe the techniques could be useful in your own work? If so, how?
If not, why not?

138
APPENDIX E - PARTICIPANT PAYMENT RECEIPT
My signature below confirms that I received a sum of $20 (CDN) from Majid Nasirinejad
as an honorarium payment for participating in the “Using a smartphone to interact with
projected content” research project.
Name (please print): _________________________________
Signature: _________________________________
Date: _________________________________
139
APPENDIX F - RESEARCH ETHICS BOARD LETTER OF APPROVAL
Social Sciences & Humanities Research Ethics Board Letter of Approval
March 02, 2015
Mr Majid Nasirinejad Computer Science\Computer Science
Dear Majid, REB #: 2015-3490 Project Title: Using Smartphone to Interact With Projected Content Effective Date: March 02, 2015 Expiry Date: March 02, 2016
The Social Sciences & Humanities Research Ethics Board has reviewed your application for research involving humans and found the proposed research to be in accordance with the Tri-Council Policy Statement on Ethical Conduct for Research Involving Humans. This approval will be in effect for 12 months as indicated above. This approval is subject to the conditions listed below which constitute your on-going responsibilities with respect to the ethical conduct of this research.
Sincerely,
Dr. Valerie Trifts, Chair

140
APPENDIX G – KLM FOR EACH INTERACTION AND TASK

141

142

143

144

145
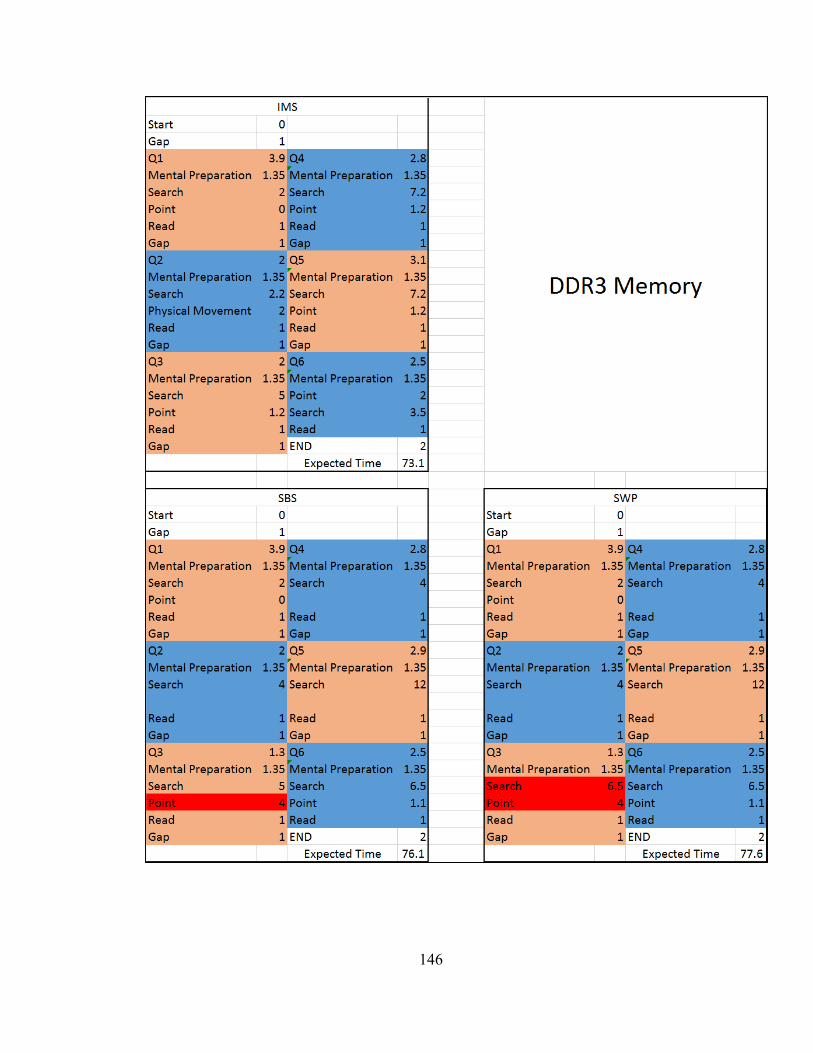
146

147
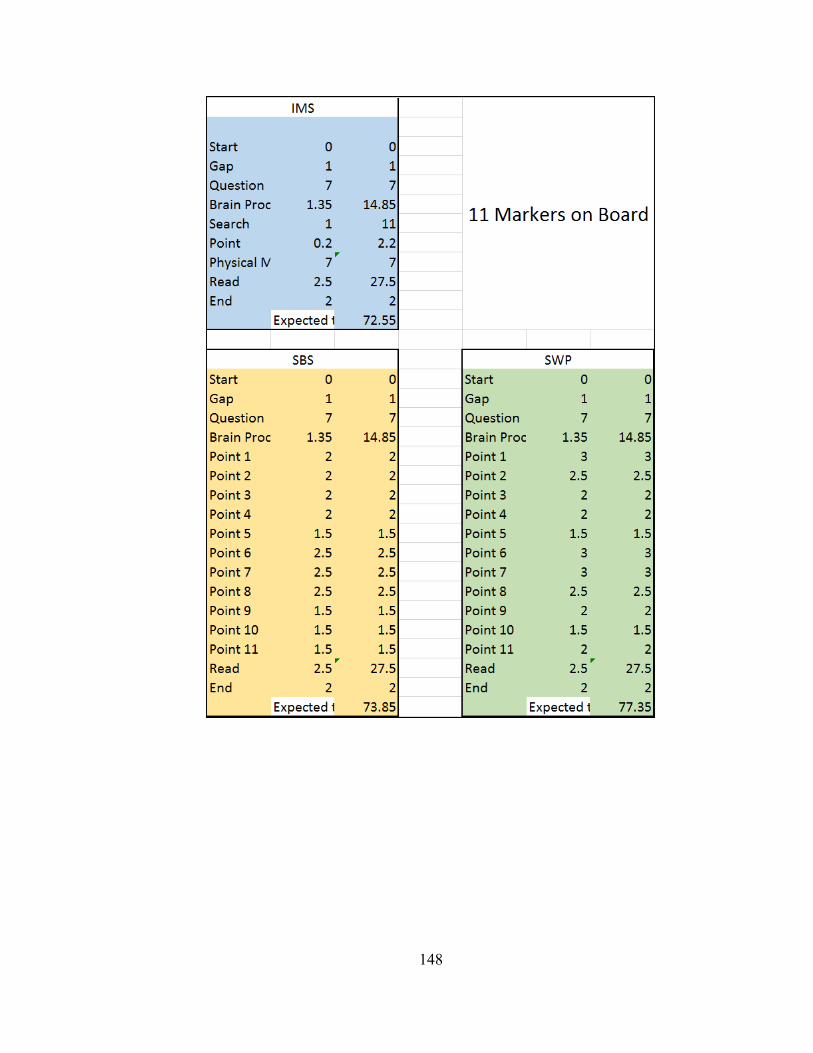
148

149

150