a model describing microbial inactivation and …. theor. biol. (1981) 88, l-34 a model describing...
TRANSCRIPT
J. theor. Biol. (1981) 88, l-34
A Model Describing Microbial Inactivation and Growth Kinetics
ANTONIO CASOLARI
Stazione Sperimentale, Rep. Microbiologico, Parma 43100, Italy
(Received 27 May 1980)
A model based on the chance of collision between environmental water molecules having appropriate energy and microbial cells, and leading to description of both inactivation and growth kinetics is presented. Functions derived from the model can describe the known shapes of survival curves (concave, convex, sigmoid, linear, on semi-log plot), the tailing-off phenomenon, some prominent behaviour of growing population kinetics, and are provided with fair predictive power.
The main features of the model as heat inactivation is concerned are: (1) always the survival curves are expected to be concave on semi-log plot, unless some lag occurs in reaching the treatment temperature; (2) the tailing-off occurs when the concentration of living cells and/or water molecules having lethal energy is low enough; (3) heat inactivation curve at any temperature and whichever is the water content of the medium can easily be predicted, provided a single survivor concentration after time I at temperature T in a medium of defined composition is known; (4) the energy value of molecules leading to inactivation is about half the activation energy expected from classical thermodynamic treatment of reaction rate; (5) the concentration of water molecules having enough energy to drive the process changes exactly Qlo times each 10°C or ten times each z degrees.
As radiation or chemical inactivation is concerned the model allows the description of known shapes of survival curves, linking the shape of the survival curve to the concentration of specific cellular molecular groups.
Appropriate modification of the fundamental equation of the model leads to description of cell growth kinetics as a function of cell concentra- tion, temperature, water content in the environment, the presence of metabolic by-products, antimetabolites, etc., as well as to the formulation of hypotheses about growth, death and senescence regulating structures.
1. Introduction
“One of the classical controversies in quantitative biology concerns the significance of variation in shape of survival curves of micro-organisms subjected to the lethal action of physical or chemical agents” (Hiatt, 1964).
The interpretation of survival curves is of considerable importance from both theoretical and practical standpoint, since (i) the shape of these curves
1
0022-5193/81/010001+34$02.00/0 @ 1981 Academic Press Inc. (London) Ltd.

2 A. CASOLARI
would reflect in some way the molecular mechanisms of cell inactivation and, moreover, (ii) having a better insight into these mechanisms would constitute a safer basis for the sterihzation cycles in the medical field, food industry and space aeronautics (Cerf, 1977).
A generally accepted oversimplification states that survival ratio N,/N,, is a decreasing exponential function of the size S of the treatment:
Nx/No = exp (-kS), (1)
in which No and N, are the cell concentration before and after the treatment size S is applied, respectively, and k is the inactivation rate constant. The treatment size S may be the time (usually minutes or seconds) in heat inactivation experiments carried out at constant temperature or in chemical inactivation studies (disinfection) carried out at constant concentration of the lethal compound; it may be the dose of radiation as well (Mrad, if X, beta or gamma rays are used; or PW cm-* s-r, using U.V. radiation), or the concentration of a lethal chemical compound to which micro-organisms are subjected for a fixed contact time.
According to (1) inactivation curve is a straight line when the logarithm of surviving fraction of micro-organisms is plotted against treatment size. By definition, the rate constant k is independent of the treatment size and cell concentration.
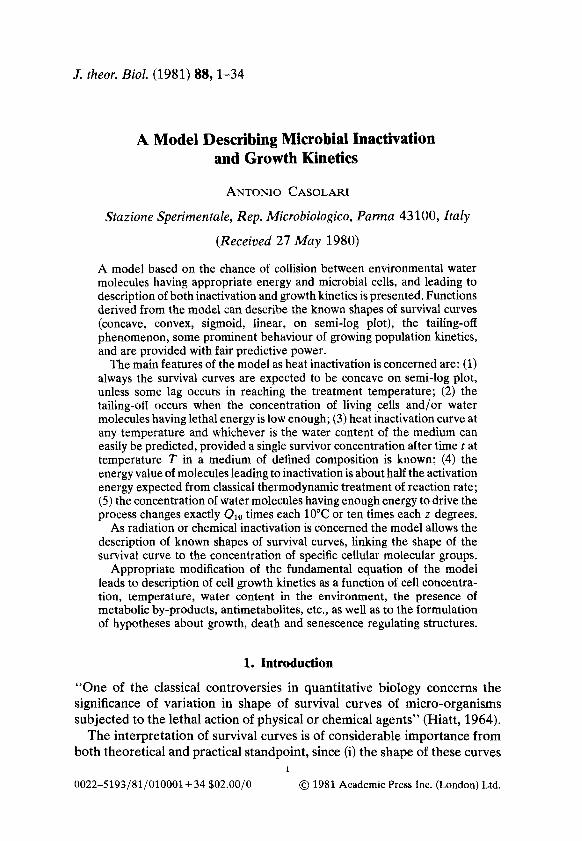
It is easier to treat inactivation kinetics as exponential, mostly in steriliza- tion technology (Ball & Olson, 1957; Stumbo, 1973). However, significant departures from exponential kinetics were so frequently encountered in experimental inactivation studies as to suggest that “curves which are nearly logarithmic in shape probably result from a fortuitous mixture of cells of different resistance” (Moats, Dabbah & Edwards, 1971). Three kinds of deviations from the logarithmic order of death do occur experimentally (Fig. 1): (a) a shoulder or initial lag in cell inactivation, followed by a log or nearly log behaviour, (b) a concave curve in semi-log plot, provided with a tail, and (c) a sigmoid curve characterized by the occurrence of an initial shoulder followed by a nearly log phase and finally by a more or less prolonged tail. Different shapes are obtained more generally with the same organism if temperature or concentration of the lethal agent increases from A 1 to A4 (Fig. l), or if the resistance of treated organisms increases from A4 to A 1, if experiments are carried out at the same temperature or concentration of a chemical lethal agent or with radiation.
Several explanations have been advanced for the different shapes of the survival curves, whether on the basis of the type of distribution of the resistance in a population of biological particles (Chick, 1930; Withell, 1942; Jordan & Jacobs, 1944; Vas & Prostz, 1957; Moats, Dabbah &
MICROBIAL KINETICS
S Arbitrary units
FIG. 1. Diagrammatic representation of the survival curves more commonly found on microbial inactivation experiments carried out with physical or chemical agents. For explana- tion of lettering see text.
Edwards, 1971), or of the clumping (Stumbo, 1973), or of the multiple target, multiple sites and multiple hit theories (Atwood & Norman, 1949; Lea, 1955; Wood, 1956; Zimmer, 1961). Han, Zhang & Krochta (1976) proposed mainly phenomenological models for the concave survivor curves as produced by.hypothetical innate heterogeneity in the population and/or by adaptation. None of the proposed theories are completely satisfactory (Hiatt, 1964; Sharpe & Bektash, 1977) and all leave the tailing phenomenon unexplained (Cerf, 1977). The exact meaning of the tail in the inactivation curves of micro-organisms subjected to physical or chemical lethal agents is that in defined environmental conditions a fraction of the population of treated particles might survive however large is treatment size. Consequently, any sterilization process may fail, especially if sized, as is usually done, on the basis of the logarithmic inactivation kinetics, and if the magnitude of the treatment cannot be increased over well defined levels owing to some undesired (and specific) behaviour of both lethal agent and/or treated material. Such a situation may occur in radiation treatment of neoplastic tissues, where severe damage may result from prolonged irradiation; in antibiotic therapy, where high doses may be coupled with high

4 A. CASOLARI
toxicity; in heat sterilization of several foods, for the damage of physico- chemical characteristics and biological value resulting by the length of treatment at high temperature; in heat or radiation sterilization processes as applied to the medical devices or electronic components, for the physical damage to the treated materials; etc. The survival of cells, bacteria or viruses to the above mentioned physico-chemical processes may have great significance both in recovery and/or in disease induction. Furthermore, it may be certain that the tails result more or less directly from specific cell inactivation mechanisms, so that a better knowledge of environmental conditions leading to tails may allow us to gain some insight into these molecular mechanisms.
2. The Particle Concentration Effect
Several observations showing that heat or radiation inactivation rate constants (on exponential basis) decreased as living particle concentrations were decreased, are inconsistent with all the above reported theories and allow a new approach to the problem.
Very often experimental conditions leading to A2 or A3 (Fig. 1) like survival curves are chosen, to achieve a great number of experimental points in order to be able to analyze them statistically. In these conditions the tailing phenomenon does not occur until survival ratio is lower than about 10-5-10-7 but sometimes even at higher level. Taking into account that cell concentrations usually employed in the heat or radiation inactivation studies are as high as 107-lo9 particles per experimental unit (g, ml, tube, can, device, etc.) it follows that the tailing off becomes evident mostly at surviving particle concentrations lower than about 103-lo2 per experimental unit.
In this connection it was shown (Casolari, 1974) that using different concentrations (ranging from 1*2-lo6 particles per experimental unit) of heat resistant putrefactive anaerobe 3679 spores, subjected simultaneously to heat treatments of the same size, the surviving fraction progressively increased as the cell count at the beginning of the treatment decreased and, moreover, the greater rise in survival ratio (i.e. the greater decrease in the inactivation rate constant on exponential basis) occurred just as initial counts were lower than about lo2 particles per experimental unit. Results of the same kind were obtained using yeasts (Williams, 1955; Casolari & Castelvetri, 1977).
Using Escherichia coli, Staphylococcus aureus and spores of Bacillus polymyxa subjected to ionizing radiation from Co6’ it was shown that the particle concentration affected the survival ratio at all the three dose rates tested (Figs 2 and 3) (Casolari Sr Medeot, unpublished research).

MICROBIAL KINETICS
Dgo k rod
FIG. 2. Change of decimal reduction dose (&a) of Sruphylococcus aureus subjected to gamma radiation, as a function of both the initial cell concentration (Cc) and thedose rate (krad min-‘): 4.1 (0), 8.1 (B) and 16.2 (0). (Casolari & Medeot, unp. res.)
From the data reported by Kempe et al. (1954) it can be calculated that at the Clostridium botulinurn spores concentration ranging from 4 x 10⁴-4 x lo2 per experimental unit, the decimal reduction dose (i.e. the dose required to destroy 90% of the treated particles and being the reciprocal value of the inactivation constant on exponential basis, using log,,) of gamma radiation ranged from 0.6-0.8 Mrad; this parameter increased to 1.5 Mrad at lower
I I I I I
0 -
I I I I 0.4 O-6 0.8 I.0
D90 M rad
FIG. 3. Change of the decimal reduction dose (L&O) of Bacillus polymyxa spores subjected to gamma radiation, as a function of both the initial spore concentration (Cc) and the dose rate (krad mm’): 1.35 (O), 5.4 (0) and 21.6 (0). (Casolari & Medeot, unp. res.)
6 A. CASOLARI
concentrations, reaching up to 12.0 Mrad at spore level as low as O-4 per experimental unit. Therefore, if the inactivation rate is affected by the living particle concentration, the hypotheses based on inherent heterogeneity, adaptation or clumping are unacceptable since the probability for the occurrence of particles having resistance much higher than the average value in the population, or for the occurrence of the clumping, inevitably decreases as particle concentration falls. As a matter of fact, the probability that individual particle behaving quite differently from the average in the population should not occur (PO) is a function of the particle concentration (c), so that from the binomial distribution:
PO(C) = 4: (2)
where 4 = 1 -p, and p is the probability of the singularity. Let p = 0.01 for instance, and the probability that the singularity does not occur at the particle concentration c becomes:
Po(lO) = 0*99’O = 0.904,
Po(lOO) = 0.99100 = 0.366,
P~(1000) = o*991000 = 4.3 x 1o-5.
As can be seen, the probability of occurrence of the singularity (very high resistance or clumping) changes dramatically when cell concentration falls from 103-lo*.
A mechanism must then be found in order to explain why in diluted suspensions the particle’s resistance is higher than in concentrated ones.
3. An Approach to the Model
The kinetic energy supplied to biphasic systems is very likely taken up first by the more concentrated component and then transferred by collision to the less concentrated one.
The microbial protoplasm, holding about 10’ solute molecules and about lOlo water molecules, should be regarded as a concentrated system. Otherwise, aqueous cell suspensions should be regarded as diluted systems, since the water molecules are 1010-1022 times the biological particles. The kinetic energy supplied to the cell suspensions is therefore taken up first by water molecules and then transferred by collision to the cells. The irregular motion of the cells owing to the striking water molecules (Brownian move- ments) leads to some displacement, and of course to an increase in collision probability, among the intracellular molecules. The interaction probability among particles is expected to be very high in concentrated systems, while
MICROBIAL KINETICS 7
very low in diluted ones. Therefore the collision probability among intracel- lular molecules will follow almost exclusively the lowest probability of interaction in the system (the cell suspension), that is the probability with which the extracellular water molecules strike the cells.
If the kinetic energy taken up by the cell following collision is not too high the collision among intracellular molecules is mostly non-destructive. The enzyme-substrate encounters will occur with a frequency more or less suitable to give the expected biological activity.
Nevertheless, if the kinetic energy of the water molecules striking the cell is high enough, the intracellular lighter molecules will collide with less motile targets (the macromolecules) in a disorderly way and with an amount of energy greatly in excess to break a high enough number of intermolecular bonds-and/or to modify intra- and/or inter-molecular connections to such an extent as-to deprive a lot of macromolecules of their specific biological activity. The inactivation of the macromolecular components should be a gradual phenomenon. The extent with which the inactivation does occur may lead to injury or death of the cell. The cell injury is recognized by the modified environmental requirements (Brown & Melling, 1971); damaged structures may be repaired (Busta & Jezeski, 1963; Sogin & Ordal, 1967). The cell death should occur when the concentration and the type of inactivated intracellular compounds is such as to cause a physical and/or physico-chemical hindrance to suitable intermolecular encounters occurring with the required frequency, owing to impairment of naturally intracellular channeled ways for suitable meeting and interaction of the molecules.
If the death or growth does occur when the cell is struck by water molecules having the appropriate level of energy, it may be possible to describe the inactivation or growth kinetics getting to know how many water molecules having suitable energy do occur in aqueous cell suspension kept in defined environmental conditions.
4. Microbial Heat Inactivation Kinetics
The probability P,,(N) of “n” events occurring in N independent trials is expected to be, from binomial distribution:
pa 07 = (;) p”qN-“7 (3)
so that the probability P,(N) of zero events occurring in N trials becomes:
J’oW) = qN, (4)
being q = 1 -p, and p the probability of the event. The survival probability

8 A. CASOLARI
C/Co in “t” independent trials (i.e. in t time units), being CO and C, the cell concentrations before and after the time t of treatment at the temperature T, can be described, according to (4), by the relation:
PO@) = G/Co = 4: (5)
provided that suitable specification for 4 can be obtained, taking into account (i) that P,(t) in equation (5) must increase as the 4 value increases also, so that the reaction rate constant k’ on exponential inactivation basis, according to (1) and (5):
k’ = (log Co -log CJ/t = -log 4 (6)
should decrease as the 4 value increases; and, moreover, (ii) the require- ments of the collision-model suggested above.
The numerical analysis carried out on several non-exponential as well as exponential microbial heat inactivation kinetics yielded the q expression fitting experimental data:
q=CLM (7)
so that, according to (5):
CJCO = c;“*. (8)
Dividing equation (8) by CO the basic function (9) is obtained:
co = c;+*i (9)
where CO and C, are the cell concentrations occurring before and after the treatment time t (min) respectively, and A4 is the frequency of collision between the cells and the water molecules having an energy greater than Ed (the energy value leading to the death of the cells).
The frequency of collision M equals the squared concentration of the water molecules having energy greater than Ed (i.e. nE/g of water), obtained from the Maxwellian distribution of the energy among particles as a function of the temperature, applied in the simplified form:
nE = no. exp (-&/RT), (10)
where no and nE are the total number of water molecules (in this case) and the number of molecules carrying more than Ed energy per mole of water, respectively; R = 1.987 cal mol-l deg-1 is the gas constant, and T is the temperature in degree Kelvin PK).
It follows:
A4 = (nE/lS)*, (11)
MICROBIAL KINETICS 9
which becomes, according to (10):
M = exp (103.7293 -2EJRT). (12)
To use the proposed function (9) it is necessary to know the C0 and C, values and the time t required to reduce C, to C,. Knowing these data at a single temperature, the inactivation curves at any temperature, whichever is the biological particle concentration and whichever is the water content of the medium can be predicted, since all the useful parameters can be obtained by simple computation, according to equations (9) and (12):
log C, = (1 + Mt)-l . log C,, (13)
M = t-l . (log Co/log C, - l), (14)
t = M-l . (log C,,/log C, - l), (15)
Ed = 0*5RT(103*7293-ln M), (16)
T=R-1.2Ed.(103+7293-lnM)-1. (17)
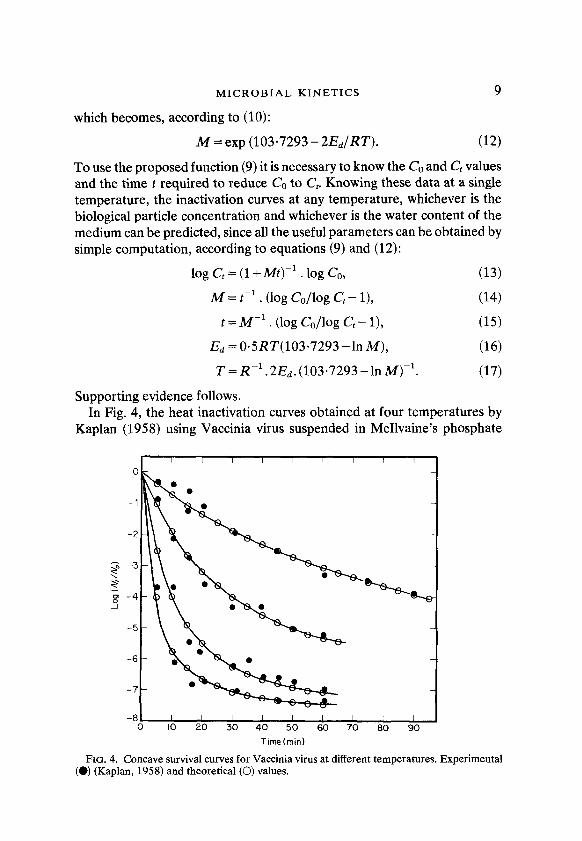
Supporting evidence follows. In Fig. 4, the heat inactivation curves obtained at four temperatures by
Kaplan (1958) using Vaccinia virus suspended in McIlvaine’s phosphate
7
-8 0 IO 30 40 50 60 70 80 90
Timetmin)
FIG. 4. Concave survival curves for Vaccinia virus at different temperatures. Experimental (0) (Kaplan, 1958) and theoretical (0) values.
10 A. CASOLARI
O-004 M citrate buffer at pH 7.2 are reported together with the calculated curves. The agreement is evident. Kaplan (1958) reported that V. virus titre should be “about 107-10’ infective units per ml”. From the analysis of the graphically reported data the inactivation curves are fitted by a particle concentration of lO’/ml at 50” and at 6O”C, and of 3 x lO*/ml at 52.5” and 55°C.
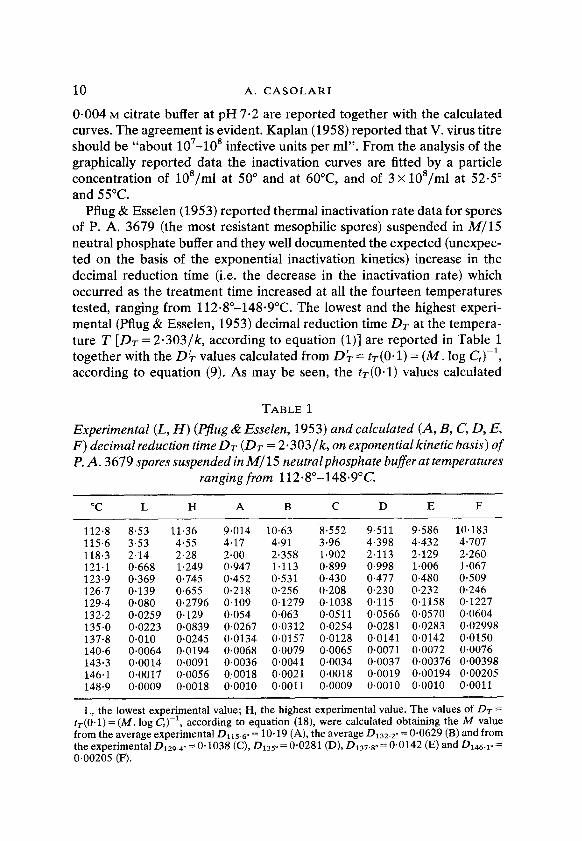
Pflug & Esselen (1953) reported thermal inactivation rate data for spores of P. A. 3679 (the most resistant mesophilic spores) suspended in M/15 neutral phosphate buffer and they well documented the expected (unexpec- ted on the basis of the exponential inactivation kinetics) increase in the decimal reduction time (i.e. the decrease in the inactivation rate) which occurred as the treatment time increased at all the fourteen temperatures tested, ranging from 112.8”-148*9”C. The lowest and the highest experi- mental (Pflug & Esselen, 1953) decimal reduction time Dr at the tempera- ture T [Dr = 2*303/k, according to equation (l)] are reported in Table 1 together with the 0; values calculated from 0; = tr(O.1) = (M. log CO-‘, according to equation (9). As may be seen, the tr(O.1) values calculated
TABLE 1 Experimental (L, H) (mug & Esselen, 1953) and calculated (A, B, C, D, E, F) decimal reduction time DT (DT = 2*303/k, on exponential kinetic basis) of P. A. 3679 spores suspended in M/15 neutralphosphate buffer at temperatures
ranging from 112.8”-148.9”C.
“C L H A B C D E F
112.8 115.6 118.3 121.1 123.9 126.7 129.4 132.2 135.0 137.8 140.6 143.3 146.1 148.9
8.53 3 11.36 9.014 10.63 .8,552 9.511 9.586 10.183 3.53 4.55 4.17 4.91 3.96 4.398 4.432 4.707 2.14 2.28 2.00 2.358 1,902 2.113 2.129 2.260 0.668 1.249 0.947 1.113 0,899 0.998 1.006 1.067 0.369 0.745 0.452 0.531 0.430 0.477 0.480 0.509 0.139 0.655 0.218 0.256 0.208 0.230 0.232 0.246 0.080 0.2796 0.109 0.1279 0.1038 0.115 0.1158 0.1227 0.0259 0.129 0.054 0.063 0.0511 0.0566 0.0570 0.0604 0.0223 0.0839 0.0267 0.0312 0.0254 0.0281 0.0283 0.02998 0.010 0.0245 0.0134 0.0157 0.0128 0.0141 0.0142 0.0150 0.0064 0.0194 0.0068 0.0079 0.0065 0.0071 0.0072 0.0076 0.0014 0.0091 0.0036 0.0041 0.0034 0.0037 0.00376 0.00398 0.0017 0.0056 0:0018 0.0021 0.0018 0.0019 0.00194 0~00205 0*0009 0.0018 0~0010 0.0011 0.0009 0~0010 0~0010 0.0011
L, the lowest experimental value; H, the highest experimental value. The values of DT = tr(O.1) = (M. log c,)-‘, according to equation (18), were calculated obtaining the M value from the average experimental D115.6- = 10.19 (A), the average D132.2a = 0.0629 (B) and from the experimental D129,40 = 0.1038 (C), D i3s0 = 0.0281 (D), D137.80 = 0.0142 (E) and D146.1a = 0.00205 (F).

MICROBIAL KINETICS 11
using any one of the six experimental DT values, to obtain the It4 value required to use the proposed function (9), quite satisfactorily fall within the experimental DT range found at each temperature. On account of the proposed function (9) the following outcomes arise.
(A) SURVIVAL CURVES
As may be seen in Fig. 5, the survival curves that can be obtained at constant temperature are fundamentally concave in semi-log plot. The
Time (mm)
FIG. 5. Theoretical survival curves of different micro-organisms having the following Ed values (kcal mol-l): 34.2 (a), 34.8 (b), 35.2 (c), 35.8 (d), 36-2 (e) and 36.8 (f). Treatment temperature: 80°C.
concavity is more pronounced as the resistance of the microbial species decreases (Fig. 5) or the temperature increases (Fig. 6). The inactivation curves become nearly exponential (i.e. statistically indistinguishable from exponential ones) at temperature T if the resistance of a given organism is very high or very low (Fig. 5), or the treatment temperature is too high or too low for the tested organism (Fig. 6).
12 A. CASOLARI
2 6 IO 14 Time bin)
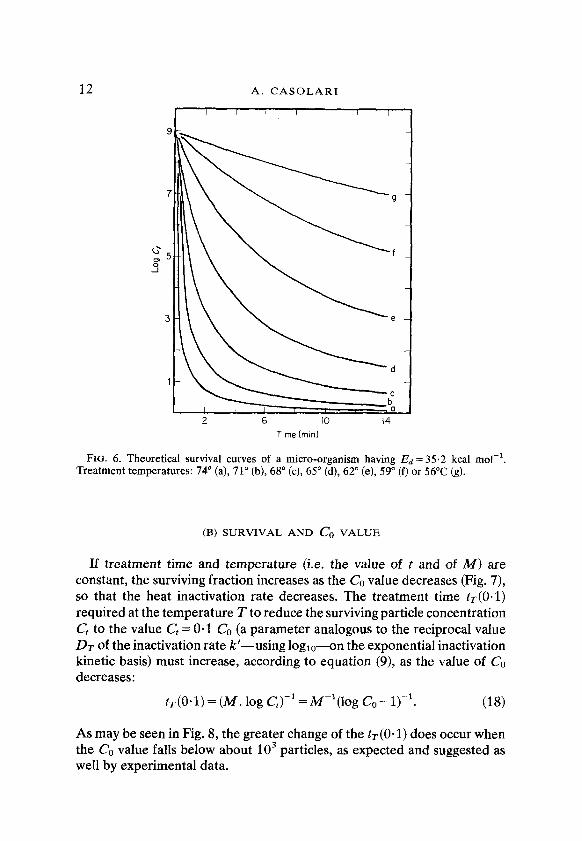
FIG. 6. Theoretical survival curves of a micro-organism having Ed = 35.2 kcal mol-‘. Treatment temperatures: 74” (a), 71” (b), 68” (c), 65“ (d), 62” (e), 59” (f) or 56°C (g).
(B) SURVIVAL AND c, VALUE
If treatment time and temperature (i.e. the value of t and of M) are constant, the surviving fraction increases as the Co value decreases (Fig. 7), so that the heat inactivation rate decreases. The treatment time tr(O.1) required at the temperature T to reduce the surviving particle concentration Ct to the value C, = 0.1 C, (a parameter analogous to the reciprocal vaIue DT of the inactivation rate k’ -using logl,-,-on the exponential inactivation kinetic basis) must increase, according to equation (9), as the value of Co decreases:
fT(O.1) = (M. log c,)-’ =iW(log c,- 1>-‘. (18)
As may be seen in Fig. 8, the greater change of the tT(O.l) does occur when the C0 value falls below about lo3 particles, as expected and suggested as well by experimental data.

MICROBIAL KINETICS 13
I I I I I I I I I 1 3 5 7 9
Time (min)
FIG. 7. Theoretical survival curves of a micro-organism as a function of the initial cell concentration C, = lo9 (a), 10’ (0), lo5 (U), lo3 (0) or lO’/g (m).
(C) THE TAILING PHENOMENON
As shown in the preceding paragraph, the tailing phenomenon does occur, according to the suggested function (9), as a result of the decrease of the inactivation rate occurring at low living particle concentration (both C, and CO). According to the foregoing statements (7, 8), the decrease of the inactivation rate occurring at low particle concentration results from the reduced probability of collision between water molecules having enough energy and biological particles, that happens at low particle concentrations, since the probability of collision P(C) = 1 - C;“, according to (7), neces- sarily decreases as the value of C, falls.
The probability of finding the tailing phenomenon in heat inactivation experiments does lessen both at temperature T if the lethal energy Ed of

14 A. CASOLARI
TV (0.1 min 1
FIG. 8. Theoretical time TV (O-1) required at the temperature T to kill 90% of the cells as a function of both the temperature, ranging from 90°C (a)-76°C (b), and the initial cell concentration Co. Ed = 38 kcal mol-‘.
a given organism is low enough or, what is the same thing, at a given microbial’s Ed if the temperature is high enough, because the probability that very few survivors could grow is very low, as shown afterwards, and it approaches zero as C, approaches 1.
(D) INACTIVATION RATE AND TEMPERATURE
The temperature coefficient Q1o=Kr+lO-/KT is usually employed in chemical kinetics. In microbial heat inactivation studies the temperature coefficient usually employed is z = (lo/log Ql,) and it is obtained plotting log DT against T. According to equation (9), the inactivation rate increases as M value increases; and the latter increases, according to (12), as temperature rises. The exact meaning of the temperature coefficient z or Q1,,, as it comes from the model, is that the reaction rate changes Qlo times each 10 K or 10 times each z deg, because M value changes, according to (12), just Qlo times each 10 K or 10 times each z” Kelvin.

MICROBIAL KINETICS
In fact, the reaction rate at the temperature T, i.e. kk, equals:
[tr(O.l)]-’ = k; = MT. log C,
according to (M), so that:
010 = k;,lolk; = MT+lO/MT
and being:
15
(1%
(20)
and:
Ed = (RTITz In lo)/22 (21)
the relationship:
z = 23*02585/1n Qlo (22)
k;’ . kz = exp [R-l . Ea. (T;’ - T;’ )]
coming from Arrhenius’ equation:
k = A. exp (-EJRT)
(23
(24)
where E, is the activation energy, it can be written:
Ed = (R . Tl . T2. In 10. In Q10)/46*0517. (25)
Then, given Qlo = 100 [i.e. z = 5”, according to (22)] in the temperature range 60” 5 T d 70°C it follows that Ed = 52 304.29788 cal mol-’ according to (25), so that from (12) it will be M700c = 2.62 X lo-**, which is a value Qlo times higher than M600c= 2.62 x 10ez4. Let Qlo = z = 10 and then, from (25), the value of Ed equals 26 152.1489 cal mol.1 so that, according to (12), M60.=c= 5.42 x lOlo which is a value 10 times lower than MTooc= 5.42 x 101’.
(E) LETHAL ENERGY AND PARTICLE’S RESISTANCE
As may be seen from Fig. 5, the value of the lethal energy Ed increases as the resistance of the microbial particle increases.
It is well known that following Arrhenius’ plot of microbial heat inactiva- tion rate on exponential kinetic basis the values of z are clustered around 5°C and 10°C for less heat resistant vegetative particles (viruses, bacterial cells, yeasts and molds) or most heat resistant bacterial spores, respectively (Stumbo, 1973). Therefore, following the classical thermodynamic treat- ment of reaction kinetics, the Arrhenius activation energy E, is close to

16 A. CASOLARI
19, = 101 kcal mol-’ for less resistant micro-organisms (the lethal tempera- ture ranging from 55”-65°C) and close to 68 kcal mole1 for the heat resistant bacterial spores (the lethal temperature ranging from 105°-l15”C), being:
E, = b . In QIO, (26)
where b = 0mlRT1 T2 and T, < T,, according to (23). However, the Arrhenius plot leads to at least two quite unreasonable
outcomes: (i) higher E, values for less resistant than for more resistant particles and (ii), therefore, too high E, values. The first inconsistancy is justified, on the basis of the absolute reaction rate theory, because higher E, values are coupled with higher values of the entropy of activation (AS*) and vice versa, and reactions having higher AS’ are expected to occur with a probability greater than the expected one for reactions having lower AS+, in spite of higher E, values of the former reactions. However, if E, values resulting from the Arrhenius plot are so high that the probability of finding molecules at this level of energy is abnormally low, as obtained from the Maxwell-Boltzmann’s distribution law, then the “compensation law” (i.e. AS’ = b . E, + c, being E, = AH’ if E, >> RT) or Eyring’s equation, which relates the rate constant of the reaction (k) to the AS’, AH+ and E, values and which substantially generates the compensation behaviour (AS’ = T-l . E, + R . In (kNh/RT), where h is Planck’s constant and N Avogadro’s number), it can be quite safely regarded as devoid of any reasonable meaning. The fraction of molecules carrying the above reported activation energies results, according to (lo), about 1O-66 and 10p3’ at 65°C (QI0 = 100) and at 115°C (QIo = 10) respectively, meaning that a single molecule carrying more than 101 kcal mol-l can be expected to occur each about 1O43 mol of reactant (i.e. a mass of hydrogen such the expected one for our galaxy) or a single molecule carrying more than 68 kcal mol-’ each about 1Ol6 mol (i.e. about lo6 ton of microbial particles), respectively.
Such low levels of probability are clearly meaningless referring to the studied phenomena.
On the contrary, according to the proposed model the values of energy that the water molecules must have in order to be lethal are lower for less resistant than for more resistant particles: l/3 and l/2 respectively, of the value expected from Arrhenius’ plot. The Ed value for less resistant particles (viruses, microbial vegetative cells) is close to 36 kcal molF1, while for more heat resistant bacterial spores it is close to 40 kcal mol-‘. According to (lo), the concentration of molecules carrying more than the above reported Ed values ranges from O-04-0.18 at 55” 5 T I 65°C (lower Ed) and from 0.25 to l/g at 105”~ T 5 115°C (higher Ed). Therefore, this outcome can be safely regarded as more reasonable.

MICROBIAL KINETICS 17
(F) HEAT PENETRATION RATE AND ANOMALOUS CURVES
Undoubtedly anomalous survival curves can be obtained in the heat inactivation experiments, when some lag does occur in reaching the treat- ment temperature. These curves can be described according to (9), knowing heat penetration rate data. As can be seen in Fig. 9, the time required to
5 IO 15 20
Time (min)
FIG. 9. Theoretical survival curves that can be obtained when the time required to reach the treatment temperature (9O’C) rises exponentially, from SO”-9O”C, and increases ten times each 12.5” (a), 10” (b), 7.5” (c) or 5°C (d).
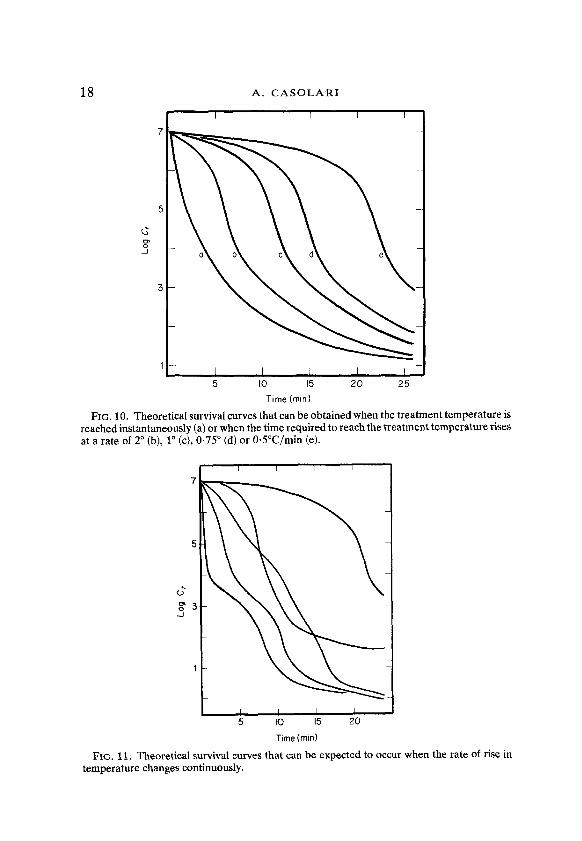
reach the treatment temperature Tt increases exponentially as the survival curve changes from biphasic (a shoulder followed by a linear phase) to sigmoid as the rate with which the time required to reach Tt decreases. Survival curves are expected to be sigmoid when the rate of increase in temperature is constant (Fig. 10). Strongly anomalous survival curves can occur as a function of the residence time at temperature lower than Tt (Fig. 11).
18 A. CASOLARI
7
5
c B A
3
1
I I I I I
I I I I I 5 IO 15 20 25
Time (mln)
FIG. 10. Theoretical survival curves that can be obtained when the treatment temperature is reached instantaneously (a) or when the time required to reach the treatment temperature rises at a rate of 2” (b), 1” (c), 0.75” (d) or O.S”C/min (e).
/ I 1 5 IO 15 20
Time (mm)
FIG. 11. Theoretical survival curves that can be expected to occur when the rate of rise in temperature changes continuously.

MICROBIAL KINETICS 19
(G) HEAT RESISTANCE AND WATER CONTENT OF THE MEDIUM
There is a lot of evidence that heat resistance of biological particles increases as water content of the environment decreases (Murrel & Scott, 1957; Pflug, 1960; Bruch, 1964; Harnulv, Johansson & Snygg, 1977). The suggested model can explain this occurrence. Since A4 value is linked to the amount of water present in the environment, the no value in equation (10) being the number of water molecules held in 18 g of cell suspension, it follows, according to (12) in the form:
M = exp (A -2EJRT), (27)
that the A value decreases, as water content of the medium decreases, according to the function:
A =94.519+4-605 log W, (28)
where 94.519 is the natural logarithm of the squared number of water
TABLE 2
Correspondence among the time t1200C(O-1) required at 120°C to reduce Co = lo2 to C, = lo1 (A), Co = lo4 to C, = lo3 (I?), Co = lo6 to C, = lo5 (C) as a function of the water content in the medium, the equivalent temperature (TE) and the temperature that must be reached (T’) at each level of water content to obtain a value of tT(O*l) equivalent to that found at 120°C i)t fully hydrated
environment, as can be predicted according to the model
Water %
hYC(O.1) A B C TE T’
100 O-2669 0.08896 0.05337 119.999 120~000 80 0.4170 0.13900 0.08339 118.293 121.721 60 0.7413 0.2471 0.1483 116.116 123.962 50 1.0674 0.3558 0.2135 114.748 125.395 40 1.6678 0.5559 0.3336 113.087 127.163 30 2.9649 0.9883 0.5930 110.967 129.467 20 6.6708 2.2236 1.3342 108.018 132.758 10 26.6820 8.8940 5.3364 103.081 138.511
7.5 47.4337 15.8112 9.4867 101.069 140.947 5 106.7226 35.5742 21.3445 98.270 144.430 2.5 426.8684 142.2895 85.3737 93.5797 150.521 1 2667.7467 889.2489 533.5493 87.559 158.852
Ed = 40 kcal mold’. t1200C(0.1) = [log C,. exp (103.7293 - 2EJRT)]-‘. TE = R(103.7293-ln M)-* . 2Ed. T’={R[94.519+4.605 log W-ln (MIzosc)]}-‘. 2Ed. W = water %.

20 A. CASOLARI
molecules per g of medium containing 1% of water and W = g of water/ 100 g of medium. As a result of the equation (28) the value of M decreases as the water content in the environment decreases; and a reduction of M value at the tempe,rature T is equivalent to a drop in the treatment temperature. As a consequence, the heat resistance of the biological particles does increase.
As may be seen in Table 2, a change of ten times in the water content of the substrate is equivalent to a change of about 20°C in the treatment temperature and of about 100 times in the inactivation rate.
In Fig. 12, the experimental inactivation (C,/CO = 10e4) time of Bacillus subtilis spores heated in media having different water content (Harnulv & Snygg, 1972) are shown together with inactivation time calculated according to equations (15), (27) and (28). The Ed value was obtained from the 10m4 survival value reported by quoted authors in fully hydrated 0.1 M phosphate buffer. The Co value was assumed to be lo7 spores per g of medium, the actual Co value being unreported by quoted authors. The agreement between experimental and calculated values of the survival time is evident.
Several observations pointed out very high z values resulting from heat inactivation kinetics carried out in dry environments (Schmidt, 1957). As Fox & Pflug (1968) said: “it is reasonable to believe that cells carried out to high temperatures-in dry environments-lose some water”. If this event
0.4 0.6 0.8 I.0
0.w FIG. 12. Experimental (Harnulv & Snygg, 1972) heat inactivation data (5’ = 10e4 survival
time in min) (0) and theoretical (0) curve for Bacillus sub& spores suspended in glycerol solutions having different water activity (a,). Ed = 39 210.1838 cal mol-‘. Heating tempera- ture, 95°C.

MICROBIAL KINETICS 21
does occur, the water content of both cells and substrate does change following the rise in the treatment temperature, though in very narrow range. It can be calculated that in nearly dry environment a slight decrease of moisture content may cause a dramatical increase of the z value.
In Fig. 13 are reported for instance some high z values calculated according to (27) and coming from the hypothetical round levels of the water content of the substrate, losing water as the temperature rises. As may be seen, the rate of decrease of the inactivation rate increasing temperature, i.e. the z value, coupled with a contemporaneous decrease in the water content in the environment, may be very remarkable.
Temperature PC1
FIG. 13. Theoretical relationship between temperature coefficient z, the number of degrees change in temperature required to achieve a tenfold change in t, (O.l), and hypothetical water content (g/100 g of medium, values typed under symbols) decreasing as temperature rises.
5. Radiation Inactivation Kinetics
Radiation inactivation curves can be represented by a function like (9) in the following form:
co = cPSD, (29)

22 A. CASOLARI
where Cd and Co are the viable cell concentrations after the dose d of radiation and at the beginning of the treatment, respectively. The prob- ability factor D is the squared dose (Mrad) of radiation and S is a sensitivity parameter specific of the microbial particle type.
According to Bruce, Sansone & MacVittie (1969) the content of -SH groups per cell ranges from 1.6 x lo’-2.8 x lo7 and a linear relationship exists between the radiation resistance of the cell and the -SH level per cell. Including the three most radiation resistant bacterial strains, the average content of sulfhydryl groups per cell is about 1.03 x 10⁷.
Letting S = 107/B, where B is the average -SH content per cell type, equation (29) yields all radiation inactivation types of curves, as may be seen in Fig. 14. The radiation inactivation curves change their shape from exponential or nearly exponential to concave or sigmoid in semi-log plot, coming from less resistant to more resistant microbial groups and according to the sulfhydryl group content found by quoted authors in individual
0
-2
F
s” -4 $ -I
-6
-&
1 I.5 2.0 Dose (Mrod)
FIG. 14. Family of theoretical radiation survival curves of micro-organisms having different specific resistance. Numbers refer to the S value (see text).

MICROBIAL KINETICS 23
strains. The tailing is expected to be produced by the lowering of the probability of collision between the radiation induced radicals in water and the biological structures, which occurs lowering the concentration of micro- organisms or increasing the concentration of scavengers in the environment.
Accordingly, the results obtained by Wheaton & Pratt (1961) in a radiation inactivation study and leading to say that “survival of spores of CZ. botulinurn at high dose levels (appearing as a tail on the survivor curves) remains an enigma that deserve further study”, it can be explained by the proposed function (29). As shown in Fig. 15, the height of the tail of the
-8
1 2 3 I I I I
1 2 I
3 I I 1 2 3
Dose (Mradj
FIG. 15. Experimental (Wheaton & Pratt, 1962) (open symbols) and theoretical (0) survival curves of Clostridium botulinurn spores subjected to gamma radiation, obtained (and expected) using 37 x lo3 (A), 43 X lo6 (0) or 37 X lo9 (0) spores/ampule (top, middle and bottom abscissa respectively).
radiation inactivation curves, on the ordinate [log (100 . Cd/C,)], is owing to the concentration of spores employed. As lower the spore concentration used as higher is the level on the ordinate at which very low spore counts are reached, so that the tail occurs at nearly the same spore concentration (about 20 spores in experimental conditions carried out by quoted authors) despite the initial spore level.

24 A. CASOLARI
6. Chemical Inactivation Kinetics
The curves of cell inactivation brought about by chemical compounds can be described, according to (9), by equation:
co= c:+Q’ (30) and
co = CT;+““, (31)
where C, represents the concentration of viable particles after t min from the beginning qf the treatment carried out with the q concentration of a chemical agent; C, is the concentration of surviving particles subjected to different amounts of a chemical agent for a fixed contact time; Q is the squared concentration of the chemical compound; S is a sensitivity parameter specific for the micro-organism under study and the chemical employed.
Using equation (30) and (31) survival curves very like those shown in Fig. 14 can be expected.
7. Cell Growth Kinetics
On the basis of the above described model of collision between water molecules carrying suitable energy (Eu) and the cell, a function able to describe the whole curve of a growing population can be derived. The basic growth curve equation is:
co = c;-u* (32)
where, according to Maxwell’s distribution function:
u = 18-l. no. exp (-EJRT) (33)
is the concentration of water molecules carrying suitable energy, i.e. greater than E,, and t is the time (h) after which the C, cell concentration is reached starting from the Co initial cell concentration.
According to (32) and (33):
log c, = log Co/(1 - ut), (34)
24 = (1 - log Co/log C,)/t, (35)
E, =RT(51.8647-In u), (36)
so that knowing both Co and C, values for a cell held t h in a defined medium at the temperature T, several growth characteristics of the organism can be predicted, as shown afterwards.
MICROBIAL KINETICS 25
(A) COMPARISON BETWEEN THE E, VALUE AND THE ACTIVATION
ENERGY E,
Several attempts were made by several authors to correlate the tempera- ture coefficient ,u, equivalent to the Arrhenius activation energy E,, to the thermal characteristics of the micro-organisms, viz. the psichrophily, mesophily and thermophily.
Hanus & Morita (1968) obtained E, = 16 kcal mol-’ for the psichrophilic vibrib studied; Johnson 8i Lewin (1949), Ingraham (1958), Ng, Ingraham & Marr (1962) obtained E, values ranging from 14-28 kcal mol-l for E. coli; Epstein & Grossowicz (1969) and Ward & Cockson (1972) reported E, values ranging from 13-15 and E, = 20 kcal mol-I, respectively, for the studied strains of Bacillus stearothermophilus.
Thus the classical thermodynamic treatment of growth kinetics does not supply an unambiguous relationship between temperature coefficient and thermal characteristics of the micro-organisms (Shaw, 1967; Hanus & Morita, 1968; Rouf & Brigney, 1971). On the contrary, following the suggested model and using generation times reported by quoted authors, assuming Co = lo7 cells per ml of medium (this type of information lacking steadily in the literature), the E, value results equal to 30.194 kcal mole1 for the Vibrio mar&s MP 1 (the psichrophilic strain), 32.980 kcal for E. coli (the mesophilic strain) and 35.758 kcal mol-’ for B. stearothermophilus (the thermophilic strain).
The E, value so increases as expected from psichrophily to thermophily,
(B) DUPLICATION TIME
At constant temperature the duplication time increases, according to equation (32), as the initial cell concentration decreases. The relation between the duplication time d, and the cell’s concentration reached after the doubling time is the following:
d, = In 2/(u In C,) (37) so that
d, = In 2/(u In 2C0). (38)
The relationship between duplication rate d;’ and Co is thus exponential.
(C) PHYSICO-CHEMICAL FACTORS AFFECTING THE GROWTH RATE
It is well known that several physical and/or chemical factors can affect the growth rate of a population and mostly temperature, toxic compounds,

26 A. CASOLARI
cell density and osmotic pressure. The influence exerted by these factors on the growth kinetics can be described by means of equation (37) modified in such a way as to make it inclusive of the suitable parameters.
(i) Growth rate and temperature
Knowing both Co and C, values observed in defined environmental conditions after the time t at the temperature T, the growth rate at any temperature can be calculated easily taking into account that at any one temperature both molecules carrying useful energy E, and lethal energy Ed are present, above all at the higher temperatures, although in different concentration. Knowing that equation (9) can be written:
c,lc* = c;“’ (39)
and being Co equal to 2C, equation (39) yields the halving time in min
t&m) = In 2/M In C, (40)
so that the halving time in h results,
t&h) = In 2/60M In C,. (41)
Since the dependence of the duplication frequency upon the temperature (7;‘) can be obtained from the difference between the duplication frequency and the halving frequency both at the same temperature T, the duplication time as a function of the temperature results:
q- = In 2/(u In C, - 60M In CO) (42)
the C, value used in equation (41) describing the halving time being equal to the Co value in the duplication time equation. In Fig. 16 the classic experimental data obtained by Ingraham (1958) using E. coli and the calculated values of G-~ are plotted together against the temperature. As can be seen, the calculated duplication times do agree very well with experi- mental ones in spite of the fact that the true C0 value was unreported by the quoted author.
It may be safely expected that at the highest temperature at which the growth of an organism may occur, the duplication time should equal the halving time, that is,
u In C, = 60M In Co, (43)
so that from equations (16), (33) and (43) the highest temperature for growth will be
H=(g) = O.O09(2Ed - EJ - 273.15, (44)
where H=(g) is in degree Celsius.

MICROBIAL KINETICS 21
r
6-
I I I I IO 20 30 40 50
Temperature (“C)
FIG. 16. Experimental (0) (Ingraham, 1958) and theoretical curves describing the relation- ship between duplication time of Escherichia coli and temperature. Theoretical data were obtained using: C, = 104/ml (0) or C, = 106/ml (W); E, = 32.5 kcal mol-’ and Ed = 34 kcal mo1-‘.
(ii) Growth rate as affected by chemical compounds
Many chemical compounds can modify intracellular equilibrium to such an extent as to make very unlikely the expected intermolecular reactions leading to growth. To this class of substances belong certainly organic acids as well as many compounds affecting protein stability and mostly of metabolic origin. It may be safe to believe that the inhibition of growth brought about by these substances does occur when their concentration is so high (=r 10-3~) to overcome both structural and physiological mechanisms working to preserve intracellular concentration and type of solutes. The kinetics of growth inhibition can be described by a function like the proposed one with regard to microbial inactivation by chemical compounds (30), yielding the halving frequency:
t;.‘, = (B2 In C,)/ In 2, (45)
where: B2 is the squared concentration of the active molecule. It follows that

28 A. CASOLARI
the duplication time as a function of the temperature and of an inhibiting chemical compound becomes
7T,c = In 2/[u. In C, - 60 . In C0(B2 +M)]. (46)
Metabolic by-products behave certainly as environmental growth-inhibiting compounds and their active concentration is related to the cell concen- tration, being produced by the cell itself, so that equation (45) would be turned to the following,
ti.‘, = [(L . Ct)2 . In CZJ/ln 2,
where L is the number of metabolic by-products delivered in the environ- ment by each growing cell.
The duplication time as a function of both temperature and metabolic by-products becomes:
q-,L = In 2/{u. In C, - 60 . In C, [M + (LCt)2]}. (48)
The concept of increased toxic metabolic by-products concentration in the environment as a mechanism promoting the inhibition of the cell duplication and finally leading to the stationary and to the death phases of the growth cycle, can allow to describe the entire growth cycle of a population.
Both growth and death curves obtainable using equation (48) are reported for instance in Fig. 17, pertaining tc an organism like E. coli and having E, = 33 kcal mol-‘, Ed = 34.2 kcal mol-’ and L = 1.1 x 10-r’. As can be seen, and as expected, (i) the lag phase increases as the temperature decreases, (ii) the growth rate increases rising the temperature and at temperature to high for the growth to occur, the equation (48) describe only lethal curves; (iii) the higher cell concentration is reached at the optimum temperature (among the tested ones) being lower at higher or sub-optimal temperatures; (iv) the stationary phase is longer at sub-optimal tempera- tures and is shorter at the optimal and higher temperatures; (v) the death rate is greater at higher temperatures.
Since both the stationary and the death phases can be regarded as to be caused by a mechanism of cell poisoning brought about by metabolic by-products, it may be expected that removing the poisonous molecules the cell growth can be restored. Really, Gallup & Gerhardt (1963) were able to do this by dialysis culture. Using appropriate ratio of culture dialysate to dialyzing fluid volume the quoted authors obtained bacterial continuous culture containing the maximum allowable number of cells per g of medium, i.e. about 1012 cells per g. This means that growth was stopped only by want of physical space. The stationary and death phases cannot be eliminated by simple neutralization of molecules expected to be toxic since the toxicity is

MICROBIAL KXNETICS 29
I I I I I I 9- d
I I 20 30 40
Time (h)
FIG. 17. Theoretical growth curves of a micro-organism having E, = 33 kcal mol-’ and Ed=34.2 kcalmol -I, in a medium held at 24” (a), 27” (b), 30” (c), 33” (d), 36” (e), 39” (f), 42” (g), 45” (h), 45.3” (i), 45.5” (1) or 46” (m) and survival curve at 46.2”C (n).
linked to the concentration of the poisonous molecule and can be reversed only by dilution.
Since physico-chemical agents able to kill the cell behave generally and in the first place as damaging agents it may be argued that during the late stationary and in the death phase of the growth cycle the cells become increasingly damaged increasing the length of exposure to the lethal agent, a process leading in the end to the death. Therefore, persisting the environ- mental conditions unfavourable to growth the cell is subjected to the phenomenon of the senescence.
Using equation (48) the concentration of toxic compound(s) under which a growing or stationary cell population cannot experience the senescence can be calculated, after fitting the “L” parameter to some experimental growth data of a organism. For the example shown in Fig. 17 this concen- tration would be about 0.02 g per ml of culture medium; if the main toxic metabolic by-product should be lactic acid, its concentration would be kept below 0.23 M.
As can be expected from equation (48), having the growth curve of a population the same general pattern whatever organism is concerned with

30 A. CASOLARI
few exceptions, it would happen that the senescence should be postponed improving physical and/or physiological by-products removal mechanisms. Similarly the phenomena of cell growth out of control would be repressed by reducing the effectiveness of by-products removal mechanisms.
Therefore, in otherwise suitable environmental conditions the cell growth should be under control of the permeation phenomena, i.e. membrane structures and function.
(iii) Cell growth as affected by available water
The water is essential to the microbial growth. Nevertheless, the water molecules are necessarily involved in hydration structures of the solute molecules and only a fraction is available to the cell. This fraction can be called “free water” in relation to the specific characteristics of the cell type only, or better it is called free water here in these terms only. Usually, the growth ability of the micro-organisms is related to the water activity (a,,,) in the environment. Water activity is linked to the solutes concentration by Raoult’s law:
a, = n,l(n, + ~1, (49)
where IZ,,, and IZ, are the number of moles (or molecules) of the solvent and of the solute respectively. Nevertheless, some deviations from Raoult’s law do occur in practice so that experimental relationship between a, and solute concentration must be preferred. According to Scott’s data (1957) the number of water molecules available to each solute molecule as a function of the experimental a, can be calculated. As can be seen in Fig. 18, the amount of available water molecules per solute ion or molecule decreases as expected, as water activity decreases. At a, = 0.94-0.95 each solute mole- cule or ion, whether sucrose or glycerol or NaCI, may bind not more than about 20 water molecules. This is quite an interesting occurrence since the growth of many organisms cannot occur in substrates having a water activity value lower than these figures. According to Pauling (1959) is just equal to 20 the number of water molecules involved in the pentagonal dodeca- hedron hydration cage.
Let 20 be the number of water molecules bound by each solute molecule or ion and the fraction of the free water (FW) as a function of the a, results, for the mentioned solutes,
FW (NaCl) = (a, -O-95292)/0-4889, (50)
FW (glycerol) = (a, - 0*94986)/0*050, (51)
FW (sucrose) = (a, - 0.93798)/0+06808. (52)

MICROBIAL KINETICS 31
100
00
z
60
z
40
20
0
I-
l. I I I I 1 0.98 0.96 0.94 0.92
FIG. 18. Relationship between water activity (a,) and the expected number of available water molecules (NAWM) per solute ion or molecule. NaCl (A), Sucrose (O), Glycerol (0).
Since the cell is able to utilize free water only, it follows that the IZ~ value in equation (33) equals Avogadro’s number in the usually employed diluted media having a, = 0.999, i.e. having a FW value greater than 0.90. If FW value decreases below this figure the rzo must be decreased proportionally in calculating the u value, so that the latter will decrease as the former decreases. Since a decrease in the u value being no the Avogadro’s number (that is unmodifying water activity) results from a fall in temperature, then rising solute concentration at a constant temperature T will be just like a decrease in temperature in the effects produced on the cell growth. Knowing the fraction of the free water in a solution, the temperature TE equivalent to any selected a, value can be computed easily.
The relationship between u value and free water content of the medium is given by equation:
In u =S-EJRT (53)
where:
S = 51*8647+ln W, (54)
in which W represents the fraction of free water (FW) in the environment. According to (30) and (53) the temperature equivalent TE to a defined
32 A. CASOLARI
fraction of free water beco,mes:
TE=E,/R(51.8647+ln W-hi u), (55)
where u is calculated at the reference temperature T. Given E, = 33 kcal mol-l for instance, equation (55) yields:
TE=34~459+5~071InFW (56)
being the reference temperature T = 35”+273.15 K. It follows that in media having glycerol as the main a, lowering solute and at FW = 0. 1, 0.01 or 0.001 the water activity will be 0.95468, 0.95036 or 0.94991 respec- tively, according to equation (51), and the equivalent temperature will be 22.7826, 11.1062 or -0.5702”C respectively, according to (56). If the reference temperature had been 25°C the corresponding TE values would have been 13.4443”, 2.1386” and -9.1671”C.
This type of correspondence between water activity and temperature was expected by Scott (1957) who said “the effects of water activity on the cell growth are very similar to those produced by reducing the temperature”.
Nevertheless the hydration structure of the solute molecule changes with solute concentration of course, changing the number of solvent molecules available to each solute molecule or ion. Furthermore, hydration structures are disintegrated and reformed with a frequency inversely related to the solute concentration (Frank, 1958), since the water-solute bonds strength increases as the number of water molecules available to each hydration structure falls.
It follows that rising the temperature then the probability of water molecules getting out of hydration structures and hitting the cell ought to decrease. Thus, the lower the a, value at which a cell is able to grow the lower the collision frequency that this type of cell is able to utilize properly for intermolecular reactions.
The apparent relationship between the fraction of free water or the water activity and the hydration structures, the collision frequency, the tempera- ture, it seems to suggest that each type of cell should have a defined range of collision frequency with solvent molecules out of which is unable to grow. This concept might perhaps be very useful in explaining the existence of a lower limiting temperature at which the growth does not occur. Moreover, at temperatures low enough, although the concentration of water molecules carrying useful enery differs always from zero, the ensuing collision frequency would be too low to become entirely useless to biological organized activity.
Several authors obtained different lower limiting a, values for microbial growth as a function of the main a,- lowering solute employed (Onishi,

MICROBIAL KINETICS 33
1963; Kushner, 1971; Christian, 1978). The relation between the a, value at which no more free water does occur, as a function of the number of water molecules involved in the hydration structure of different types of solutes, can be calculated. If the lowest suitable frequency of collision is linked, for a given micro-organism, to the flickering frequency of the pentagonal dode- cahedron, the lowest a, value for growth would be about 0.95 in media in which the water activity is lowered mainly by addition of glycerol; it would be O-938 in media containing sucrose or 0.953 in those containing NaCl as main a,-lowering solute. If the limiting frequency is linked to the flickering frequency of the hydration structure made up by eight water molecules, as perhaps do occur for Staphylococcus aureus, the lowest water activity value for the growth to occur would be 0.875, 0.879 or 0.836 whether glycerol, NaCl or sucrose are used respectively as main a,-lowering solutes. These values are just the experimental ones obtained for S. uureus (Campanini, 1978; Leistner & Rodel, 1978).
Knowing exactly, i.e. with four decimals, the limiting water activity it would be possible to calculate the limiting temperature for the growth of any given organism, and vice versa. As a matter of fact, since the lowest temperature at which S. aweelks is expected to grow is about 5°C (Farrell & Upton, 1978) it comes that FW = 0,003 so that the lowest water activity value allowing growth of this organism would be 0*8752,0*8799 or O-8364 in glycerol, NaCl or sucrose containing media, respectively.
8. Conclusion
The presented model provides the description of some microbiological phenomena of quite great relevance as non-exponential heat, radiation and chemical inactivation kinetics (as well as exponential kinetics) and the complete curve of growing populations as affected by water, temperature and chemicals. The connection between the accepted paramount importance of water in biological phenomena and the basic water-cell interaction mechanism suggested, perhaps can be an interesting premise, leading to believe that the model may be a useful tool in gaining a better insight into some biological phenomena.
REFERENCES
ATWOOD, K. C. & NORMAN, A. (1949). Proc. natn. Acad. Sci. U.S.A. 35,696. BALL, C. 0. & OLSON, F. C. W. (1957). Sterilization in Food Technology, London: McGraw-
Hill. BROWN, M. R. W. & MELLING, J. (1971). In Inhibition and Destruction of the Microbial Cell
(W. B. Hugo, ed.). London: Academic Press.

34 A. CASOLARI
BRUCE, A. K., SANSONE, P. A. & MACVI~IE, T. J. (1969). Radiat. Res. 38,95. BRUCH, C. W. (1964). In Life Sciences and Space Research (M. Florkinand & A. Dolltun, eds),
p. 2. New York: John Wilev & Sons. BUSTA, F. F. & JEZESKI, J. J. (1963). Appl. Microbial. 11,404. CAMPANINI, M. (1978). In FoodMicrobiology and Technology (B. Jarvis, J. H. B. Christian &
H. D. Michener, eds). Parma: Med. Viva Serv. Cong. CASOLARI, A. (1974). Proc. IVInt. Congress Food Sci. and Technol. III, 86. CASOLARI, A. & CASTELVETRI, F. (1977). Ind. Cons., Parma 52, 105. CERF, 0. (1977). J. appl. Bact. 42, 1. CHRISTIAN, J. H. B. (1978). In Food Microbiology and Technology (cited). EPSTEIN, I. & GROSSOWIU, N. (1969). J. Bacterial. 99,414. FARRELL, G. M. & UPTON, M. E. (1978). J. Fd. Technol. 13, 15. Fox, K. & PFLUG, I. J. (1968). Appl. Microbial. 16,343. FRANK, H. S. (1958). Proc. Roy. Sot. 24lA, 481. GALLUP, D. M. & GERHARDT, P. (1963). Appl. Microbial. 11,506. HAN, Y. W., ZHANG, H. I. & KOCHTA, J. M. (1976). Can. J. Microbial. 22, 295. HANUS, F. J. & MORITA, R. Y. (1968). .I. Bacterial. 95, 736. HARNULV, B. G. & SNYGG, B. G. (1972). J. appl. Bact. 35,615. HARNULV, B. G., JOHANSSON, M. & SNYGG, B. G. (1977). J. Fd. Sci. 42,91. HIA-IT, C. W. (1964). Bact. Rev. 28, 150. INGRAHAM, J. L. (1958). J. Bacterial. 76,75. JOHNSON, F. H. & LEWIN, J. (1946). J. Cell. camp. Physiol. 28, 47. JORDAN, R. C. & JACOBS, G. E. (1944). J. Hyg., Camb. 43,275. KAPLAN, C. (1958). J. gen. Microbial. 18, 58. KEMPE, L. L., GRAIKOSKI, J. T. & GILLIS, R. A. (1954). Appl. Microbial. 2,330. KUSHNER, D. J. (1971). In Inhibition and Destruction of the Microbial Cell (W. B. Hugo, ed.).
London: Academic Press. LEA, D. E. (1955). Actions of Radiations on Living Ceils, 2nd edn. Cambridge: University
Press. LEISTNER, L. & RODEL, W. (1978). In Food Microbiology and Technology (cited). MOATS, W. A., DABBAH, R. & EDWARDS, V. M. (1971). J. Fd. Sci. 36,523. MURRELL, W. G. & Scorr, W. J. (1957). Nature 179,481. NG, H., INGRAHAM, J. L. & MARR, A. G. (1962). J. Bacterial. 84,331 ONISHI, H. (1963). Ado. Fd. Res. 7, 83. PAULING, L. (1958). In Hydrogen Bonding (D. Hadzi, ed.). London: Pergamon. PFLUG, I. J. & ESSELEN, W. B (1953). Fd. Technol. 7,237. PFLUG, I. J. (1960). Fd. Technol. 14,483. ROUF, M. A. & RIGNEY, M. M. (1971). Appl. Microbial. 22, 503. SCHMIDT, C. F. (1957). In Antiseptics, Disinfectants, Fungicides and Sterilization (G. F.
Reddish, ed.). Philadelphia: Lea & Febiger. SCOTT, W. J. (1957). Adv. Fd. Res. 7, 83. SHARPE, K. & BEKTASH, R. M. (1977). Can. J. Microbial. 23, 1501. SHAW, M. K. (1967). J. Bacterial. 93, 1332. SOGIN, G. J. & ORDAL, Z. J. (1967). J. Bacterial. 94, 1082. STUMBO, C. R. (1973). Thermobacteriology in Food Processing, 2nd edn. New York: Academic
Press. VAS, K. & PROSZT, G. (1957). .T. appl. Bact. 20,431. WARD, J. & COCKSON, A. (1972). J. Bacterial. 112, 1040. WHEATON, E. & PRATT, G. B. (1962). J. Fd. Sci. 27,327. WHITE, J. (1953). J. Inst. Brewing 59,470. WITHELL, E. R. (1942). J. Hyg. 42, 124.. WOOD, T. H. (1956). Adv. Biol. Med. Phys. 4, 119. ZIMMER, K. G. (1961). In Studies on Quantitative Radiation Biology, Edinburgh: Oliver &
Boyd.