a model for regulation by syngap-a1 of binding of synaptic...
TRANSCRIPT

*For correspondence:
Competing interest: See
page 28
Funding: See page 28
Received: 08 April 2016
Accepted: 09 September 2016
Published: 13 September 2016
Reviewing editor: Leslie C
Griffith, Brandeis University,
United States
Copyright Walkup et al. This
article is distributed under the
terms of the Creative Commons
Attribution License, which
permits unrestricted use and
redistribution provided that the
original author and source are
credited.
A model for regulation by SynGAP-a1 ofbinding of synaptic proteins to PDZ-domain ’Slots’ in the postsynaptic densityWard G Walkup IV1, Tara L Mastro1, Leslie T Schenker1, Jost Vielmetter2,Rebecca Hu1, Ariella Iancu1, Meera Reghunathan1, Barry Dylan Bannon1,Mary B Kennedy1*
1Division of Biology and Biological Engineering, California Institute of Technology,Pasadena, United States; 2Beckman Institute Protein Expression Center, CaliforniaInstitute of Technology, Pasadena, United States
Abstract SynGAP is a Ras/Rap GTPase-activating protein (GAP) that is a major constituent of
postsynaptic densities (PSDs) from mammalian forebrain. Its a1 isoform binds to all three PDZ
(PSD-95, Discs-large, ZO-1) domains of PSD-95, the principal PSD scaffold, and can occupy as many
as 15% of these PDZ domains. We present evidence that synGAP-a1 regulates the composition of
the PSD by restricting binding to the PDZ domains of PSD-95. We show that phosphorylation by
Ca2+/calmodulin-dependent protein kinase II (CaMKII) and Polo-like kinase-2 (PLK2) decreases its
affinity for the PDZ domains by several fold, which would free PDZ domains for occupancy by other
proteins. Finally, we show that three critical postsynaptic signaling proteins that bind to the PDZ
domains of PSD-95 are present in higher concentration in PSDs isolated from mice with a
heterozygous deletion of synGAP.
DOI: 10.7554/eLife.16813.001
IntroductionWe propose a new model for regulation of trapping of AMPARs and other synaptic proteins in ’slots’
at the postsynaptic membrane. Numerous experiments have shown that AMPARs become immobi-
lized at the postsynaptic membrane by a three stage process involving insertion of receptors into
the perisynaptic membrane, diffusion into the synapse and ’trapping’ within the structure of the
postsynaptic density (PSD; Opazo and Choquet, 2011). The sites at which the receptors are trapped
have been referred to as ’slots,’ (Shi et al., 2001) and they are believed to consist principally of PDZ
domains on PSD-95 (Opazo et al., 2012). Phosphorylation by CaMKII of TARPs (Transmembrane
AMPAR Regulatory Proteins; Bredt and Nicoll, 2003) increases their affinity for PDZ domains of
PSD-95 suggesting that the phosphorylation may promote trapping of new AMPARs in the PSD
(Tomita et al., 2005; Opazo et al., 2010). Indeed the PDZ domains of PSD-95 act as docking sites
for several synaptic regulatory proteins (Figures 1 and 2B); including NMDA-type glutamate recep-
tors (NMDARs; Kornau et al., 1995), as well as neuroligins (Varoqueaux et al., 2006) and LRRTMs
(Leucine Rich Repeat TransMembrane proteins; Linhoff et al., 2009), which nucleate new synapse
formation and contribute to clustering of AMPARs (Siddiqui et al., 2010). AMPARs, NMDARs,
TARPs, LRRTMs, and neuroligins comprise the most highly enriched transmembrane proteins precip-
itated together with PSD-95 from the PSD fraction of mouse forebrain (Dosemeci et al., 2007).The
multiplicity of PDZ binding proteins at the synapse raises the question of whether and how competi-
tion for binding to the PDZ domains is regulated at individual synapses.
SynGAP, a postsynaptic GTPase activating protein, is unusually abundant in the PSD scaffold.
One prominent alternatively spliced isoform, synGAP-a1 (Li et al., 2001) contains a PDZ-domain
Walkup et al. eLife 2016;5:e16813. DOI: 10.7554/eLife.16813 1 of 31
RESEARCH ARTICLE

ligand and binds to all three of the PDZ domains of PSD-95 (Kim et al., 1998; Figures 1, 2). Here
we propose that association of synGAP-a1 with PDZ domains of PSD-95 contributes to regulation of
docking of AMPARs within the PSD and, therefore, to regulation of its overall protein composition.
This function is distinct from its function as a Ras/Rap GAP (Walkup et al., 2015). We support this
hypothesis by showing that phosphorylation by at least two protein kinases on several sites in the
regulatory region of synGAP-a1 reduces the affinity of synGAP-a1’s PDZ-ligand for the three PDZ
domains of PSD-95. One of these protein kinases is CaMKII, which is activated when synaptic plastic-
ity is initiated by activation of NMDA-type glutamate receptors (NMDARs). The other is PLK2, a con-
stitutively active kinase that is induced by neuronal activity and mediates homeostatic scaling
(Seeburg et al., 2005). We further show that binding of Ca2+/CaM to synGAP-a1 selectively reduces
its affinity for PDZ3 of PSD-95. Finally, we show that reduction of the total amount of synGAP in het-
erozygous knockout mice alters the composition of PSDs in the mutant mice in a way that is most
directly explained by reduced competition from synGAP-a1 for binding to PDZ domains of PSD-95.
The PSD is an organized complex of signaling proteins attached to the postsynaptic membrane
of excitatory glutamatergic synapses in the central nervous system. It comprises a network of scaf-
fold proteins, the most prominent of which is PSD-95, a member of the MAGUK family (Membrane-
Associated GUanylate Kinase-like proteins) (Kennedy, 2000; Sheng and Kim, 2011). An average
PSD (~360 nm in diameter) is estimated to contain ~300 molecules of PSD-95 with 900 PDZ domains
(Chen et al., 2005; Sugiyama et al., 2005). SynGAP is nearly as abundant in the PSD as PSD-95
itself (Chen et al., 1998; Cheng et al., 2006; Dosemeci et al., 2007). It is expressed as several iso-
forms with four different C-termini, a1, a2, b, and g (Li et al., 2001; McMahon et al., 2012).The a1-
containing isoforms are abundantly expressed at synapses and contain the PDZ ligand. Assuming
that a1 isoforms make up 30–50% of the total synaptic synGAP, and that one synGAP-a1 molecule
can bind to any one of the three PDZ domains in each molecule of PSD-95, synGAP-a1 could occupy
eLife digest The formation of memories is believed to depend on the strengthening of
connections, called synapses, between neurons in the brain. When neurons are activated together,
their synaptic connections become permanently strengthened to record the memory. This
strengthening is called activity-dependent long-term potentiation.
As long-term potentiation develops, more protein receptors are added to the receiving side of
the synapse. This allows the receiving neuron to produce a larger electrical response to the signaling
chemicals it receives from the neuron on the sending side of the synapse. The addition of receptors
is regulated by a set of enzymes held near the membrane of the synapse by a protein scaffold
known as the postsynaptic density.
A major scaffold protein called PSD-95 contains binding sites, known as PDZ domains, that hold
protein receptors and regulatory enzymes in place. One regulatory enzyme called synGAP is present
in large numbers in the postsynaptic density and binds to the same PDZ domains as the receptors.
Humans that have just one copy (instead of the usual two) of the gene that encodes synGAP have
cognitive disabilities that are often accompanied by autism and epilepsy.
By studying purified proteins, Walkup et al. found that adding phosphate groups to synGAP
reduces the enzyme’s ability to bind to the PDZ domains. This reduced binding ability could make
more PDZ domains available to bind to protein receptors and hold them at the synapse.
To measure the effect of reduced synGAP levels on the proteins found at postsynaptic densities,
Walkup et al. used mice that had just one copy of the synGAP gene in their neurons. These mice
have less synGAP in their postsynaptic densities and more of three proteins that bind to PDZ
domains. These proteins hold receptors in the synapse and help synapses to form. Thus, synGAP
may restrict the binding of other proteins to the PDZ domains in order to regulate the strength of
the synapse.
Further experiments are now needed to investigate the importance of restriction by synGAP of
binding to PDZ domains under a variety of circumstances in which the activity of neurons alters the
strength of synapses.
DOI: 10.7554/eLife.16813.002
Walkup et al. eLife 2016;5:e16813. DOI: 10.7554/eLife.16813 2 of 31
Research article Biochemistry Neuroscience
10–15% of the PDZ domains of PSD-95 in an average PSD. Thus, it could help to regulate the size
and strength of the synapse by limiting the availability of ’slots’ that can bind AMPAR complexes
(Hayashi et al., 2000; Shi et al., 2001; Opazo et al., 2012). This proposed function could explain its
unusually high abundance in the PSD which, until now, has been mysterious (Chen et al., 1998;
Sheng and Hoogenraad, 2007).
It has been proposed that, in general, PDZ domains act as flexible protein interaction points that
can be modified to support changes in cytoplasmic organization (Kurakin et al., 2007). Complexes
formed by PDZ domain interactions are examples of linked, multiple equilibria, the stable configura-
tions of which are determined by the concentrations of each component and by their affinities for
the relevant PDZ domains. Evidence has indicated that PSD-95 protein complexes exist in dynamic
equilibrium permitting continual turnover and potential rearrangement of their composition
(Sturgill et al., 2009; Schapitz et al., 2010). Because synGAP-a1 is an abundant protein in the PSD
with a relatively high affinity for all three PDZ domains of PSD-95, reduction of its affinity after
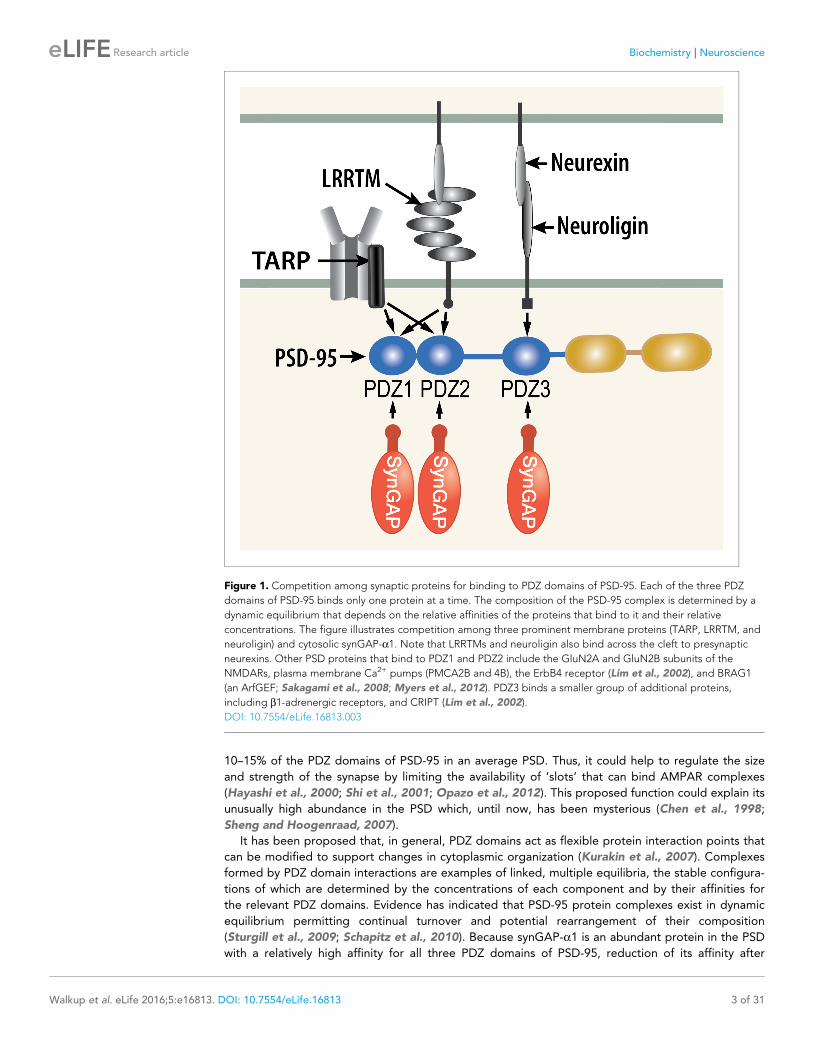
Figure 1. Competition among synaptic proteins for binding to PDZ domains of PSD-95. Each of the three PDZ
domains of PSD-95 binds only one protein at a time. The composition of the PSD-95 complex is determined by a
dynamic equilibrium that depends on the relative affinities of the proteins that bind to it and their relative
concentrations. The figure illustrates competition among three prominent membrane proteins (TARP, LRRTM, and
neuroligin) and cytosolic synGAP-a1. Note that LRRTMs and neuroligin also bind across the cleft to presynaptic
neurexins. Other PSD proteins that bind to PDZ1 and PDZ2 include the GluN2A and GluN2B subunits of the
NMDARs, plasma membrane Ca2+ pumps (PMCA2B and 4B), the ErbB4 receptor (Lim et al., 2002), and BRAG1
(an ArfGEF; Sakagami et al., 2008; Myers et al., 2012). PDZ3 binds a smaller group of additional proteins,
including b1-adrenergic receptors, and CRIPT (Lim et al., 2002).
DOI: 10.7554/eLife.16813.003
Walkup et al. eLife 2016;5:e16813. DOI: 10.7554/eLife.16813 3 of 31
Research article Biochemistry Neuroscience

phosphorylation will allow other components to compete more effectively for binding; thus, the
composition of the PSD-95 complex will shift to a new equilibrium.
This proposed mechanism can account for many previous experimental observations. For exam-
ple, two other groups used imaging to show that phosphorylation by CaMKII in living neurons trig-
gers movement of synGAP away from the PSD (Yang et al., 2013; Araki et al., 2015). In the Araki
study, the authors suggested that phosphorylation of synGAP results in ’dispersion’ of synGAP away
from the PSD and therefore has the effect of upregulating Ras near the PSD. We propose here that
an additional important consequence of the decrease in binding of synGAP to the PDZ domains of
PSD-95 is readjustment of the composition of the PSD resulting from increased availability of the
PDZ domains of PSD-95. Indeed, the dynamics of movements of synGAP and AMPARs visualized in
living neurons following synaptic stimulation are consistent with this hypothesis. Activation of
NMDARs and CaMKII causes dispersal of synGAP away from the PSD within a few minutes
(Yang et al., 2013; Araki et al., 2015). The same stimuli produce an equally rapid increase in the
rate of trapping of AMPARs at synaptic sites (Makino and Malinow, 2009; Opazo et al., 2010;
Opazo et al., 2012). Thus, the rates of these two processes, observed in living neurons, are compat-
ible with the notion that reduced binding of synGAP to PSD-95 during induction of LTP opens up
binding slots for AMPAR complexes. Dispersal of synGAP away from the postsynaptic membrane
would be expected to result in increased activation of Ras and Rap, which would lead to increases in
the rates of exocytosis and/or endocytosis of AMPARs, respectively (Zhu et al., 2002). However,
experiments show that increased exocytosis of AMPARs does not contribute to their increased trap-
ping in the minutes following synaptic stimulation (Makino and Malinow, 2009). Instead, exocytosis
replenishes surface AMPARs in the dendrite and perisynaptic spine membrane, and this process
occurs with a slower time course than enhanced trapping.
An additional example of a previous result that is explained by this model, is the observation that
absence of synGAP in hippocampal neurons cultured from synGAP KO fetuses leads to accelerated
(’precocious’) maturation of spines, including early movement of PSD-95 into spine heads, and ulti-
mately larger clusters of PSD-95 in individual synapses compared to wt neurons (Vazquez et al.,
2004). In this study, expression of wt-synGAP-a1 in the mutant neurons rescued all of these pheno-
types; however, expression of synGAP-a1 with a deletion of the five residue PDZ ligand (DSXV) failed
to rescue any of the effects of synGAP deficiency on precocious maturation of spines. In fact,
Figure 2. Domain diagrams of synGAP-a1 and PSD-95. (A) SynGAP-a1. The N-terminus of r-synGAP-a1 is indicated, as are the locations of the major
sites phosphorylated by CaMKII (black), CDK5 (green) (Walkup et al., 2015), and PLK2 (blue) (Walkup IV et al.; Lee et al., 2011), most of which are in
the ’disordered domain.’ ’MPD’ indicates a region in which several nearby serines (808, 810, 821, 825, and 827)are phosphorylated by both CaMKII and
PLK2. Numbering is based on rat isoform synGAP A1-a1. For comparison, phosphorylation sites identified in Lee et al., (2011) were numbered
according to the B isoform and can be compared to ours by subtracting 44 residues from our numbering. Phosphorylation sites identified in
Araki et al., (2015) were numbered according to the A isoform and can be compared to ours by adding 15 residues to our numbering. The 5 residue
PDZ ligand is located at the C-terminus. (B) PSD-95. The five major domains of PSD-95, including the approximate relationships of its three N-terminal
PDZ domains are indicated (Cho et al., 1992).
DOI: 10.7554/eLife.16813.004
Walkup et al. eLife 2016;5:e16813. DOI: 10.7554/eLife.16813 4 of 31
Research article Biochemistry Neuroscience

expression of synGAPDSXV caused an increase in the size of clusters of PSD-95 in spines compared
to wt neurons. This failure to rescue the phenotypes was not a result of mislocalization of synGAP-a
1; synGAPDSXV localized like wt-synGAP-a1 to developing spine heads. Instead, the data are consis-
tent with the idea that synGAP-a1 normally competes with several proteins for binding to the PDZ
domains of PSD-95, and thus limits the size of clusters of PSD-95 and its associated proteins, as well
as their movement into spine heads (Vazquez et al., 2004).
Yet another result supporting the model is the finding of McMahon et al. (2012) that the a1 and
a2 isoforms have markedly different effects on synaptic strength when expressed in primary cultures
of forebrain neurons. For example, 12 to 36 hr after transfection of the neurons with the A1a1 iso-
form of synGAP, 73% of the neurons were ’silent’, that is, had no miniature end-plate potentials
(mEPSCs), compared with 11% of control neurons. In contrast, transfection with the A1a2 isoform,
which differs from a1 only in its C-terminal 48 residues and lacks a PDZ ligand, had no effect on the
proportion of silent neurons, which remained at 11%. Like Vazquez et al., (2004), they found that
the differential effect did not arise from mislocalization of the A1a2 isoform. Both isoforms of syn-
GAP localized normally to dendrites and spines. The most straightforward explanation of this result
is consistent with our hypothesis, which predicts that overexpression of the synGAP-a1 isoform bear-
ing the PDZ ligand restricts binding of AMPAR auxiliary proteins to PDZ domains and thus interfers
with their localization to the synaptic site.
Neurons cultured from synGAP deficient mice have been reported by several groups to have a
higher average number of AMPARs at their synapses than wt neurons (Kim et al., 2003;
Vazquez et al., 2004; Rumbaugh et al., 2006). The data presented here suggests that the increase
in AMPARs in Syngap+/- mice may be a direct result of increased binding of TARPs and LRRTMs to
PDZ domains that are made available by the reduced amount of synGAP (Tomita et al., 2005;
de Wit et al., 2009).
Finally, our proposed model and supporting results may help to explain the mechanism underly-
ing a form of developmental intellectual disability (ID) resulting from synGAP haploinsufficiency.
Mutations in a single copy of synGAP have been causally implicated in sporadic cases of non-syn-
dromic ID, often associated with either autism (ASD) or epilepsy (Berryer et al., 2013). The fre-
quency of developmental ID worldwide is estimated at 1 to 3%, and 25 to 50% of cases are
sporadic, meaning that the parents are not affected. Although data is still sparse, mutations causing
SynGAP haploinsufficiency appear to account for 2–9% of sporadic cases (Hamdan et al., 2011;
Berryer et al., 2013), suggesting that its prevalence in the population could be as high as 0.03–
0.1% and placing it in the same range of frequency as Fragile-X syndrome. The amount of synGAP in
the brains of mice with synGAP haploinsufficiency is reduced by 50% (Vazquez et al., 2004). We
show here that this reduction leads to a shift in the composition of the PSD scaffold, apparently
resulting from the decrease in synGAP’s ability to compete for binding to PDZ domains of PSD-95.
This derangement is likely a significant factor in the human pathology leading to ID, ASD, and
epilepsy.
Results
Phosphorylation of r-synGAP-a1 by CaMKII and PLK2 reduces itsbinding to PDZ domains of PSD-95SynGAP-a1 can be expressed in bacteria and purified in a soluble form by deleting the first 102 resi-
dues of its N-terminus (Walkup et al., 2015). This version of synGAP, termed r-synGAP-a1, retains
all of the identified functional domains, the regulatory domain, and the C-terminal PDZ ligand
(Figure 2A). In a previous study we showed that r-synGAP-a1 is phosphorylated by CaMKII at sev-
eral residues including S1283, which is 7 residues upstream of the PDZ domain ligand located at resi-
dues 1290–1293 (Walkup et al., 2015). Because this phosphorylation site is so near the PDZ ligand,
we wondered whether its phosphorylation, or phosphorylation of other sites by CaMKII, would inter-
fere with binding of synGAP-a1 to PDZ domains of PSD-95. To test this, we incubated r-synGAP-a1
with affinity resins substituted with recombinant PDZ domains as described under Materials and
methods. The beads contained PDZ1, PDZ2, PDZ3, a fragment containing PDZ1 and PDZ2 (PDZ12),
or a fragment containing all three PDZ domains (PDZ123) (Figure 3—figure supplement 1;
Walkup and Kennedy, 2014). Binding of r-synGAP-a1 to the beads was tested with or without a
Walkup et al. eLife 2016;5:e16813. DOI: 10.7554/eLife.16813 5 of 31
Research article Biochemistry Neuroscience

Figure 3. Phosphorylation by CaMKII regulates association of r-synGAP-a1 with PDZ domains of PSD-95. (A) Association of r-synGAP-a1 with PDZ
domains of PSD-95 before and after phosphorylation by CaMKII. R-synGAP-a1 was incubated in a phosphorylation mix for 10 min with either 0 CaMKII
and 0 Ca2+/CaM (control) or 10 nM CaMKII and 0.7 mM CaCl2 /3.4 mM CaM (+ CaMKII) before binding to PDZ domain resins for 60 min at 25˚C, asdescribed under ’Materials and methods.’ There is no detectable binding of synGAP to unsubstituted resin, and no detectable non-specific binding of
proteins to the PDZ resins under these conditions (Walkup and Kennedy, 2014). (B) Both Ca2+/CaM and CaMKII are required in the phosphorylation
reaction to reduce binding of r-synGAP-a1 to PDZ123 resin. R-synGAP-a1 was incubated in the phosphorylation reaction without either Ca2+/CaM or
CaMKII or with both before binding to PDZ resin. The final bar shows that phosphorylation of the PDZ123 domain resin itself doesn’t alter binding of
r-synGAP-a1. PDZ123 domain affinity resin was phosphorylated for 60 min in the presence of CaMKII and 0.7 mM CaCl2/3.4 mM CaM before incubation
with control r-synGAP (500 nM) for 60 min at 25˚C. (C) Stoichiometry of phosphorylation of r-synGAP-a1 by CaMKII. R-synGAP-a1 (725 nM) was
phosphorylated in the presence of CaMKII (10 nM), as described under ’Materials and methods.’ At the indicated times, reactions were quenched by
addition of 3x Laemmli sample buffer. Radiolabeled r-synGAP-a1 was isolated by SDS-PAGE and quantified as described under ’Materials and
methods.’ (D) Change in affinity of r-synGAP-a1 for PDZ123 after phosphorylation by CaMKII for times corresponding to those measured in C.
R-synGAP-a1 was phosphorylated for 0.5 to 10 min as described in C before incubation with PDZ123 domain affinity resin for 60 min as described
under ’Materials and methods.’ Control (-CaMKII, -Ca2+/CaM) is r-synGAP-a1 incubated in the phosphorylation reaction in the absence of CaMKII and
Figure 3 continued on next page
Walkup et al. eLife 2016;5:e16813. DOI: 10.7554/eLife.16813 6 of 31
Research article Biochemistry Neuroscience

prior 10 min phosphorylation by CaMKII. As expected, without phosphorylation, r-synGAP-a1 binds
specifically to each of the three PDZ domains (Figure 3A). In this assay, its binding is highest to
PDZ3. Binding of r-synGAP-a1 to PDZ123 reveals a substantial avidity effect; that is, the amount
bound per individual PDZ domain is twice that bound to PDZ3 alone and four times that bound to
either PDZ1 or PDZ2 alone.
Phosphorylation by CaMKII reduces binding of r-synGAP-a1 to all of the individual PDZ domains
and to PDZ12 and PDZ123 (Figure 3A). The reduction in binding requires the presence of both
Ca2+/CaM and CaMKII in the phosphorylation reaction mixture (Figure 3B). The fourth bar of
Figure 3B shows that the reduction in binding is not caused by phosphorylation of PDZ domains on
the column by residual CaMKII. We have shown previously that as many as 10 sites on r-synGAP-a1
are phosphorylated by CaMKII (Walkup et al., 2015). Approximately 5 of these, including site
S1123, are fully phosphorylated after an 0.5 min reaction (Walkup et al., 2015 and Figure 3C). To
test whether the reduction in binding depends primarily on phosphorylation of the rapidly phosphor-
ylated sites or requires phosphorylation of most of the sites, we tested binding of r-synGAP-a1 to
PDZ123 after phosphorylation for various times (Figure 3D). The reduction in binding is maximal
after 0.5 min, indicating that phosphorylation of the more rapidly phosphorylated sites is sufficient
for full reduction of affinity.
R-synGAP-a1 can also be phosphorylated by CDK5 (Walkup et al., 2015) and by PLK2
(Lee et al., 2011) both of which increase its RasGAP activity. We tested the effect of 10 min of phos-
phorylation by each of these kinases on affinity of r-synGAP-a1 for PDZ123. Phosphorylation by
CDK5 had no significant effect on affinity; whereas, phosphorylation by PLK2 decreased its affinity
by ~40%, less strongly than does phosphorylation by CaMKII (Figure 3E). Both CaMKII and PLK2 can
phosphorylate several sites in a region marked MPD (multiple-phosphorylation domain) in
Figure 2A, including serines at 808, 810, 821, 825, and 827 (Walkup et al., 2015; Walkup et al., in
preperation). This result means that phosphorylation of multiple sites at various locations in the regu-
latory region can decrease binding of r-synGAP-a1 to PDZ domains, but to varying degrees.
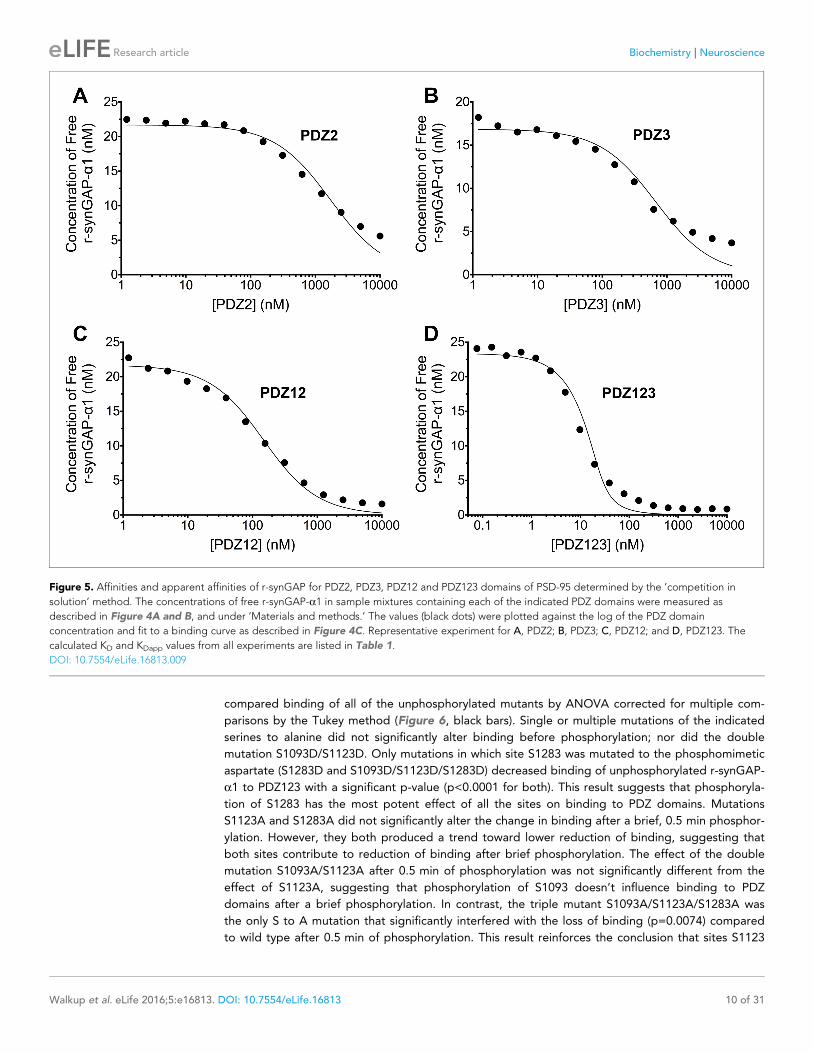
Affinity of r-synGAP-a1 for the PDZ domains of PSD-95 determined bysurface plasmon resonance (SPR)The three PDZ domains of PSD-95 are located in the N-terminal half of the protein from residues 61
to 402. The first two PDZ domains are separated by 4 residues and the third is 53 residues down-
stream. We determined the affinities of r-synGAP-a1 for individual PDZ domains, for PDZ12 (resi-
dues 61–249) and for PDZ123 (residues 61–402) by a competition assay in which SPR is used to
detect the amount of free r-synGAP-a1 in solutions containing a constant amount of r-synGAP-a1
and varying amounts of recombinant PDZ domains (Nieba et al., 1996; Lazar et al., 2006;
Abdiche et al., 2008). To detect the free r-synGAP-a1, recombinant PDZ domains are immobilized
on the Biacore chip as described under ’Materials and methods.’ We used the competition method
rather than conventional Biacore measurements in which varying concentrations of r-synGAP-a1 are
applied to a chip containing immobilized PDZ domains because concentrations of r-synGAP-a1
above ~100 nM produced a large bulk resonance signal caused by high viscosity that obscured the
change in resonance produced by its binding to PDZ domains. The competition assay eliminates the
need to apply high concentrations of r-synGAP-a1 to the chip.
Figure 3 continued
Ca2+/CaM. (E) Change in affinity of r-synGAP-a1 for PDZ123 after phosphorylation for 10 min by CDK5 or PLK2. or by a combination of the two, as
described in ’Materials and methods.’ The reduction in binding after phosphorylation for 10 min by CaMKII is shown for comparison. Data shown in A-E
are plotted as mean ± S.E. (n = 4). For A, B, D, and E, the statistical significance of differences in binding to PDZ domain resin relative to
unphosphorylated r-synGAP-a1 control (-Ca2+/CaM) was determined by ordinary one way ANOVA (uncorrected Fisher’s LSD). **p<0.01; ***p<0.001;
****p<0.0001.
DOI: 10.7554/eLife.16813.005
The following source data and figure supplement are available for figure 3:
Source data 1. Source data for Figure 3A.
DOI: 10.7554/eLife.16813.006
Figure supplement 1. Purification of recombinant PDZ domains of PSD-95.
DOI: 10.7554/eLife.16813.007
Walkup et al. eLife 2016;5:e16813. DOI: 10.7554/eLife.16813 7 of 31
Research article Biochemistry Neuroscience

Figure 4. Measurement of affinity of r-synGAP-a1 for PDZ1 of PSD-95 by the ’competition in solution’ method. (A)
Biacore sensorgrams showing the calibration curves (grey lines) for binding of 0–50 nM r-synGAP-a1 and the
measurement of free r-synGAP-a1 (samples; black lines) in mixtures containing 25 nM r-synGAP-a1 and 0–10 mM
PDZ1 domain. Free r-synGAP-a1 was detected by binding to PDZ1 domains immobilized on a Biacore chip as
described under ’Materials and methods.’ (B) A standard calibration curve was constructed by plotting the
Figure 4 continued on next page
Walkup et al. eLife 2016;5:e16813. DOI: 10.7554/eLife.16813 8 of 31
Research article Biochemistry Neuroscience

We generated a standard curve in which the maximum resonance responses of a series of concen-
trations of r-synGAP-a1 from 0 nM to 50 nM (Figure 4A, grey traces) were determined and plotted
against r-synGAP-a1 concentration (Figure 4B, large grey dots). The data were fit with a hyperbolic
curve. The maximum resonance response of a series of mixtures containing 25 nM r-synGAP-a1 and
increasing concentrations of PDZ1 from 0 nM to 10 mM were measured, and the concentration of
r-synGAP-a1 remaining free to bind to PDZ1 on the chip was then determined from the standard
curve (Figure 4B, small black dots). A KD of 220 ± 30 nM (Table 1) was calculated as described
under Materials and methods (Figure 4C). We used the same method to measure KDs for PDZ2 and
PDZ3 (Figure 5A and B, respectively). Because, PDZ12 and PDZ123 contain more than a single PDZ
domain binding site, all of which have similar affinities, we determined single ’apparent’ equilibrium
dissociation constants (KDapp) for these two constructs. As discussed in ’Materials and methods’, it is
not possible to derive a unique equation incorporating two or three binding sites when the affinities
of the multiple sites are similar. The best fit of the data with the equation for a single binding site
provides a KDapp that can be used to characterize the binding behavior of the constructs (Figure 5C
and D, respectively). The values are summarized in Table 1. We obtained an additional value of 730
± 50 nM for the KD of PDZ3 by a conventional Biacore assay, which is in good agreement with the
KD measured by the competition assay. These data show that, under these conditions, PDZ1 has a
higher affinity for r-synGAP-a1 than does PDZ3.
Binding of r-synGAP-a1 phosphosite mutants to PDZ123 affinity resinTo examine which phosphorylation sites can reduce binding of r-synGAP-a1 to PDZ domains, we
measured binding of recombinant mutants of r-synGAP-a1 to PDZ123 affinity resin. We first
Figure 4 continued
maximum calibrated resonance responses (marked by arrow in A) against the corresponding concentrations of r-
synGAP-a1 (large grey dots). The maximum resonance responses for each sample mixture were plotted on the
standard curve to determine the free r-synGAP-a1 concentrations in each mixture (black dots). (C) Plot of free
r-synGAP-a1 concentrations determined in B against the log of PDZ domain concentrations (black circles). The
data were fit to the binding equation shown in ’Materials and methods’ with the use of Biacore software. A KD
value (Table 1) was calculated from the equation as described under ’Materials and methods.’
DOI: 10.7554/eLife.16813.008
Table 1. Affinities of R-synGAP-a1 for PDZ Domains of PSD-95. Dissociation constants (KD) and apparent dissociation constants (KDapp)
for the interactions of r-synGAP-a1 with the PDZ domains of PSD-95 were determined by the Biacore/SPR ’competition in solution’
method as described under ’Materials and methods.’ In one experiment, the KD for PDZ3 was determined by conventional SPR as
described under ’Materials and methods.’ Goodness of Fit refers to the fit of data shown in Figures 4, 5, and 7 to the equation
relating synGAPfree to PDZ domain concentration, assuming a single binding site, as described under ’Materials and methods.’
Because PDZ12, and PDZ123 contain more than one binding site for r-synGAP-a1, the affinities are given as apparent dissociation
constants. Data are expressed as mean ± S.E.
PDZ Domain from PSD-95No. ofExperiments Dissociation Constant (KD) for Binding to R-synGAP (nM) Goodness of Fit (R2)
PDZ1 3 220 ± 30 0.908 - 0.947
PDZ2 2 1500 ± 100 0.967, 0.969
PDZ3 2 620 ± 70 0.951, 0.962
PDZ3 1 730 ± 50 (by conventional SPR) N.A.
Apparent Dissociation Constant (KDapp) for Binding to R-synGAP (nM)
PDZ12 4 350 ± 40 0.931 - 0.987
PDZ123 7 4.7 ± 0.6 0.957 - 0.987
PDZ123 3 (r-synGAP Phosphorylated by CaMKII)46 ± 10
0.810 - 0.880
PDZ123 2 (r-synGAP S1283D)16 ± 3
0.953, 0.954
DOI: 10.7554/eLife.16813.010
Walkup et al. eLife 2016;5:e16813. DOI: 10.7554/eLife.16813 9 of 31
Research article Biochemistry Neuroscience
compared binding of all of the unphosphorylated mutants by ANOVA corrected for multiple com-
parisons by the Tukey method (Figure 6, black bars). Single or multiple mutations of the indicated
serines to alanine did not significantly alter binding before phosphorylation; nor did the double
mutation S1093D/S1123D. Only mutations in which site S1283 was mutated to the phosphomimetic
aspartate (S1283D and S1093D/S1123D/S1283D) decreased binding of unphosphorylated r-synGAP-
a1 to PDZ123 with a significant p-value (p<0.0001 for both). This result suggests that phosphoryla-
tion of S1283 has the most potent effect of all the sites on binding to PDZ domains. Mutations
S1123A and S1283A did not significantly alter the change in binding after a brief, 0.5 min phosphor-
ylation. However, they both produced a trend toward lower reduction of binding, suggesting that
both sites contribute to reduction of binding after brief phosphorylation. The effect of the double
mutation S1093A/S1123A after 0.5 min of phosphorylation was not significantly different from the
effect of S1123A, suggesting that phosphorylation of S1093 doesn’t influence binding to PDZ
domains after a brief phosphorylation. In contrast, the triple mutant S1093A/S1123A/S1283A was
the only S to A mutation that significantly interfered with the loss of binding (p=0.0074) compared
to wild type after 0.5 min of phosphorylation. This result reinforces the conclusion that sites S1123
Figure 5. Affinities and apparent affinities of r-synGAP for PDZ2, PDZ3, PDZ12 and PDZ123 domains of PSD-95 determined by the ’competition in
solution’ method. The concentrations of free r-synGAP-a1 in sample mixtures containing each of the indicated PDZ domains were measured as
described in Figure 4A and B, and under ’Materials and methods.’ The values (black dots) were plotted against the log of the PDZ domain
concentration and fit to a binding curve as described in Figure 4C. Representative experiment for A, PDZ2; B, PDZ3; C, PDZ12; and D, PDZ123. The
calculated KD and KDapp values from all experiments are listed in Table 1.
DOI: 10.7554/eLife.16813.009
Walkup et al. eLife 2016;5:e16813. DOI: 10.7554/eLife.16813 10 of 31
Research article Biochemistry Neuroscience
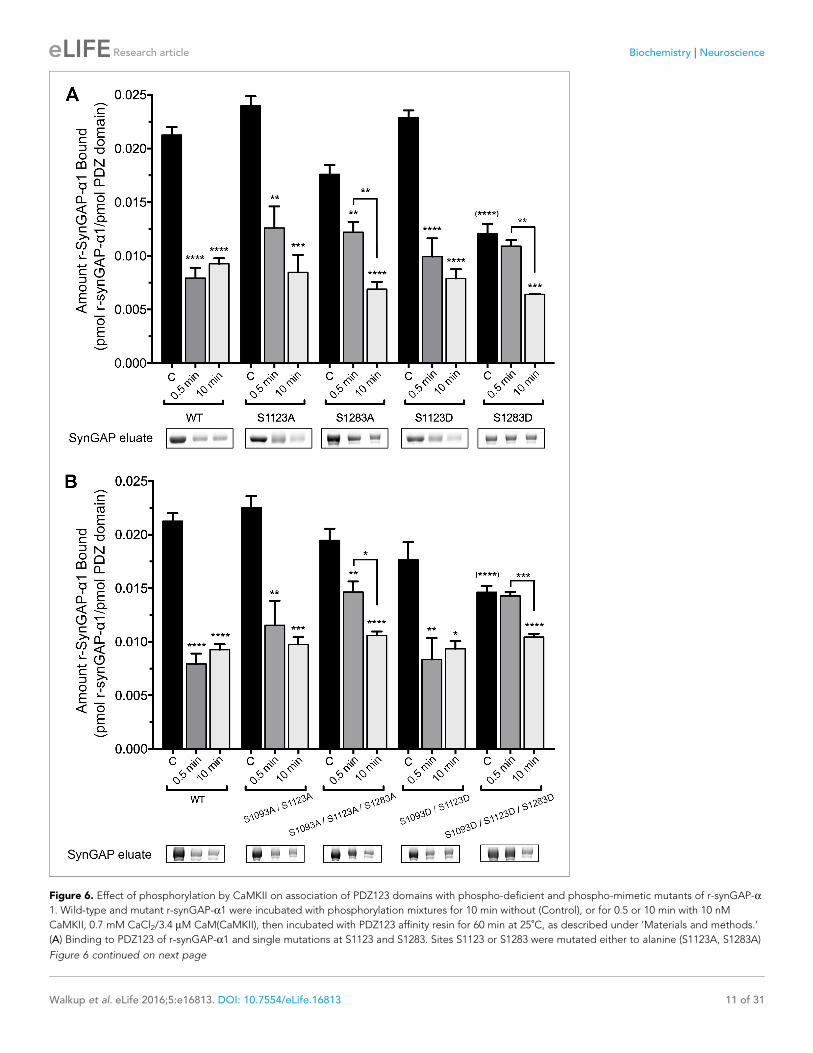
Figure 6. Effect of phosphorylation by CaMKII on association of PDZ123 domains with phospho-deficient and phospho-mimetic mutants of r-synGAP-a
1. Wild-type and mutant r-synGAP-a1 were incubated with phosphorylation mixtures for 10 min without (Control), or for 0.5 or 10 min with 10 nM
CaMKII, 0.7 mM CaCl2/3.4 mM CaM(CaMKII), then incubated with PDZ123 affinity resin for 60 min at 25˚C, as described under ’Materials and methods.’
(A) Binding to PDZ123 of r-synGAP-a1 and single mutations at S1123 and S1283. Sites S1123 or S1283 were mutated either to alanine (S1123A, S1283A)
Figure 6 continued on next page
Walkup et al. eLife 2016;5:e16813. DOI: 10.7554/eLife.16813 11 of 31
Research article Biochemistry Neuroscience

and S1283 both contribute to reduction of binding of r-synGAP-a1 to PDZ domains after brief
phosphorylation.
Notably, none of the mutations interfere with the loss of binding to PDZ domains after ten min of
phosphorylation (Figure 6A and B). Taken together, these results and the results of phosphorylation
by PLK2 mean that phosphorylation of S1283 and S1123 significantly reduces binding of r-synGAP-a
1 to PDZ domains, however maximum loss of binding can also be accomplished by cumulative phos-
phorylation over ten min of several sites within the regulatory domain (Figure 2A and Walkup et al.,
2015). This mechanism is consistent with the finding of Holt et al. that clusters of sites in rapidly
evolving disordered regions appear to shift position in evolutionary time suggesting that regulation
by phosphorylation often involves disruption or enhancement of protein-protein interactions by
addition of multiple negative charges (Holt et al., 2009).
Effect of phosphorylation on affinity of r-synGAP-a1 for PDZ123measured by SPRWe measured the apparent dissociation constants (KDapp’s) for binding to PDZ123 of r-synGAP-a1
phosphorylated for 10 min by CaMKII, and of the phosphomimetic mutant r-synGAP-a1 S1283D, as
described for Figure 5 and under ’Materials and methods’. Phosphorylation for 10 min by CaMKII
increases the KDapp of r-synGAP-a1 approximately ten-fold (Figure 7A, Table 1); whereas mutation
of S1283 to aspartate increases the KDapp approximately four-fold (Figure 7B, Table 1). Thus, cumu-
lative phosphorylation of several residues can reduce affinity for PDZ domains by an order of magni-
tude; whereas, addition of a negative charge at S1283 alone can reduce the affinity by a factor of
four.
Ca2+/CaM binds directly to r-synGAP-a1While studying phosphorylation of r-synGAP-a1 by CDK5 (Walkup et al., 2015), we found that the
presence of Ca2+/CaM in reactions with either CDK5/p35 or CDK5/p25 doubled the rate and stoichi-
ometry of the phosphorylation (Figure 8A and B). Inclusion of Ca2+ or CaM alone in the phosphory-
lation reactions did not alter the rates or stoichiometry.
We tested whether this effect resulted from binding of Ca2+/CaM to CDK5/p35 (e.g. He et al.,
2008), or CDK5/p25 by comparing the rates of phosphorylation of histone H1, a well-known sub-
strate of CDK5 in the presence and absence of Ca2+/CaM (Figure 8C and D). Phosphorylation of his-
tone H1 by either CDK5/p35 or CDK5/p25 was unaffected by Ca2+/CaM. This result suggests that
Ca2+/CaM binds directly to r-synGAP-a1, causing a substrate-directed enhancement of its
phosphorylation.
To further verify that Ca2+/CaM binds directly to r-synGAP-a1, we showed that r-synGAP-a1
binds to a CaM-Sepharose affinity resin in a Ca2+-dependent manner, as would be expected if it
binds Ca2+/CaM specifically and with significant affinity (Figure 8—figure supplement 1). We found
that the presence of Ca2+/CaM alone in a Ras- or Rap-GAP assay has no effect on the GAP activity
of r-synGAP-a1 (Figure 8—figure supplement 2).
Affinity of binding of R-synGAP-a1 to Ca2+/CaMWe measured the affinity of binding of Ca2+/CaM to r-synGAP-a1 by the conventional SPR method
on the Biacore as described under Materials and methods. CaM was immobilized on a chip, and
r-synGAP-a1 was applied to it at concentrations from 0 to 75 nM (Figure 9A). Analysis of the equi-
librium phase of association at each concentration (Figure 9B) yielded a KD of 9 ± 1 nM, indicative of
high affinity binding.
Figure 6 continued
or to the phosphomimetic aspartate (S1123D, S1283D). (B) Binding to PDZ123 of r-synGAP-a1 and double or triple mutations at S1093, S1123, and
S1283, as indicated. Data are mean ± S.E. (n = 4). The statistical significances of differences between wild type and the various mutants in binding to
PDZ123 before phosphorylation were determined by ordinary one way ANOVA (Tukey correction for multiple comparisons). Only mutations including
S1283D were significantly different from wild type (indicated by (****)). Differences between unphosphorylated and phosphorylated individual mutants
were compared individually by ordinary one way ANOVA (uncorrected Fisher’s LSD). *pp<0.05; **p<0.01; ***p<0.005; ****p<0.0001. See the text for
additional statistical comparisons.
DOI: 10.7554/eLife.16813.011
Walkup et al. eLife 2016;5:e16813. DOI: 10.7554/eLife.16813 12 of 31
Research article Biochemistry Neuroscience

To begin to define the location of the high affinity Ca2+/CaM binding site, we compared the affin-
ities for Ca2+/CaM of r-synGAP-a1 and a C-terminal truncated protein, sr-synGAP (residues 103–
725) by a bead-binding assay as described under Materials and methods. We measured the amount
of each protein bound to a fixed amount of CaM-Sepharose after incubation with increasing concen-
trations (Figure 9C and D). Both r-synGAP-a1 (Figure 9C) and sr-synGAP (Figure 9D) showed satu-
rable binding to the CaM-Sepharose resin, and did not bind to control Sepharose beads lacking
CaM (data not shown). The data were fit to hyperbolic curves and the KD’s for binding of r-synGAP-
Figure 7. Apparent affinities of phosphorylated r-synGAP-a1 and r-synGAP-a1-S1283D for PDZ123 determined by
the ’competition in solution’ method. Representative plots of the concentrations of (A) free phospho-r-synGAP-a1
phosphorylated as described for PDZ Binding Assays under ’Materials and methods,’ and (B) r-synGAP-a1-S1283D,
measured in sample mixtures containing PDZ123 as described in Figure 4A and B, and under ’Materials and
methods.’ The values (black dots) were plotted against the log of the PDZ123 concentration in the mixture and fit
to a binding curve as described in Figure 4C. The calculated values of KDapp are listed in Table 1.
DOI: 10.7554/eLife.16813.012
Walkup et al. eLife 2016;5:e16813. DOI: 10.7554/eLife.16813 13 of 31
Research article Biochemistry Neuroscience

A B
C D
+
Ca2+ CaM
+
- -
+
Ca2+ CaM
+
+ -
-
Ca2+ CaM
+
- -
+
Ca2+ CaM
+
- -
+
Ca2+ CaM
+
- -
0.5 1 2 0.5 1 2
10 30 60 10 30 60 10 30 60
Figure 8. Effect of Ca2+/CaM on stoichiometry of phosphorylation of r-synGAP-a1 and histone H1 by CDK5. Stoichiometry of phosphorylation of
r-synGAP-a1 (A and B) and histone H1 (C and D) by CDK5/p35 or CDK5/p25. R-synGAP-a1 (286 nM) or histone H1 (4.3 mM) were incubated with CDK5/
p35 or CDK5/p25 as described under ’Materials and methods’ in the presence or absence of 0.7 mM CaCl2 or 3.4 mM CaM, as indicated in each panel.
Reactions were quenched at the indicated times by addition of 3x Laemmli sample buffer and radiolabeled r-synGAP-a1 and histone H1 were
Figure 8 continued on next page
Walkup et al. eLife 2016;5:e16813. DOI: 10.7554/eLife.16813 14 of 31
Research article Biochemistry Neuroscience

a1 and sr-synGAP to Ca2+/CaM were calculated to be 31 ± 3 nM and 210 ± 30 nM, respectively.
Thus, the high affinity site appears to be located in the regulatory disordered region of r-synGAP-a
1, which is missing in sr-synGAP. The KD‘s determined by the bead-binding assay (31 ± 3 nM) and
Biacore equilibrium binding (9 ± 1 nM) are in the range of those reported for calcineurin (PP2B) and
CaMKII, 1–10 nM (Hubbard and Klee, 1987; Cohen and Klee, 1988) and 40–80 nM (Miller and
Kennedy, 1985; Meyer et al., 1992; Hudmon and Schulman, 2002), respectively. We did not
detect any binding when sr-synGAP was injected onto the CaM-substituted Biacore chip at concen-
trations from 10–2500 nM. Thus, the relatively weak binding of sr-synGAP observed in the bead-
binding assay is not reproducible when measured on the Biacore chip. These data indicate that
Ca2+/CaM binds only weakly, if at all, to the N-terminal half of synGAP. A meta-analysis algorithm
for detecting potential CaM-binding domains (Mruk et al., 2014) predicts two Ca2+/CaM binding
sites in the C-terminal half of r-synGAP-a1, one from residues 1000–1030 and another in the putative
coiled coil domain from residues 1229–1253. The SPR measurements do not allow us to confirm or
to rule out the presence of two high affinity sites of similar affinity.
Effect of Ca2+/CaM on binding of r-synGAP-a1 to PDZ domains of PSD-95We tested whether binding of Ca2+/CaM alters the binding of r-synGAP-a1 to PDZ domains by com-
paring binding to each affinity resin in the presence or absence of Ca2+/CaM (Figure 10A). The pres-
ence of Ca2+/CaM during incubation with resin significantly reduces binding of r-synGAP-a1 to
PDZ3 and to PDZ123, but not to PDZ1 and/or PDZ2. Thus, binding of Ca2+/CaM has a more specific,
but weaker, effect on binding to the PDZ domains than does phosphorylation. The effects of phos-
phorylation and of the presence of Ca2+/CaM during incubation with resin are not additive
(Figure 10B); that is, the presence of Ca2+/CaM during the incubation with resin does not further
decrease binding of phosphorylated r-synGAP-a1 to PDZ123.
SynGAP haploinsufficiency alters the composition of the PSDThe physiological significance of the finding that phosphorylation by CaMKII decreases the affinity of
r-synGAP-a1 for the PDZ domains of PSD-95 is best considered in the context of the high copy num-
ber of synGAP in the PSD. In molar terms, synGAP-a1 is 30–50% as abundant in the PSD as PSD-95
itself (Chen et al., 1998; Cheng et al., 2006; Dosemeci et al., 2007; Sheng and Hoogenraad,
2007). Our data suggest that phosphorylation of synGAP-a1 by CaMKII, triggered by activation of
NMDARs, would promote dissociation of synGAP-a1 from the PDZ domains, reducing its ability to
compete with other proteins for binding.
Syngap+/- mice have been shown to have about half as much synGAP in homogenates from fore-
brain as wt littermates. Because binding equilibria are driven not only by the intrinsic affinities of the
binding partners, but also by their concentrations, one prediction of our proposed hypothesis is that
synGAP haploinsufficiency, which reduces the amount of synGAP in the brain by 50%
(Vazquez et al., 2004), will cause a significant increase in binding to PSD-95 of other prominent
PSD-95 binding proteins, such as TARPs, LRRTMs, or neuroligins. Thus, PSDs isolated from Syngap+/-
mice would be predicted to have less synGAP and more TARPs, LRRTMs, and/or neuroligins bound
to PSD-95 than do PSDs isolated from wt mice. We prepared PSD fractions from the forebrains of
six Syngap+/- mice and from six wt litter mates and measured the ratios of synGAP, TARPs, LRRTM2,
Figure 8 continued
quantified as described under ’Materials and methods.’ Data are plotted as mean ± S.E. (n = 4–7). The statistical significance of differences in
phosphorylation in the presence of Ca2+ and CaM were determined by ordinary one way ANOVA (uncorrected Fisher’s LSD). **p<0.01; ***p<0.001;
****p<0.0001.
DOI: 10.7554/eLife.16813.013
The following figure supplements are available for figure 8:
Figure supplement 1. R-synGAP-a1 binds to CaM affinity resin.
DOI: 10.7554/eLife.16813.014
Figure supplement 2. Effect of Ca2+/CaM on GAP activity of r-synGAP-a1.
DOI: 10.7554/eLife.16813.015
Walkup et al. eLife 2016;5:e16813. DOI: 10.7554/eLife.16813 15 of 31
Research article Biochemistry Neuroscience

neuroligin-1, and neuroligin-2 to PSD-95 in the two fractions by quantitative immunoblot as
described in ’Materials and methods’ (Figure 11). The recoveries of total protein and the amount of
PSD-95 per mg protein were identical in the two preparations. As predicted, the level of synGAP is
decreased in relation to PSD-95 by ~ 24% in PSDs (p=0.0007, d = 1.75) from the Syngap+/- mice
(Figure 11A). Furthermore, the ratios of TARPs 2,3,4,V8, and of LRRTM2 to PSD-95 are significantly
Figure 9. Affinity of r-synGAP-a1 and sr-synGAP for Ca2+/CaM determined by equilibrium analysis. (A and B) The affinity of r-synGAP-a1 for Ca2+/CaM
was measured by SPR with CaM immobilized on the chip and r-synGAP-a1 injected at 0–75 nM onto the chip surface as described under ’Materials and
methods.’ (A) Sensorgrams with the blank and reference flow cell readings subtracted show the response upon injection of r-synGAP-a1 onto the chip
surface (0–75 s) and its dissociation from the chip surface (75–150 s). (B) RUs at equilibrium (marked by arrow in A) were plotted against the
corresponding concentrations of r-synGAP-a1 and fitted to a hyperbolic curve. A KD of 9 ± 1 nM was calculated as described under ’Materials and
methods.’ (C and D) The affinities of r-synGAP-a1 (C) and sr-synGAP (D), (0–500 nM) for Ca2+/CaM were measured by incubation with CaM-Sepharose
resin as described under ’Materials and methods.’ Integrated intensities of bound r-synGAP-a1 and sr-synGAP were measured from immunoblots as
described under ’Materials and methods’ and plotted versus the corresponding concentrations incubated with resin. Integrated intensities from
Western blots were linear over the range of r-synGAP-a1 and sr-synGAP concentrations used in the assays. Data in C and D are plotted as mean ± S.E.
(n = 3).
DOI: 10.7554/eLife.16813.016
Walkup et al. eLife 2016;5:e16813. DOI: 10.7554/eLife.16813 16 of 31
Research article Biochemistry Neuroscience

increased (Figure 11B,C; TARP/PSD-95, ~12%, p=0.017, d = 0.93; LRRTM2/PSD-95, ~14%,
p=0.0035, d = 0.66). This result strongly suggests that, as predicted, the increase in availability of
PDZ1/2 domains on PSD-95 in the Syngap+/- mice enhances steady-state binding of TARPs and
LRRTMs to those sites. Interestingly, the ratio of neuroligin-1 to PSD-95 is unchanged in the
Syngap+/- mice (d = 0.07, Figure 11D), suggesting that increased availability of PDZ3 on PSD-95 is
not a strong driver of association of neuroligin-1 with the PSD fraction. However, the ratio of neuroli-
gin-2 to PSD-95 (Figure 11E) is increased by ~9% (p=0.019, d = 0.64). Neuroligin-2 normally associ-
ates mostly with inhibitory synapses and mediates their maturation (Varoqueaux et al., 2004).
However, Levinson et al. (2005) reported that over-expression of PSD-95 in neurons causes a redis-
tribution of neuroligin-2, increasing the proportion associated with excitatory synapses. Thus, the
effect of reduction of synGAP on the distribution of neuroligin-2 shown here is the same as the effect
Figure 10. Effect of Ca2+/CaM binding on association of r-synGAP-a1 with PDZ domains of PSD-95. (A) Association of control and Ca2+/CaM bound
r-synGAP-a1 with PDZ domains of PSD-95. R-synGAP-a1 (500 nM) without (Control) or with (+ CaM) 0.7 mM CaCl2/3.4 mM CaM was incubated with PDZ
domain resins (PDZ1, PDZ2, PDZ3, PDZ12, and PDZ123) for 60 min at 25˚C and bound r-synGAP-a1 was measured as described under ’Materials and
methods.’ (B) Effects of bound Ca2+/CaM and phosphorylation by CaMKII on association of r-synGAP-a1 with PDZ123 domain are not additive. The
association with PDZ123 domain resin of Control, Ca2+/CaM bound (plus CaM), phosphorylated r-synGAP-a1 (plus CaMKII) and phosphorylated
r-synGAP-a1 bound to Ca2+/CaM (plus CaM and CaMKII) was measured as described in A. Data are plotted as mean ± S.E. (n = 4). The statistical
significance of differences in PDZ domain binding relative to Control was determined by ordinary one way ANOVA (uncorrected Fisher’s LSD).
**p<0.01; ****p<0.0001.
DOI: 10.7554/eLife.16813.017
The following source data is available for figure 10:
Source data 1. Source data for Figure 10A.
DOI: 10.7554/eLife.16813.018
Walkup et al. eLife 2016;5:e16813. DOI: 10.7554/eLife.16813 17 of 31
Research article Biochemistry Neuroscience

Figure 11. Altered composition of the PSD in mice with heterozygous deletion of synGAP. Ratios of amounts of the indicated proteins to PSD-95 in
each lane were measured as described in ’Materials and methods’ and are reported as mean ± S.E. For all blots except those for neuroligin-1, PSD-95
was detected with a secondary Ab labeled with AlexaFluor680 and the binding protein was detected with secondary Ab labeled with IRDye 800. On the
neuroligin-1 blot, both PSD-95 and neuroligin-1 were detected with AlexaFluor680; the two bands were well-separated in each lane. Representative sets
of visualized bands for WT and HET from the same blot are shown below the graphs. Individual points represent the ratio of the indicated protein to
Figure 11 continued on next page
Walkup et al. eLife 2016;5:e16813. DOI: 10.7554/eLife.16813 18 of 31
Research article Biochemistry Neuroscience

of over-expression of PSD-95, suggesting that both manipulations increase the number of PDZ3
domains available for binding. Taken together, these results verify the prediction that a decrease in
availability of synGAP in the PSD scaffold, increases the association of TARPs, LRRTMs, and neuroli-
gin-2 with the PSD in vivo by releasing a restriction on binding to PDZ domains of PSD-95.
DiscussionWe have presented a new model for regulation of the composition of the spine postsynaptic mem-
brane and PSD. It builds on previous findings that the PSD scaffold, in particular the PSD-95 com-
plex, is dynamically regulated by activity (Gray et al., 2006; Sturgill et al., 2009), that activation of
NMDARs and CaMKII leads to enhanced trapping of AMPARs within the PSD by binding to PDZ
domains of PSD-95 (Opazo et al., 2010; 2012), and that synGAP moves away from the PSD after
phosphorylation by CaMKII (Yang et al., 2013; Araki et al., 2015). We propose that binding of the
C-terminus of synGAP-a1 to the PDZ domains of PSD-95 restricts binding of TARPs, LRRTM2, neuro-
ligin-2, and perhaps additional proteins. As a result, regulation of synGAP-a1’s concentration and
binding affinity for PDZ domains helps to determine the precise composition of the PSD at individual
excitatory synapses (Figure 12). A corollary of this hypothesis is that synGAP plays an important role
in limiting the size and strength of excitatory synapses by limiting and helping to regulate the avail-
able ’slots’ that can bind AMPAR complexes (Hayashi et al., 2000; Shi et al., 2001; Opazo et al.,
2012).We have provided support for this notion by demonstrating that phosphorylation of several
sites in synGAP’s regulatory domain by CaMKII or by PLK2 reduces the affinity of its PDZ ligand for
all three of the PDZ domains of PSD-95. Both of these protein kinases are important regulators of
synaptic strength (Seeburg et al., 2008; Hell, 2014). We have also verified a strong prediction of
the hypothesis which is that PSDs from mice with a deletion of one copy of the synGAP gene will
contain fewer copies of synGAP and more copies of other proteins that bind to PSD-95. Indeed, we
have shown that PSD fractions from young Syngap+/- mice have ~24% less synGAP per molecule of
PSD-95 than those from wt mice; and, in contrast, they have significantly more TARP proteins
(~12%), LRRTM2 (~14%), and neuroligin-2 (~9%) per molecule of PSD-95. The ratio of neuroligin-1 to
PSD-95 is not altered.
In the mouse brain, synGAP begins to be expressed at birth and its expression increases rapidly
as synapses are forming during the first weeks after birth (Vazquez et al., 2004; Barnett et al.,
2006). Newborns with complete deletion of Syngap appear normal, but die a few days after birth
with movement defects and apparent seizure activity, indicating a defect as synapses are forming
(Kim et al., 2003; Vazquez et al., 2004). Syngap heterozygous mice also appear normal and survive
Figure 11 continued
PSD-95 in a single lane (n refers to these technical replicates). The WT and HET PSD preparations were each made from six animals; thus, each of the
two preparations represents six biological replicates. (A) SynGAP to PSD-95 ratio. Data were collected for 22 lanes from two blots containing 5 mg total
PSD fraction per lane. One blot contained six lanes WT and six lanes HET samples, the other contained five lanes of each. The mean ratio of synGAP to
PSD-95 was 0.234 ± 0.012 for WT (n = 11) and 0.179 ± 0.005 (n = 11) for HET (�24%). Means were compared by unpaired, one-tailed t-test with Welch
correction, p = 0.0007. Effect size, d = 1.75. (B) TARP V -2,3,4,8 to PSD-95 ratio. Data were collected for 24 lanes from two blots containing 10 mg total
PSD fraction per lane. Each blot contained six lanes WT and six lanes HET samples. Densities of all four TARPs were pooled. The mean ratio of TARPs
to PSD-95 was 0.066 ± 0.003 (n = 12) for WT and 0.075 ± 0.003 (n = 12) for HET (+12%). Means were compared by unpaired, one-tailed t-test with equal
variance, p = 0.017. Effect size, d = 0.93. (C) LRRTM2 to PSD-95 ratio. Data were collected for 36 lanes from three blots containing six WT and six HET
samples, alternating 5 and 10 mg (3 each). The mean ratio of LRRTM2 to PSD-95 was 0.051 ± 0.003 (n = 17) for WT and 0.059 ± 0.003 (n = 17) for HET
(+14%). Means were compared by paired, one-tailed t-test, p=0.0035. Effect size, d = 0.66. (D) Neuroligin-1 to PSD-95 ratio. Data were collected for 47
lanes from four blots two of which contained 5 mg and two 10 mg total PSD fraction per sample. Each blot contained 6 lanes WT and 6 lanes HET
samples. The mean ratio of neuroligin-1 to PSD-95 was 0.114 ± 0.005 (n = 24) for WT and 0.115 ± 0.004 (n = 23) for HET (no difference). Means were
compared by unpaired one-tailed t-test, p = 0.413. Effect size, d = 0.07. (E) Neuroligin-2 to PSD-95 ratio. Data were collected for 44 lanes from four
blots containing 10 mg total PSD fraction per lane. Each blot contained six lanes WT and six lanes HET samples. The mean ratio of neuroligin-2 to PSD-
95 was 0.071 ± 0.002 (n = 20) for WT and 0.078 ± 0.003 (n = 24) for HET (+9%). Means were compared by unpaired, one-tailed t-test with Welch
correction, p=0.019. Effect size, d = 0.64. *p<0.005; **p<0.01; ***p<0.001
DOI: 10.7554/eLife.16813.019
The following source data is available for figure 11:
Source data 1. Source data for ratios determined in Figure 11 A through E.
DOI: 10.7554/eLife.16813.020
Walkup et al. eLife 2016;5:e16813. DOI: 10.7554/eLife.16813 19 of 31
Research article Biochemistry Neuroscience
into adulthood with no apparent alterations in gross brain morphology, but with defects in behavior
and synaptic plasticity (Komiyama et al., 2002). Syngap+/- neurons have higher average numbers of
AMPARs at their synapses than wt (Kim et al., 2003; Vazquez et al., 2004), and, have, on average,
larger spine heads (Vazquez et al., 2004; Carlisle et al., 2008). They form excitatory synapses pre-
cociously in culture (Vazquez et al., 2004) and also during postnatal cortical and hippocampal
development (Clement et al., 2012), leading to an elevated E/I ratio (excitatory/inhibitory synaptic
ratio) and derangement of critical developmental periods (Clement et al., 2013). While all of these
influences could contribute to alterations in the composition of PSDs in Syngap+/- animals, several
arguments suggest that the increased presence of TARPs, LRRTMs, and neuroligin-2 that we report
in PSDs of young animals (Figure 11) is likely a primary, rather than a secondary effect of the
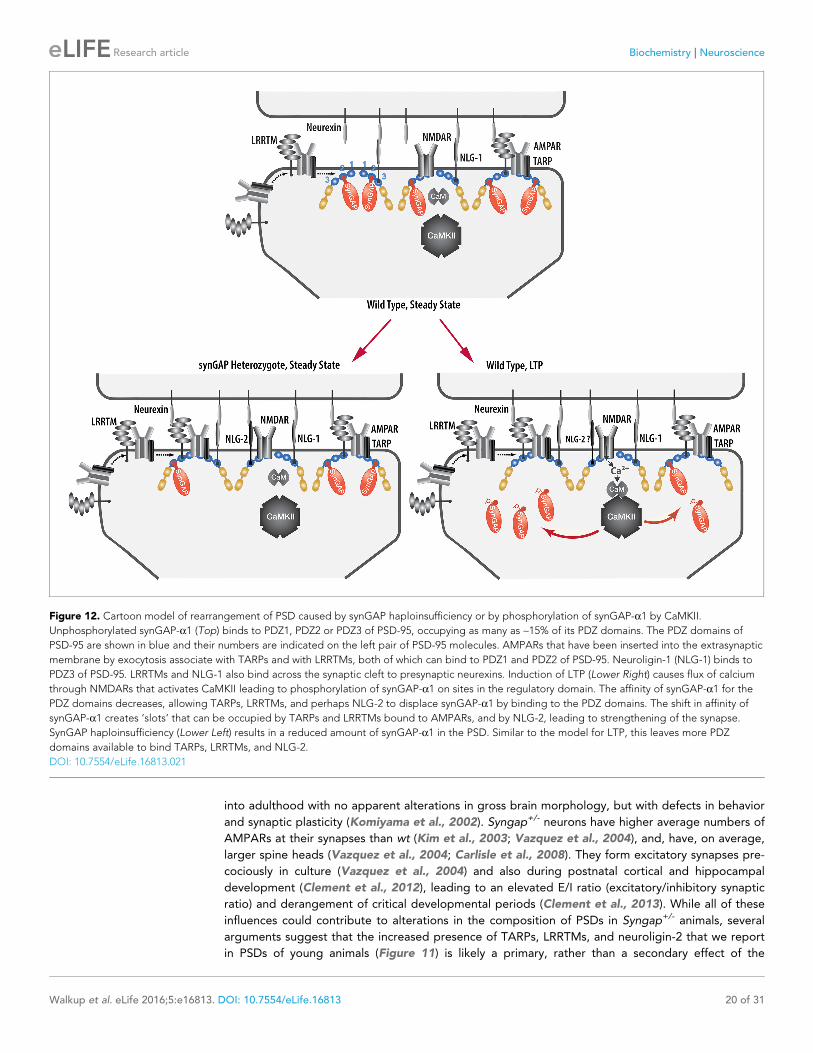
Figure 12. Cartoon model of rearrangement of PSD caused by synGAP haploinsufficiency or by phosphorylation of synGAP-a1 by CaMKII.
Unphosphorylated synGAP-a1 (Top) binds to PDZ1, PDZ2 or PDZ3 of PSD-95, occupying as many as ~15% of its PDZ domains. The PDZ domains of
PSD-95 are shown in blue and their numbers are indicated on the left pair of PSD-95 molecules. AMPARs that have been inserted into the extrasynaptic
membrane by exocytosis associate with TARPs and with LRRTMs, both of which can bind to PDZ1 and PDZ2 of PSD-95. Neuroligin-1 (NLG-1) binds to
PDZ3 of PSD-95. LRRTMs and NLG-1 also bind across the synaptic cleft to presynaptic neurexins. Induction of LTP (Lower Right) causes flux of calcium
through NMDARs that activates CaMKII leading to phosphorylation of synGAP-a1 on sites in the regulatory domain. The affinity of synGAP-a1 for the
PDZ domains decreases, allowing TARPs, LRRTMs, and perhaps NLG-2 to displace synGAP-a1 by binding to the PDZ domains. The shift in affinity of
synGAP-a1 creates ’slots’ that can be occupied by TARPs and LRRTMs bound to AMPARs, and by NLG-2, leading to strengthening of the synapse.
SynGAP haploinsufficiency (Lower Left) results in a reduced amount of synGAP-a1 in the PSD. Similar to the model for LTP, this leaves more PDZ
domains available to bind TARPs, LRRTMs, and NLG-2.
DOI: 10.7554/eLife.16813.021
Walkup et al. eLife 2016;5:e16813. DOI: 10.7554/eLife.16813 20 of 31
Research article Biochemistry Neuroscience
mutation. The effect of overexpression of synGAP-a1 in cultured forebrain neurons on development
of spines (Vazquez et al., 2004) and on numbers of synaptic AMPARs (McMahon et al., 2012) is
rapid, measurable within 12–24 hr of transfection and is not caused by mislocalization of the exoge-
nous synGAP- a1. These effects are predicted by our model and do not depend on the in vivo con-
text of the neurons. They are also not dependent on the GAP activity of synGAP and they require
the PDZ ligand. While it is possible that a presently unknown direct effect on protein expression pro-
duces these changes, that effect would have to be specific for synGAP-a1 and require its PDZ
ligand. No evidence has emerged for a direct effect of the PDZ ligand on protein expression. Thus,
the hypothesis we have put forward is the most parsimonious explanation for the specific effects of
synGAP-a1 on PSD composition. Similarly, the change in protein composition of PSDs in Syngap+/-
animals (Figure 11) cannot be explained by a two-fold reduction in RasGAP and RapGAP activity.
SynGAP produces a much larger fold increase in GTPase activity of Rap than of Ras (Walkup et al.,
2015 and references therein). Therefore, loss of half of the GAP activity would be predicted to
increase the level of active Rap even more than that of active Ras. Thus, one would expect a relative
increase in endocytosis of AMPARs compared to exocytosis (Zhu et al., 2002). That would result in
fewer AMPAR binding proteins in the PSD; not more, as we observe. For now, application of
Occam’s razor strongly favors the hypothesis we have presented. Future experiments will be neces-
sary to determine the quantitative significance of synGAP-a1’s restriction of PDZ domain binding
sites at various times during development and during acute stimulation of synapses.
Because binding between molecules is driven by their concentrations and also by the inherent
affinity between the binding components, we predict that phosphorylation of synGAP-a1 by CaMKII
or PLK2 can alleviate the restriction, enabling reconfiguration of the PSD scaffold. Thus, acute phos-
phorylation of synGAP-a1 by CaMKII following activation of NMDARs during induction of LTP could
initiate rearrangement of the composition of PSDs of individual synapses by causing an increase in
equilibrium binding in the PSD of AMPARs associated with TARPs and LRRTMs, and of other PSD-95
binding proteins, as they diffuse from perisynaptic locations. It will be important to test this predic-
tion in future experiments.
Dephosphorylation of synGAP-a1 after its movement away from PDZ domains might be expected
to allow synGAP-a1 to displace the newly added TARPs and LRRTMs and reverse the addition of
new AMPARs. Thus, if this model is correct, additional processes occurring later in the consolidation
of LTP would be needed to stabilize the newly added AMPARs in the synapse and/or to permanently
decrease the number of synGAP-a1 molcules per PSD-95 in potentiated synapses. Such processes
could include degradation of the phosphorylated synGAP-a1 and its replacement by newly synthe-
sized alternatively-spliced isoforms that lack the C-terminal PDZ binding domain (Li et al., 2001;
McMahon et al., 2012).
Several studies have shown that an increase in localization of neuroligin-2 at excitatory synapses
is mediated by binding to PSD-95 and increases the ratio of excitatory to inhibitory synaptic contacts
(Prange et al., 2004; Levinson et al., 2005; 2010). It seems likely that the restriction by synGAP-a1
of binding of neuroligin-2 to PDZ3 of PSD-95 would be more significant during development, during
formation of new synapses, or perhaps in later phases of consolidation of LTP in adults. It is not clear
whether a pool of perisynaptic neuroligin-2 exists at adult synapses that could be recruited to new
synaptic sites over a few minutes after phosphorylation of synGAP-a1. Nonetheless, the small but
significant increase in neuroligin-2 that we observe in excitatory PSDs from Syngap+/- mice, as well
as the increased steady state amounts of TARPs and LRRTMs would increase the overall excitatory/
inihibitory (E/I) balance of synapses onto neurons in the mutant mice, and perhaps also in humans
with SYNGAP1 haploinsufficiency.
We note that the reduction in affinity of synGAP-a1 for PDZ domains of PSD-95 after phosphory-
lation by CaMKII is apparently not sufficient for complete dispersal of synGAP-a1 away from the
PSD, although it is likely necessary. Mutated synGAP-a1 missing the PDZ ligand (synGAPDSXV) can-
not bind to PDZ domains, yet still localizes to synaptic spines (Vazquez et al., 2004). Furthermore,
Yang et al. (2013) showed by immunoelectron microscopy that both a1 and a2 synGAP isoforms
localize to the PSD core, and McMahon et al. (2012) showed by mass spectrometry that a2 iso-
forms are present in isolated PSDs. These data mean that reduction of affinity of synGAP for PDZ
domains may be sufficient to decrease its ability to compete for binding slots on PSD-95; however,
complete detachment of synGAP from the PSD in vivo likely requires additional events.
Walkup et al. eLife 2016;5:e16813. DOI: 10.7554/eLife.16813 21 of 31
Research article Biochemistry Neuroscience
The functional significance of our finding that r-synGAP-a1 contains a high affinity binding site for
Ca2+/CaM is less clear. We have shown that binding of Ca2+/CaM alters the conformation of the car-
boxyl terminal regulatory domain of r-synGAP-a1 allowing CDK5 to phosphorylate additional sites;
the binding also reduces the affinity of r-synGAP-a1 for PDZ3 by ~25%. However, the consequences
of these two effects for synaptic function are not known. Once again, the high copy number of syn-
GAP in the PSD may provide a clue. The biochemical events initiated by Ca2+ flux through NMDARs
that lead to changes in synaptic strength (Sjostrom and Nelson, 2002) are initiated by formation of
transient and limiting concentrations of Ca2+/CaM in the spine (Markram et al., 1998; Pepke et al.,
2010). Approximately ten regulatory enzymes compete for binding of, and activation by, this Ca2+/
CaM (Kennedy, 2013). Because of the abundance of synGAP in the PSD, the high affinity binding
site for Ca2+/CaM on synGAP will compete effectively for the newly formed Ca2+/CaM and may act
as a Ca2+/CaM buffer.
Haploinsufficiency of SYNGAP1 in humans is the cause of ~2–9% of cases of nonsyndromic cogni-
tive disability with co-morbid Autism Spectrum Disorder or Epilepsy (Berryer et al., 2013). The
reduced amount of synGAP and resulting decrease in its ability to compete for PDZ domains are
likely as significant as the reduction in synaptic Ras/Rap GAP activity in the pathology of these disor-
ders. An increase in the E/I balance of synapses onto neurons in the forebrain of affected individuals
is predicted by our results with Syngap+/- mice, and could be responsible for the symptoms of cogni-
tive disability, ASD, and/or epilepsy. It would be worth considering whether pharmaceutical agents
could be designed that would bind to PDZ domains of PSD-95 (e.g. Cui et al., 2007) and compen-
sate for the reduced level of synGAP.
Materials and methods
Cloning, expression and purification of r-synGAPSoluble, recombinant synGAP-a1 (r-synGAP-a1), comprising residues 103–1293 in synGAP A1-a1
(118–1308 in synGAP A2-a1), or sr-synGAP, comprising residues 103–725 in synGAP A1-a1 (118–
740 in synGAP A2-a1), was purified from E. coli as previously described (Walkup et al., 2015). The
isoform names and residue numbering are taken from ref. (Walkup et al., 2015). Henceforth, except
where indicated, we use residue numbering corresponding to synGAP A1-a1.
Briefly, a pET-47b(+) plasmid (EMD Millipore, Temecula, CA; catalog no. 71461) containing r-syn-
GAP-a1 cDNA (AF048976) fused to an N-terminal 6x Histidine Tag and a PreScission Protease cleav-
age site was transformed into the Rosetta2(DE3) E. coli strain (EMD Millipore, catalog no. 71397) for
protein expression. Bacterial pellets were harvested by centrifugation and lysed by microfluidization
in a ML-110 microfluidizer (Microfluidics). Soluble r-synGAP-a1 was purified on Talon Metal Affinity
Resin (Clontech, Mountain View, CA; catalog no. 635503), and concentrated by ultrafiltration
through a 30 kDa cutoff-filter (Thermo Scientific, Waltham, MA; catalog no. 88531) for r-synGAP-a1
or 9 kDa cutoff-filter (Thermo Scientific, catalog no. 89885A) for sr-synGAP. Concentrated samples
of r-synGAP-a1 were exchanged into storage buffer (20 mM Tris, pH 7.0; 500 mM NaCl, 10 mM
TCEP, 5 mM MgCl2, 1 mM PMSF, 0.2% Tergitol Type NP-40, and Complete EDTA-free protease
inhibitor) by ultrafiltration, flash-frozen in liquid nitrogen, and stored at -80˚C. Sr-synGAP was further
purified on a size exclusion column prior to storage (Walkup et al., 2015).
Cloning, expression and purification of PDZ domains from PSD-95Soluble recombinant PDZ domains, comprising residues 61–151 (PDZ1), 155–249 (PDZ2), 302–402
(PDZ3), 61–249 (PDZ12), and 61–403 (PDZ123) from murine PSD-95 (Q62108) were purified from E.
coli as previously described (Walkup and Kennedy, 2014, 2015) with the modifications below.
Briefly, pJExpress414 plasmids (DNA2.0, catalog no. pJ414) containing codon optimized PDZ
domains were transformed into the BL21(DE3) E. coli strain (EMD Millipore, catalog no. 70235–3) for
protein expression. Single colonies of BL21(DE3) cells harboring pJExpress414 plasmids were grown
overnight at 37˚C in lysogeny broth (LB) (Teknova, Hollister, CA; catalog no. L9110) supplemented
with 100 mg/ml carbenicillin. Overnight cultures were diluted 1:500 into LB medium and grown at
37˚C until cultures reached an O.D.600 of 1.0. IPTG was added to a final concentration of 0.2 mM,
and cultures were grown for an additional 4.5 hr at 37˚C. Bacterial pellets were harvested by centri-
fugation and lysed using non-ionic detergent (BugBuster, EMD Millipore) and Ready-Lyse (Epicentre,
Walkup et al. eLife 2016;5:e16813. DOI: 10.7554/eLife.16813 22 of 31
Research article Biochemistry Neuroscience

Madison, WI). Soluble PDZ1, PDZ2 and PDZ12 domains were purified on GluN2B peptide (GAGS-
SIESDV) PDZ Ligand Affinity Resin (Walkup and Kennedy, 2014) by eluting with 400 mg/ml SIETEV
peptide. PDZ3 and PDZ123 were purified on CRIPT peptide (GAGNYKQTSV) PDZ Ligand Affinity
Resin (Walkup and Kennedy, 2014) by eluting with 400 mg/ml YKQTSV peptide. PDZ domains were
concentrated by ultrafiltration through a 3 kDa Amicon Ultracentrifugal Filter Unit (EMD Millipore,
catalog no. UFC 900396). The PDZ peptide ligands were removed from PDZ domains by dialysis into
storage buffer (50 mM HEPES, pH 7.5; 100 mM NaCl, 5 mM TCEP, 1 mM PMSF, and Complete
EDTA-free protease inhibitor). Purified PDZ domains (>99% pure; 45–610 mM; Figure 1) were flash-
frozen in liquid nitrogen, and stored at -80˚C.
SDS-PAGE, immunoblotting and assessment of protein purity and yieldWe used SDS-PAGE to determine purity of proteins and to quantify binding to PDZ domain resin.
Protein samples were diluted 1:3 into 3x Laemmli buffer (100 mM Tris HCl, pH 6.8; 2.1% SDS, 26%
glycerol, 7.5% b-mercaptoethanol, and 0.01% bromophenol blue) and heated to 95˚C for 3 min
before fractionation on 8% SDS-PAGE gels at 165 V in 25 mM Tris base, 192 mM glycine, 0.1% SDS.
Proteins were stained with Gel Code Blue (Thermo Scientific, catalog no. 24592), imaged on a Li-Cor
Odyssey Classic Infrared Imaging System (Li-Cor Biosciences, Lincoln, NE) at 700 nm, and quantified
with Licor Image Studio Software (v4.0.21) against standard curves of BSA (catalog no. A7517-1VL)
and lysozyme (catalog no. L4631-1VL) purchased from Sigma-Aldrich, St. Louis, MO. The protein
standards were loaded onto each gel in lanes adjacent to the protein samples. Molecular weights of
stained proteins were verified by comparison to Precision Plus Protein All Blue Standards (BioRad,
Irvine, CA; catalog no. 161–0373).
For immunoblotting, proteins fractionated by SDS-PAGE were electrically transferred to low fluo-
rescence PVDF membranes (Thermo Scientific, catalog no. 22860) in 25 mM Tris, 200 mM glycine,
and 20% methanol. Membranes were washed with 50 mM Tris-HCl, pH 7.6; 150 mM NaCl (TBS) fol-
lowed by blocking with Odyssey Blocking Buffer (Li-Cor Biosciences, catalog no. 927–50000). Mem-
branes were washed in TBS supplemented with 0.1% Tween 20 (TBS-T) before incubation in
Odyssey Blocking Buffer containing 1:1000 diluted rabbit anti-synGAP (ThermoFisher Pierce, Wal-
tham, MA catalog no. PA1-046) or 1:1500 BSA-free anti-TetraHis (Qiagen, Hilden, Germany, catalog
no. 34670). Bound antibodies were detected with 1:10,000 goat anti-mouse Alexa-Fluor 680 (Life
Technologies, catalog no. A-21057) or 1:10,000 goat anti-rabbit Alexa-Fluor 680 (Life Technologies,
Carlsbad, CA; catalog no. A-21109) visualized with a Li-Cor Odyssey Classic Infrared Imaging System
and quantified with Li-Cor Image Studio Software.
Synthesis of PDZ domain affinity resinsPDZ domain affinity resins (PDZ1, residues 61–151; PDZ2, residues 155–249; PDZ3, residues 302–
402; PDZ12, residues 61–249; PDZ123, residues 61–402 from murine PSD-95) were prepared by the
HaloTag-HaloLink method as previously described (Walkup and Kennedy, 2014, 2015). Briefly, bac-
terial cell pellets containing PDZ domain-HaloTag fusion proteins were resuspended in 10 ml/g of
Purification Buffer, and lysed by three passes through a ML-110 microfluidizer. The lysate was clari-
fied by centrifugation, added to HaloLink resin (Promega, Madison, WI; catalog no. G1915), and
mixed with continuous agitation for 1.5 hr at 4˚C on an end-over-end mixer. Unbound protein was
separated from the resin by centrifugation and the PDZ-HaloTag-HaloLink resin was resuspended,
transferred to a column, and allowed to settle. The resin was extensively washed and then stored at
4˚C in a buffer supplemented with 0.05% NaN3. The resin was used or discarded within 1 week of
preparation. The densities of PDZ domains on the resin varied from 50 to 100 pmol of PDZ123
domain and from 200 to 500 pmol of PDZ1, PDZ2, PDZ3, or PDZ12 domains per ml resin.
Assay for binding of r-synGAP-a1 to PDZ domain resinPhosphorylated or nonphosphorylated r-synGAP-a1 (500 nM, 200 ml) was mixed with 20 ml of Affinity
Resin containing PDZ1, PDZ2, PDZ3, PDZ12, or PDZ123 domains, pre-equilibrated with Binding/
Wash Buffer (25 mM Tris, pH 7.0; 150 mM NaCl, 1 mM MgCl2, 0.5 mM TCEP, 0.2% Tergitol,
0.5 mM EDTA) in a cellulose acetate spin cup (ThermoFisher Pierce, catalog no. 69702) for 60 min
on an end-over-end mixer. In some experiments, 2.5 mM CaM and 0.5 mM CaCl2 were included to
test the effect of binding of Ca2+/CaM to r-synGAP-a1 on synGAP’s affinity for PDZ domains. After
Walkup et al. eLife 2016;5:e16813. DOI: 10.7554/eLife.16813 23 of 31
Research article Biochemistry Neuroscience
the incubation, the resin in the spin cup was centrifuged for 2 min at 1500 x g to remove unbound
protein, and the resin was washed 4 times with 200 ml of Binding/Wash Buffer. To elute bound pro-
tein, 100 ml of 1x Laemmli Buffer was added and the resin was incubated for 5 min at room tempera-
ture. The eluted protein was collected by centrifugation at 6000 x g for 2 min, fractionated by SDS-
PAGE, stained with Gel Code Blue, and quantified on a Li-Cor Classic as described above. Inte-
grated intensities reflecting the amount of bound r-synGAP-a1 were determined with Li-Cor soft-
ware and plotted with Prism (v6.0d, GraphPad Software, La Jolla CA). There is no detectable non-
specific binding of r-synGAP-a1 to unsubstituted resin or of proteins lacking PDZ domain ligands to
the affinity resins (Walkup and Kennedy, 2014).
Phosphorylation of r-synGAP-a1 by CaMKII, CDK5 and PLK2 for PDZbinding assaysPhosphorylation of r-synGAP-a1 by CaMKII, CDK5, and PLK2 was carried out immediately prior to
PDZ binding assays, as previously described (Walkup et al., 2015). Reaction mixtures contained
50 mM Tris-HCl, pH 8.0; 10 mM MgCl2, 0 or 0.7 mM CaCl2, 0.4 mM EGTA, 30 mM ATP, 0 or
3.38 mM calmodulin, 10 mM DTT, 725 nM r-synGAP-a1. Reactions contained no kinase, 10 nM CaM-
KII, 230 nM CDK5/p35 (EMD Millipore, catalog no. 14-477M) or 230 nM PLK2 (Life Technologies,
catalog no. PV4204). Mixtures for CDK5 and PLK2 did not contain CaCl2 or CaM. Samples were
quenched by addition of 1/3 volume of 50 mM Tris, pH 8.0; 0.4 M NaCl, 10 mM MgCl2, 0.8% tergi-
tol (Type NP-40), 6 mM autocamtide-2 related inhibitory peptide (Genscript, Piscataway, NJ; catalog
no. RP10271), 90 mM roscovitine (Sigma-Aldrich) and 40 mM EGTA at the indicated times. When we
planned to add Ca2+/CaM during the subsequent incubation with resin, the EGTA was omitted.
Samples were stored on ice until their use in PDZ domain binding assays.
Stoichiometry and rate of phosphorylation of r-synGAP-a1 and histoneH1 by CaMKII and/or CDK5Phosphorylation of 725 nM r-synGAP-a1 by 10 nM CaMKII was carried out as previously described
(Walkup et al., 2015) in reaction mixtures containing 50 mM Tris-HCl, pH 8.0, 10 mM MgCl2, 0 or
0.7 mM CaCl2, 0.4 mM EGTA, 500 mM [g-32P]-ATP (375 cpm/pmol) (6000 Ci/mmol, Perkin Elmer,
Waltham, MA; catalog no. BLU002Z/NEG002Z), 0 or 3.4 mM calmodulin, 10 mM DTT. Phosphoryla-
tion of 286 nM r-synGAP-a1 and 4.3 mM Histone H1 (New England Biolabs, Ipswich, MA; catalog no.
M2501S), by CDK5/p35 (EMD Millipore, catalog no. 14-477M) or CDK5/p25 (EMD Millipore, catalog
no. 14–516) was carried out in the same reaction mixture containing 110 nM CDK5/p35 or CDK5/
p25 but no CaMKII. After fractionation by SDS-PAGE, phosphorylated proteins were quantified with
a Typhoon LA 9000 phosphorimager (GE Healthcare Life Sciences, Pittsburgh, PA) as previously
described (Walkup et al., 2015). Relative densities were converted to pmol phosphate by compari-
son to densities of standard amounts of [g-32P]-ATP. The stoichiometry of phosphorylation was calcu-
lated by dividing mol of incorporated phosphate by mol of r-synGAP-a1 loaded per lane.
Measurement of affinity of r-synGAP-a1 for PDZ domains by surfaceplasmon resonance (SPR)We used a ’competition in solution’ method (also called ’affinity in solution’) (Nieba et al., 1996;
Lazar et al., 2006; Abdiche et al., 2008) to measure the affinity of r-synGAP-a1 for PDZ domains.
In this method, PDZ domains are immobilized on the chip surface and used to capture and measure
the concentration of free r-synGAP-a1 in pre-equilibrated mixtures of a constant amount of r-syn-
GAP-a1 with varying amounts of soluble recombinant PDZ domains. Experiments were performed
on a Biacore T200 (GE Healthcare Life Sciences). Purified PDZ domains (PDZ1, PDZ2, PDZ3, PDZ12,
PDZ123 from PSD-95) were coupled to Series S CM5 Sensor Chips (GE Healthcare Life Sciences, cat-
alog no. BR-1005-30) by the amine coupling protocol specified in the Biacore T200 Control Software
with reagents purchased from GE Healthcare Life Sciences. Sensor surfaces were activated by apply-
ing a 1:1 mixture of 50 mM N-hydroxysuccinimide (NHS): 200 mM 1-ethyl-3-(3-dimethylaminopropyl)
carbodiimide hydrochloride (EDC) provided in the Biacore Amine Coupling Kit (GE Healthcare Life
Sciences, catalog no. BR-1000-50) dissolved in HBS-N running buffer (degassed 0.01 M HEPES pH
7.4, 0.15 M NaCl) (GE Healthcare Life Sciences, catalog no. BR-1006-70). PDZ domains were diluted
to 0.1–5 mM in Biacore Sodium Acetate Buffer [10 mM sodium acetate, pH 4.0 (GE Healthcare Life
Walkup et al. eLife 2016;5:e16813. DOI: 10.7554/eLife.16813 24 of 31
Research article Biochemistry Neuroscience

Sciences, catalog no. BR-1003-49) for PDZ1 and PDZ3; pH 4.5 for PDZ2; pH 5 for PDZ12 and
PDZ123]. PDZ domains were injected into flow cells 2 and 4 until 200 to 400 RU (resonance units) of
PDZ domain were immobilized. Flow cells 1 and 3 were left blank to be used as reference surfaces.
Ethanolamine (1 M, pH 8.5) was injected for 7 min at 10 ml/min to block remaining active sites on all
four flow cells.
A calibration curve was prepared by applying samples of 0 to 50 nM r-synGAP-a1 prepared by
two-fold serial dilution of 50 nM r-synGAP-a1 into 1x HBS-EP+ buffer (degassed 0.01 M HEPES, pH
7.4; 0.15 M NaCl, 3 mM EDTA, 0.005% v/v Surfactant P20; GE Healthcare Life Sciences, catalog no.
BR-1006-69) to the chip and recording the maximum RU for each concentration. Samples for calibra-
tion were incubated for 2 hr at room temperature before randomized injection onto the chip surface
at 25˚C at 10 ml/min for 200 s over all four flow cells. Between each sample injection, the chip was
regenerated by injecting 1 M MgCl2 at 100 ml/min for 60 s, waiting 180 s for the baseline to stabilize,
then injecting a second pulse of MgCl2 solution, waiting 300 s for the baseline to stabilize, and finally
executing a ’carry over control injection’ in which HBS-EP+ buffer is flowed over the chip surface at
40 ml/min for 30 s. Mixtures of r-synGAP-a1 and PDZ domains were prepared by 1:1 dilution of 50
nM r-synGAP-a1 with two-fold serial dilutions of PDZ domains (0–20 mM PDZ1, PDZ2, PDZ3, PDZ12
or 0–160 mM PDZ123) in HBS-EP+ buffer to produce mixtures containing 25 nM r-synGAP-a1 and 0–
10 mM PDZ1, PDZ2, PDZ3, PDZ12 or 0–80 mM PDZ123. For each mixture of r-synGAP-a1 and PDZ
domain, the different concentrations were injected randomly and a series of sensorgrams were
recorded as described for the calibration curve.
Sensorgrams were processed with Biacore T200 Evaluation Software, (ver. 3.0, GE Healthcare Life
Sciences). The y-axes were zeroed at the baseline for each cycle and x-axes were aligned at the
injection start. Bulk refractive index changes and systematic deviations in sensorgrams were removed
by subtracting the responses in reference flow cells corresponding to the sample flow cells (e.g. 2–1,
4–3). The averaged sensorgrams for 0 nM r-synGAP-a1 were then subtracted from sensorgrams for
all other concentrations. The concentrations of free r-synGAP-a1 in each mixture with PDZ domains
was determined from the calibration curve, exported into Prism, and plotted against the log of PDZ
domain concentration. The curve was fit to the equation:
synGAPfree ¼ðsynGAPtot �PDZtot �KDÞ
2�
ffiffiffiffiffiffiffiffiffiffiffiffiffiffiffiffiffiffiffiffiffiffiffiffiffiffiffiffiffiffiffiffiffiffiffiffiffiffiffiffiffiffiffiffiffiffiffiffiffiffiffiffiffiffiffi
ðPDZtot þ synGAPtot þKDÞ2
4
s
�ðPDZtot � synGAPtotÞ
This equation (from the Biacore T200 Software Handbook) assumes the existence of a single bind-
ing site between PDZ domain and r-synGAP-a1. Equilibrium dissociation constants (KD) for binding
to PDZ1, PDZ2, and PDZ3 were determined from the best fit curves as described in the Biacore
T200 Software Handbook (p. 210). The experimental curves deviated slightly from the equation at
higher concentrations of soluble PDZ domain because of a low affinity association between PDZ
domains bound to the chip and soluble free PDZ domains. The deviation is most obvious for phos-
phorylated r-synGAP-a1 which has a relatively low affinity for PDZ123. We determined that these
deviations had only a small effect (<~5%) on the calculated KD’s by comparing KD’s after fitting the
curves including or excluding points for high concentrations of PDZs at which the r-synGAP-a1 con-
centration appeared to plateau above zero. PDZ12 and PDZ123 contain more than a single PDZ
domain binding site. It is not possible to derive a unique equation incorporating two or three bind-
ing sites when the affinities of the multiple sites are similar. Therefore, single ’apparent’ equilibrium
dissociation constants (KDapp) were determined by obtaining the best fit of the data with the equa-
tion for a single binding site.
Binding of r-synGAP-a1 to CaM-SepharoseRosetta2(DE3) cells containing sr-synGAP or r-synGAP-a1 were lysed in Lysis buffer as described in
Walkup et al. (2015) except that the buffer contained 200 mM NaCl, 0 or 5 mM CaCl2, and 0 or
10 mM EGTA. The resuspended cells were lysed by sonication with a Digital Sonifier 450 Cell Disrup-
tor (Branson, Wilmington, NC) for two passes at 90 s/pass (15% power, 1.0 s on, 1.5 s off), and insol-
uble material was removed by centrifugation at 16,000 � g for 40 min at 4˚C. Clarified cell lysate
(1.7 ml) containing sr-synGAP or r-synGAP-a1 (~6 mg/ml total protein) was incubated with end-over-
end mixing for 60 min with 0.3 ml CaM-Sepharose 4B (GE Healthcare Life Sciences, catalog no. 17-
0529-01) or control Sepharose 4B (GE Healthcare Life Sciences, catalog no. 17-0120-01). The resin
Walkup et al. eLife 2016;5:e16813. DOI: 10.7554/eLife.16813 25 of 31
Research article Biochemistry Neuroscience

was pipetted into a BioSpin column (Bio-Rad, catalog no. 732–6008) and washed with 12 ml (40 col-
umn volumes) of Lysis/Wash Buffer. Bound protein was eluted with 1.2 ml (4 column volumes) of
Lysis/Wash Buffer containing 100 mM EGTA. Eluted proteins (30 ml aliquot) were resolved by SDS-
PAGE and transferred to a PVDF membrane which was probed with anti-synGAP or BSA-free anti-
TetraHis as described above.
Measurement of affinity of CaM for r-synGAP-a1 by SPRDirect binding of r-synGAP-a1 to Ca2+/CaM immobilized on a chip was assayed on a Biacore T200
with a Series S Sensor Chip CM5. CaM (Enzo Life Sciences, Farmingdale, NY; catalog no. BML-
SE325-0001) was coupled to the chip by the amine coupling protocol specified in the Biacore T200
Control Software, as described above. Purified, lyophilized CaM (250 mg) was resuspended in water
and exchanged into Biacore Sodium Acetate, pH 4.0 Buffer (10 mM sodium acetate, pH 4.0) with an
Amicon Ultra-0.5 ml centrifugal filter with a 3 kDa molecular weight cutoff (EMD Millipore, catalog
no. UFC500396). CaM was further diluted to 0.5 nM in 10 mM Sodium Acetate, pH 4.0, and injected
into flow cells 2 and 4 until 50 RU of CaM were immobilized (~7 min at a flow rate of 10 ml/min).
Flow cells 1 and 3 were left blank to be used as reference surfaces. Ethanolamine (1 M, pH 8.5) was
injected for 7 min at 10 ml/min to block remaining active sites on all four flow cells. R-synGAP-a1 (0
nM to 75 nM) in 1x HBS-EP+ running buffer supplemented with 10 mM CaCl2, was injected in tripli-
cate at 25˚C at 100 ml/min for 75 s over all four flow cells. Different concentrations of r-synGAP-a1
were applied in randomized order. After injection ended, dissociation was monitored in each flow
cell for 500 s. Regeneration of the sensor chip was performed by injecting 50 mM NaOH (GE Health-
care Life Sciences, catalog no. BR-1003-58) at 100 ml/min for 30 s, waiting 180 s for the baseline to
stabilize, then injecting a second pulse of NaOH, waiting 240 s for the baseline to stabilize, and
finally executing a ’carry over control injection.’ Sensorgrams were processed using the Biacore T200
Evaluation Software, version 3.0, as described above. Resonance units of bound r-synGAP-a1 at
equilibrium were exported into Prism and plotted against the concentrations of r-synGAP-a1. The
data were fit globally to a hyperbolic curve by nonlinear regression to determine equilibrium dissoci-
ation constants (KD).
Determination of affinity of Ca2+/CaM for sr-synGAP and r-synGAP-a1by equilibrium binding to CaM-SepharosePurified sr-synGAP and r-synGAP-a1 were diluted to 1 to 500 nM in Binding/Wash Buffer (50 mM
Tris, pH 7.5; 200 mM NaCl, 5 mM TCEP, 2 mM CaCl2). Aliquots of diluted r-synGAP-a1 (300 ml)
were incubated with end-over-end mixing for 60 min with 50 ml of CaM-Sepharose 4B in a screw cap
spin column (Thermo Scientific, catalog no. 69705). Concentrations of sr-synGAP and r-synGAP-a1
were 20–3,000 fold below the ligand binding capacity of the CaM-Sepharose resin. Unbound protein
was removed by centrifugation at 4000 x g for 30 s. Beads were washed in Binding/Wash Buffer
(250 ml, 5 volumes), and bound protein was eluted with 50 ml of 1x Laemmli buffer with 10% b-mer-
captoethanol. Eluted proteins were fractionated by SDS-PAGE and transferred to a PVDF membrane
as described above. Blots were probed with 1:1000 anti-synGAP or 1:1500 BSA-free anti-TetraHis
anti-bodies and quantified on a Li-Cor Classic as described above. Integrated intensities reflecting
the amount of bound r-synGAP-a1 were determined with Li-Cor software and plotted against the
corresponding concentrations of r-synGAP-a1 with Prism software. The data were fit to a hyperbolic
curve by nonlinear regression to determine the dissociation constant (KD).
Preparation of PSD fractionsSyngap+/- mice were bred from a knockout strain created in our lab (Vazquez et al., 2004). The
mutant strain has been deposited in the Mutant Mouse Resource & Research Center at University of
California, Davis, listed as MMRRC:037374-UCD. All procedures were approved by the Caltech Insti-
tute Animal Care and Use Committee. PSD fractions were prepared as previously described
(Cho et al., 1992) from six wt and six Syngap+/- mouse litter mates matched by age (7–12 weeks),
and sex (wt, 1 female, 5 males; Syngap+/-, 2 female, 4 male). The mice were killed by cervical disloca-
tion and forebrains were dissected and rinsed in Buffer A (0.32 M sucrose, 1 mM NaHCO3, 1 mM
MgCl2, 0.5 mM CaCl2, 0.1 mM PMSF, 1 mg/l leupeptin). Forebrains from each set of six mice were
pooled and homogenized with 12 up and down strokes at 900 rpm in 14 ml Buffer A. Homogenates
Walkup et al. eLife 2016;5:e16813. DOI: 10.7554/eLife.16813 26 of 31
Research article Biochemistry Neuroscience
were diluted to 35 ml in Buffer A and centrifuged at 1400 � g for 10 min. The pellet was resus-
pended in 35 ml Buffer A, homogenized (3 strokes), and centrifuged at 710 g for 10 min. Superna-
tants from the two centrifugations were combined and centrifuged at 13,800 g for 10 min. The
pellet was resuspended in 8 ml of Buffer B (0.32 M sucrose, 1 mM NaH2CO3), homogenized with 6
strokes and layered onto a sucrose gradient (10 ml each of 0.85 M, 1.0 M, and 1.2 M sucrose in
1 mM NaH2CO3 buffer). The gradient was centrifuged for 2 hr at 82,500 g in a swinging bucket
rotor. The synaptosome-enriched layer at the interface of 1.0 and 1.2 M sucrose was collected,
diluted to 15 ml with Solution B and added to an equal volume of Buffer B containing 1% Triton.
The mixture was stirred for 15 min at 4˚C and centrifuged for 45 min at 36,800 g. The pellet contain-
ing the PSD-enriched, Triton-insoluble fraction was resuspended in 800–1000 ml of 40 mM Tris pH 8
with a 21 gauge needle and 1 ml syringe, and further solubilized by hand in a teflon glass homoge-
nizer. Samples were aliquoted and stored at �80˚C.
Quantification of proteins in PSD fractionsEqual amounts of protein from each PSD sample (5–15 mg) were dissolved in SDS-PAGE sample
buffer (33 mM Tris HCl, pH 6.8; 0.7% SDS, 10% glycerol, 2.5% b-mercaptoethanol, and 0.003% bro-
mophenol blue), heated at 90˚C for 5 min, fractionated on polyacrylamide gels (8% or 10%), and
electrically transferred to PVDF membranes in 25 mM Tris, 150 mM glycine, 2% methanol at 250V
for 2.5 hr at 4˚C, as described above. Membranes were blocked with Odyssey blocking buffer (Licor
Biosciences) and then incubated in a primary antibody solution of 5% BSA in TBS-T overnight at 4C,
as described above. Primary antibodies included mouse-anti-PSD-95 (ThermoFisher, catalog no.
MA1-046 [clone 7E3-1B8], RRID AB_2092361, dilution 1:10,000), rabbit-anti-SynGAP (Pierce, catalog
no. PA1-046, RRID AB_2287112, dilution 1:3500), rabbit-anti-TARP (V-2,3,4, and 8; EDM Millipore,
catalog no. Ab9876, RRID AB_877307, dilution 1:300), rabbit-anti-LRRTM2 (Pierce, catalog no.
PA521097, RRID AB_11153649, dilution 1:3000), mouse-anti-neuroligin-1 (Sigma, catalog no.
sab5201464, RRID AB_2570548, dilution 1:250), and rabbit-anti-neuroligin-2 (Synaptic Systems, Got-
tingen, Germany, catalog no. 129202, RRID AB_993011, dilution 1:1000). The membranes were then
washed 3-times in TBS-T. The membrane was incubated with secondary antibodies (Alexa Fluor 680-
goat-anti-mouse IgG (Life Technologies, catalog no. A21057; 1:10,000) or IRDye800-goat-anti-rabbit
IgG (Rockland, Limerick, PA; catalog no. 611-132-122; 1:10,000) for 45 min at room temperature in
5% nonfat milk in TBS-T, then washed 3 times in TBS-T, then twice in TBS prior to scanning. For
most experiments, each blot contained 6 duplicate samples of PSD fractions from wt and the same
number from Syngap+/- mice. Each blot was incubated with a mixture of two primary antibodies;
mouse-anti-PSD-95 and the antibody against neuroligin-1, neuroligin-2, TARPs, LRRTM2, or synGAP.
Then the blots were incubated with a mixture of the appropriate secondary antibodies. For measure-
ment of neuroligin-1, both PSD-95 and neuroligin-1 were detected by the same goat anti-mouse sec-
ondary; the bands were physically separated on the gel and were quantified independently. Bound
antibodies were visualized in the appropriate fluorescent channels with an Odyssey Classic Infared
Imaging System (Li-Cor Biosciences).
Before running samples for quantification, we determined the amount of PSD sample that would
result in signals for each protein that were strong enough for measurement and not saturated. To
quantify the densities of the bands, each visual image was first set to high brightness in order to cap-
ture the boundaries of the signals for each band. The images were then used as a template in Li-Cor
software to draw rectangular regions of interest around protein bands, and around identically sized
background regions in the same lane. Background densities were subtracted from each protein sig-
nal. The digital data read by the Li-Cor software is unchanged by the visualization settings and is lin-
ear over several orders of magnitude. For each lane, the ratio of the integrated density of each of
the five proteins to the integrated density of PSD-95 was calculated. For three gels, one outlier mea-
surement (defined as greater than 2 times the standard deviation of the mean [S.E.]) was excluded
from the calculation. The mean and S.E of the ratios were determined for wt and Syngap+/- PSD frac-
tions. The means were compared by t-tests performed with Prism software as indicated in the leg-
end of Figure 11. The effect size was measured by Cohen’s d (ratio of the difference in the mean to
the pooled standard deviations of the measurements). Cohen’s d between 0.5 and 0.8 is generally
considered a ’medium’ effect size, greater than 0.8 is generally considered a large effect size. For
four of the proteins, the number of measurements was sufficient to determine a significant difference
Walkup et al. eLife 2016;5:e16813. DOI: 10.7554/eLife.16813 27 of 31
Research article Biochemistry Neuroscience
between wt and Syngap+/-. In the case of neuroligin-1, the means were identical after 24 individual
measurements of each sample.
AcknowledgementsThis work was supported in part by grants from the Gordon and Betty Moore Foundation (Center
for Integrative Study of Cell Regulation), the Hicks Foundation for Alzheimer’s Research, the Allen
and Lenabelle Davis Foundation, and from National Institutes of Health Grant MH095095 to MBK.
WGW IV was supported by the National Science Foundation Graduate Research Fellowship under
Grant No. 2006019582, and the National Institutes of Health under Grant No. NIH/NRSA 5 T32
GM07616. The Protein Expression Center is supported by the Beckman Institute.
Additional information
Competing interests
MBK: Reviewing editor, eLife. The other authors declare that no competing interests exist.
Funding
Funder Grant reference number Author
National Science Foundation 2006019582 Ward G Walkup IV
National Institutes of Health NRSA T32 GM07616 Ward G Walkup IV
Gordon and Betty MooreFoundation
Center for Integrative Studyof Cell Regulation
Mary B Kennedy
Hicks Foundation Mary B Kennedy
Allen and Lenabelle DavisFoundation
Endowed Chair Mary B Kennedy
National Institutes of Health MH095095 Mary B Kennedy
The Beckman Institute Protein Expression Center Jost Vielmetter
The funders had no role in study design, data collection and interpretation, or the decision tosubmit the work for publication.
Author contributions
WGW, TLM, Conception and design, Acquisition of data, Analysis and interpretation of data, Draft-
ing or revising the article; LTS, RH, AI, MR, BDB, Acquisition of data, Analysis and interpretation of
data; JV, Conception and design, Acquisition of data, Analysis and interpretation of data; MBK, Con-
ception and design, Analysis and interpretation of data, Drafting or revising the article
Author ORCIDs
Mary B Kennedy, http://orcid.org/0000-0003-1369-0525
Ethics
Animal experimentation: This study was performed in strict accordance with the recommendations
in the Guide for the Care and Use of Laboratory Animals of the National Institutes of Health. All of
the animals were handled according to approved institutional animal care and use committee
(IACUC) protocol (#1034-15G) of the California Institute of Technology.
ReferencesAbdiche YN, Malashock DS, Pons J. 2008. Probing the binding mechanism and affinity of tanezumab, arecombinant humanized anti-NGF monoclonal antibody, using a repertoire of biosensors. Protein Science 17:1326–1335. doi: 10.1110/ps.035402.108
Araki Y, Zeng M, Zhang M, Huganir RL. 2015. Rapid dispersion of SynGAP from synaptic spines triggers AMPAreceptor insertion and spine enlargement during LTP. Neuron 85:173–189. doi: 10.1016/j.neuron.2014.12.023
Walkup et al. eLife 2016;5:e16813. DOI: 10.7554/eLife.16813 28 of 31
Research article Biochemistry Neuroscience
Barnett MW, Watson RF, Vitalis T, Porter K, Komiyama NH, Stoney PN, Gillingwater TH, Grant SG, Kind PC.2006. Synaptic Ras GTPase activating protein regulates pattern formation in the trigeminal system of mice.Journal of Neuroscience 26:1355–1365. doi: 10.1523/JNEUROSCI.3164-05.2006
Berryer MH, Hamdan FF, Klitten LL, Møller RS, Carmant L, Schwartzentruber J, Patry L, Dobrzeniecka S,Rochefort D, Neugnot-Cerioli M, Lacaille JC, Niu Z, Eng CM, Yang Y, Palardy S, Belhumeur C, Rouleau GA,Tommerup N, Immken L, Beauchamp MH, et al. 2013. Mutations in SYNGAP1 cause intellectual disability,autism, and a specific form of epilepsy by inducing haploinsufficiency. Human Mutation 34:385–394. doi: 10.1002/humu.22248
Bredt DS, Nicoll RA. 2003. AMPA receptor trafficking at excitatory synapses. Neuron 40:361–379. doi: 10.1016/S0896-6273(03)00640-8
Carlisle HJ, Manzerra P, Marcora E, Kennedy MB. 2008. SynGAP regulates steady-state and activity-dependentphosphorylation of cofilin. Journal of Neuroscience 28:13673–13683. doi: 10.1523/JNEUROSCI.4695-08.2008
Chen HJ, Rojas-Soto M, Oguni A, Kennedy MB. 1998. A synaptic Ras-GTPase activating protein (p135 SynGAP)inhibited by CaM kinase II. Neuron 20:895–904. doi: 10.1016/S0896-6273(00)80471-7
Chen X, Vinade L, Leapman RD, Petersen JD, Nakagawa T, Phillips TM, Sheng M, Reese TS. 2005. Mass of thepostsynaptic density and enumeration of three key molecules. PNAS 102:11551–11556. doi: 10.1073/pnas.0505359102
Cheng D, Hoogenraad CC, Rush J, Ramm E, Schlager MA, Duong DM, Xu P, Wijayawardana SR, Hanfelt J,Nakagawa T, Sheng M, Peng J. 2006. Relative and absolute quantification of postsynaptic density proteomeisolated from rat forebrain and cerebellum. Molecular & Cellular Proteomics 5:1158–1170. doi: 10.1074/mcp.D500009-MCP200
Cho KO, Hunt CA, Kennedy MB. 1992. The rat brain postsynaptic density fraction contains a homolog of theDrosophila discs-large tumor suppressor protein. Neuron 9:929–942. doi: 10.1016/0896-6273(92)90245-9
Clement JP, Aceti M, Creson TK, Ozkan ED, Shi Y, Reish NJ, Almonte AG, Miller BH, Wiltgen BJ, Miller CA, XuX, Rumbaugh G. 2012. Pathogenic SYNGAP1 mutations impair cognitive development by disruptingmaturation of dendritic spine synapses. Cell 151:709–723. doi: 10.1016/j.cell.2012.08.045
Clement JP, Ozkan ED, Aceti M, Miller CA, Rumbaugh G. 2013. SYNGAP1 links the maturation rate of excitatorysynapses to the duration of critical-period synaptic plasticity. Journal of Neuroscience 33:10447–10452. doi: 10.1523/JNEUROSCI.0765-13.2013
Cohen P, Klee CB. 1988. Calmodulin. Amsterdam, New York, N.Y: ElsevierCui H, Hayashi A, Sun HS, Belmares MP, Cobey C, Phan T, Schweizer J, Salter MW, Wang YT, Tasker RA, GarmanD, Rabinowitz J, Lu PS, Tymianski M. 2007. PDZ protein interactions underlying NMDA receptor-mediatedexcitotoxicity and neuroprotection by PSD-95 inhibitors. Journal of Neuroscience 27:9901–9915. doi: 10.1523/JNEUROSCI.1464-07.2007
de Wit J, Sylwestrak E, O’Sullivan ML, Otto S, Tiglio K, Savas JN, Yates JR, Comoletti D, Taylor P, Ghosh A.2009. LRRTM2 interacts with Neurexin1 and regulates excitatory synapse formation. Neuron 64:799–806. doi:10.1016/j.neuron.2009.12.019
Dosemeci A, Makusky AJ, Jankowska-Stephens E, Yang X, Slotta DJ, Markey SP. 2007. Composition of thesynaptic PSD-95 complex. Molecular & Cellular Proteomics 6:1749–1760. doi: 10.1074/mcp.M700040-MCP200
Gray NW, Weimer RM, Bureau I, Svoboda K. 2006. Rapid redistribution of synaptic PSD-95 in the neocortex invivo. PLoS Biology 4:e370. doi: 10.1371/journal.pbio.0040370
Hamdan FF, Daoud H, Piton A, Gauthier J, Dobrzeniecka S, Krebs MO, Joober R, Lacaille JC, Nadeau A,Milunsky JM, Wang Z, Carmant L, Mottron L, Beauchamp MH, Rouleau GA, Michaud JL. 2011. De novoSYNGAP1 mutations in nonsyndromic intellectual disability and autism. Biological Psychiatry 69:898–901. doi:10.1016/j.biopsych.2010.11.015
Hayashi Y, Shi SH, Esteban JA, Piccini A, Poncer JC, Malinow R. 2000. Driving AMPA receptors into synapses byLTP and CaMKII: requirement for GluR1 and PDZ domain interaction. Science 287:2262–2267. doi: 10.1126/science.287.5461.2262
He L, Hou Z, Qi RZ. 2008. Calmodulin binding and Cdk5 phosphorylation of p35 regulate its effect onmicrotubules. Journal of Biological Chemistry 283:13252–13260. doi: 10.1074/jbc.M706937200
Hell JW. 2014. CaMKII: claiming center stage in postsynaptic function and organization. Neuron 81:249–265. doi:10.1016/j.neuron.2013.12.024
Holt LJ, Tuch BB, Villen J, Johnson AD, Gygi SP, Morgan DO. 2009. Global analysis of Cdk1 substratephosphorylation sites provides insights into evolution. Science 325:1682–1686. doi: 10.1126/science.1172867
Hubbard MJ, Klee CB. 1987. Calmodulin binding by calcineurin. Ligand-induced renaturation of proteinimmobilized on nitrocellulose. The Journal of Biological Chemistry 262:15062–15070.
Hudmon A, Schulman H. 2002. Neuronal CA2+/calmodulin-dependent protein kinase II: the role of structure andautoregulation in cellular function. Annual Review of Biochemistry 71:473–510. doi: 10.1146/annurev.biochem.71.110601.135410
Kennedy MB. 2000. Signal-processing machines at the postsynaptic density. Science 290:750–754. doi: 10.1126/science.290.5492.750
Kennedy MB. 2016. Synaptic Signaling in Learning and Memory. Cold Spring Harbor Perspectives in Biology 8:a016824. doi: 10.1101/cshperspect.a016824
Kim JH, Lee HK, Takamiya K, Huganir RL. 2003. The role of synaptic GTPase-activating protein in neuronaldevelopment and synaptic plasticity. Journal of Neuroscience 23:1119–1124.
Walkup et al. eLife 2016;5:e16813. DOI: 10.7554/eLife.16813 29 of 31
Research article Biochemistry Neuroscience

Kim JH, Liao D, Lau LF, Huganir RL. 1998. SynGAP: a synaptic RasGAP that associates with the PSD-95/SAP90protein family. Neuron 20:683–691. doi: 10.1016/S0896-6273(00)81008-9
Komiyama NH, Watabe AM, Carlisle HJ, Porter K, Charlesworth P, Monti J, Strathdee DJ, O’Carroll CM, MartinSJ, Morris RG, O’Dell TJ, Grant SG. 2002. SynGAP regulates ERK/MAPK signaling, synaptic plasticity, andlearning in the complex with postsynaptic density 95 and NMDA receptor. Journal of Neuroscience 22:9721–9732.
Kornau HC, Schenker LT, Kennedy MB, Seeburg PH. 1995. Domain interaction between NMDA receptorsubunits and the postsynaptic density protein PSD-95. Science 269:1737–1740. doi: 10.1126/science.7569905
Kurakin A, Swistowski A, Wu SC, Bredesen DE. 2007. The PDZ domain as a complex adaptive system. PLoS One2:e953. doi: 10.1371/journal.pone.0000953
Lazar GA, Dang W, Karki S, Vafa O, Peng JS, Hyun L, Chan C, Chung HS, Eivazi A, Yoder SC, Vielmetter J,Carmichael DF, Hayes RJ, Dahiyat BI. 2006. Engineered antibody Fc variants with enhanced effector function.PNAS 103:4005–4010. doi: 10.1073/pnas.0508123103
Lee KJ, Lee Y, Rozeboom A, Lee JY, Udagawa N, Hoe HS, Pak DT. 2011. Requirement for Plk2 in orchestratedras and rap signaling, homeostatic structural plasticity, and memory. Neuron 69:957–973. doi: 10.1016/j.neuron.2011.02.004
Levinson JN, Chery N, Huang K, Wong TP, Gerrow K, Kang R, Prange O, Wang YT, El-Husseini A. 2005.Neuroligins mediate excitatory and inhibitory synapse formation: involvement of PSD-95 and neurexin-1beta inneuroligin-induced synaptic specificity. The Journal of Biological Chemistry 280:17312–17319. doi: 10.1074/jbc.M413812200
Levinson JN, Li R, Kang R, Moukhles H, El-Husseini A, Bamji SX, Li R KR. 2010. Postsynaptic scaffoldingmolecules modulate the localization of neuroligins. Neuroscience 165:782–793. doi: 10.1016/j.neuroscience.2009.11.016
Li W, Okano A, Tian QB, Nakayama K, Furihata T, Nawa H, Suzuki T, Li W OA. 2001. Characterization of a novelsynGAP isoform, synGAP-beta. The Journal of Biological Chemistry 276:21417–21424. doi: 10.1074/jbc.M010744200
Lim IA, Hall DD, Hell JW. 2002. Selectivity and promiscuity of the first and second PDZ domains of PSD-95 andsynapse-associated protein 102. Journal of Biological Chemistry 277:21697–21711. doi: 10.1074/jbc.M112339200
Linhoff MW, Lauren J, Cassidy RM, Dobie FA, Takahashi H, Nygaard HB, Airaksinen MS, Strittmatter SM, CraigAM. 2009. An unbiased expression screen for synaptogenic proteins identifies the LRRTM protein family assynaptic organizers. Neuron 61:734–749. doi: 10.1016/j.neuron.2009.01.017
Makino H, Malinow R. 2009. AMPA receptor incorporation into synapses during LTP: the role of lateralmovement and exocytosis. Neuron 64:381–390. doi: 10.1016/j.neuron.2009.08.035
Markram H, Roth A, Helmchen F. 1998. Competitive calcium binding: implications for dendritic calciumsignaling. Journal of Computational Neuroscience 5:331–348 . doi: 10.1023/A:1008891229546
McMahon AC, Barnett MW, O’Leary TS, Stoney PN, Collins MO, Papadia S, Choudhary JS, Komiyama NH, GrantSG, Hardingham GE, Wyllie DJ, Kind PC. 2012. SynGAP isoforms exert opposing effects on synaptic strength.Nature Communications 3:900. doi: 10.1038/ncomms1900
Meyer T, Hanson PI, Stryer L, Schulman H. 1992. Calmodulin trapping by calcium-calmodulin-dependent proteinkinase. Science 256:1199–1202. doi: 10.1126/science.256.5060.1199
Miller SG, Kennedy MB. 1985. Distinct forebrain and cerebellar isozymes of type II Ca2+/calmodulin-dependentprotein kinase associate differently with the postsynaptic density fraction. The Journal of Biological Chemistry260:9039–9046.
Mruk K, Farley BM, Ritacco AW, Kobertz WR. 2014. Calmodulation meta-analysis: predicting calmodulin bindingvia canonical motif clustering. Journal of General Physiology 144:105–114. doi: 10.1085/jgp.201311140
Myers KR, Wang G, Sheng Y, Conger KK, Casanova JE, Zhu JJ. 2012. Arf6-GEF BRAG1 regulates JNK-mediatedsynaptic removal of GluA1-containing AMPA receptors: a new mechanism for nonsyndromic X-linked mentaldisorder. Journal of Neuroscience 32:11716–11726. doi: 10.1523/JNEUROSCI.1942-12.2012
Nieba L, Krebber A, Pluckthun A. 1996. Competition BIAcore for measuring true affinities: large differences fromvalues determined from binding kinetics. Analytical Biochemistry 234:155–165. doi: 10.1006/abio.1996.0067
Opazo P, Choquet D. 2011. A three-step model for the synaptic recruitment of AMPA receptors. Molecular andCellular Neuroscience 46:1–8. doi: 10.1016/j.mcn.2010.08.014
Opazo P, Labrecque S, Tigaret CM, Frouin A, Wiseman PW, De Koninck P, Choquet D. 2010. CaMKII triggers thediffusional trapping of surface AMPARs through phosphorylation of stargazin. Neuron 67:239–252. doi: 10.1016/j.neuron.2010.06.007
Opazo P, Sainlos M, Choquet D. 2012. Regulation of AMPA receptor surface diffusion by PSD-95 slots. CurrentOpinion in Neurobiology 22:453–460. doi: 10.1016/j.conb.2011.10.010
Pepke S, Kinzer-Ursem T, Mihalas S, Kennedy MB. 2010. A dynamic model of interactions of Ca2+, calmodulin,and catalytic subunits of Ca2+/calmodulin-dependent protein kinase II. PLoS Computational Biology 6:e1000675. doi: 10.1371/journal.pcbi.1000675
Prange O, Wong TP, Gerrow K, Wang YT, El-Husseini A. 2004. A balance between excitatory and inhibitorysynapses is controlled by PSD-95 and neuroligin. PNAS 101:13915–13920. doi: 10.1073/pnas.0405939101
Rumbaugh G, Adams JP, Kim JH, Huganir RL. 2006. SynGAP regulates synaptic strength and mitogen-activatedprotein kinases in cultured neurons. PNAS 103:4344–4351. doi: 10.1073/pnas.0600084103
Sakagami H, Sanda M, Fukaya M, Miyazaki T, Sukegawa J, Yanagisawa T, Suzuki T, Fukunaga K, Watanabe M,Kondo H. 2008. IQ-ArfGEF/BRAG1 is a guanine nucleotide exchange factor for Arf6 that interacts with PSD-95
Walkup et al. eLife 2016;5:e16813. DOI: 10.7554/eLife.16813 30 of 31
Research article Biochemistry Neuroscience

at postsynaptic density of excitatory synapses. Neuroscience Research 60:199–212. doi: 10.1016/j.neures.2007.10.013
Schapitz IU, Behrend B, Pechmann Y, Lappe-Siefke C, Kneussel SJ, Wallace KE, Stempel AV, Buck F, Grant SG,Schweizer M, Schmitz D, Schwarz JR, Holzbaur EL, Kneussel M. 2010. Neuroligin 1 is dynamically exchanged atpostsynaptic sites. Journal of Neuroscience 30:12733–12744. doi: 10.1523/JNEUROSCI.0896-10.2010
Seeburg DP, Feliu-Mojer M, Gaiottino J, Pak DT, Sheng M. 2008. Critical role of CDK5 and Polo-like kinase 2 inhomeostatic synaptic plasticity during elevated activity. Neuron 58:571–583. doi: 10.1016/j.neuron.2008.03.021
Seeburg DP, Pak D, Sheng M. 2005. Polo-like kinases in the nervous system. Oncogene 24:292–298. doi: 10.1038/sj.onc.1208277
Sheng M, Hoogenraad CC. 2007. The postsynaptic architecture of excitatory synapses: a more quantitative view.Annual Review of Biochemistry 76:823–847. doi: 10.1146/annurev.biochem.76.060805.160029
Sheng M, Kim E. 2011. The postsynaptic organization of synapses. Cold Spring Harbor Perspectives in Biology 3:a005678. doi: 10.1101/cshperspect.a005678
Shi S, Hayashi Y, Esteban JA, Malinow R. 2001. Subunit-specific rules governing AMPA receptor trafficking tosynapses in hippocampal pyramidal neurons. Cell 105:331–343. doi: 10.1016/S0092-8674(01)00321-X
Siddiqui TJ, Pancaroglu R, Kang Y, Rooyakkers A, Craig AM. 2010. LRRTMs and neuroligins bind neurexins with adifferential code to cooperate in glutamate synapse development. Journal of Neuroscience 30:7495–7506. doi:10.1523/JNEUROSCI.0470-10.2010
Sjostrom PJ, Nelson SB. 2002. Spike timing, calcium signals and synaptic plasticity. Current Opinion inNeurobiology 12:305–314. doi: 10.1016/S0959-4388(02)00325-2
Sturgill JF, Steiner P, Czervionke BL, Sabatini BL. 2009. Distinct domains within PSD-95 mediate synapticincorporation, stabilization, and activity-dependent trafficking. Journal of Neuroscience 29:12845–12854. doi:10.1523/JNEUROSCI.1841-09.2009
Sugiyama Y, Kawabata I, Sobue K, Okabe S. 2005. Determination of absolute protein numbers in single synapsesby a GFP-based calibration technique. Nature Methods 2:677–684. doi: 10.1038/nmeth783
Tomita S, Stein V, Stocker TJ, Nicoll RA, Bredt DS. 2005. Bidirectional synaptic plasticity regulated byphosphorylation of stargazin-like TARPs. Neuron 45:269–277. doi: 10.1016/j.neuron.2005.01.009
Varoqueaux F, Aramuni G, Rawson RL, Mohrmann R, Missler M, Gottmann K, Zhang W, Sudhof TC, Brose N.2006. Neuroligins determine synapse maturation and function. Neuron 51:741–754. doi: 10.1016/j.neuron.2006.09.003
Varoqueaux F, Jamain S, Brose N. 2004. Neuroligin 2 is exclusively localized to inhibitory synapses. EuropeanJournal of Cell Biology 83:449–456. doi: 10.1078/0171-9335-00410
Vazquez LE, Chen HJ, Sokolova I, Knuesel I, Kennedy MB. 2004. SynGAP regulates spine formation. Journal ofNeuroscience 24:8862–8872. doi: 10.1523/JNEUROSCI.3213-04.2004
Walkup WG, Kennedy MB. 2014. PDZ affinity chromatography: a general method for affinity purification ofproteins based on PDZ domains and their ligands. Protein Expression and Purification 98:46–62. doi: 10.1016/j.pep.2014.02.015
Walkup WG, Washburn L, Sweredoski MJ, Carlisle HJ, Graham RL, Hess S, Kennedy MB. 2015. Phosphorylationof synaptic GTPase-activating protein (synGAP) by Ca2+/calmodulin-dependent protein kinase II (CaMKII) andcyclin-dependent kinase 5 (CDK5) alters the ratio of its GAP activity toward Ras and Rap GTPases. Journal ofBiological Chemistry 290:4908–4927. doi: 10.1074/jbc.M114.614420
Walkup WG, Kennedy MB. 2015. Protein purification using PDZ affinity chromatography. Current Protocols inProtein Scienc 80:9.10.1–9.10.37. doi: 10.1002/0471140864.ps0910s80
Yang Y, Tao-Cheng JH, Bayer KU, Reese TS, Dosemeci A. 2013. CaMKII-mediated phosphorylation regulatesdistributions of SynGAP-alpha1 and -alpha2 at the postsynaptic density. PLoS One 8:e71795. doi: 10.1371/journal.pone.0071795
Zhu JJ, Qin Y, Zhao M, Van Aelst L, Malinow R. 2002. Ras and Rap control AMPA receptor trafficking duringsynaptic plasticity. Cell 110:443–455. doi: 10.1016/S0092-8674(02)00897-8
Walkup et al. eLife 2016;5:e16813. DOI: 10.7554/eLife.16813 31 of 31
Research article Biochemistry Neuroscience